Article

Dynamic Behavior of Ground Improved Using a Crushed Stone Foundation Wall

Department of Civil and Environmental Engineering, Pusan National University, Busan 46241, Korea
*
Author to whom correspondence should be addressed.
Sustainability 2019, 11(10), 2767; https://doi.org/10.3390/su11102767
Submission received: 20 April 2019 / Revised: 4 May 2019 / Accepted: 12 May 2019 / Published: 15 May 2019
(This article belongs to the Special Issue Sustainable Civil Engineering Materials)

Abstract

:
The improvement of soft clay and dredged soils to carry structures is increasingly important. In this study, the dynamic behavior of a crushed stone foundation wall in clay soil was analyzed using a 1g shaking table test. The response accelerations and spectra for three input ground motions were analyzed relative to the distance from the foundation wall, confirming that the acceleration was damped from the outside. The acceleration according to the distance from the wall was not significant under long-period motions, while different responses were obtained under short-period motions. The increased ground stiffness provided by the crushed stone wall lowered the natural period of the ground, and the acceleration amplification under short-period seismic waves was larger than that under long-period waves. Finally, equations were derived to describe the relationship between the acceleration amplification ratio and distance from the wall. The slopes of the proposed equations are larger under shorter periods, implying that the change in acceleration change with distance from the wall is more significant under shorter periods. The results of this study can be used to inform the design of soft soil improvements and the structures built atop them.

1. Introduction

Global demand for the improvement of soft ground containing layers of clay and dredged soil to enable the construction of structures is gradually increasing. Simultaneously, the frequency and magnitude of damage caused by natural disasters such as typhoons, landslides, and earthquakes is also increasing. One of the ways to prevent damage caused by natural disasters is to improve the ground, which can be accomplished using two different approaches: densifying the ground soil layers or introducing additional materials. Methods for increasing the density of the soil include preloading, vertical draining, dynamic compaction, and vibro-floatation. These methods increase the stability of the ground by changing the shear strength and permeability of the soil, and have a particularly large effect when improving granular soils that do not contain much clay. The compaction method in particular is not appropriate for granular soils with significant clay content, while the preloading and vertical drainage methods are not suitable for improving the ground against shear deformation or settlement caused by disasters. Therefore, in order to provide sufficient resistance against shear stress and shear deformation in excess of the initial allowable limit of the soil, additional materials must be introduced. This ground improvement approach includes the vibro-replacement, sand compaction pile, deep cement mixing, and grouting methods. The impacts of these methods on the shear resistance and settlement of the ground can be drastically increased by using a material with a higher stiffness than the surrounding soils.
A number of studies have been conducted from the perspective of structural design regarding the behavior of walls such as shear walls, which are similar to foundation walls with respect to their support conditions. Such previous studies have shown that geogrid reinforcement is effective in reducing permanent settlement under both static and cyclic loading conditions. Das and Shin [1] conducted a model test to analyze the effects of geogrid-reinforcement on clayey soil under cyclic loading. Numerical analyses have been performed to examine the behavior of various 3D models of a reinforced concrete structure with a central core wall both with and without an outrigger [2]. It was found that the performance of the outrigger was most efficient when the ratio of the outrigger size to the wall height was 0.5. Preliminary findings quantifying the effects of environmental conditions on the dynamic properties of earthen structures based on laboratory testing have also been presented [3], providing measurements and demonstrating that it is possible to distinguish dynamic property changes in adobe walls due to environmental effects. In the geotechnical field, studies of crushed stone materials and their shape characteristics have been conducted using laboratory tests [4,5,6] in which the stone column method using crushed stone was applied in lieu of a pile foundation. Indeed, studies of this method have been performed for many years.
When strips of crushed stone are installed beneath a foundation wall in the place of piles, an effect similar to that of the stone column method is provided. Studies on the stone column method have focused on drainage characteristics as well as bearing capacity and settlement characteristics. The study of the drainage characteristics of the stone column method has led to the study of its liquefaction resistance characteristics, while other studies have demonstrated the seismic performance of the stone column method through analysis using actual earthquake cases. Research on the drainage characteristics of the stone column method has been carried out since the 1964 Japanese Niigata earthquake, with increasing interest in liquefaction phenomena [7,8,9,10]. Seed and Booker [10] proposed a simplified theoretical solution to analyze the liquefaction resistance performance of a drained stone column installed in loose sandy ground: the stone columns were arranged in a triangular pattern, the surrounding loose sandy soils were saturated, and the pore water flow in the soil was observed to follow Darcy’s law. The drainage performance of the stone columns was then investigated considering different variables, and the LARF (Liquefaction Analysis for Radial Flow) program was proposed to analyze the drainage performance. Baez [11] analyzed the drainage performance of and shear stress redistribution in stone columns using field measurements and numerical analyses, applying a simple assumption of compatible shear strains for both the stone column and native soil. The proposed equation based on this assumption showed that the improvement in shear stress redistribution in the ground due to the stone column is proportional to the stiffnesses of the ground and stone column. Goughnour and Pestana [12] proposed a method for determining the equivalent shear modulus of stone-column-improved soft ground that considers the deformation pattern of the stone column as a pure shear response and pure flexural response using Baez’s assumption. Timothy et al. [13] investigated the seismic response of ground improved with the stone column method in which a stone column was installed in the ground, supporting the lower foundation of a bridge. The seismic responses of the improved ground were then analyzed by SHAKE, a one-dimensional ground response analysis program.
Liquefaction studies of stone-column-improved ground have also been conducted. A centrifugal model test was used to investigate the performance of a stone column in preventing the liquefaction of a silty soil layer [14,15]. The dynamic responses of ground models without stone or surcharge, with stone but without surcharge, with surcharge but without stone, and with both stone and surcharge were analyzed and compared based on the measured accelerations, pore water pressures, and settlement. Near the ground surface, the installed columns had only a marginal effect in reducing pore pressures. However, this observation does not substantially reflect the state of remediation below a shallow foundation, where the deformation mechanism is totally different and stone columns were found to reduce settlement by approximately 50%. Adalier and Elgamal [16] assessed the current state of stone column technologies applied as liquefaction countermeasures. Using case histories, different stone column applications and their observed effectiveness were presented. The seismic performance of a stone column installed in a saturated silt layer was analyzed using a scale-model shaking table test [17] in which similitude coefficients were determined according to Buckingham’s π [18] and other physical quantity similarity coefficients deduced by the dimensional analysis method [19]. In addition to these existing studies, the use of the stone column method for improving clayey soils has been investigated using model tests and numerical analyses. The seismic response characteristics of a soft clay soil improved by a crushed stone column were evaluated using a 1g shaking table, and the shear deformation of the soil surrounding the column was found to be smaller than that of the unimproved soil [20]. By analyzing the interaction between the soil and stone column, it has been confirmed that experimental shaking table test results are similar to those of a one-dimensional numerical model based on Baez’s assumption [21].
A number of studies investigating the modeling of the stone column method have also been published: Castro [22] reviewed extant modeling techniques for both ordinary, non-encased, and geosynthetic-encased stone columns. For more simplified models of stone column treatments, such as gravel trenches or soil homogenization, calibrating or tuning model parameters using the unit cell as an auxiliary problem was recommended. Kardgar [23] and Das and Dey [24] analyzed the bearing capacity of a crushed stone pile foundation using a finite element analysis. Kardgar [23] found that even though a wider foundation, larger stone column diameter, and larger quantity of stone columns corresponded to an increase in the bearing capacity of the foundation, the effect of stone column length and encasement stiffness was more pronounced. As such, these parameters can be considered critical factors in the analysis of shallow foundations in reinforced soil. However, Das and Dey [24] found that the bearing capacity of a stone column mainly depends on the friction angle of the stone column materials, the stone column diameter and length, the spacing between the stone columns and number of columns, and the undrained cohesion of the surrounding soft soil. Their sensitivity analysis indicated that the bearing capacity of a stone column is most affected by the friction angle of the stone column material and is least affected by the length of the stone column. Other relevant studies have been conducted on deep foundations, such as concrete piles and steel pipe piles, rather than crushed stone piles. Recently, an experimental study of ground reinforced with embedded pipes for a shallow foundation has been detailed [25]. However, under the stone column method, the effectiveness of the ground reinforcement must be assessed not only in the case of such deep foundations, but also in the case of shallow foundations.
Although there have been many studies using the crushed stone column method, they have mainly been conducted in sandy soil layers, and no investigations of the effect of crushed stone column foundation walls in clayey soils have been reported. Site effects are the most frequently observed cause of earthquake damage in clayey soils: the amplification of the ground acceleration is dependent on ground conditions, including the impedance ratio between the bedrock and the ground [26]. There is also a lack of research into the dynamic characteristics of the crushed stone in the columns. Accordingly, in this study, a crushed stone of sufficient stiffness and shear resistance capacity was installed in the form of a foundation wall, and shaking table experiments were performed to evaluate the seismic performance of the surrounding soil. The results of this study provide an analytical example of a seismic load acting as a horizontal load on a crushed stone foundation wall. This type of disaster mitigation research can be used to prevent damage caused by the amplification of ground acceleration in clayey soils, such as that resulting from the Mexico City earthquake of 1985. An improved design and evaluation methodology applicable to clayey soils based on the results of this study can lead to the confident construction of more structures on clayey soils.

2. Materials and Methods

The shaking table tests were conducted on the 1 g shaking table device at the KOCED Seismic Simulation Center (Korea). The 1 g shaking table was 5 m × 5 m in size, and the input frequency ranged from 0.1 Hz to 60 Hz. A laminar shear box (LSB) ground model was constructed on the shaking table using kaolinite and crushed stone. The input motions were the long-period Hachinohe-type wave and the short-period Loma Prieta- and Northridge-type waves. To minimize the interactions between experiments, the test running time was set to include a stabilization time of approximately one hour after the end of each experiment according to actual measurements and sensor changes.

2.1. Similitude Law

In this study, the experimental shaking table program was constructed by applying the implied prototype concept [27], which was introduced for ground model design and composition. The background and reasoning for the introduction of the implied prototype concept are as follows: (1) It is difficult to define specific values due to the uncertainties in the engineering properties of the actual ground, such as the undrained shear strength, plasticity index, consolidation coefficient, etc. in the case of clay; (2) It is very difficult to design a ground model with the same property ratios as the actual ground, as it is difficult to specifically define these ratios; and (3) The similitude law widely used in the geotechnical engineering field is practically unachievable. Therefore, the implied prototype has been proposed to define the properties of the prototype by inferring the engineering characteristics of the ground model, inversely estimating the properties of the ground at the site or study area by applying the appropriate adjustment to the parameters of the specified ground.
For similitude law of shaking table model experiments, the similitude law of Iai [28], applicable to all saturated soils, and the similitude law of Gibson [29], which can be applied only in sandy soil, are most typically applied. Kagawa [30] studied the similitude law of a geotechnical structure subjected to dynamic loading using the ratio of forces, and Kokusho and Iwatate [31] studied Buckingham’s [18] π theory to determine the similitude law of the nonlinear dynamic response of the ground. However, Iai [28] suggested that these two studies above were only applicable to the shear deformation of the geotechnical structures, and so they needed to be extended to provide a more general similitude law. Rocha’s assumption [32] and the basic equation governing the stresses of the saturated soil structure–fluid system were used to derive the similitude law for 1g shaking table model tests. The law proposed by Iai [28] is based on the geometric similitude ratio (λ), the density similitude ratio (λρ), and the similitude ratio (λε) of the strain obtained using the shear wave velocity ratio of the ground model to that of the actual ground, and suggests a general similitude relationship of the saturated soil–fluid-structure system. In the scale model experimental program of this research, the similitude law of Iai [28] was used because that of Gibson [29] cannot be applied to clayey soil. Indeed, Iai’s similitude ratio [28] is the best suited for expressing the implied prototype, because it is able to adequately control the similitude ratio of the strain for the prototype to model shear wave velocity ratio. The application of Iai’s law in this study is shown in Table 1. However, in this study, the results of the shaking table tests could not be compared with any field results as no field experiments could be performed.

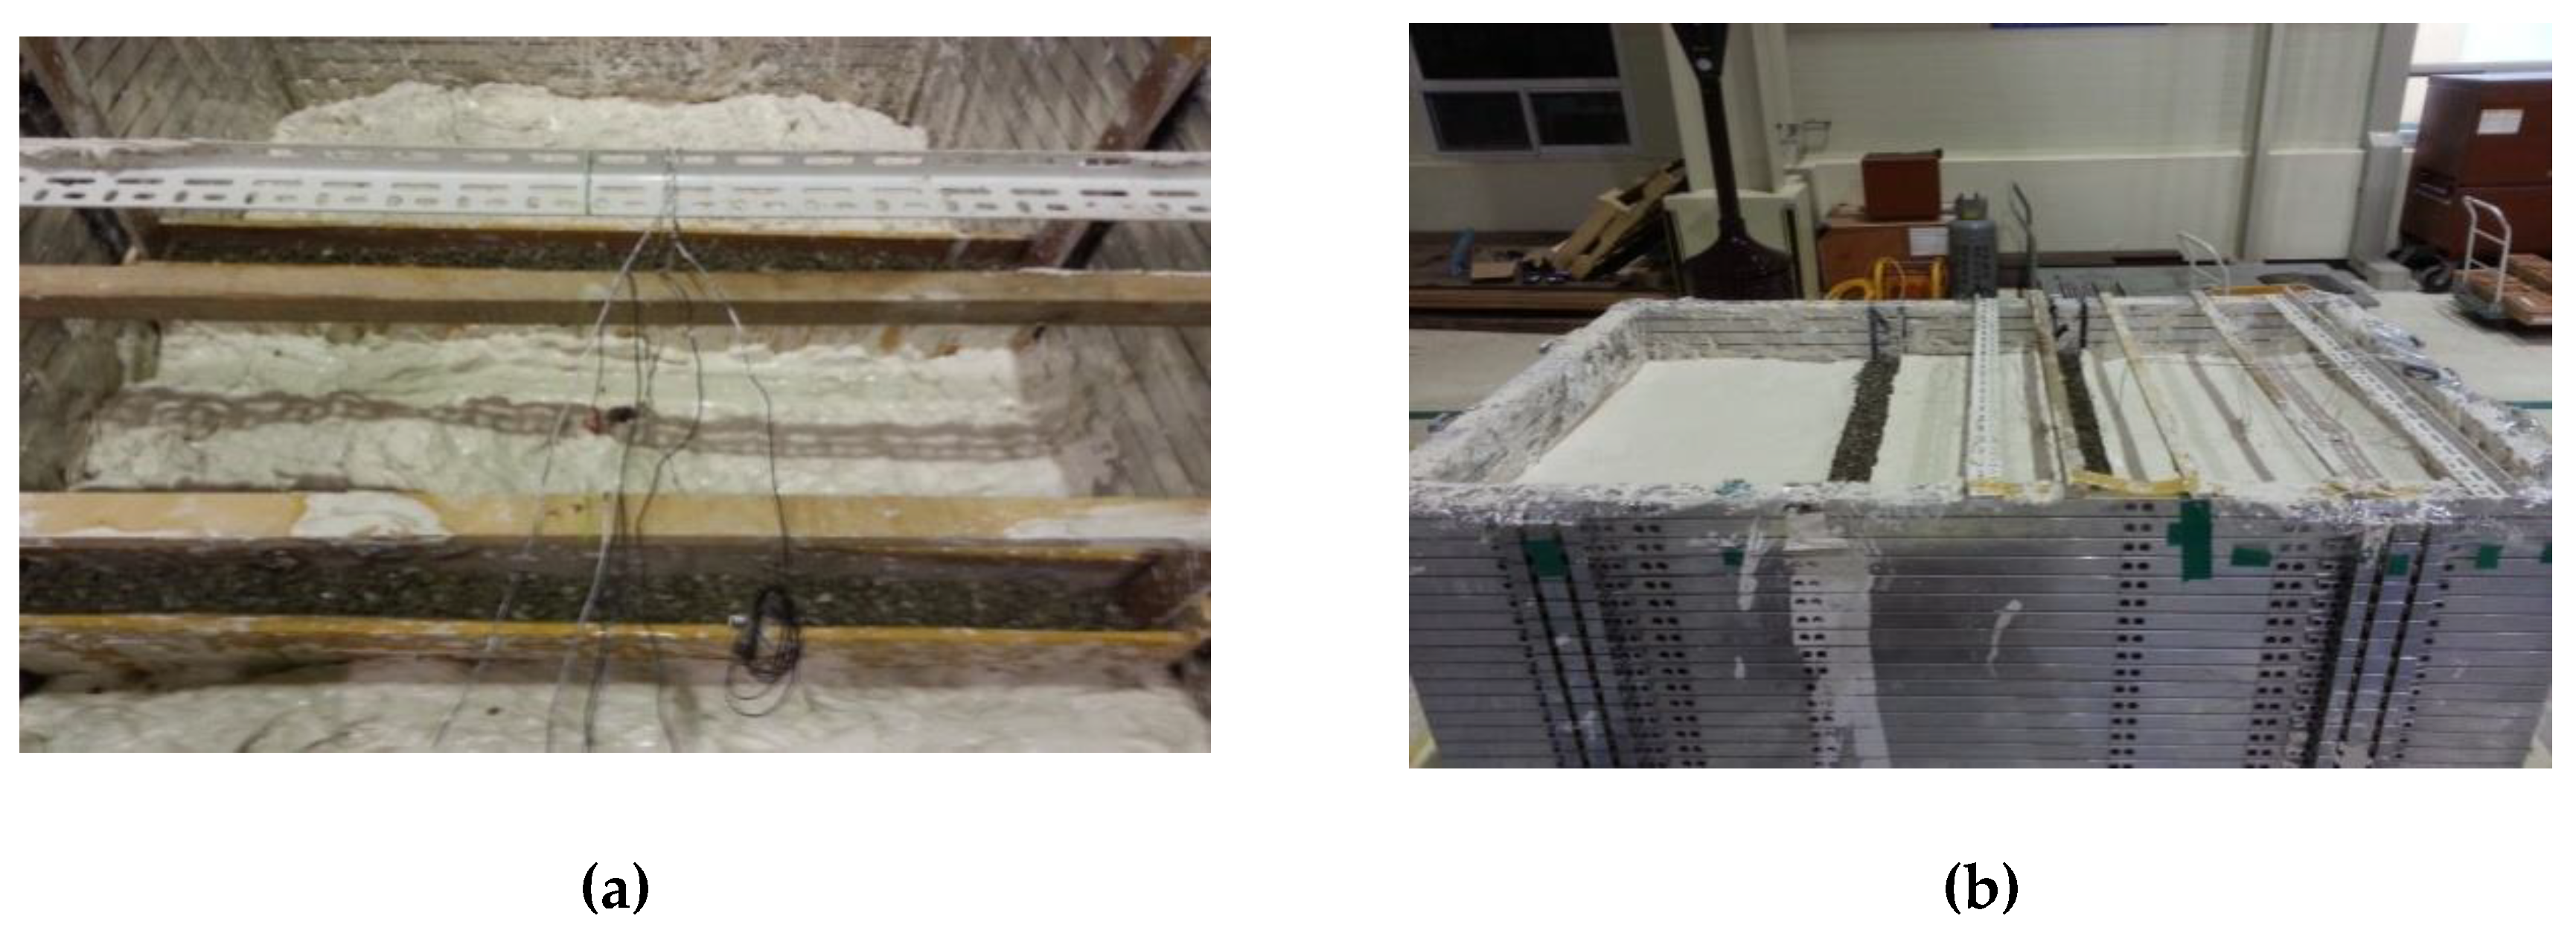
2.2. Ground and Foundation Installation

Kaolinite with an undrained shear strength of 5 kPa was used to construct the soft ground. The crushed stone foundation wall was simultaneously installed using formwork erected at the beginning of construction and designed to be removed from the top once the foundation wall and ground were completed. The foundation wall was configured in two parallel strips of crushed stone to provide a space to evaluate the differences in the behavior of the soil inside and outside of wall containment. The crushed stone used was an artificial aggregate made of commonly available rocks, and its material properties were obtained using the cone penetration test (CPT) both in-situ and in laboratory tests. The material properties can be found in Table 2, and the installation of the ground and foundation in the LSB is shown in Figure 1

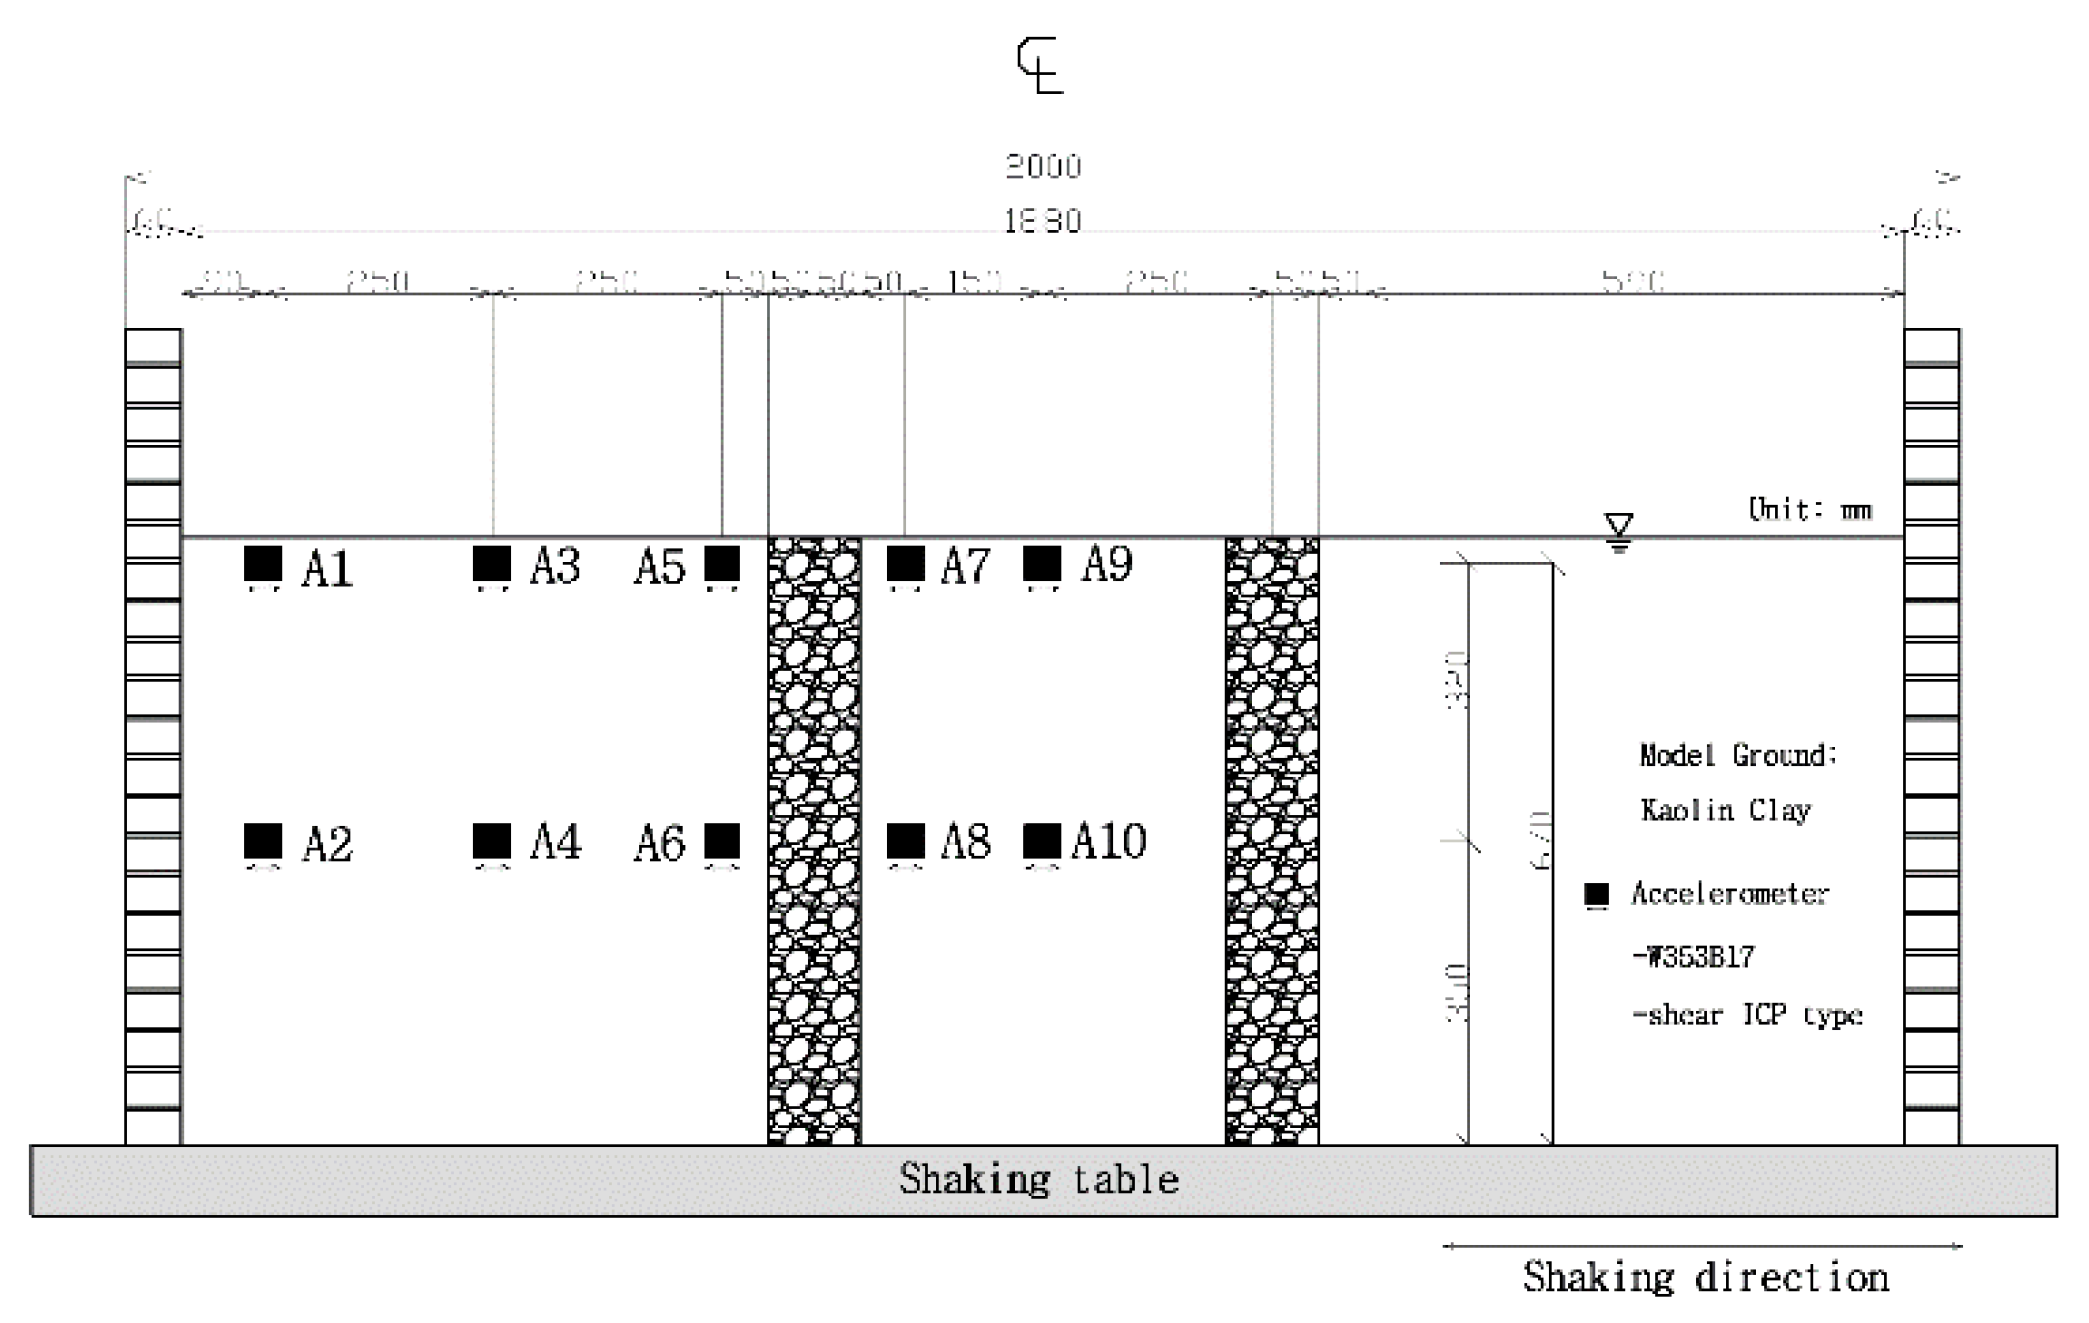
2.3. 1 g Shaking Table Experiment Setup

The 1 g shaking table used in this study was 5 m wide and 5 m long, and the LSB model box was 1.2 m wide, 2 m long, and 0.9 m high. Unlike the rigid box (RB), the LSB solves the phase difference problem in a dynamic experiment, as shown by Kim et al. [15] using experiments on both RB and LSB setups. To measure ground acceleration, accelerometers were installed at two different depths at different locations inside and outside the crushed stone foundation wall (Figure 2). Hachinohe-, Loma Prieta-, and Northridge-type seismic waves of various periods were used to perform the ground model response experiment. The time history and response spectrum of each seismic wave are shown in Figure 3. In this study, input seismic waves with an acceleration level of 0.3 g were used.

3. Results and Discussion

The experimental results were analyzed for acceleration variation and their response spectra as detailed in Section 3.1 and Section 3.2, respectively.

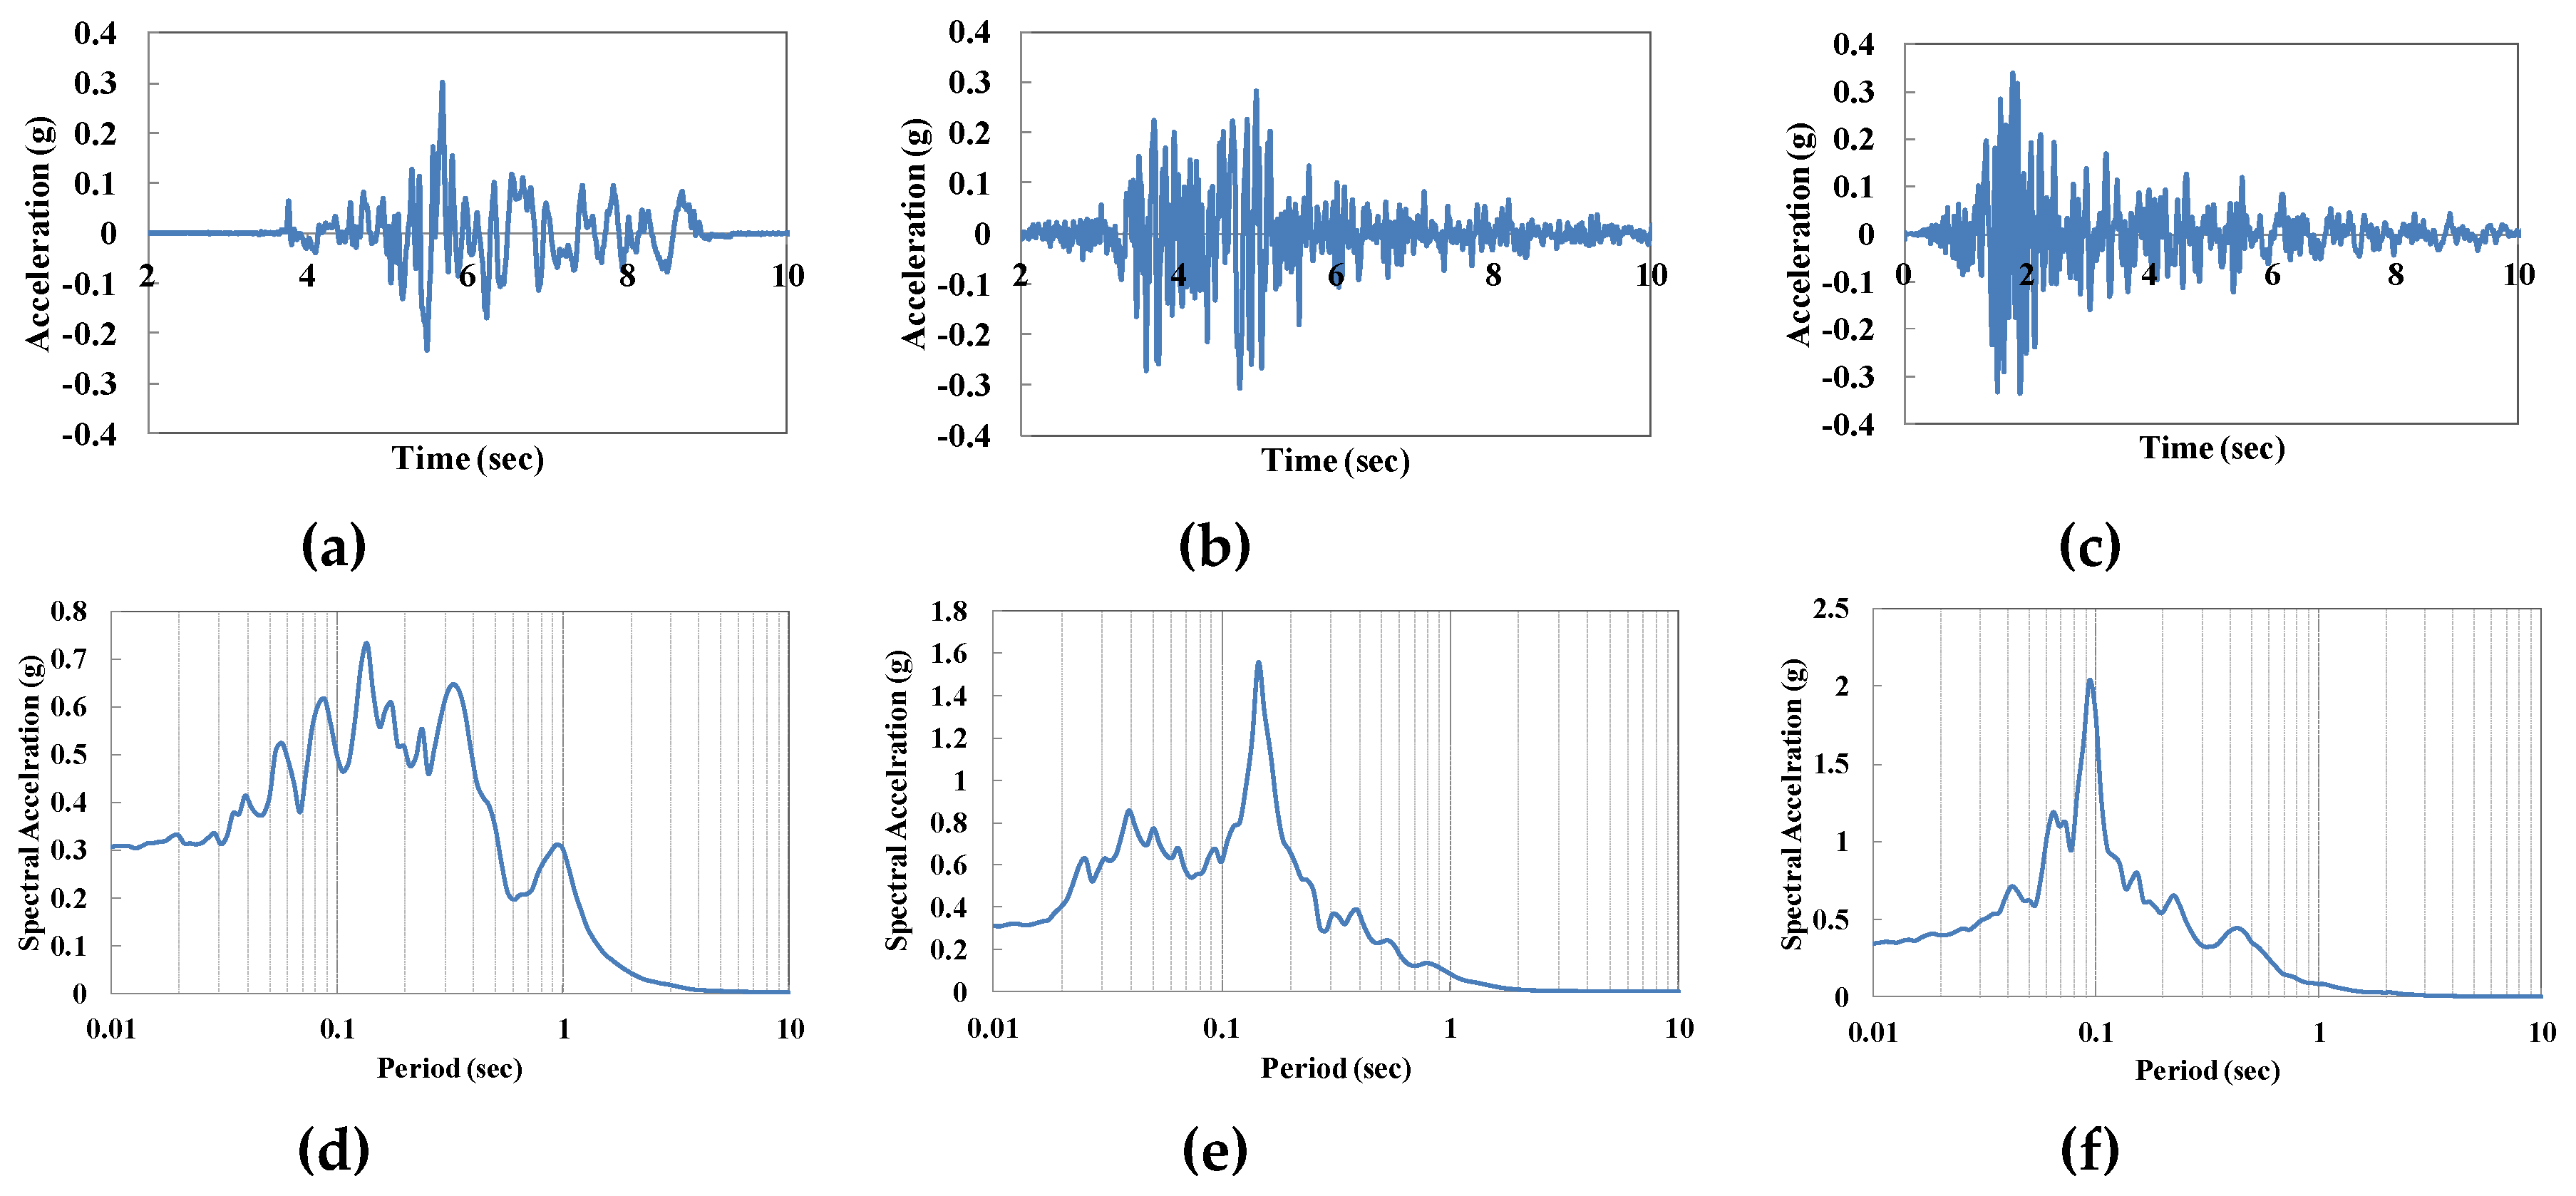
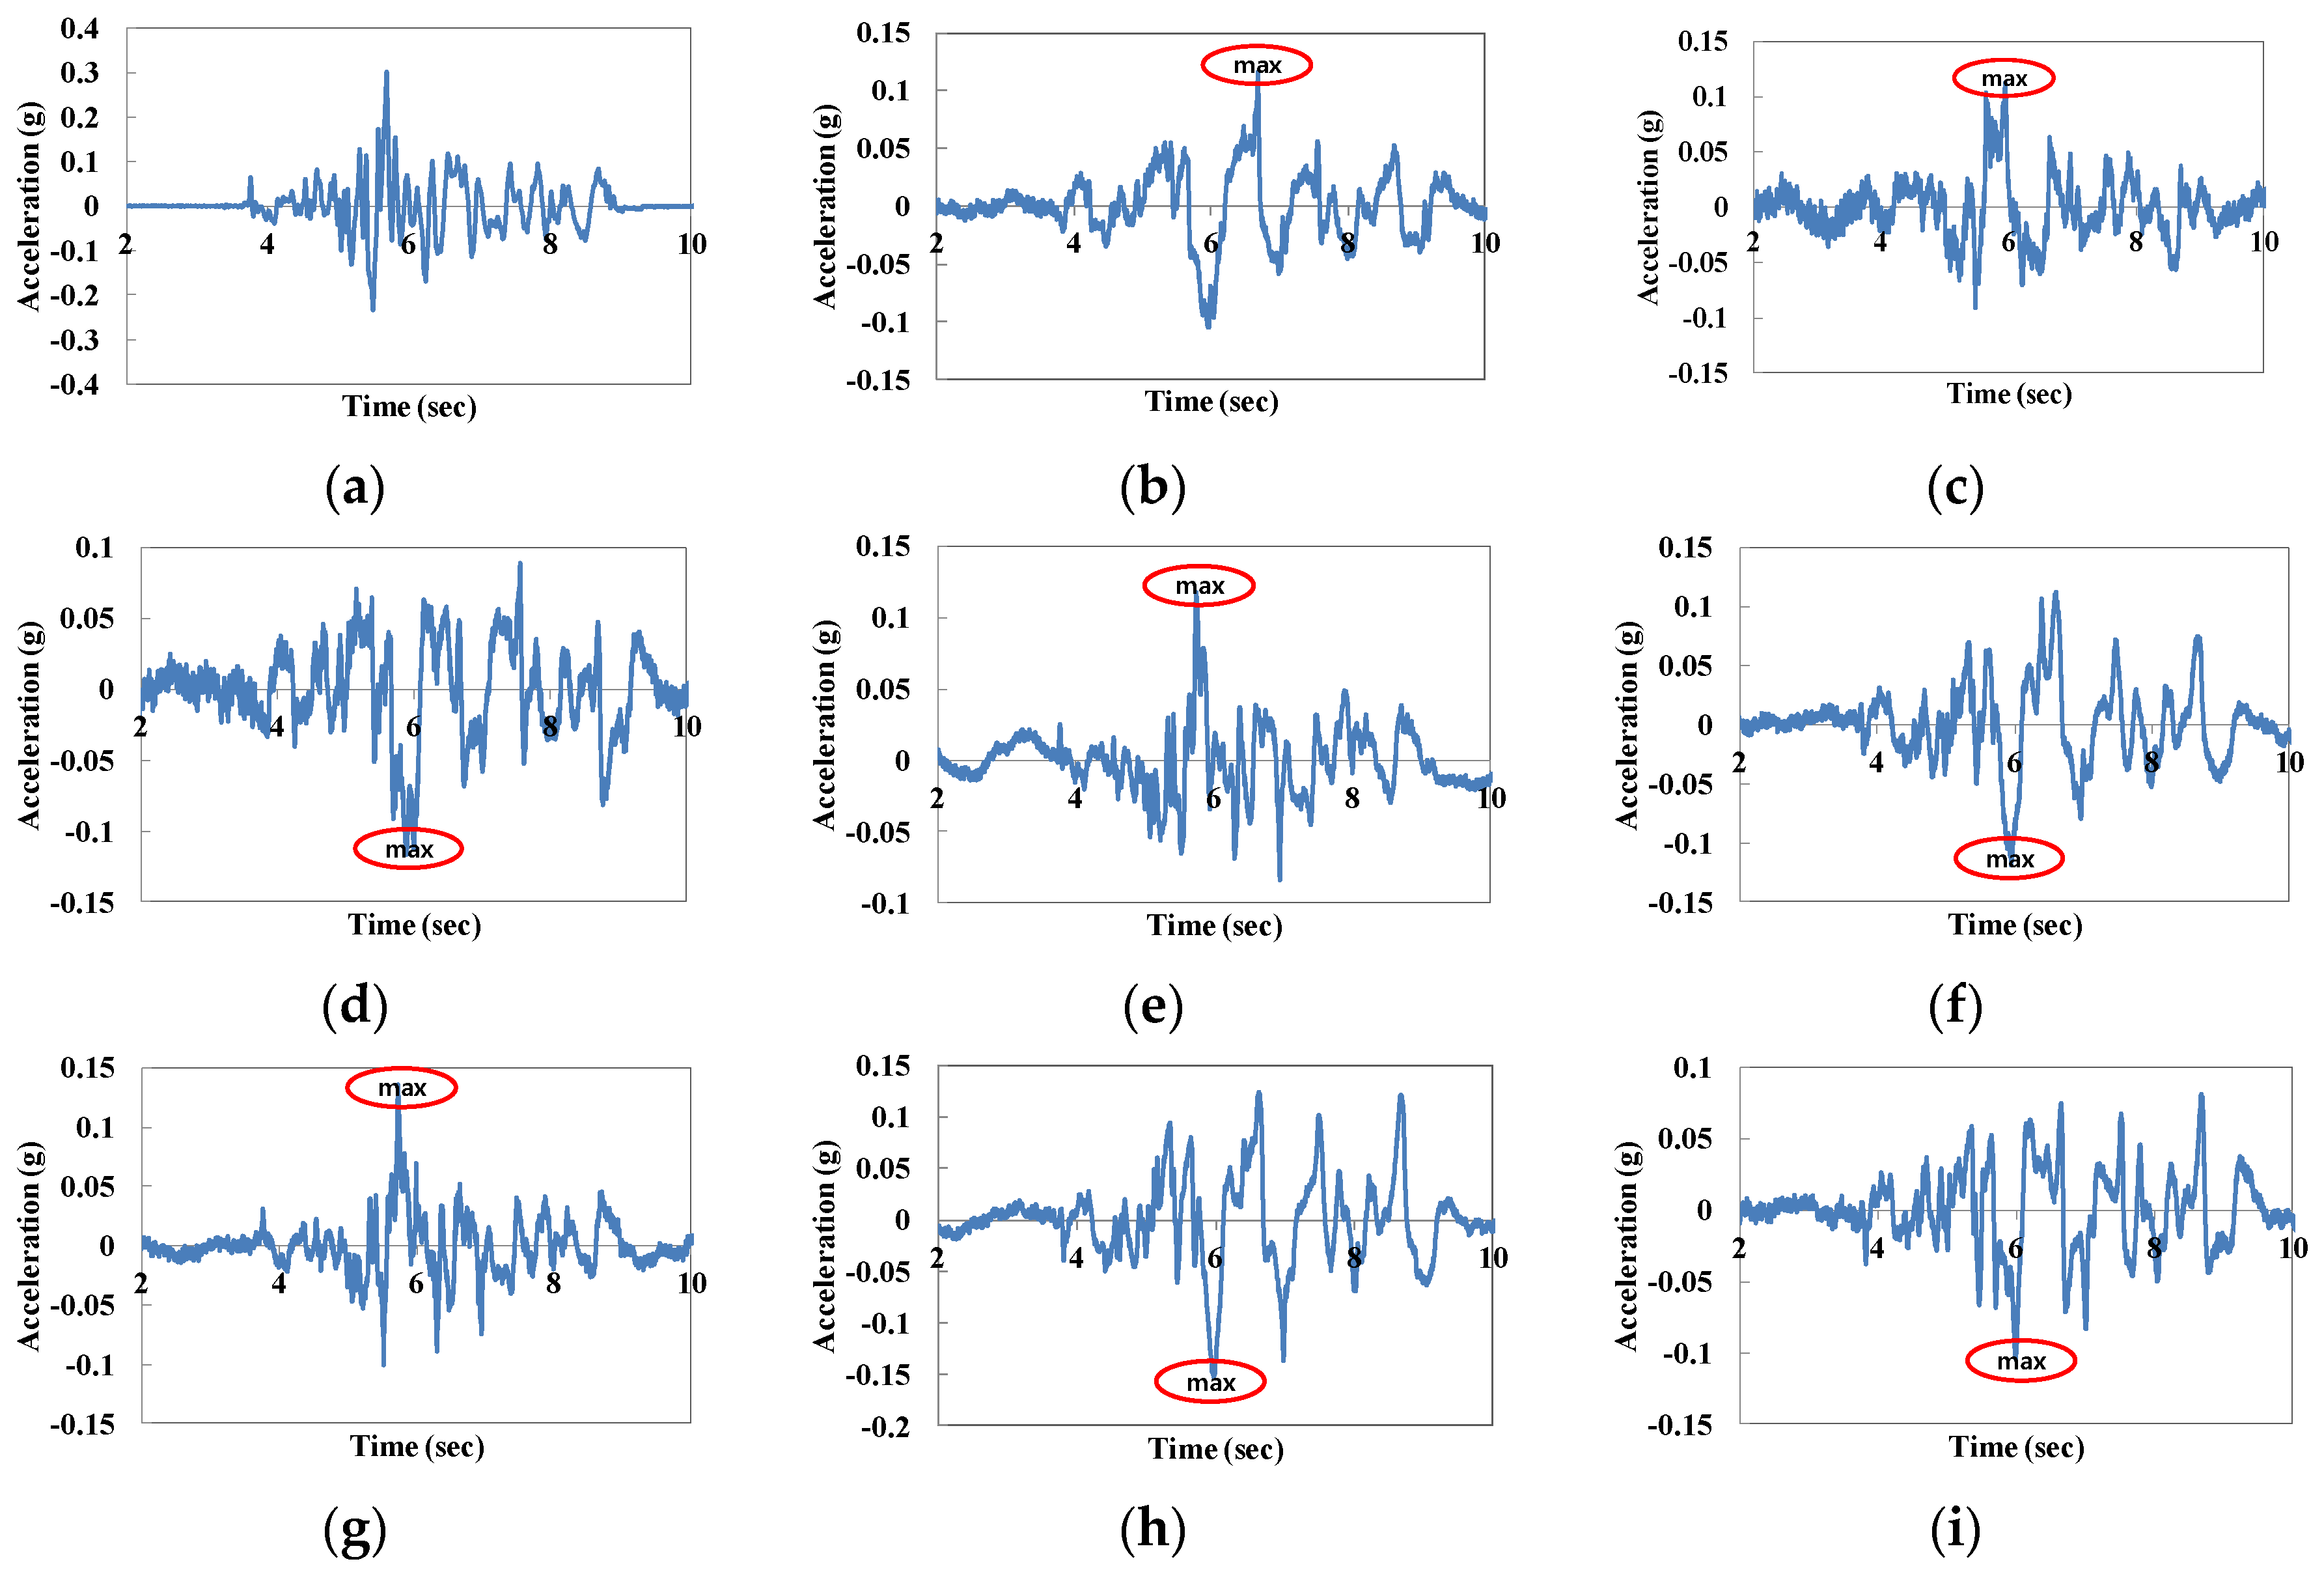
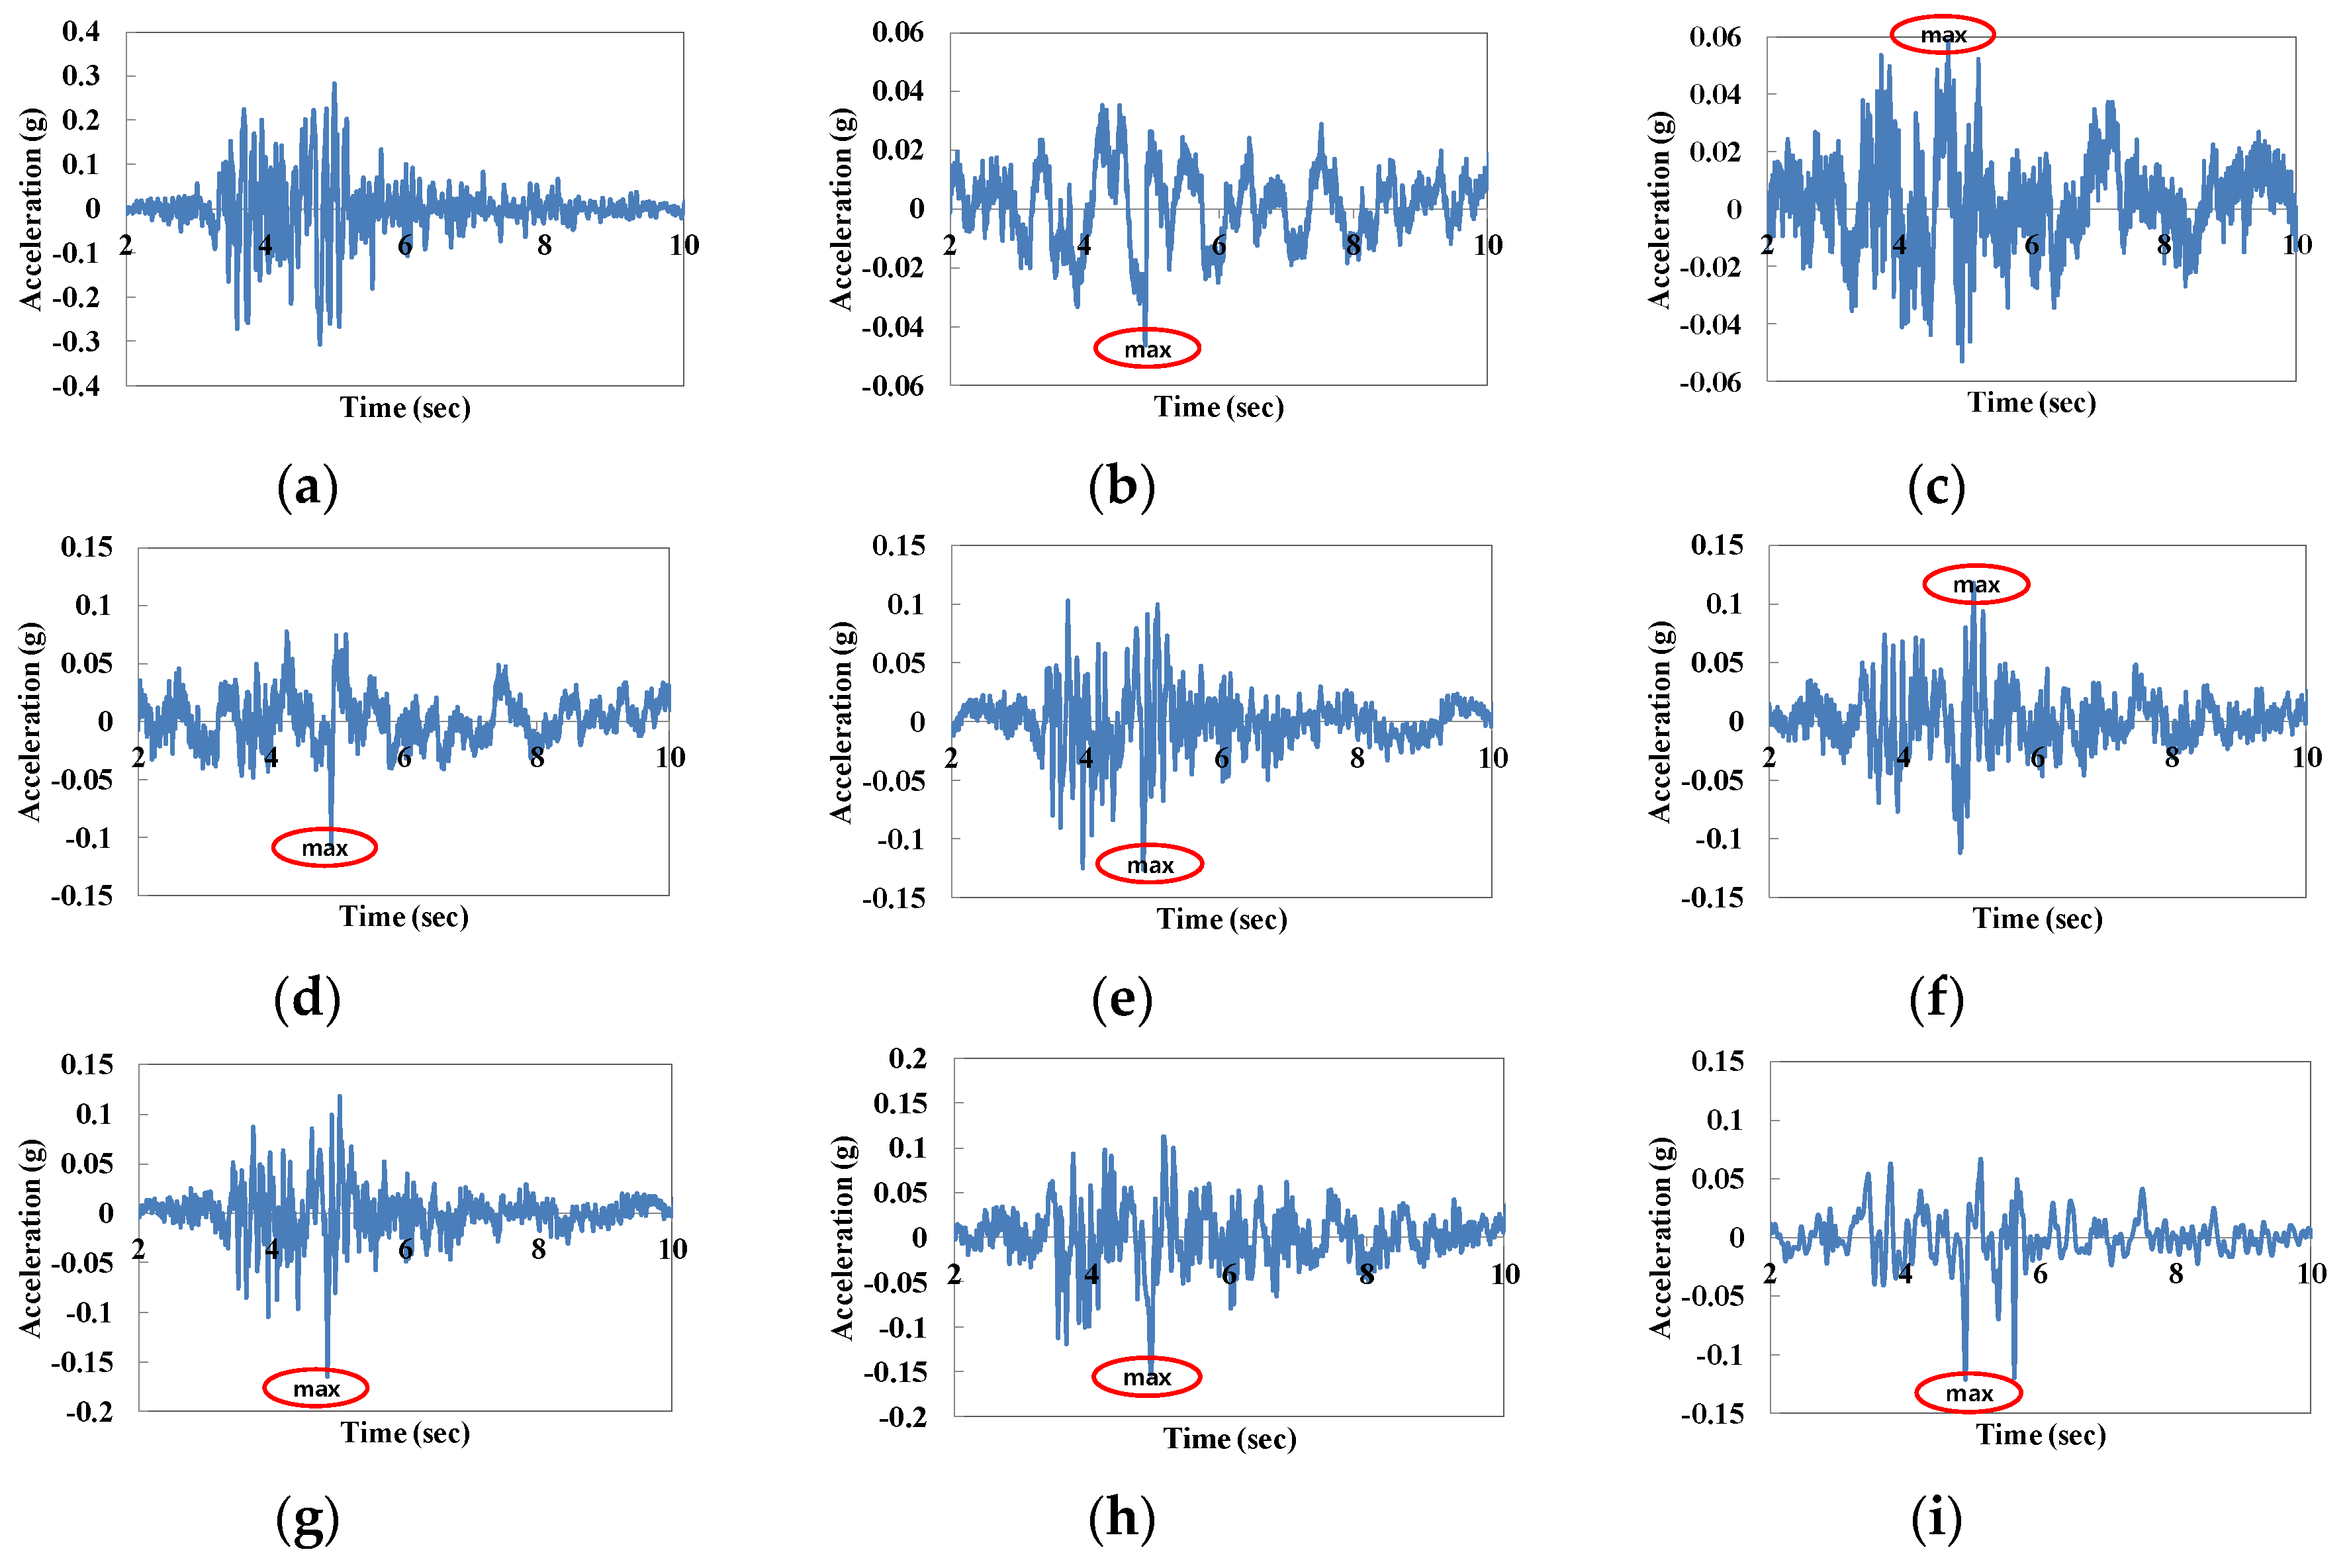
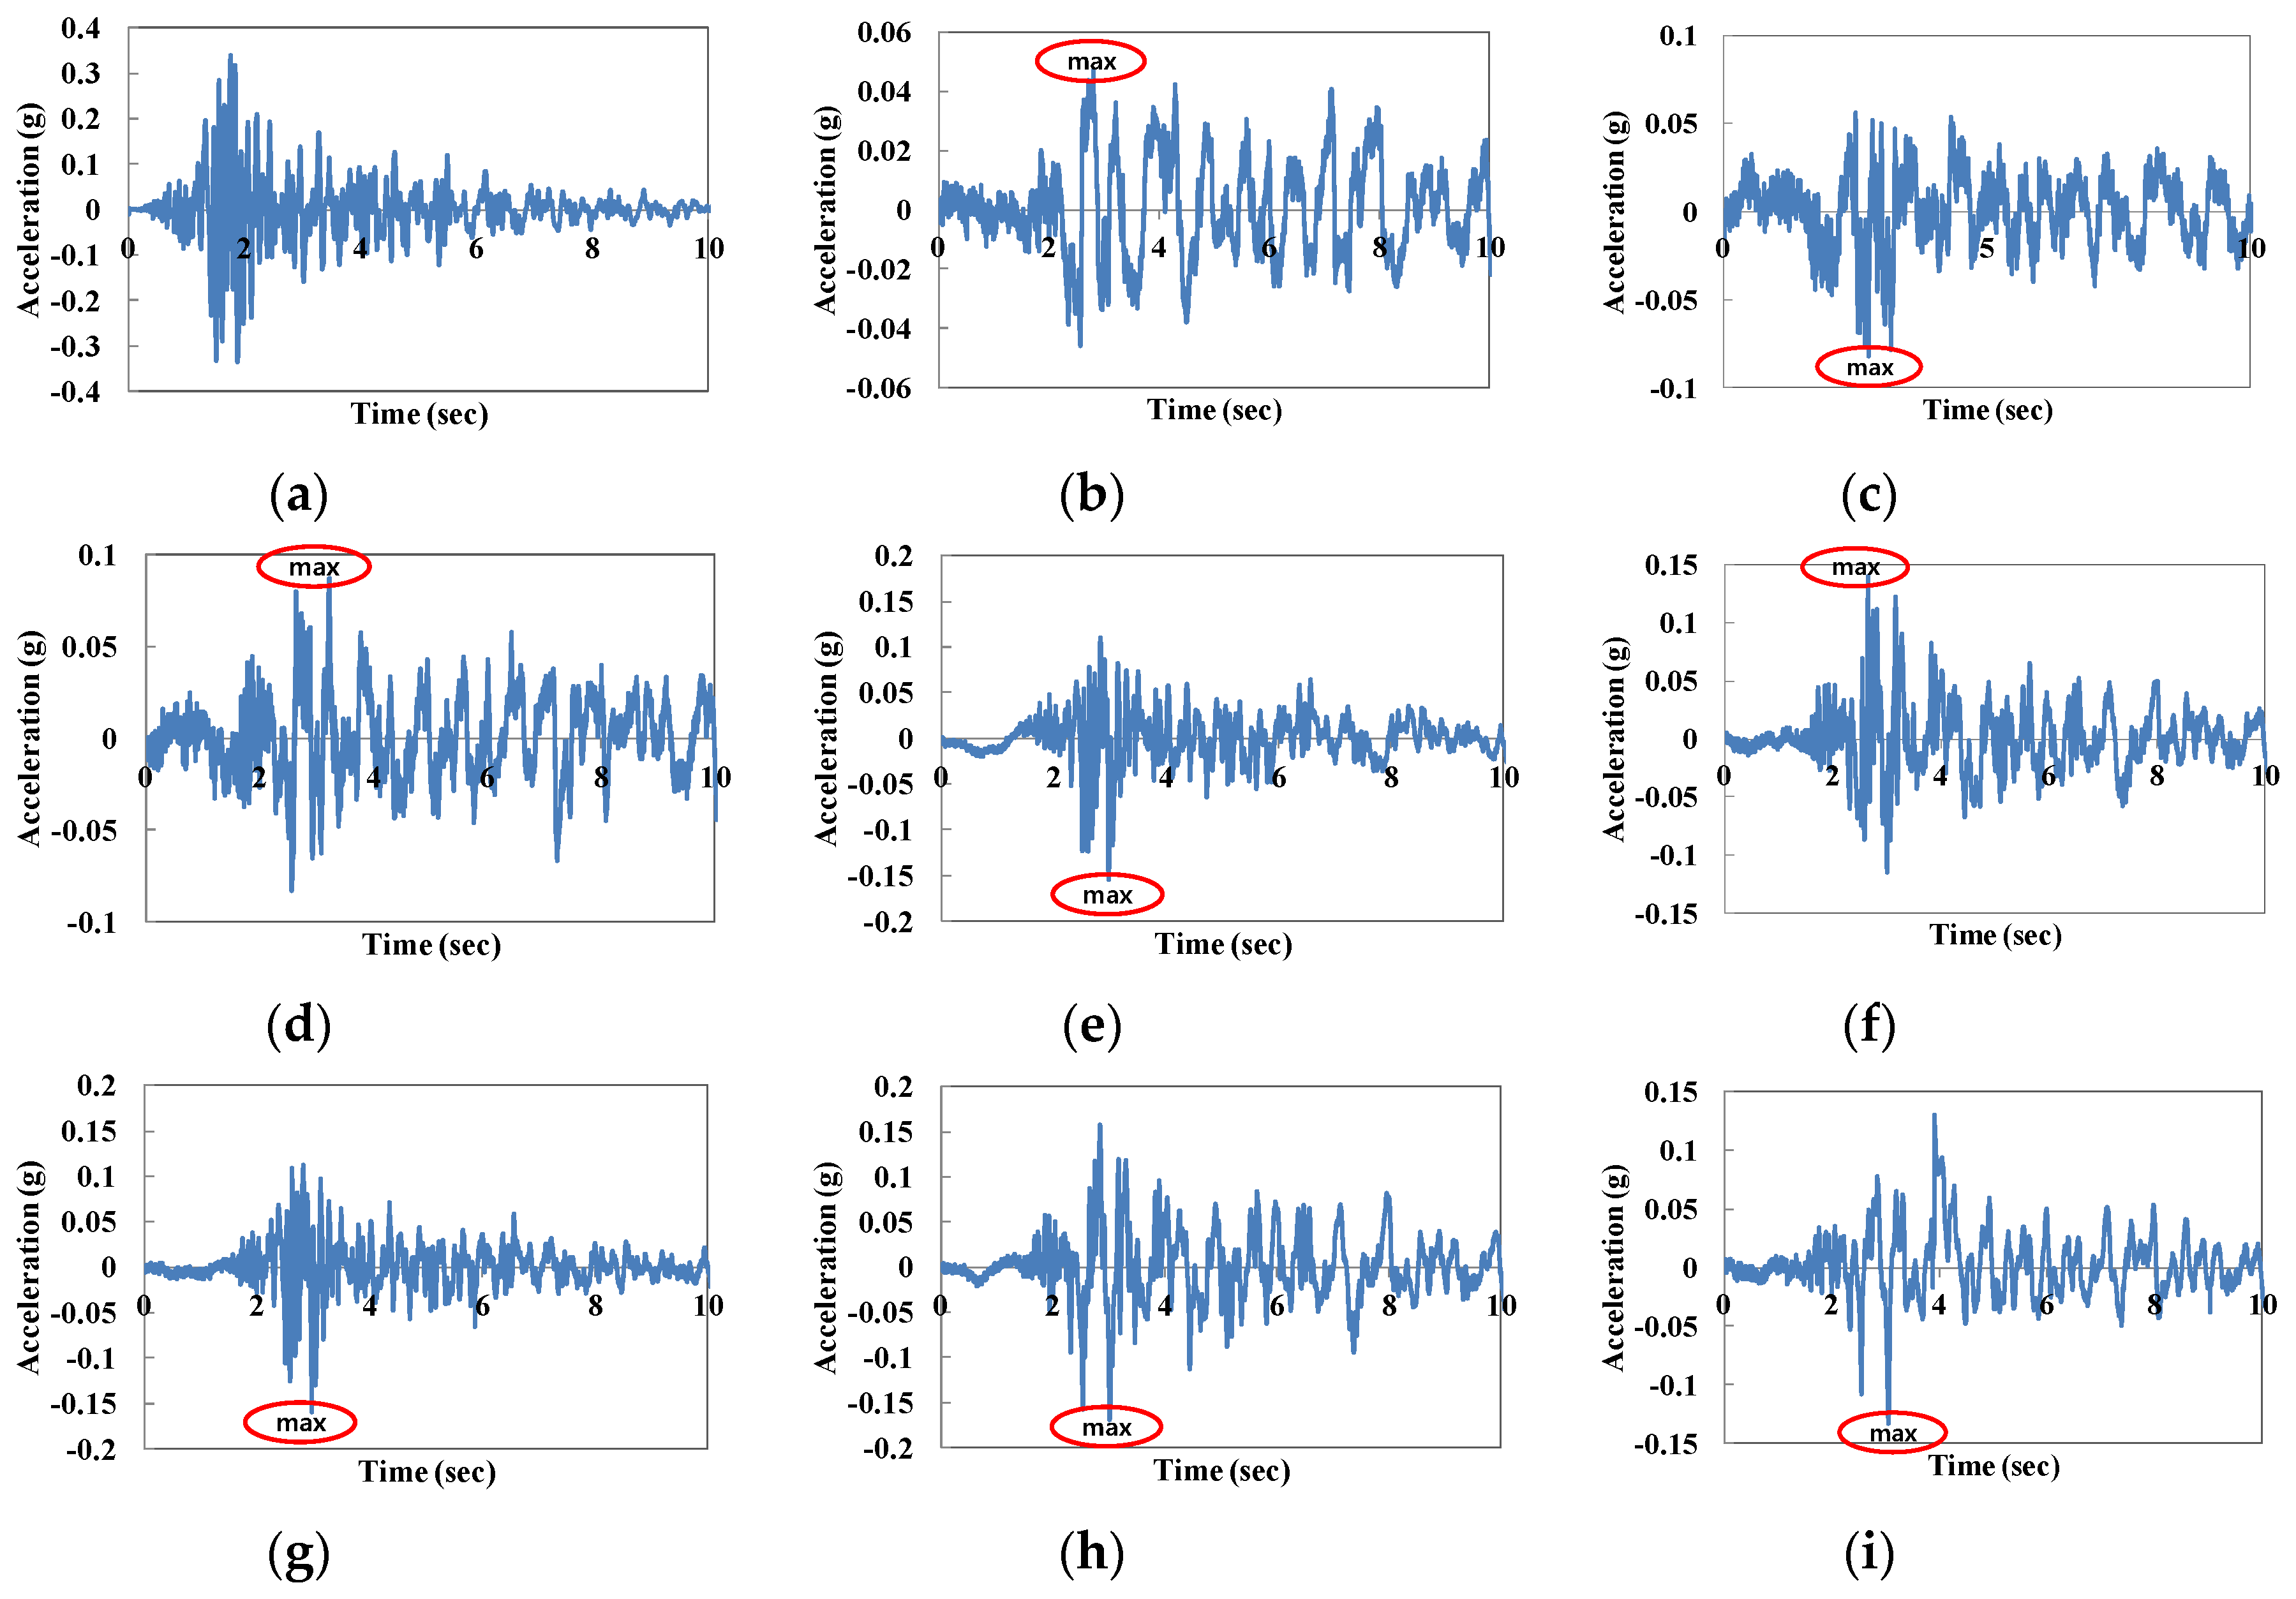
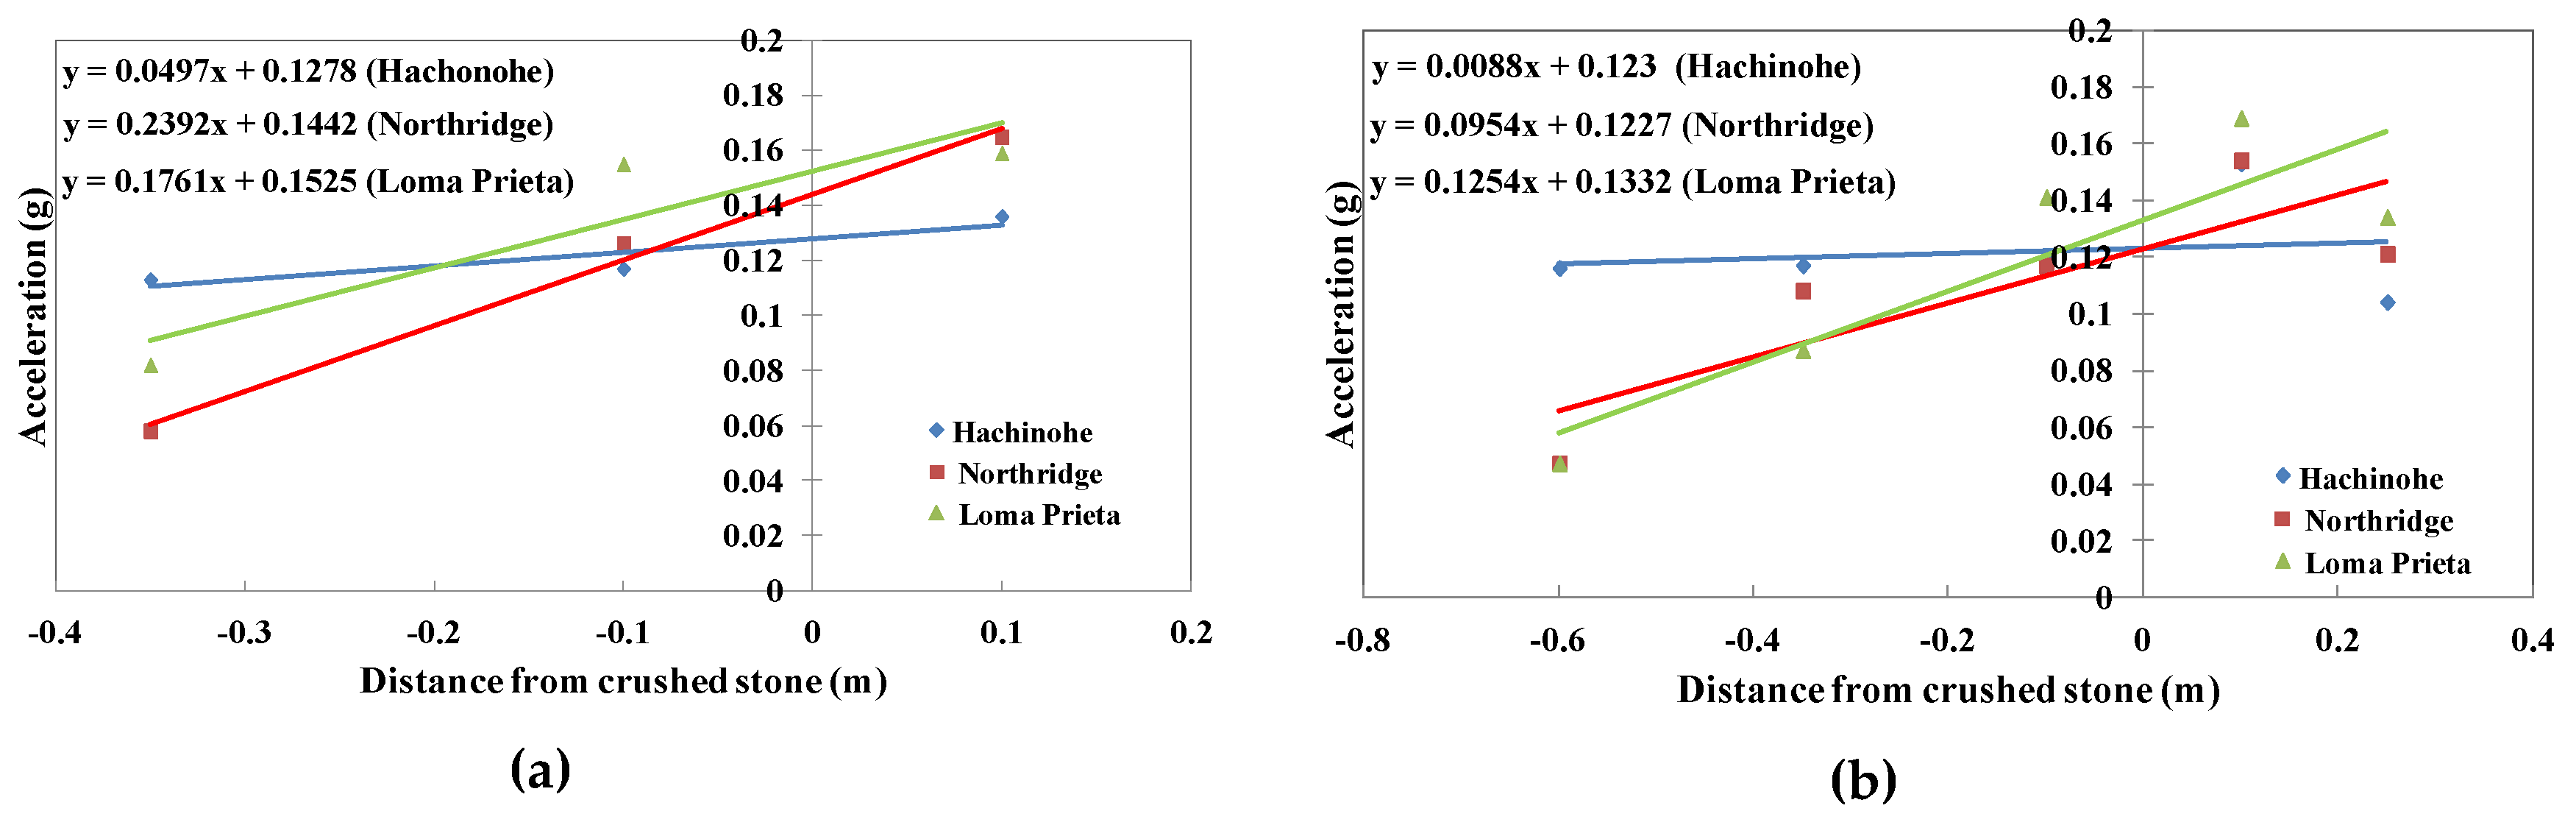
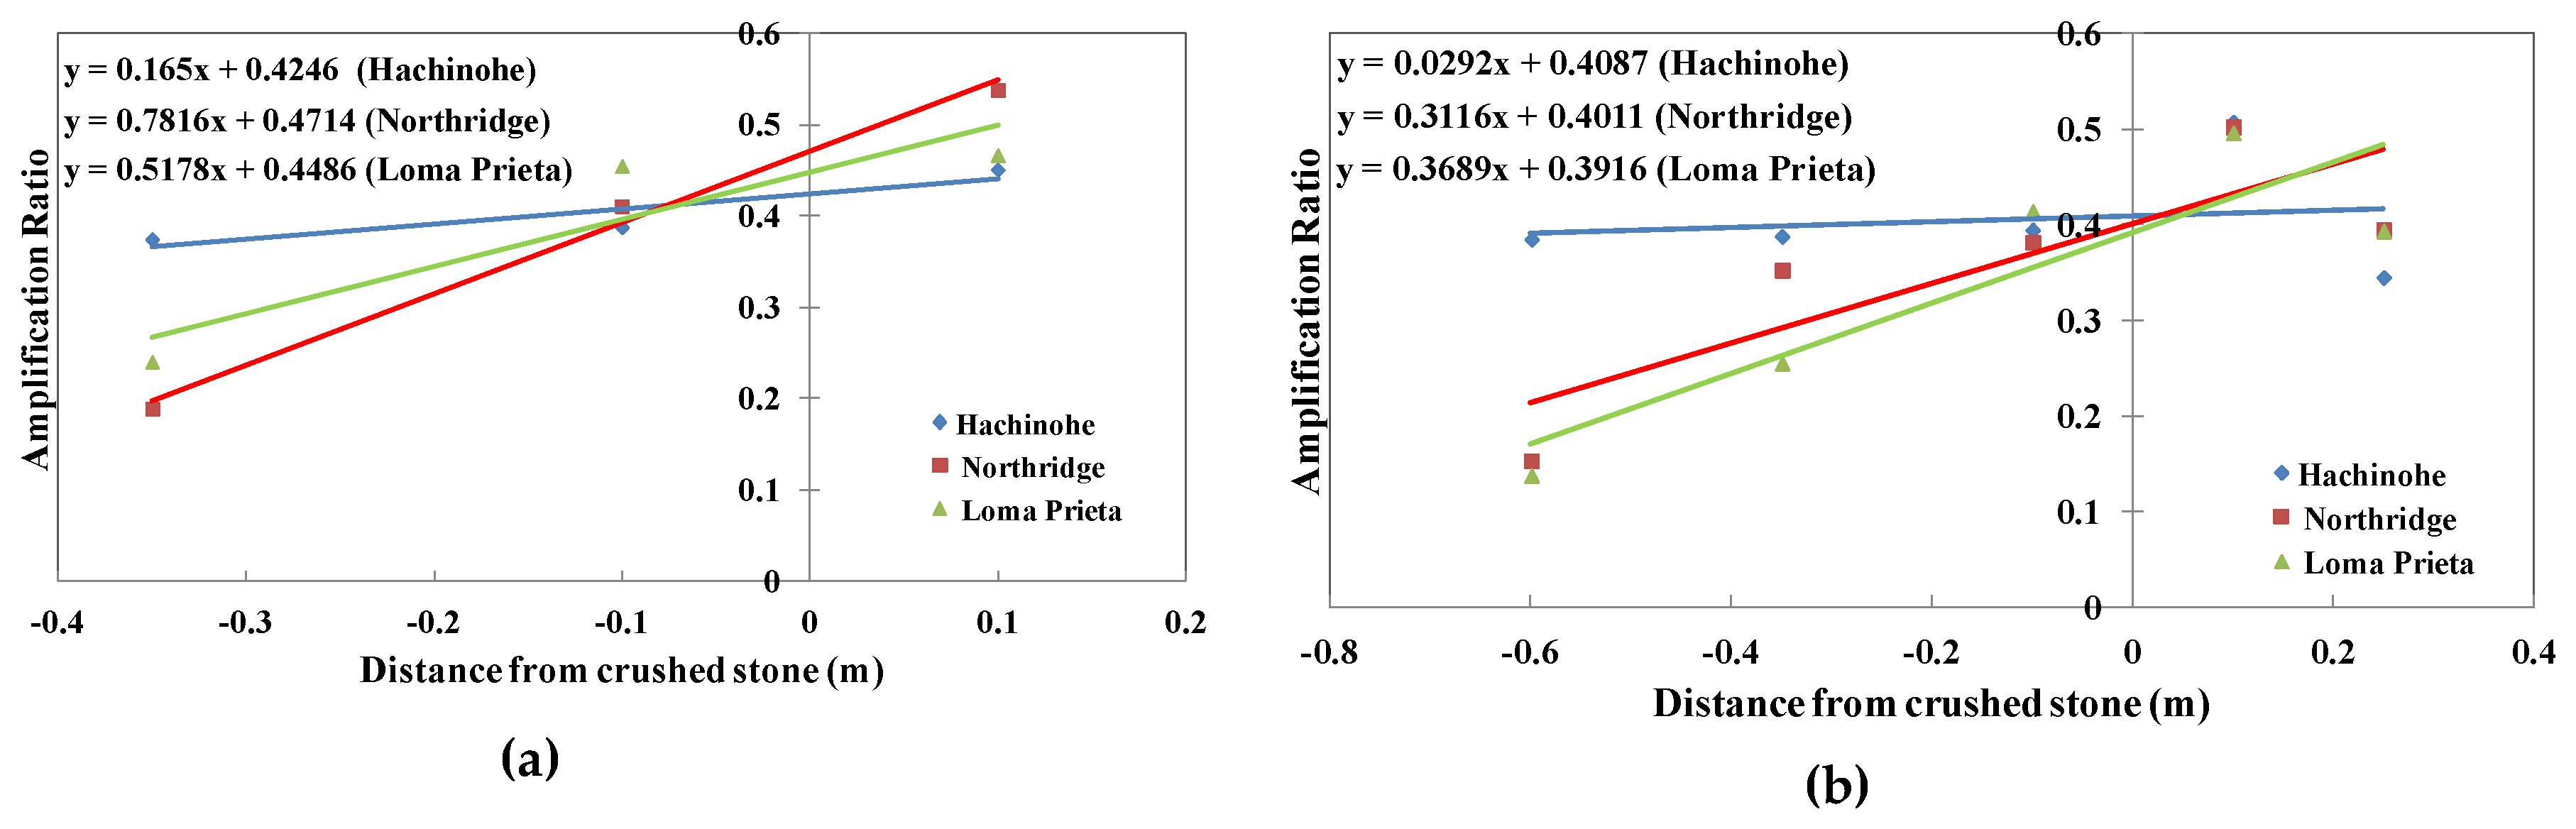
3.1. Acceleration Analysis

The response acceleration values at the ground surface and ground interior were compared (Figure 4, Figure 5 and Figure 6). Accelerometers A1, A3, A5, A7, and A9 were installed on the ground surface, and accelerometers A2, A4, A6, A8, and A10 were installed in the interior of the ground. Note that sensors A1 and A9 have been excluded in the results due to abnormalities, and that the maximum acceleration values reported in this analysis are the absolute maximum values.
The acceleration values inside and outside the foundation wall were compared. On the ground surface, accelerometers A5 and A7 were compared with accelerometers A6 and A8 in the ground interior. For the Hachinohe-type seismic wave in Figure 4, the maximum acceleration of the ground outside the foundation wall was 14% less than the maximum acceleration of the ground inside the foundation wall, and the maximum acceleration on the ground surface was 23% less than that in the interior. For the Northridge-type seismic wave in Figure 5, the maximum acceleration of the ground outside of the foundation wall was almost 25% less than that on the inside, and the maximum outside and inside accelerations were 3% and 17% smaller, respectively, than those of the Loma Prieta-type seismic wave in Figure 6. To compare the acceleration values at the maximum distances from the foundation wall on each side, data from accelerometers A2 and A10 were evaluated. For the Hachinohe-type seismic wave, the maximum acceleration obtained outside of the foundation wall was approximately 1.1 times greater than that obtained inside the foundation wall. For the Northridge and Loma Prieta-type seismic waves, the maximum acceleration values were approximately 11% and 35% smaller, respectively, than those of the Hachinohe-type seismic wave. In general, it was observed that acceleration was damped from the outside rather than the inside of the foundation wall. The ground inside the foundation wall was affected by the foundation walls on both sides, so that the stiffness of the ground was greater than that of the exterior, which was affected by only one foundation wall. When the stiffness of the ground increases, the natural period of the ground shifts to the short-period region. From the results provided in Section 3.2, it can be observed that the spectral acceleration value of A10 is amplified much more that than of A4 in the periodic region of less than 0.3 s. Because of this result, it seems logical that the acceleration inside the foundation would be larger than that observed outside the foundation.
The variations in maximum acceleration according to the distance from the foundation wall are depicted in Figure 7, in which it can be seen that the greater the distance from the foundation wall, the smaller the maximum acceleration measured in the ground. The changes in the acceleration of the ground according to the distance from the crushed stone are expressed by the equations shown for each curve in Figure 7. As can be seen, on the ground surface, the long-period Hachinohe-type wave exhibited the smallest slope while the largest slope occurred for the short-period Northridge-type seismic wave. In the interior of the ground, the slope was the largest for the short-period Loma Prieta-type wave and was the smallest for the long-period Hachinohe-type seismic wave, similar to the results observed on the ground surface. These results suggest that distance from the crushed stone does not have a significant influence on ground acceleration under long-period seismic motions. However, it was clear that under short-period seismic motions, the acceleration of the ground was considerably affected by the distance from the crushed stone. The reason for this is that the increase in the ground stiffness due to the crushed stone shifted the natural period of the ground into the short-period region. Therefore, the greater the distance from the crushed stone, the smaller the effect of this periodic change. The seismic waves in the short-period region were more affected by the natural period change in the ground. It can be concluded then from the slope that distance has a greater effect on the seismic waves in the short-period region than in the long-period region. Therefore, existing crushed stone structures located in the ground should be seismically retrofitted and new crushed stone structures should be seismically designed considering the results of this study.
Figure 8 shows the acceleration amplification ratio (made non-dimensional by dividing the response acceleration value by the input wave value) with respect to the distance from the foundation wall, and shows the equation for each curve. As the distance from the foundation wall increased, the acceleration amplification ratio decreased for all seismic motions. The acceleration amplification ratio trends were similar for the short-period Northridge- and Loma Prieta-type seismic waves. However, the slope of the amplification ratio was smaller for the long-period Hachinohe-type wave, and the effect of the distance from the foundation wall was again found to be insignificant. This result can be used for dynamic design considering both long-period and short-period seismic waves when constructing a foundation wall using crushed stone in soft ground. By considering the expected ground response acceleration during the early stages of foundation design, it is possible to estimate the response according to location relative to the crushed stone improvements, preventing excessively conservative or lightweight designs by informing appropriate design values. Furthermore, these results can be used as a reference database to estimate the acceleration load on a structure according to the distance from the foundation wall.

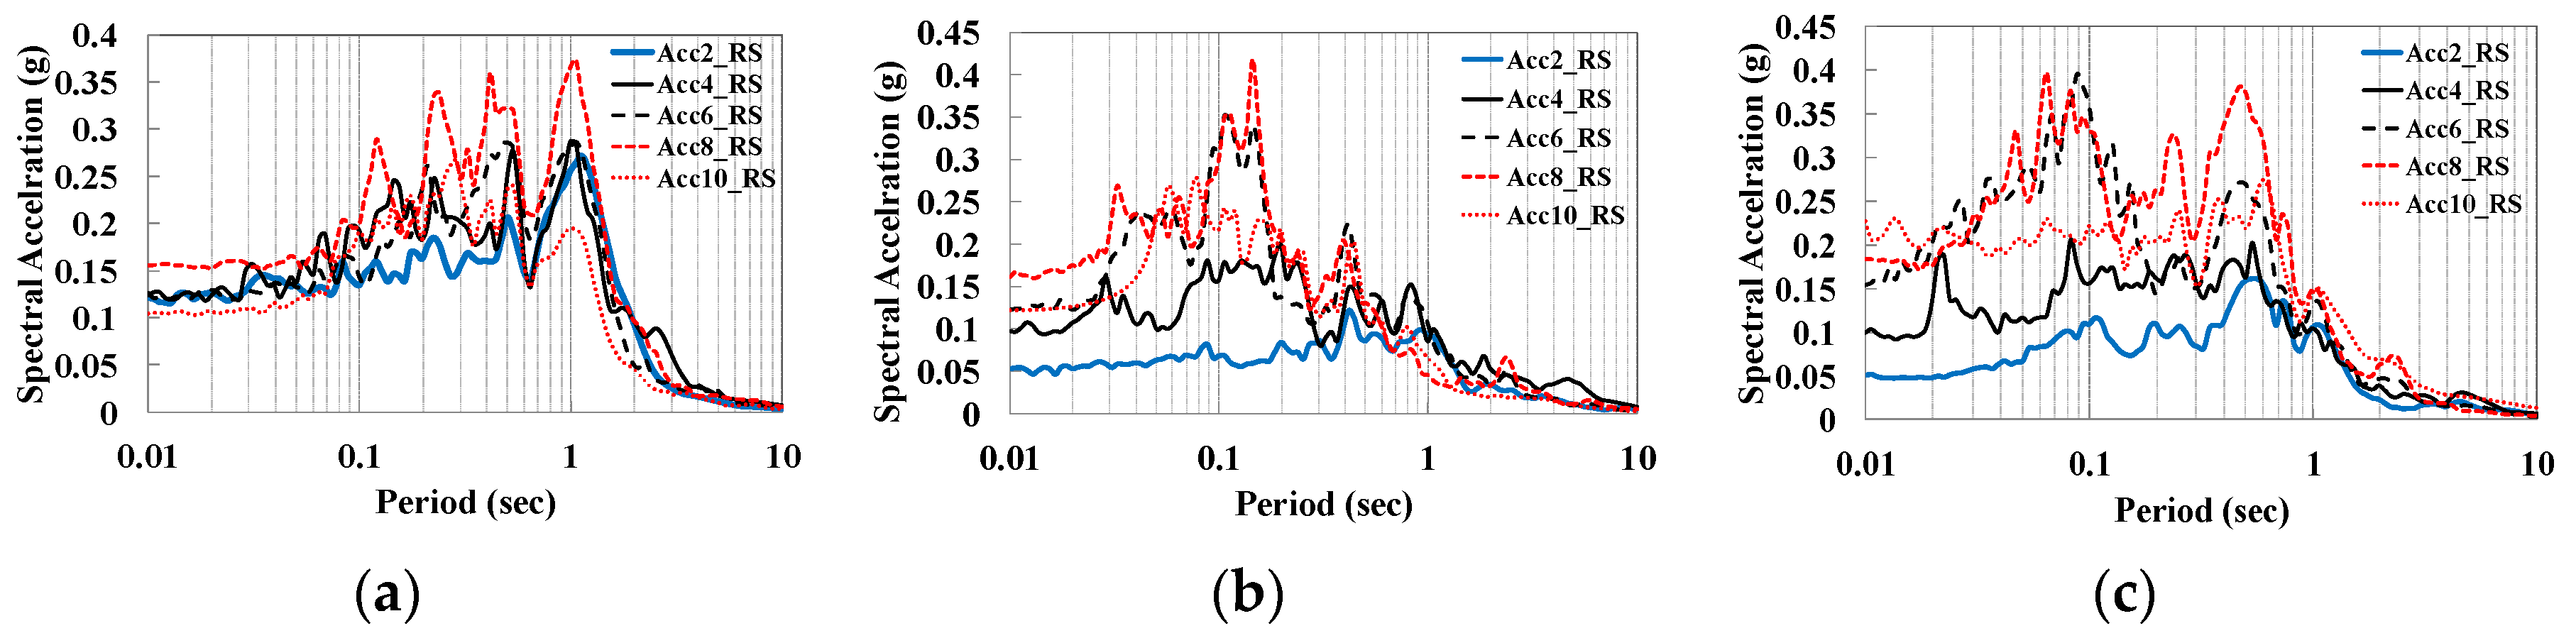
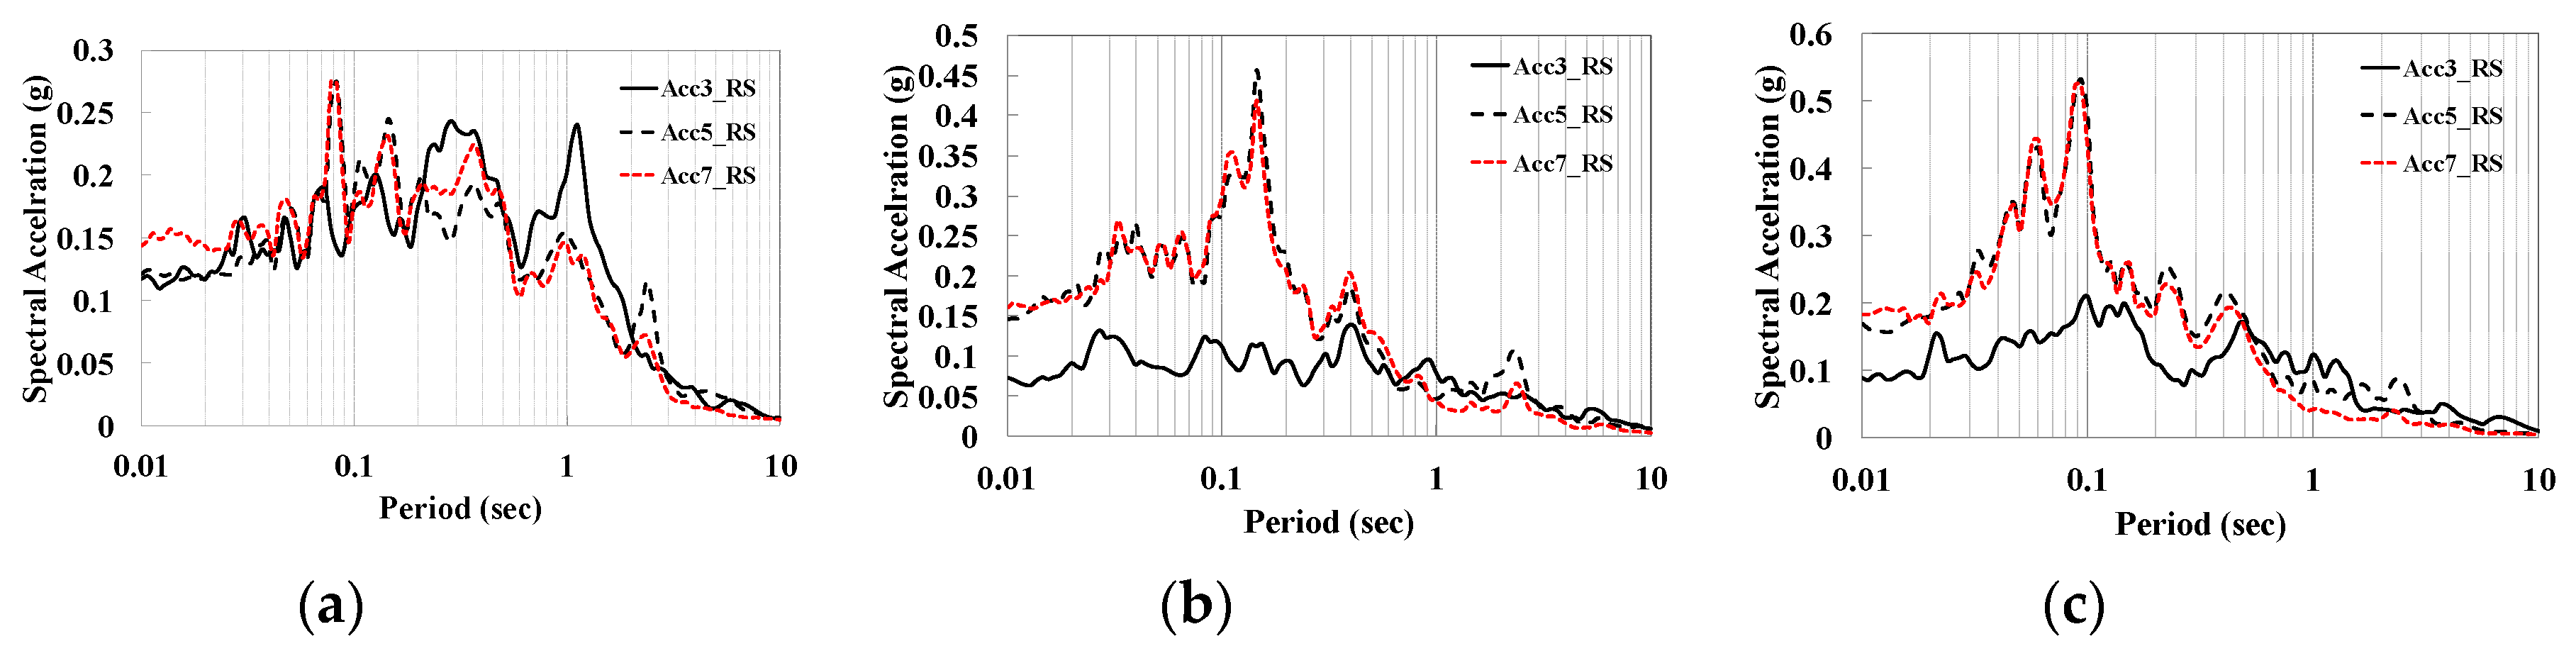
3.2. Response Spectra Analysis

The response spectra were analyzed using the input waves and the response acceleration results. The acceleration response spectrum graphically depicts acceleration as a function of natural period, the theory behind which is discussed in detail in [33,34] and therefore not presented in this paper. The response spectra of the measured accelerations are shown in Figure 9; Figure 10, which show the response spectra in the interior of the ground and on the ground surface, respectively. As shown in Figure 9, the response spectrum obtained from A2 is the smallest of all seismic waves. This indicates the maximum acceleration reduction occurs at the position farthest from the crushed stone without amplification of the response spectrum. The greatest response was found in A6, which was closest to the crushed stone foundation wall, as it was located between the wall strips. For the long-period Hachinohe-type seismic wave, A4 and A10 showed similar responses, and for the short-period Northridge- and Loam Prieta-type seismic waves, A6 and A8 exhibited similar responses. These different responses inside and outside the crushed stone wall strips indicate that the influence of the long-period seismic wave is larger than that of the short-period seismic waves. From the response spectrum curves given in Figure 10, the response level obtained from A3 (positioned the farthest distance from the foundation wall) was the smallest for the short-period seismic waves, while no significant differences were observed in the response level for the long-period seismic wave. Note that similar response spectra tendencies at the inside (A7) and outside (A5) of the foundation wall for the short-period seismic waves were observed. Although the long-period Hachinohe-type seismic wave induced similar response spectrum tendencies inside and outside, this similarity was less significant than for the short-period seismic waves. The reason that the response spectrum of A3 was small under the short-period waves is that the natural period of the ground was shifted into the short-period region due to the increase in the ground stiffness around the crushed stone wall. However, A3, which was the furthest from the foundation wall, was not as strongly affected as A5 and A7 near the foundation wall. Figure 10 shows the response spectra at the ground surface for all three input motions. By comparing the results shown in Figure 3 and Figure 10, a considerable difference between the shape of the A3 response spectrum (located away from the foundation wall) and the input wave motions can be observed, while the shapes of the response spectra near the crushed stone foundation wall at A5 and A7 were the most similar to the input seismic waves. The ground was obviously affected by the installed structure; when a ground structure such as crushed stone is installed, the ground stiffness clearly changes, affecting both the acceleration and response spectrum.
Therefore, in the design of soil-structures for a foundation wall, it is necessary to consider the changes in the response characteristics both in the interior of the ground and on the ground surface due to the effect of the crushed stone.

4. Conclusions

In order to analyze the performance of crushed stone foundation wall-improved soil under various seismic waves, 1 g shaking table experiments were performed. The conclusions of the study are as follows:
(1)
Acceleration was observed to be damped from the outside rather than the inside of the foundation wall. The increase in ground stiffness due to the crushed stone wall caused the natural period of the ground to shift into the short-period region. The acceleration inside the foundation was accordingly larger than that outside the foundation.
(2)
The distance from the crushed stone was not observed to have a significant influence on ground acceleration under long-period seismic motions. However, the distance from the crushed stone did affect the ground acceleration under short-period seismic motions. Due to the change in the natural period of the ground, acceleration was affected more by short-period seismic motions, and the acceleration changes according to distance can be observed through the obtained slopes of the acceleration–distance curves.
(3)
As the distance from the foundation wall increased, the acceleration amplification ratio decreased for all seismic waves. A similar trend in the acceleration amplification ratio of the short-period Northridge- and Loma Prieta-type seismic waves was observed. However, the long-period Hachinohe-type wave exhibited a smaller amplification ratio–distance slope. The effect of the distance from the foundation wall on acceleration amplification was therefore found to be insignificant.
(4)
The difference in responses inside and outside the crushed stone foundation wall strips was found to be larger for long-period seismic waves than for short-period seismic waves. The shape of the response spectrum obtained from the accelerometer positioned farthest away from the crushed stone foundation wall was noticeably different than that of the input seismic waves, while the response spectra around the crushed stone foundation wall were observed to be similar to the input seismic waves.
(5)
The ground was obviously affected by the installation of the crushed stone structure. When a ground structure such as a crushed stone wall is installed, the period changes due to the change in the ground stiffness, as do the acceleration and response spectra values. When designing the soil-structure for a foundation wall, it is therefore necessary to appropriately consider the effect of the installed crushed stone.
These conclusions can be used to inform the design of soil improvements and the structures built atop them. Note that in this study, the acceleration and spectral behaviors of the crushed stone wall were analyzed and an acceleration variation equation according to the distance from the crushed stone wall was proposed. In the future, dynamic characteristics due to various parameters of the crushed stone wall can be further understood by analyzing the influence(s) of various parameters such as wall thickness, soil deposition conditions, and the presence of a superstructure.

Author Contributions

Conceptualization and methodology, S.-W.S. and J.-M.K.; investigation and analysis, S.-W.S.; writing—original draft preparation, S.-W.S.; writing—review and editing, J.-M.K., P.B., and S.-W.S.; supervision, J.-M.K.

Funding

This paper was financially supported by the National Research Foundation of Korea (NRF-2017R1A2B4010201 and NRF-2018R1A6A3A01011077) and the Ministry of the Interior and Safety as Earthquake Disaster Prevention Human resource development Project.

Conflicts of Interest

The authors declare no conflict of interest.

References

  1. Das, B.M.; Shin, E.C. Strip Foundation on Geogrid-Reinforced Clay: Behavior Under Cyclic Loading. Geotext. Geomembr. 1994, 13, 657–667. [Google Scholar] [CrossRef]
  2. Kamath, K.; Divya, N.; Rao, A.U. A study on static and dynamic behavior of outrigger structural system for tall buildings. Bonfring Int. J. Ind. Eng. Manag. Sci. 2012, 2, 15–20. [Google Scholar] [CrossRef]
  3. Delgadillo, R.; Zonno, G.; Boroschek, R.; Lourenco, P.B.; Aguilar, R. Study of the Environmental Influence on the Dynamic Behavior of Adobe Walls: Preliminary Test in Laboratory Specimens. In Proceedings of the International Conference on Experimental Vibration Analysis for Civil Engineering Structures, San Diego, CA, USA, 12–14 July 2017; pp. 758–769. [Google Scholar]
  4. Yoo, K.S. Compaction Characteristics of Crushed Stones by Cyclic Load. Proc. KSCE J. Civ. Eng. Conf. 2003, 10, 4055–4058. [Google Scholar]
  5. Lee, S.W.; Youn, C.M.; An, H.H.; Seo, B.W. Interface shear strength between crushed stone and geotextile. J. Kor. Geosynth. Soc. 2006, 5, 33–38. [Google Scholar]
  6. Shim, W.B.; Kwon, Y.G.; Hong, K.N.; Han, S.H. Comparison of Shape Characteristics between Coarse Aggregate by Computational Dynamic Generation Modeled and Crushed Stone. Proc. Korea Concr. Inst. Fall Conf. 2013, 10, 785–786. [Google Scholar]
  7. Seed, H.B.; Idriss, I.M. Analysis of Soil Liquefaction: Niigata Earthquake. J. Soil Mech. Found. 1967, 93, 83–108. [Google Scholar]
  8. Seed, H.B.; Idriss, I.M. Simplified Procedure for Evaluating Soil Liquefaction Potential. J. Soil Mech. Found. Div. 1971, 97, 1249–1273. [Google Scholar]
  9. Seed, H.B.; Lee, K.L.; Idriss, I.M.; Makdisi, F.I. The Slides in the San Fernando Dams During the Earthquake of February 9, 1971. J. Geotech. Eng. Div. 1975, 101, 651–688. [Google Scholar]
  10. Seed, H.B.; Booker, J.R. Stabilisation of Potentially Liquefiable Sand Deposits Using Gravel Drain Systems; Report No. EERC76-10; U.C. Berkeley: Berkeley, MA, USA, 1976. [Google Scholar]
  11. Baez, J.I. A Design Model for the Reduction of Soil Liquefaction by Vibro Stone Columns. Ph.D. Thesis, University of Southern California, Los Angeles, CA, USA, 1995. [Google Scholar]
  12. Goughnour, R.R.; Pestana, J.M. Mechanical Behavior of Stone Columns Under Seismic Loading. In Proceedings of the 2nd International Conference on Ground Improvement Techniques, Singapore, 7–10 October 1998; pp. 157–162. [Google Scholar]
  13. Timothy, C.S.; William, M.C.; Chang, C.C.; Marcos, L. Site response of improved ground in the coastal eastern United States. In Proceedings of the 4th International Conference on Ground Improvement Techniques, Kuala Lumpur, Malaysia, 26–28 March 2002. [Google Scholar]
  14. Adalier, K.; Elgamal, A.; Meneses, J.; Baez, J.I. Stone columns as liquefaction countermeasure in non-plastic silty soils. Soil Dyn. Earthq. Eng. 2003, 23, 571–584. [Google Scholar] [CrossRef]
  15. Adalier, K.; Elgamal, A. Stone Column Remediation of Liquefiable Silty Marine Foundation Deposits. In Proceedings of the Twenty-first International Offshore and Polar Engineering Conference, Maui, HI, USA, 19–24 June 2011; pp. 686–691. [Google Scholar]
  16. Adalier, K.; Elgamaz, B. Mitigation of liquefaction and associated ground deformations by stone columns. Eng. Geol. 2004, 72, 275–291. [Google Scholar] [CrossRef]
  17. Zhan, Y.; Jiang, G.; Yao, H. Dynamic characteristics of saturated silty soil ground treated by stone column composite foundation. Adv. Mater. Sci. Eng. 2014. [Google Scholar] [CrossRef]
  18. Buckingham, E. On Physically Similar Systems; Illustrations of the Use of Dimensional Equations. Phys. Rev. 1914, 4, 345–376. [Google Scholar] [CrossRef]
  19. Ling, X.Z.; Wang, C.; Wang, C. Scale modeling method of shaking table test of dynamic interaction of pile-soil-bridge structure in ground of soil liquefaction. Chin. J. Rock Mech. Eng. 2004, 23, 450–456. [Google Scholar]
  20. Kim, J.M.; Lee, H.J.; Ryu, J.H. Seismic response of stone column-improved soft clay deposit by using 1g shaking table. J. Kor. Geotech. Soc. 2010, 26, 61–70. [Google Scholar]
  21. Kim, J.M.; Ryu, J.H.; Kim, M.N.; Son, S.W. 1g shaking table test on soil and stone-column interaction behavior under seismic loading. J. Korean Geotech. Soc. 2012, 28, 115–124. [Google Scholar] [CrossRef]
  22. Castro, J. Modeling stone columns. Materials 2017, 10, 782. [Google Scholar] [CrossRef]
  23. Kardgar, H. Investigation of the bearing capacity of foundations on encased stone columns using finite element method. Int. J. Integr. Eng. 2018, 10, 103–108. [Google Scholar] [CrossRef]
  24. Das, M.; Dey, A.K. Prediction of bearing capacity of stone columns placed in soft clay using ANN model. Geotech. Geol. Eng. 2018, 36, 1845–1861. [Google Scholar] [CrossRef]
  25. Kim, J.M.; Ryu, J.H.; Son, S.W.; Na, H.Y.; Son, J.W. A comparative study on dynamic behavior of soil containers that have different side boundary conditions. J. Kor. Geotech. Soc. 2011, 27, 107–116. [Google Scholar] [CrossRef]
  26. Kramer, S.L. Geotechnical Earthquake Engineering; Prentice Hall: Upper Saddle River, NJ, USA, 1996. [Google Scholar]
  27. Meymand, P.J. Shaking Table Scale Model Tests of Nonlinear Soil-Pile-Superstructure Interaction In Soft Clay. Ph.D. Thesis, University of California, Berkeley, MA, USA, 1998. [Google Scholar]
  28. Iai, S. Similitude for Shaking Table Tests on Soil-Structure-Fluid Model In 1g Gravitational Field. Jpn. Soc. Mech. Found. Eng. Soils Found. 1989, 29, 105–118. [Google Scholar] [CrossRef]
  29. Gibson, A.D. Physical Scale Modeling of Geotechnical Structures at One-G. Ph.D. Thesis, California Institute of Technology, Pasadena, CA, USA, 1996. [Google Scholar]
  30. Kagawa, T. On the Similitude in Model Vibration Tests of Earth Structures, Soil Mechanics and Foundation Engineering. Proc. Jpn. Soc. Civ. Eng. 1978, 275, 69–77. [Google Scholar] [CrossRef]
  31. Kokusho, T.; Iwatate, T. Scaled model tests and numerical analyses on nonlinear dynamic response of soft grounds. Proc. Jpn. Soc. Civ. Eng. 1979, 285, 57–67. [Google Scholar] [CrossRef]
  32. Rocha, M. The Possibility of Solving Soil Mechanics Problems by the Use of Models. 1958, 183–188. Available online: https://www.issmge.org/uploads/publications/1/41/1957_01_0041.pdf (accessed on 15 May 2019).
  33. Chopra, A.K. Dynamic of Structures, Theory and Apllications to Earthquake Engineering; Prentice Hall: New Jersey, NJ, USA, 1995. [Google Scholar]
  34. Hashash, Y.M.A.; Musgrove, M.I.; Harmon, J.A.; Groholski, D.R.; Phillips, C.A.; Park, D. DEEPSOIL 6.1, User Manual; University of Illinois at Urbana-Champaign: Urbana, IL, USA, 2016. [Google Scholar]
Figure 1. Ground and foundation installation: (a) clay and crushed stone foundation construction, and (b) finished setup.
Sustainability 11 02767 g001
Figure 2. Experiment setup.
Sustainability 11 02767 g002
Figure 3. Input motion: (a) Hachinohe-type acceleration time history, (b) Loma Prieta-type acceleration time history, (c) Northridge-type acceleration time history, (d) Hachinohe-type response spectrum, (e) Loma Prieta-type response spectrum, and (f) Northridge-type response spectrum.
Sustainability 11 02767 g003
Figure 4. Acceleration time history for the long-period Hachinohe-type seismic wave (0.3 g): (a) input motion, (b) A2, (c) A3, (d) A4, (e) A5, (f) A6, (g) A7, (h) A8, (i) A10.
Sustainability 11 02767 g004
Figure 5. Acceleration time history for the short-period Northridge-type seismic wave (0.3 g): (a) input motion, (b) A2, (c) A3, (d) A4, (e) A5, (f) A6, (g) A7, (h) A8, (i) A10.
Sustainability 11 02767 g005
Figure 6. Acceleration time history for the short-period Loma Prieta-type seismic wave (0.3 g): (a) input motion, (b) A2, (c) A3, (d) A4, (e) A5, (f) A6, (g) A7, (h) A8, (i) A10.
Sustainability 11 02767 g006
Figure 7. Acceleration according to distance from the foundation wall at the (a) ground surface and (b) ground interior.
Sustainability 11 02767 g007
Figure 8. Acceleration amplification ratio according to distance from the foundation wall at the (a) ground surface and (b) ground interior.
Sustainability 11 02767 g008
Figure 9. Response spectra in the ground interior for the (a) Hachinohe-type, (b) Northridge-type, and (c) Loma Prieta-type seismic waves.
Sustainability 11 02767 g009
Figure 10. Response spectra on the ground surface for the (a) Hachinohe-type, (b) Northridge-type, and (c) Loma Prieta-type seismic waves.
Sustainability 11 02767 g010
Table 1. Similitude law for a 1 g shaking table model test [28].
Generalized ParameterType 3
λε = 1, λρ = 1
LengthΛλ7
Densityλρ11
Time(λλε)0.5λ0.52.65
Acceleration111
Velocity(λλε)0.5λ0.52.65
Displacementλλελ7
Stressλλρλ7
Strainλε11
Stiffnessλλρελ7
Table 2. Material properties of the ground model.
ParameterClayCrushed Stone
Undrained shear strength (kPa)510
Unit weight (kN/m3)1622

