Abstract
In order to ensure optimal and secure functionality of Micro Grid (MG), energy management system plays vital role in managing multiple electrical load and distributed energy technologies. With the evolution of Smart Grids (SG), energy generation system that includes renewable resources is introduced in MG. This work focuses on coordinated energy management of traditional and renewable resources. Users and MG with storage capacity is taken into account to perform energy management efficiently. First of all, two stage Stackelberg game is formulated. Every player in game theory tries to increase its payoff and also ensures user comfort and system reliability. In the next step, two forecasting techniques are proposed in order to forecast Photo Voltaic Cell (PVC) generation for announcing optimal prices. Furthermore, existence and uniqueness of Nash Equilibrium (NE) of energy management algorithm are also proved. In simulation, results clearly show that proposed game theoretic approach along with storage capacity optimization and forecasting techniques give benefit to both players, i.e., users and MG. The proposed technique Gray wolf optimized Auto Regressive Integrated Moving Average (GARIMA) gives 40% better result and Cuckoo Search Auto Regressive Integrated Moving Average (CARIMA) gives 30% better results as compared to existing techniques.
1. Introduction
Despite the ever increasing economic development attained by the world, many challenges are being faced in context of environmental inefficiency, environmental pollution, etc. With the passage of time, energy demand rises and infrastructure needs to be upgraded. Therefore, new power grid is required, that enhances power supply as well as it integrates renewable energy resources. In order to overcome such challenges, Smart Grid (SG) is brought to the light [1,2,3,4]. Demand Response (DR) is a crucial component of SG technology that tends to maintain the balance among electricity supply and demand using peak load shaving [5]. Real Time Pricing (RTP) is an efficient mechanism among all the schemes that are included in DR [6]. Monopoly of energy generation companies that are owned by the state causes pricing schemes to be ineffective for enabling the user to be actively involved in trading process of energy [7]. In order to focus on these issues, energy Internet is considered as one of the key enablers of third industrial evolution [8]. Energy Internet is considered as new paradigm shift for user and generation system [9]. By analogy with Internet properties, complete framework is offered by energy Internet for integration of each equipment that performs energy production, issuance, transformation, storage and usage with basic Information and Communication Technologies (ICT) [10]. Standard and modular energy units, i.e., solar panel, wind turbine, hydrogen, fuel cell, biomass and storage system can be operated by plug and play modules [11]. Open standard based communication protocol are added in plug and play paradigm to enhance the capability and interoperability for many products, technologies, systems and solutions, which construct energy Internet. In this new evolving paradigm, the supplier and consumer are connected very closely and promptly because of implementing distributed and flexible systems [12]. Moreover, energy consumer with co-located energy provisioner formulates local Internet of energy. Where, MG relieves the stress at reasonable degree, that is caused by increasing energy demands. MG is considered as one of the reliable networks for establishing connection between renewable resources and consumers along with managing storage units [13]. It can either be treated as controllable load or production system and can work in connection with grid. Nevertheless, owing to intermittent and changing nature of renewable energy resources, restricted energy generation capacity and greater dependency of MG on uncontrolled renewable energy resources lead to high level of fluctuation and disturbance of the system. For example, the state of unreliability that is brought by renewable energy resources will cause significant difference between production and demand, which rises several issues regarding power imbalance, voltage instability and frequency instability [14]. Thus, energy management techniques are needed to harness in order to reduce energy supply demand imbalance. To achieve ideal economic performance by MG while ensuring reliability, various factors involve in energy Internet. It includes conventional fossil fuel based dispatch able generators and renewable energy based distributed producers. It is clearly non feasible to take each detail into account as it increases computational complexity dramatically. However, small uncertainty that rises from implementation or estimation in real world energy management system makes the system completely incomprehensible in practical point of view [15]. For instance, considering MG with Photo-Voltaic Cell (PVC), solar radiations suddenly become intense at day time. That will increase generation of MG at certain time [16]. Similarly in case of wind turbine, speed of wind goes up any time and become stronger, which will cause grid frequency goes up [14]. Therefore, dynamics of energy generation behavior of renewable resources can not be ignored [17,18,19]. Literature work is restricted to limited application of MG, where real world data is not considered while managing energy distribution. However, comprehensive framework is required to improve energy management of real world data. Moreover, the prior statistical knowledge of uncertain renewable resources energy production was considered to be precisely known and power trade among various market players is completely neglected This is the motivation behind proposed algorithm that performs distributed energy management along with integration of linear forecasting techniques, which makes proposed system more effective and reliable.
To utilize renewable energy resources effectively, Distributed Energy Management (DEM) algorithm has been proposed that optimizes payoff of each player, i.e., users and MG. In order to overcome the uncertainties that are caused by renewable resources, forecasting techniques have been proposed, i.e., Gray wolf optimized Auto Regressive Integrated Moving Average (GARIMA) and Cuckoo search Auto Regressive Integrated Moving Average (CARIMA). In DEM, GARIMA forecasting data has been used for energy management as it performs more efficiently as compared to CARIMA in current scenario. List of acronyms and list of symbols used in this paper are shown in table at the end of this paper.
This work is an extension of [20]. Whereas, remaining paper has following organization. Section 2 discusses related work regarding load forecasting and game theory. Section 3 gives details of problem statement and contribution. Section 4 explains method and material regarding proposed forecasting techniques and game theory. It includes DEM algorithm for optimization of MG and users cost. Section 5 explains simulations results of proposed techniques. Finally, Section 6 provides conclusion of presented work.
2. Related Work
Proposed work focuses to solve distributed energy management at Micro Grid (MG) level in energy Internet, using both game theory and data analytics techniques. There is recent surge in data analytics that introduces mathematical tool, which addresses uncertainties [21]. While managing energy, two main methodologies are used, i.e., stochastic optimization and robust optimization. These are widely used to handle data uncertainties [22]. Stochastic optimization in energy management solutions is considered as one of the effective techniques for optimization of statistical objective function. In case, the undefined numerical data has to be assumed in order to follow well-known probability distribution. Real time energy management techniques that are having stochastic optimization are proposed to reduce operational cost [23]. In [24], multistage framework is proposed in order to reduce the cost of total energy system that is based on stochastic optimization. In order to cater multi dimensional energy management stochastic dynamic programming methods are used [25]. Nonetheless, the precise calculation of probability distribution of the data that is not certain may get tremendous challenge in practical applications, which considers complex operation details and various complex constraints. Optimality performance is affected by impact of data uncertainties. However, it is not cater for in energy management approaches that contain stochastic optimization.
Robust optimization based energy management approaches merely rely on limited information and enable distribution free model for uncertainties [26]. In energy management system, worst case operation scenario is considered in optimization process. Consequently, energy management approaches can remove the negative impact of uncertainty in optimality performance. Thus, it outperforms the stochastic optimization. Novel pricing strategy is proposed, which promotes robustness against uncertainties of power input [27]. Nonetheless, the robust version of controllable electric load management issues are not ensured to be tractable that relies on appropriate design for objective function modeling and building of uncertainty set.
Ever since the growing advancement in the field of advance ICT, large amount of data is collected regarding consumer behavior, states of battery, substations, customer devices, distributed energy resources, renewable output, weather conditions, video surveillance, etc. [28]. The energy generation using PVC is considered to be one of the important components of electricity sector. It is also attaining attention of government because of increasing environmental issue and being cost effective. In [29], it is stated that PVC energy will be responsible to fulfill 16% of total energy consumption. PVC energy relies on solar radiation does not remain constant always. The intermittent nature of PVC energy is experienced because of position of sun and movement of clouds at particular position. It causes variation at any point in time within a day. Subsequently, it can be predicted accurately in a year. Information of solar energy is greatest concern for operator and planners of electrical system. Hence, there is sheer need of forecasting PVC power generation [30] using machine learning techniques. Forecasting models that are mainly used for prediction of electrical load and the renewable energy resources are defined under three categories, i.e., statistical model: Auto Regressive (AR), Exponential Smoothing (ES) models [31], Artificial Intelligence (AI) Model: Neural Network (NN), Convolution Neural Network (CNN), Hybrid Models: neuro fuzzy models [32,33]. As a case study, electricity demand of 10 countries are taken into account in order to analyze these methods. In [34] 5 different forecasting techniques are used, i.e., multi model, iterative, single model multivariate forecasting are analyzed in detail. It also covers issues such as NN designing, implementation and validation. In [35], a combination of NN and Enhanced Particle Swarm Optimization (PSO) are used in order to perform power forecasting. It focuses on feature selection. PVC generation is affected by many factor apart of solar radiations. It may be affected by cloud movement, location of sun, etc. Nevertheless, time series of power generation by PVC contains many well defined patterns such as there are peaks at afternoon and off peak in morning and evening. Subsequently, there is no generation at night timings. Therefore time series patterns can not be ignored [36]. Auto Regressive Integrated Moving Average (ARIMA) is used for univariate time series forecasting because solar generation tends to follow specific pattern and it is proven to be efficient on account of flexibility. It also performs its orderly searching at every level. Thus it determines best fit model for particular time series. Optimization of parameters has significant impact on the performance of forecasting algorithms. Meta heuristic techniques are applied on many forecasting techniques, i.e., ARIMA [37] Neural Network (NN) [38], Support Vector Regression (SVR) [39] in literature for improving performance. Game theory concept is widely applied on MG energy management studies. It provides distributed self organizing and self optimizing solution of the problem having conflicting objective function.In broader aspect, game theory is characterized in two categories in context of players. One category includes players with binding agreement among them. Second category includes those players who are not having binding agreement among them [40]. In non cooperative game theory, main focus is on predicting individual strategies and it also asses players that make decisions to find Nash Equilibrium (NE). It provides framework for performing analytical framework, i.e., DEM that is devised for characterizing the interaction among players and decision making process to achieve NE. The strategic outcome among players can be improved under mutual commitment.
In order to handle non cooperative game theory based energy management, multi user based Stackelberg game is used to optimize the payoff of each player [41]. In [42], multi stage market model is proposed, that is based on cooperative game to reduce the cost of utility, whereas it maximizes the total profit of the market. In order to cater dispatch problem in integration of renewable resources generation and energy storage, a cooperative distributed energy scheduling algorithm was proposed in [43].
3. Problem Statement and Contributions
Tomake efficient use of renewable resources, this paper focuses on distributed energymanagement problem. It aims to maximize objective function of each player and satisfying user demand of electricity and guaranteeing reliable system operations. Due to uncontrollable and uncertain nature of energy generation by renewable resources [44], we used electricity generation forecasting techniques to get short term prediction value. Afterwards, distributed MG energy management problem has been addressed using non cooperative game theory as it ignores common commitment of players and it contains low communication overhead [40]. Optimization of storage capacity in MG has vital role in context of efficient management of electric load, which has also been addressed in this paper. Following are the contributions of our work:
- Game theory and data-centric approaches are adapted in order to address MG electric load management problem. In order to overcome uncertainties caused by PVC generation, linear forecasting technique ARIMA has been used for forecasting. Parameters of ARIMA, i.e., AR and Moving Average (MA) are optimized through GWO and named as GARIMA,
- Energy management problem has been solved using two stage Stackelberg game theory to capture the dynamic interaction and interconnection among users and MG. Where, MG acts as a leader and users act like followers. Besides, if there exist a scenario where energy demand of users increases as compare to MG capacity of energy generation, MG purchases energy from utility. Furthermore, energy cost of MG has also been reduced by using energy storage mechanism,
- Two proposed techniques, i.e., GARIMA and CARIMA have been used for forecasting purpose. Parameters optimization of ARIMA has been performed using Gray Wolf Optimizer (GWO) and Cuckoo Search (CS) algorithm, where GARIMA gives better result as compare to CARIMA and other conventional techniques. Forecasting results of GARIMA technique are used in DEM algorithm in order to reduce uncertainties that are caused by renewable resources historic data and
- For non cooperative game of MG and users, existence of NE is proved using Stackelberg game theory. Furthermore, iterative DEM algorithm is proposed for MG to prove NE.
4. Material and Method
This section elaborates material and method regarding proposed system model. Two stage Stackelberg game theory in SG is presented in system model. Multiple residential users = along with single MG are taken into account. MG is taken as supplier of power in order to provide power stability to users. MG contains smart meter in order to help users to schedule their energy usage. It is also equipped with PVC storage system. PVC provides power to fulfill requirements of residential users and to charge the battery. Furthermore, surplus energy is sent to the utility as shown in Figure 1. After receiving price policy of utility from information network, users send demand to MG. In the presented system model, users have both shift able and non shift able loads. In order to perform energy usage scheduling at users side, single day is considered. represents each time slot in a day. In this scenario, the utility receives electricity demand from users for each time slots in a single day and real time price are communicated to users regarding each time slot in a day. where dataset shows time slots in a single day. MG sets its prices, to optimize the payoff, according to the demand of users in real time.
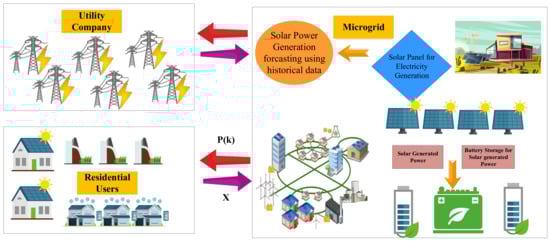
Figure 1.
Interaction among User and Micro grid.
4.1. Cost Model of Users
Let us assume, multiple users are considered in the proposed system model with a set of . Whole day is divided into time slots. represents energy utilization of n users that contains both shift able and non shift able load. Equations (1)–(6) have been taken from [45]. Daily energy consumption of load is explained with the help of equation below:
MG offers energy for daily load consumption. Lets assume is energy demand that is sent to MG by users in k time slots, where k . So that energy that is demanded by users from MG is written as:
Sum of the total amount of energy used by users is represented as:
In order to calculate Peak Average Ratio (PAR) of energy that is demanded by users. Peak consumption is represented as:
Average user consumption is calculated as:
Thus, PAR of total energy consumption by users is calculated as:
Cost function of user relies on type of pricing mechanism that has been formulated by MG. Effective pricing scheme should be employed by the utility and MG to encourage users to actively become a part of energy consumption scheduling planning. Which helps to make effective plan to charge electricity price from users. Following assumptions are made:
- MG is responsible for providing energy to user at any time. Hence, the cost function of user regarding energy consumption by user at any time slot k is function of energy consumption by users,
- In daily life, energy consumption by user at certain time slot is smooth function or at least it is piecewise smooth function and always increasing. Likewise, cost function of user follows the demand ,
- Cost function also depends on timings of energy consumption, apart of energy consumption by user.
Owing to the assumptions discussed above, quadratic cost function is used because it is non linear and strictly convex in nature. As it is mostly utilized in literature [40]. Thus, cost function of users is as follows [45]:
where, and are fixed parameters that have maximum value at peak demand hours. represents total cost of energy consumption by th user. Whereas, total cost of user is calculated as follows [45]:
where, represents energy price by MG at time slot k. Price model confirms that energy price increases as increase in energy consumption happens. Consequently, users are convinced to shift their daily load from on peak hour to off peak hours. Moreover, behavior of the user in different time slots regarding consumption of energy is also affected via modifying and . Total cost of user n in a day is calculated as:
where, represents energy demand of users except n user. Equation (9) clearly shows that cost function of user is directly dependent on consumption of energy. Consumption of energy can be managed by shifting demand of on peak demand hours to off peak hours. Hence, cost function of users can be reduced as:
4.2. MG Cost Model with Storage Capacity
For efficient energy management, MG and users are agreed upon the energy parameter in order to avoid any kind of conflict. Total amount of energy that is needed by all users is and the price is decided by MG in such way to maximize its cost function, i.e., . Likewise, is maximum storage required by MG to store the energy generated by PVC. Optimal solution must satisfy objective of both players, i.e., users and MG. Moreover, energy that is generated using PVC will be forecast, in order to decide energy price per time slot k effectively [35]. Total electricity that is demanded from the users has to be less or equal than electricity which is produced by MG as represented in equation below:
where, is the total capacity of the MG in time slot k. In order to complete energy trading successfully, both players of game, i.e., users and MG exchange messages among each other and both of them agree on the trading parameters.
However, energy demanded by total no. of users from MG m must satisfy following constraint:
where, represents amount of energy that is requested to utility, if renewable resources do not generate enough energy for fulfilling demand of users. is predicted energy that is generated by PVC explained in Section 4.3.1. We consider amount of energy, generated by PVC, in a single day. Moreover, price per unit energy is decided and announced by MG. In current scenario, is price that is charged by MG. Therefore, energy that is required by users should satisfy constraint given in Equations (11) and (12). The main challenge that is being faced by MG is to decide optimum energy prices and optimum battery storage to increase MG revenue.
Most of the hybrid systems, which contain both generation plant and renewable resources, are difficult to manage; specifically if storage system is placed with every user and resultantly surplus energy is supplied to the utility [45]. Therefore, it is required to have centralized system to formalize the mechanism which decides the distribution of energy among all stake holders. Distribution of energy is purely on the basis of generation and requirement basis. Assumption is made that generation of PVC is cheaper than conventional energy generation methods. MG prioritize the demand of users and to charge the batteries. While at second priority, surplus energy is to be transmitted back for generating revenue by trading. For MG, it is assumed that PVC generation is in time slot k. PVC power generation provides energy, that means surplus energy does not exist that can be sold back to utility. Where, represents PVC energy to be distributed among users to fulfill their demand. Whereas, depicts power that is needed to charge the battery. In case , MG is having extra energy which has been generated by PVC for selling. Profit of MG, that it generates when it sells surplus energy to the utility is represented as:
where, depicts the PVC power selling price in cents/kWh. Currently, profit generated by selling electricity to utility is in form of price subsidies that is provided by the government to MG. These days, subsidy standard is is 6.3 cents/kWh for distribution of energy [46]. Total cost of PVC generation is as follows:
where , and are cost parameters of MG with PVC power generation and represents the prediction of PVC power [47]. Whereas, shows prediction of power generated by PVC in next year and shows prediction error. F is chosen as penalty factor of prediction. Where, shows that payoff of MG is decreased if prediction result is not accurate. Hence, it causes restriction of power agreement in market.
PVC power often needs storage system because it has to store surplus energy once users requirements are fulfilled. Storage system is irreplaceable need for PVC energy generation. Then, MG will provide energy to users at demand peak hours. Where, utility charges more price from consumer, in order to reduce cost of MG. These days, number of types of batteries that are available in market, i.e., Sodium/Sulfur batteries, Zinc/Bromine batteries and lithium-ion batteries [48]. Each battery type has certain charging and discharging cycles depending on their material, technology and size. Afterwards, battery life is expired. Hence, depreciation cost needs to be taken under consideration. Battery cost function is either defined as quadratic function that is based on charging and discharging capacity or it is taken as linear function. In the proposed scenario, battery cost function is taken as linear function. Equations (15)–(23) are taken from [45]. It is assumed that is the battery capacity that is needed by MG and it may ranges within certain limits:
where and represent lower and upper limits of the battery capacity. Equation (16) gives daily depreciation cost function:
where represents cost of battery depreciation. Its unit is cents/kWh and it also maintains correlation with the material and type of the battery. shows linear increasing function that is based on total capacity of the storage. However, if storage of the battery is not enough to store generated PVC power, it will be waisted and consequently, the payment will be increased. Therefore, it is required to decide optimal capacity of the battery . Other parameters that have important role in storage optimization other than battery capacity parameters. Charging and discharging efficiency of battery are parameters that are required to be taken under consideration other than battery capacity parameters. It is assumed, and show battery charging and discharging efficiency. gives state of the battery for complete day. Battery capacity has also been defined. Hence, Equation (17) gives state of battery and capacity of battery inequality constraints:
and are variables that represent pattern of battery charging and discharging in each time slot in binary form. At one time, charging or discharging of the battery can be taken place that is given in Equation (18):
state of the energy of battery at any time slot k is given as under:
is amount of energy which is required to charge the battery from PVC generation. Besides, shows total energy to discharge the battery that is consumed while satisfying users requirement. Upper and lower limit of the battery must be satisfied while charging and discharging the battery. Hence, Equations (21) and (22) must be satisfied by the values of and .
shows total energy generated by PVC. It is on the basis of balancing principle, and represents energy stored by battery and is amount of energy received from utility or vice versa. It is shown as:
Energy management becomes complicated because of existence of PVC-battery storage. MG has to pay cost for PVC generation and depreciation cost of battery. Besides, MG generates revenue by selling energy to users and surplus energy to utility. Thus, the total cost of MG is calculated as:
where, represents energy that is demanded by from MG in time slot k. and are explained in Equations (13) and (15). Equations (13), (15) and (23) show total load of MG. In proposed scenario, if PVC power generation plant uses large battery that cannot be fully charged, consequently large amount of battery storage will be wasted, which affects daily cost of MG. Therefore, it is required to optimize battery storage capacity, so that it may be used optimally. Solar power generation fully charge it in working time. Solar generation provides energy for charging the battery in time slot k. Thus, battery obtains considering efficiency of charging. Which is shown as follows:
Furthermore,
where
The sole objective behind this work is to find an optimal battery capacity and best strategy for pricing of energy for the users so that daily cost of MG will be reduced:
where represents total amount of energy demanded by users and shows total storage capacity.
4.3. Game Formulation and Analysis
Single leader and multi follower Stackelberg game is proposed in [49] that studies communication between MG and users. Basically, multi player game is used in which MG, being leader decides price of power that has to be charged from users and optimal storage capacity of the battery. Whereas, users as a followers decide amount of energy to be demanded from MG. Proposed work is extension of the work related to game theory presented in [45]. Proposed game theory is shown in strategic form in equation below.
Strategic form of proposed game has following components:
- Users cost function shows cost of energy consumption that is received by users in time slot k,
- Whereas, captures the benefit that is gained by MG after supplying energy to set of users,
- defines price of energy that is defined by MG against each time slot k,
- define optimal storage capacity that is required to minimize the cost function of MG,
- Cost function of user: ,
- Cost function of MG: .
Nonetheless, MG tends to opt optimal price per unit energy. Thus, proposed algorithm reaches the NE. Where, leader, i.e., MG will utilize optimal amount of energy on the basis of given strategy and users will demand optimal amount of energy from MG. In this paper, proposed strategic form of proposed algorithm has been used to achieve NE for non cooperative game theory, if and only if cost function of MG, i.e., leader and cost function of users, i.e., follower ; must satisfy following inequalities shown as:
where, , are represented as price per unit time energy at NE that is finalized by MG for time slot k. Whereas, shows total storage capacity of battery after achieving NE. Similarly, is total energy that is requested by users for time period k.
In non cooperative game where multi level hierarchy is involved, pure solution for equilibrium is not ensured in every case. Therefore, DEM algorithm has been proposed to determine the presence of NE. Primarily, variational equality is considered to be more socially stable as compare to other equilibrium methods [41]. Each user is considered while determining variational equality as mentioned in [42].
Proposition 1.
In case of users nϵ, daily cost function is continuously differentiable in for price and electricity consumption by users . Therefore, strategy space of cost function of users is a non empty convex compact subset of a Euclidean space.
Proof.
It is continuously differentiable in because of consistent characteristics of the daily cost function . The Hessian of is positive semi definite. Resultantly, cost function of user n is convex in . Proposition 1 shows daily cost function is continuously differentiable. It is also convex in . Owing the fact, energy cost has continuous quadratic form in context of . Preposition 1 is prerequisite of Proposition 2. □
Proposition 2.
For ∀nϵ and time slot k ϵ , the NE of the non cooperative game exists and it is also unique.
Proof.
According to the proof already mentioned in [45], because cost function is convex in , the NE is proved to be present in non cooperative game as well as it is proven to be distinct. □
Proposition 3.
The distinct NE that is proven in Preposition 2 is Pareto optimality.
Proof.
Pareto optimality is defined as the opted strategy state where no player changes its payoff by updating the user’s strategies without affecting remaining user’s payoff [45]. As per proof of Proposition 2, non cooperative game has achieved NE among all users. Where, each user increases his payoff, which depends on others users strategy. Afterwards, no user can change its payoff without taking consent to modify other users strategies [48]. Subsequently, it is said that NE is achieved, i.e., Pareto optimality. Preposition 2 expresses that, there exist distinct NE of non cooperative game for fixed price of MG. Nonetheless, if price will be changed then the NE will be different. On the basis of Preposition 3, it depicts the strategy against energy consumption by users will reach to pareto optimality and each user cannot change its payoff without affecting payoff of others. □
Proposition 4.
For battery storage capacity ϵ and the energy consumption vector of MG. There is unique battery capacity . It is understood that there is specific value of cost with a certain battery capacity. It is also assumed that there is only specific battery capacity that can minimize MG cost . Proof of proposition is mentioned in [45].
From Propositions 1–3, it is clearly seen that non cooperative game is based on payoff function. It encourages residential user and MG to choose optimal strategy to minimize cost function of MG and user. Thus, payoff of follower and leader may be increased.
4.3.1. PVC Power Forecasting Algorithm
This section explains forecasting techniques to be further utilized in DEM.
: Forecasting is performed using this technique by utilizing historic values. represents lags of differenced series that is given in Equation (33) [50]; is known as lag of time series and prediction error, which is required to be subtracted in order to make it static that is termed as “integrated”. Non seasonal ARIMA model that is represented as [51], is given as under:
where represents actual values of time series and shows error at certain time t; and represent vectors based on values of and ; p and q are integers in vector and . Random errors is distributed with mean zero and constant variance . In order to find optimal results, three stage model was proposed: (i) Recognition of the model, (ii) Estimation and (iii) Diagnostic Checking of the proposed model [52].
: No. of potential and orders to be selected using Auto Correlation Function (ACF) and Partial ACF (PACF). In order to analyze stationarity of time series, famous method is used that includes Augmented Dickey Fuller (ADF) and Phillips-Perron unit root test. It considers null hypothesis. These tests ensure that time series is not stationary. Details related to these methods are already mentioned in literature.
: In this stage, all the parameters that are identified in stage 1 are estimated for the ARIMA model by using iterative least square. Akaike Information Criterion (AIC) and Bayesian Information Criterion (BIC) values are used to find best values in model as mentioned in [51] is given as under:
and
where M shows total no. of observation that are used for estimation of parameters and shows mean square error.
: Depending on ACF and PACF of the residual, in dependency of residual can be analyzed. If residual is according to white noise, residual of the model are proven to be random in nature. The sample space-time ACFs is required to be effectively zero.
In [50], Ljung-Box test is used on actual time series or to the residual. Null hypothesis is considered for fitting the model which shows that series is representing the noise, and the alternative hypothesis states that one or more autocorrelation till lag m are not zero. The test static is shown as under mentioned in [51]:
where M shows total no. of observations that are used to finalize the model and m represent total lags. The statistics go along with distribution having - level of freedom. Where, K shows number of parameters that are estimated in model and shows ACF of residual at lag k. In case it not appropriate, stage 1 is again used for recognition of another model.
Idea was given by Yang and Deb [53]. It is one of the latest meta heuristic techniques. It is also proven in recent studies that it works better than Genetic Algorithm (GA) and Particle Swarm Optimization (PSO). No. of and parameters are pre assumed + previously. Each parameter is individual in population, which contains respective solution from solution set. Functionality of CS is shown in Figure 2. First of all, the corresponding cost function of weight optimization should be taken out [38]. where, p and q are row of population matrix, which contain their best solution after optimization.
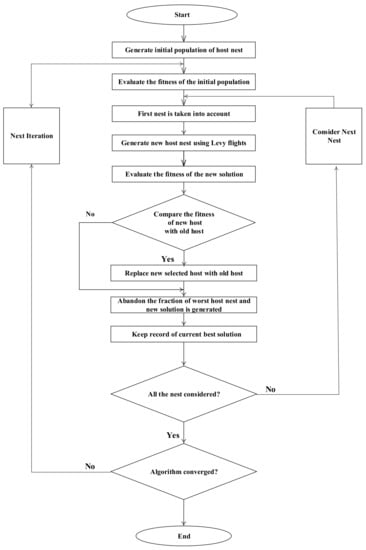
Figure 2.
Flow Diagram of CS Algorithm.
Mirjalili et al. proposed GWO in 2014. It is a meta heuristic technique, which mimics the leadership and hunting behavior of GWO. Grey wolves population consist of 4 types, i.e., alpha (), beta (), delta () and omega () [54,55]. Flow diagram of GWO algorithm is shown in Figure 3.
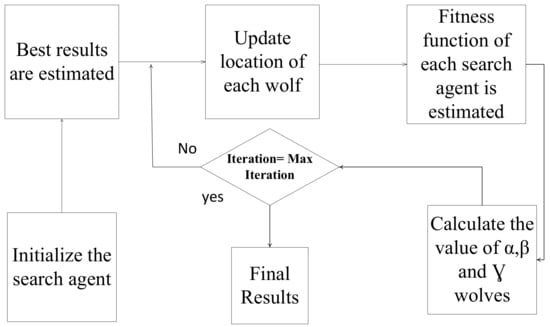
Figure 3.
Flow Diagram of GWO Algorithm.
Two proposed techniques are proposed, i.e., CARIMA and GARIMA, both of them perform better due to optimization of parameters. Simulation section proves that proposed forecasting techniques outperformed conventional techniques in predicting energy generation by PVC. However, GARIMA forecasting results outperformed CARIMA algorithm also. Therefore, GARIMA forecasting technique has been used in DEM algorithm to ensure accuracy of work.
Objective function is defined in order to evaluate parameters. It can either be mathematical or experimental function that will give desired output. Basically, function is based on subtraction of actual values with predicted value. In our proposed scenario, Root Mean Absolute Error (RMSE) and MAPE is termed as evaluation parameter and that is shown as:
where, is actual time series and is predicted time series.
After analyzing energy generation by PVC using prediction method, i.e., GARIMA and energy demand from users, MG tries to find optimum price and storage capacity of battery that is used to store the energy generated by PVC using DEM Algorithm. Each of them will be reached to NE as per different battery capacities and price. After comparing the daily cost corresponding to battery capacity, DEM selects best response strategy that will choose minimal cost . Further details are mentioned in Algorithm 1.
| Algorithm 1: Executed by MG |
 |
5. Simulation and Discussion
5.1. Data Description
In forecasting techniques, PVC power production data is used. Dataset is taken from Elia, Belgium’s electricity transmission system operator site [56]. Data contains 15 min interval power production of 5 years, January 2013 to December 2018.
5.2. Experimental Results
In this section, simulations are used in order to verify the effectiveness of game theoretic energy management using Stackelberg game theory. Apart of game theory, accuracy of PVC production forecasting has also been analyzed. Assumption is made that 6 users are connected to MG for getting supply of electricity. users have both shift able load and non shift able load, furthermore power consumption of users are shown in Figure 4. Single day is represented in form of 24 h time slots, i.e., k. Usage of electricity varies on the basis of peak demand hours, off peak demand hours and mid peak hours at each slot.
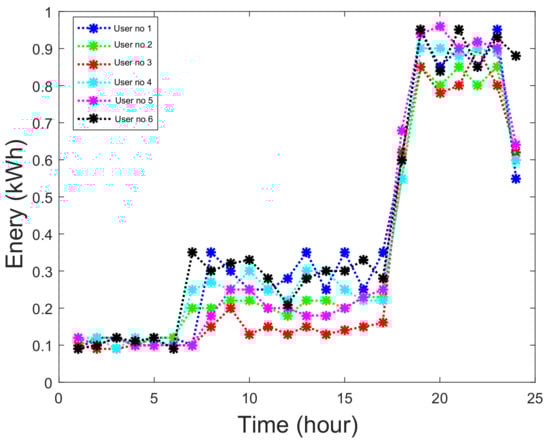
Figure 4.
Consumption of Users in 24 h.
Here, effectiveness of proposed game theory is analyzed between users and MG. th user can increase or decrease his payoff by adjustment of energy usage. Furthermore, MG focuses on optimization of payoff by announcing optimal energy price and size of the storage battery, i.e., .
In proposed work, pricing scheme that has been used is ToU. The whole day is split into 24 h time slots k. Moreover, single day is composed of three main chunks. Peak demand hours, off peak demand hours and mid peak demand hours make basis of chunks creation. Different pricing schemes are followed by pricing parameters.
User consumption is based on building and homes energy consumption. Each user is having 15 to 20 non shift able home appliances that cannot be shifted in any other hour of the day. Demand Side Management (DSM) has already been discussed in [45]. It has not been discussed for each user in our work. Unanimously, energy consumption by all users is considered. Nevertheless, energy distribution by MG, energy pricing and capacity of the battery have been discussed in detail. MG contains renewable resources, i.e., PVC in current scenario.
Figure 5 represents the energy distribution that is done by MG in time slots without game optimization. However, Figure 6 shows evenly energy distribution is being carried out among users, battery and utility, after equilibrium achieved by NE. Energy is received from utility, if solar radiations are not enough for production of PVC. Besides, in remaining hours power is optimally used that is generated by solar radiations and stored in battery. Figure 7 shows energy consumption in a single day by MG without incorporation of game theory and applying DEM using Table 1 and Table 2. Figure 8 shows solar power energy consumption by users, battery and company with game, which shows the evenly distribution of energy generated by PVC.
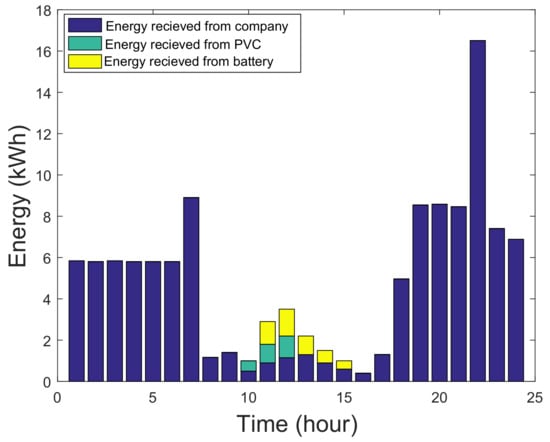
Figure 5.
Energy Distribution without Game.
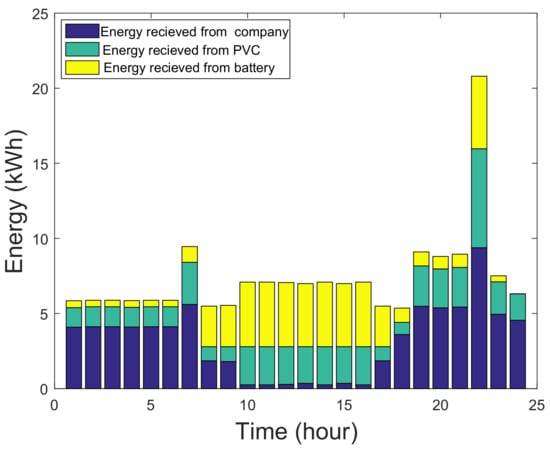
Figure 6.
Energy Distribution with Game.
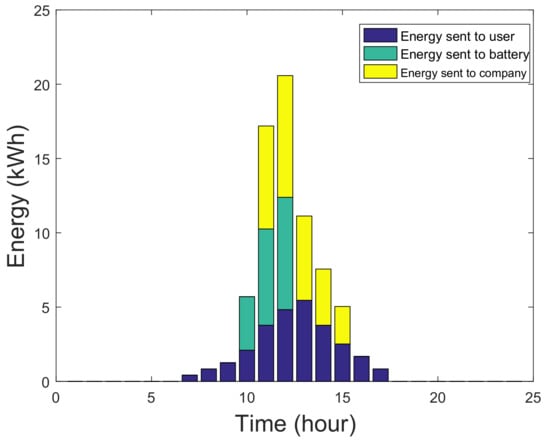
Figure 7.
PVC Energy Distribution without Game.

Table 1.
Pricing Model Parameter.
Table 2.
PVC Generation Storage Battery Parameters.
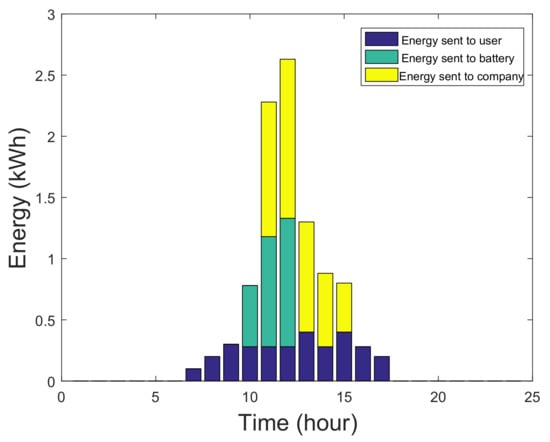
Figure 8.
PVC Power Generation using Game.
MG achieves maximum benefit from PVC power when sun light is present with full intensity. Once MG ensures energy supply to users, it also affects the battery capacity optimization. Nevertheless, proposed game theoretic energy management will not be affected by timings of day light and intensity. MG contains 2 kW PVC production capacity. Solar cells energy production per day is represented in Figure 9. PVC power is generated during 0600 to 1700 h. Parameters related to battery storage and charging and discharging are given in Table 1 and battery can be discharged at any time except charging hours. Cost of users depends on discharging time. It has minimal impact on the cost except battery discharges at peak demand hours, i.e., 17:00 to 22:00 h. In single hour, charging and discharging of the battery is 1.5 kWh [9]. Besides, 7.2 cents/kWh is battery charging and discharging efficiency [20]. In a current scenario, MG finds optimal solution for energy management using NE. To facilitate optimization and making error free prediction, MAPE is also brought under light. Figure 10 represents MAPE values of 5 forecasting algorithms that includes Back Propagation (BP), SVM, Genetic Stacked Auto Encoder (GSAE), CARIMA and GARIMA techniques. Step 1 shows that historical data is used for further forecasting PVC production. Data after forecasting is added in historical data and used for forecasting future PVC production is called as step 2 and so on. Figure 10 clearly shows that value of MAPE increases as forecasting steps increases. Simulation represents existing techniques as well as proposed techniques, i.e., CARIMA and GARIMA in Figure 10. Results are clearly shown in Figure 11a,b that GARIMA technique not only outperformed existing technique as well as second proposed technique, i.e., CARIMA in terms of RMSE in hourly and daily load forecasting. Results show actual and predicted results of proposed techniques. Hence, for achieving NE in game theory, GARIMA predicted results are used in DEM algorithm for performing energy management more efficiently.
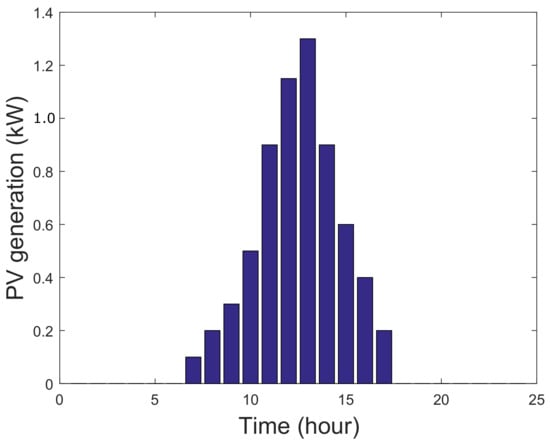
Figure 9.
PVC Power Generation in a Certain Day.
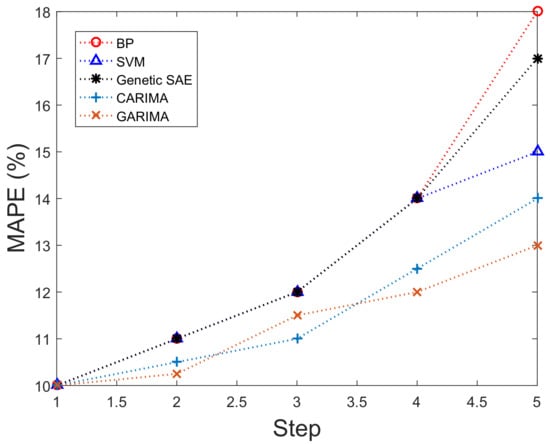
Figure 10.
MAPE of Five Different Models with PVC Power Forecasting Steps.
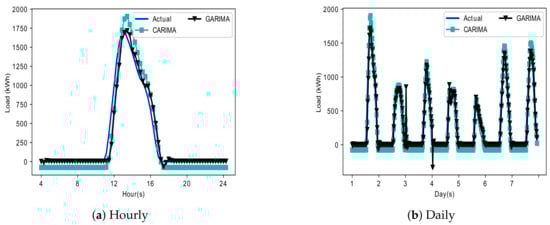
Figure 11.
PVC Generation Forecasting.
6. Conclusions and Future Work
In our work, energy management system has been presented that contains single MG and multiple users. In order to analyze game theory using proposed distributed algorithm, i.e., DEM, which represents the complete mechanism that how MG optimally decides price that has to be charged from users. Moreover, battery storage capacity is also optimized. The continuous non cooperative game theory is used to model interaction among MG and consumers. To ensure efficient use of PVC generated energ, short term PVC power production forecasting is performed. Two forecasting techniques are proposed, i.e., GARIMA and CARIMA. GARIMA forecasting results turned out to be better as compared to CARIMA and other conventional techniques in MAPE. The forecasting results are then used to analyze the impact on payoff of both players in game theory. In non cooperative scenario, Stackelberg game theory is used to prove NE among two players, i.e., users and MG. DEM algorithm has been proposed to prove NE among two players. Energy distribution among users after applying game theory gives better results as compared to results produced without applying game theory. Forecasting results of hourly and daily generated energy data also validate that GARIMA forecasting algorithm performs best as compared to CARIMA forecasting algorithm. Consequently, GARIMA forecasting data has been used in DEM in order to ensure precision in energy management. The future directions of our work will be focused on non cooperative energy management among multiple MGs. Apart of inclusion of multiple MG, no. of players in game will also be increased, i.e., utility in order to improve flexibility in the proposed system model. Multiple renewable resources will be considered for forecasting purpose in order to make the system dynamic in context of distributed energy management. In order to prove efficiency of DEM algorithm, comparison with existing energy management algorithm will be performed.
Author Contributions
A.N., N.J. and M.B.R. proposed, implemented and wrote heuristic schemes. A.H., M.A. and K.A. wrote rest of the paper. All authors together organized and refined the paper.
Acknowledgments
The authors extend their appreciation to the Deanship of Scientific Research at King Saud University for funding this work through research group NO (RG-1438-034).
Conflicts of Interest
The authors declare no conflict of interest.
Abbreviations
| Acronyms | |
| Abbreviations | Full Form |
| AR | Auto regressive |
| AI | Artificial intelligence |
| ARIMA | Auto Regressive Integrated Moving Average |
| ACF | Auto Correlation Function |
| ADF | Augmented Dickey Fuller |
| AIC | Akaike Information Criteria |
| BIC | Bayesian Information Criteria |
| BP | Back Propagation |
| CARIMA | Cuckoo Search Optimized ARIMA |
| CS | Cuckoo Search |
| CNN | Convolution Neural Network |
| DEM | Distributed Energy Management |
| DR | Demand Response |
| DSM | Demand Side Management |
| ES | Exponential Smoothing |
| GARIMA | Gray Wolf Optimized ARIMA |
| GSAE | Genetic Stacked Auto encoder |
| GA | Genetic Algorithm |
| GWO | Grey Wolf Optimization |
| ICT | Information and Communication Technology |
| MG | Micro Grid |
| MAPE | Mean Absolute Percentage Error |
| RMSE | Root Mean Square Error |
| NN | Neural Network |
| NE | Nash Equilibrium |
| PSO | Particle Swarm Optimization |
| PVC | Photo Voltaic Cell |
| PAR | Peak Average Ratio |
| PACF | Partial Auto Correlation Function |
| RTP | Real Time Pricing |
| RMSE | Root Mean Square Error |
| SG | Smart Grid |
| SVM | Support Vector Machine |
| ToU | Time of Use |
| Nomenclature | |
| Symbols | Descriptions |
| Actual Time Series | |
| Average User Consumption | |
| Charging Efficiency of Battery | |
| Constant Variance | |
| Cost Function of Users | |
| Cost Function of Micro Grid | |
| Daily Energy Usage of User | |
| Discharging Efficiency of Battery | |
| Daily Depreciation Cost Function | |
| Cost Function of User | |
| Error at Time t | |
| Energy Demand in Particular Slot | |
| Energy Demanded from Users | |
| Energy Required to Charge Battery | |
| Fixed Parameters | |
| Lower Limit of Battery Capacity | |
| Multiple Residential Users | |
| Micro Grid | |
| Mean Square Error | |
| Peak Consumption | |
| Profit of Micro grid | |
| F | Penalty Factor |
| Prediction Error | |
| Predicted Time Series | |
| Pattern of Battery Charging | |
| Pattern of Battery Discharging | |
| Real Time Price of Each Slot | |
| Sum of Total Energy | |
| Strategy Form | |
| Solar Power Selling Price | |
| s | State of Battery |
| Time Slots in a Period | |
| Total Energy Required to Discharge Battery | |
| Total Cost of Users | |
| T | Total no. of Observations |
| Total Cost of Solar Power Generation | |
| Test Static | |
| Upper Limit of Battery Capacity | |
| Vector Based on Rules of AR | |
| Vector Based on Rules of MA | |
References
- Huang, B.; Li, Y.; Zhang, H.; Sun, Q. Distributed optimal co-multi-microgrids energy management for energy internet. IEEE/CAA J. Autom. Sin. 2016, 3, 357–364. [Google Scholar]
- Wollenberg, B.F. Toward a smart grid: Power delivery for the 21st century. Power Energy Mag. 2005, 3, 34–41. [Google Scholar]
- Ahmad, A.; Javaid, N.; Mateen, A.; Awais, M.; Khan, Z. Short-Term Load Forecasting in Smart Grids: An Intelligent Modular Approach. Energies 2019, 12, 164. [Google Scholar] [CrossRef]
- Zahid, M.; Ahmed, F.; Javaid, N.; Abbasi, R.A.; Kazmi, Z.; Syeda, H.; Javaid, A.; Bilal, M.; Akbar, M.; Ilahi, M. Electricity Price and Load Forecasting using Enhanced Convolutional Neural Network and Enhanced Support Vector Regression in Smart Grids. Electronics 2019, 8, 122. [Google Scholar]
- Wang, Y.; Mao, S.; Nelms, R.M. Distributed online algorithm for optimal real-time energy distribution in the smart grid. IEEE Internet Things J. 2014, 1, 70–80. [Google Scholar] [CrossRef]
- Muralitharan, K.; Sakthivel, R.; Shi, Y. Multiobjective optimization technique for demand side management with load balancing approach in smart grid. Neurocomputing 2016, 177, 110–119. [Google Scholar] [CrossRef]
- Muratori, M.; Rizzoni, G. Residential demand response: Dynamic energy management and time-varying electricity pricing. IEEE Trans. Power Syst. 2016, 31, 1108–1117. [Google Scholar] [CrossRef]
- Rifkin, J. The Third Industrial Revolution: How Lateral Power Is Transforming Energy, the Economy, and the World; Macmillan: New York, NY, USA, 2011. [Google Scholar]
- Yi, P.; Zhu, T.; Jiang, B.; Jin, R.; Wang, B. Deploying Energy Routers in an Energy Internet Based on Electric Vehicles. IEEE Trans. Veh. Technol. 2016, 65, 4714–4725. [Google Scholar] [CrossRef]
- Xia, Z.; Chen, L.; Sun, X.; Liu, J. A multi-keyword ranked search over encrypted cloud data supporting semantic extension. Int. J. Multimed. Ubiquitous Eng. 2016, 11, 107–120. [Google Scholar] [CrossRef]
- Ellabban, O.; Abu-Rub, H.; Blaabjerg, F. Renewable energy resources: Current status, future prospects and their enabling technology. Renew. Sustain. Energy Rev. 2014, 39, 748–764. [Google Scholar] [CrossRef]
- Sato, T.; Kammen, D.M.; Duan, B.; Macuha, M.; Zhou, Z.; Wu, J.; Tariq, M.; Asfaw, S.A. Smart Grid Standards: Specifications, Requirements, and Technologies; John Wiley and Sons: Hoboken, NJ, USA, 2015. [Google Scholar]
- Uski, S.; Forssén, K.; Shemeikka, J. Sensitivity Assessment of Microgrid Investment Options to Guarantee Reliability of Power Supply in Rural Networks as an Alternative to Underground Cabling. Energies 2018, 11, 2831. [Google Scholar] [CrossRef]
- Zhang, Y.; Fu, L.; Zhu, W.; Bao, X.; Liu, C. Robust model predictive control for optimal energy management of island microgrids with uncertainties. Energy 2018, 164, 1229–1241. [Google Scholar] [CrossRef]
- Khalid, A.; Javaid, N.; Mateen, A.; Ilahi, M.; Saba, T.; Rehman, A. Enhanced Time-of-Use Electricity Price Rate Using Game Theory. Electronics 2019, 8, 48. [Google Scholar] [CrossRef]
- Nuño, E.; Maule, P.; Hahmann, A.; Cutululis, N.; Sørensen, P.; Karagali, I. Simulation of transcontinental wind and solar PV generation time series. Renew. Energy 2018, 118, 425–436. [Google Scholar] [CrossRef]
- Zhou, Z.; Bai, J.; Dong, M.; Ota, K.; Zhou, S. Game-theoretical energy management design for smart cyber-physical power systems. Cyber-Phys. Syst. 2015, 1, 24–45. [Google Scholar] [CrossRef]
- Ahmad, F.; Rasool, A.; Ozsoy, E.; Sekar, R.; Sabanovic, A.; Elitaş, M. Distribution system state estimation—A step towards smart grid. Renew. Sustain. Energy Rev. 2018, 81, 2659–2671. [Google Scholar] [CrossRef]
- Hussain, B.; Khan, A.; Javaid, N.; Hasan, Q.U.; Malik, S.A.; Dar, A.H.; Kazmi, A.; Ahmad, O. A Weighted-Sum PSO Algorithm for HEMS: A New Approach for the Design and Diversified Performance Analysis. Electronics 2019, 8, 180. [Google Scholar] [CrossRef]
- Naz, A.; Javaid, N.; Khan, A.B.M.; Iqbal, M.M.; ur Rehman Hashmi, M.A.; Abbasi, R.A. Game-Theoretical energy management for residential user and micro grid for optimum sizing of photo voltaic battery systems and energy prices. In Proceedings of the 33rd International Conference on Advanced Information Networking and Applications (AINA), Matsue, Japan, 27–29 March 2019; pp. 1097–1106. [Google Scholar]
- Farhath, Z.A.; Arputhamary, B.; Arockiam, L. A Survey on ARIMA Forecasting Using Time Series Model. Int. J. Comput. Sci. Mob. Comput. 2016, 5, 104–109. [Google Scholar]
- Wei, W.; Liu, F.; Mei, S.; Hou, Y. Robust energy and reserve dispatch under variable renewable generation. IEEE Trans. Smart Grid 2015, 6, 369–380. [Google Scholar] [CrossRef]
- Iqbal, Z.; Javaid, N.; Iqbal, S.; Aslam, S.; Khan, Z.; Abdul, W.; Almogren, A.; Alamri, A. A Domestic Microgrid with Optimized Home Energy Management System. Energies 2018, 11, 1002. [Google Scholar] [CrossRef]
- Chen, Z.; Wu, L.; Fu, Y. Real-time price-based demand response management for residential appliances via stochastic optimization and robust optimization. IEEE Trans. Smart Grid 2012, 3, 1822–1831. [Google Scholar] [CrossRef]
- Reka, S.S.; Ramesh, V. Demand side management scheme in smart grid with cloud computing approach using stochastic dynamic programming. Perspect. Sci. 2016, 8, 169–171. [Google Scholar] [CrossRef]
- Hu, W.; Wang, P.; Gooi, H.B. Toward optimal energy management of microgrids via robust two-stage optimization. IEEE Trans. Smart Grid 2018, 9, 1161–1174. [Google Scholar] [CrossRef]
- Cui, S.; Wang, Y.W.; Xiao, J.; Liu, N. A Two-Stage Robust Energy Sharing Management for Presumer Microgrid. IEEE Trans. Ind. Inform. 2018. [Google Scholar] [CrossRef]
- Lew, D.; Bird, L.; Milligan, M.; Speer, B.; Carlini, E.M.; Estanqueiro, A.; Flynn, D.; Gómez-Lázaro, E.; Holttinen, H.; Menemenlis, N.; et al. Wind and solar curtailment: International experience and practices. In Proceedings of the 12th International Workshop on Large-Scale Integration of Wind Power into Power Systems as Well as on Transmission Networks for Offshore Wind Power Plants, London, UK, 22–24 October 2013. [Google Scholar]
- Ibanez, E.; Brinkman, G.; Hummon, M.; Lew, D. A solar reserve methodology for renewable energy integration studies based on sub-hourly variability analysis. In Proceedings of the 2nd International Workshop on Integration of Solar Power in Power Systems Proceedings, Lisbon, Portugal, 12–13 November 2012. [Google Scholar]
- Mills, A.; Ahlstrom, M.; Brower, M.; Ellis, A.; George, R.; Hoff, T.; Kroposki, B.; Lenox, C.; Miller, N.; Stein, J.; et al. Understanding Variability and Uncertainty of Photovoltaics for Integration with the Electric Power System; No. LBNL-2855E; Lawrence Berkeley National Lab. (LBNL): Berkeley, CA, USA, 2009. [Google Scholar]
- Taylor, J.; McSharry, P. Short-term load forecasting methods: An evaluation based on European data. IEEE Trans. Power Syst. 2007, 22, 2213–2219. [Google Scholar] [CrossRef]
- Melin, P.; Soto, J.; Castillo, O.; Soria, J. A new approach for time series prediction using ensembles of ANFIS models. Expert Syst. Appl. 2012, 39, 3494–3506. [Google Scholar] [CrossRef]
- Potter, C.; Negnevitsky, M. Very short-term wind forecasting for Tasmanian power generation. IEEE Trans. Power Syst. 2006, 21, 965–972. [Google Scholar] [CrossRef]
- Hippert, H.; Pedreira, C.; Souza, R. Neural networks for short-term load forecasting: A review and evaluation. IEEE Trans. Power Syst. 2001, 16, 44–55. [Google Scholar] [CrossRef]
- Amjady, N.; Keynia, F.; Zareipour, H. Wind power prediction by a new forecast engine composed of modified hybrid neural network and enhanced particle swarm optimization. IEEE Trans. Sustain. Energy 2011, 2, 265–276. [Google Scholar] [CrossRef]
- Adamowski, K.; Dalezios, N.R.; Mohamed, F.B. Space-time ARIMA modeling for regional precipitation forecasting. J. Comput. Math. 1987, 5, 249–263. [Google Scholar]
- Ong, C.-S.; Huang, J.-J.; Tzeng, G.-H. Model identification of ARIMA family usinggenetic algorithms. Appl. Math. Comput. 2005, 164, 885–912. [Google Scholar]
- Yeh, W.-C.; Yeh, Y.-M.; Chang, P.-C.; Ke, Y.-C.; Chung, V. Forecasting wind powerin the Mai Liao wind farm based on the multi-layer perceptron artificialneural network model with improved simplified swarm optimization. Int. J. Electr. Power Energy Syst. 2014, 55, 741–748. [Google Scholar] [CrossRef]
- Chen, R.; Liang, C.-Y.; Hong, W.-C.; Gu, D.-X. Forecasting holiday daily touristflow based on seasonal support vector regression with adaptive geneticalgorithm. Appl. Soft Comput. 2015, 26, 435–443. [Google Scholar] [CrossRef]
- Zhou, D.; An, Y.; Zha, D.; Wu, F.; Wang, Q. Would an increasing block carbon tax be better? A comparative study within the Stackelberg Game framework. J. Environ. Manag. 2019, 235, 328–341. [Google Scholar] [CrossRef] [PubMed]
- Ji, X.; Yang, K.; Na, X.; Lv, C.; Liu, Y. Shared Steering Torque Control for Lane Change Assistance: A Stochastic Game-Theoretic Approach. IEEE Trans. Ind. Electron. 2019, 66, 3093–3105. [Google Scholar] [CrossRef]
- Han, L.; Morstyn, T.; McCulloch, M. Incentivizing Prosumer Coalitions With Energy Management Using Cooperative Game Theory. IEEE Trans. Power Syst. 2019, 34, 303–313. [Google Scholar] [CrossRef]
- Li, C.; Cai, W.; Luo, H.; Zhang, Q. Power utilization strategy in smart residential community using non-cooperative game considering customer satisfaction and interaction. Electr. Power Syst. Res. 2019, 166, 178–189. [Google Scholar] [CrossRef]
- Haupt, S.E.; Kosović, B. Variable generation power forecasting as a big data problem. IEEE Trans. Sustain. Energy 2017, 8, 725–732. [Google Scholar] [CrossRef]
- Gao, B.; Liu, X.; Yu, C.; Tang, Y. Game-theoretic energy management with storage capacity optimization in the smart grids. J. Mod. Power Syst. Clean Energy 2018, 6, 656–667. [Google Scholar] [CrossRef]
- Su, J.; Zhou, L.; Li, R. Cost-benefit analysis of distributed grid-connected photovoltaic power generation. Proc. CSEE 2013, 33, 50–56. [Google Scholar]
- Liang, X.; Li, X.; Lu, R.; Lin, X.; Shen, X. UDP: Usage-based dynamic pricing with privacy preservation for smart grid. IEEE Trans. Smart Grid 2013, 4, 141–150. [Google Scholar] [CrossRef]
- Stephens, E.R.; Smith, D.B.; Mahanti, A. Game theoretic model predictive control for distributed energy demand-side management. IEEE Trans. Smart Grid 2015, 6, 1394–1402. [Google Scholar] [CrossRef]
- Sinha, A.; Malo, P.; Frantsev, A.; Deb, K. Finding optimal strategies in a multi-period multi-leader–follower Stackelberg game using an evolutionary algorithm. Comput. Oper. Res. 2014, 41, 374–385. [Google Scholar] [CrossRef]
- Iwueze, I.S.; Nwogu, E.C.; Nlebedim, V.U.; Imoh, J.C. Comparison of Two Time Series Decomposition Methods: Least Squares and Buys-Ballot Methods. Open J. Stat. 2016, 6, 1123. [Google Scholar] [CrossRef]
- Cadenas, E.; Rivera, W.; Campos-Amezcua, R.; Heard, C. Wind speed prediction using a univariate ARIMA model and a multivariate NARX model. Energies 2016, 9, 109. [Google Scholar] [CrossRef]
- Dickey, D.A.; Fuller, W.A. Distribution of the estimators for autoregressive time series with a unit root. J. Am. Stat. Assoc. 1979, 74, 427–431. [Google Scholar]
- Yang, X.S.; Deb, S. Cuckoo search via Lévy flights. In Proceedings of the 2009 World Congress on Nature & Biologically Inspired Computing (NaBIC), Coimbatore, India, 9–11 December 2009. [Google Scholar]
- Naz, M.; Iqbal, Z.; Javaid, N.; Khan, Z.A.; Abdul, W.; Almogren, A.; Alamri, A. Efficient Power Scheduling in Smart Homes Using Hybrid Grey Wolf Differential Evolution Optimization Technique with Real Time and Critical Peak Pricing Schemes. Energies 2018, 11, 384. [Google Scholar] [CrossRef]
- Mirjalili, S.; Mirjalili, S.M.; Lewis, A. Grey wolf optimizer. Adv. Eng. Softw. 2014, 69, 46–61. [Google Scholar] [CrossRef]
- Available online: http://www.elia.be/en/grid-data/power-generation/Solar-power-generation-data/Graph (accessed on 1 January 2019).
© 2019 by the authors. Licensee MDPI, Basel, Switzerland. This article is an open access article distributed under the terms and conditions of the Creative Commons Attribution (CC BY) license (http://creativecommons.org/licenses/by/4.0/).