A Method for Urban Flood Risk Assessment and Zoning Considering Road Environments and Terrain


Abstract
1. Introduction
2. Materials and Methods
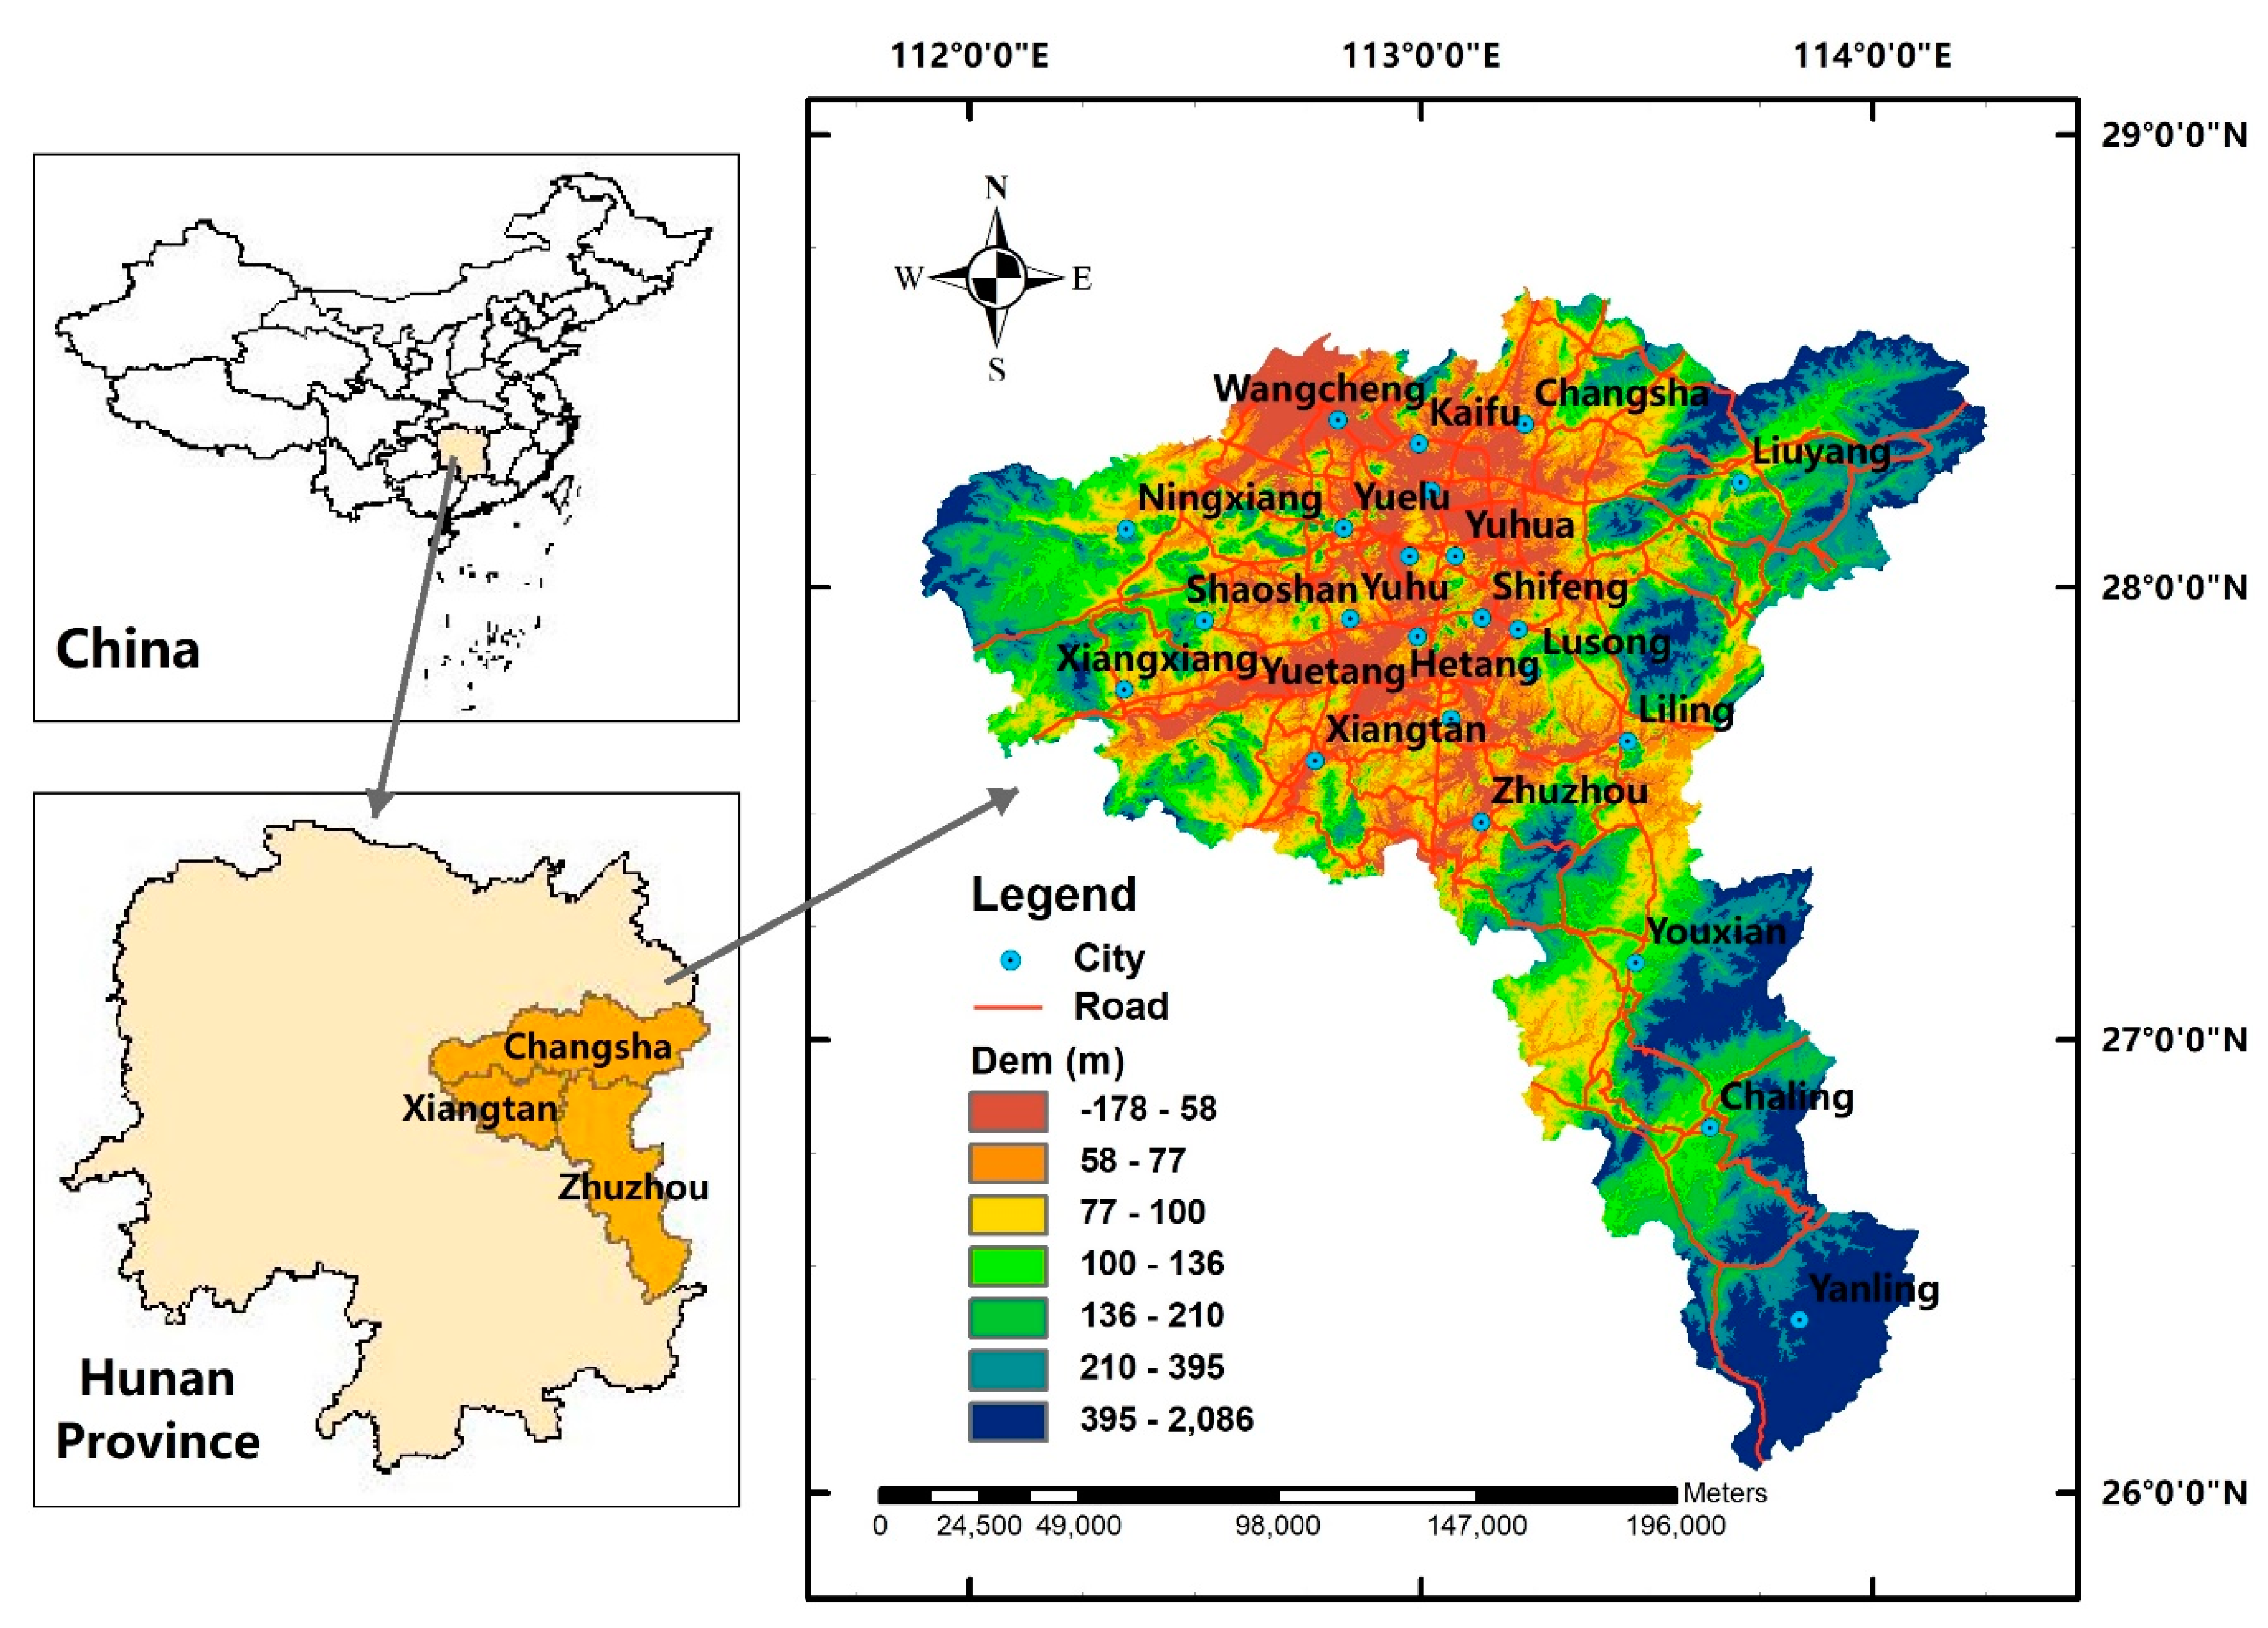
2.1. Study Area
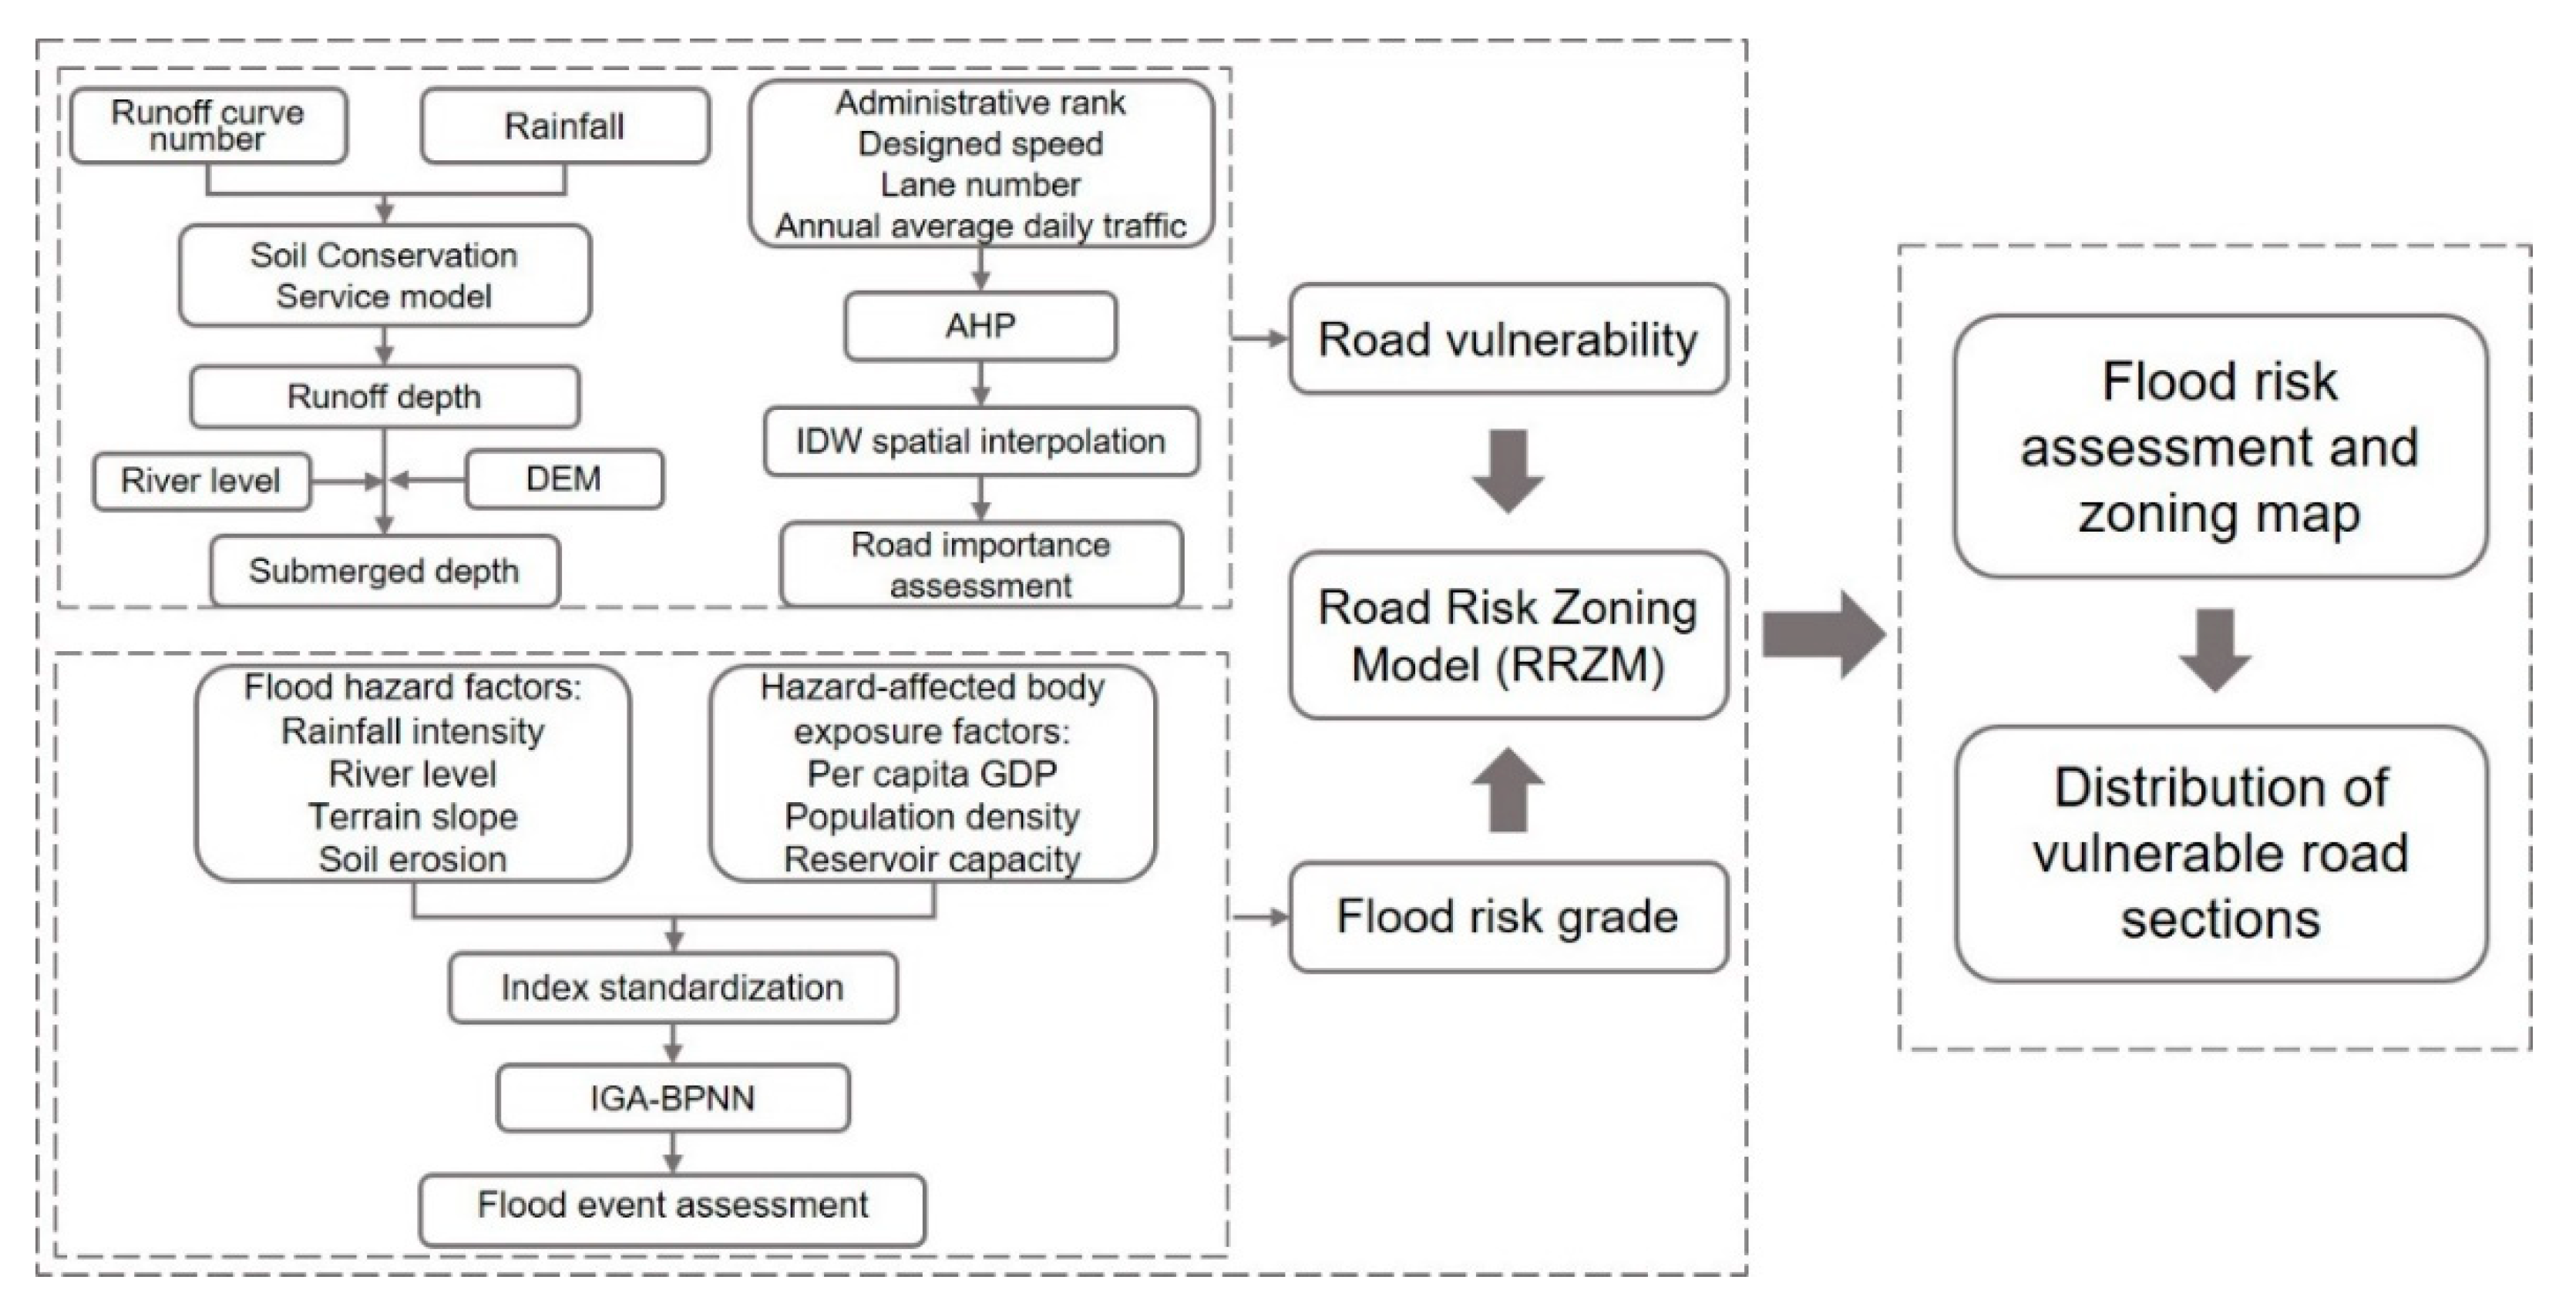
2.2. Methods
2.2.1. Vulnerability of Road Environments
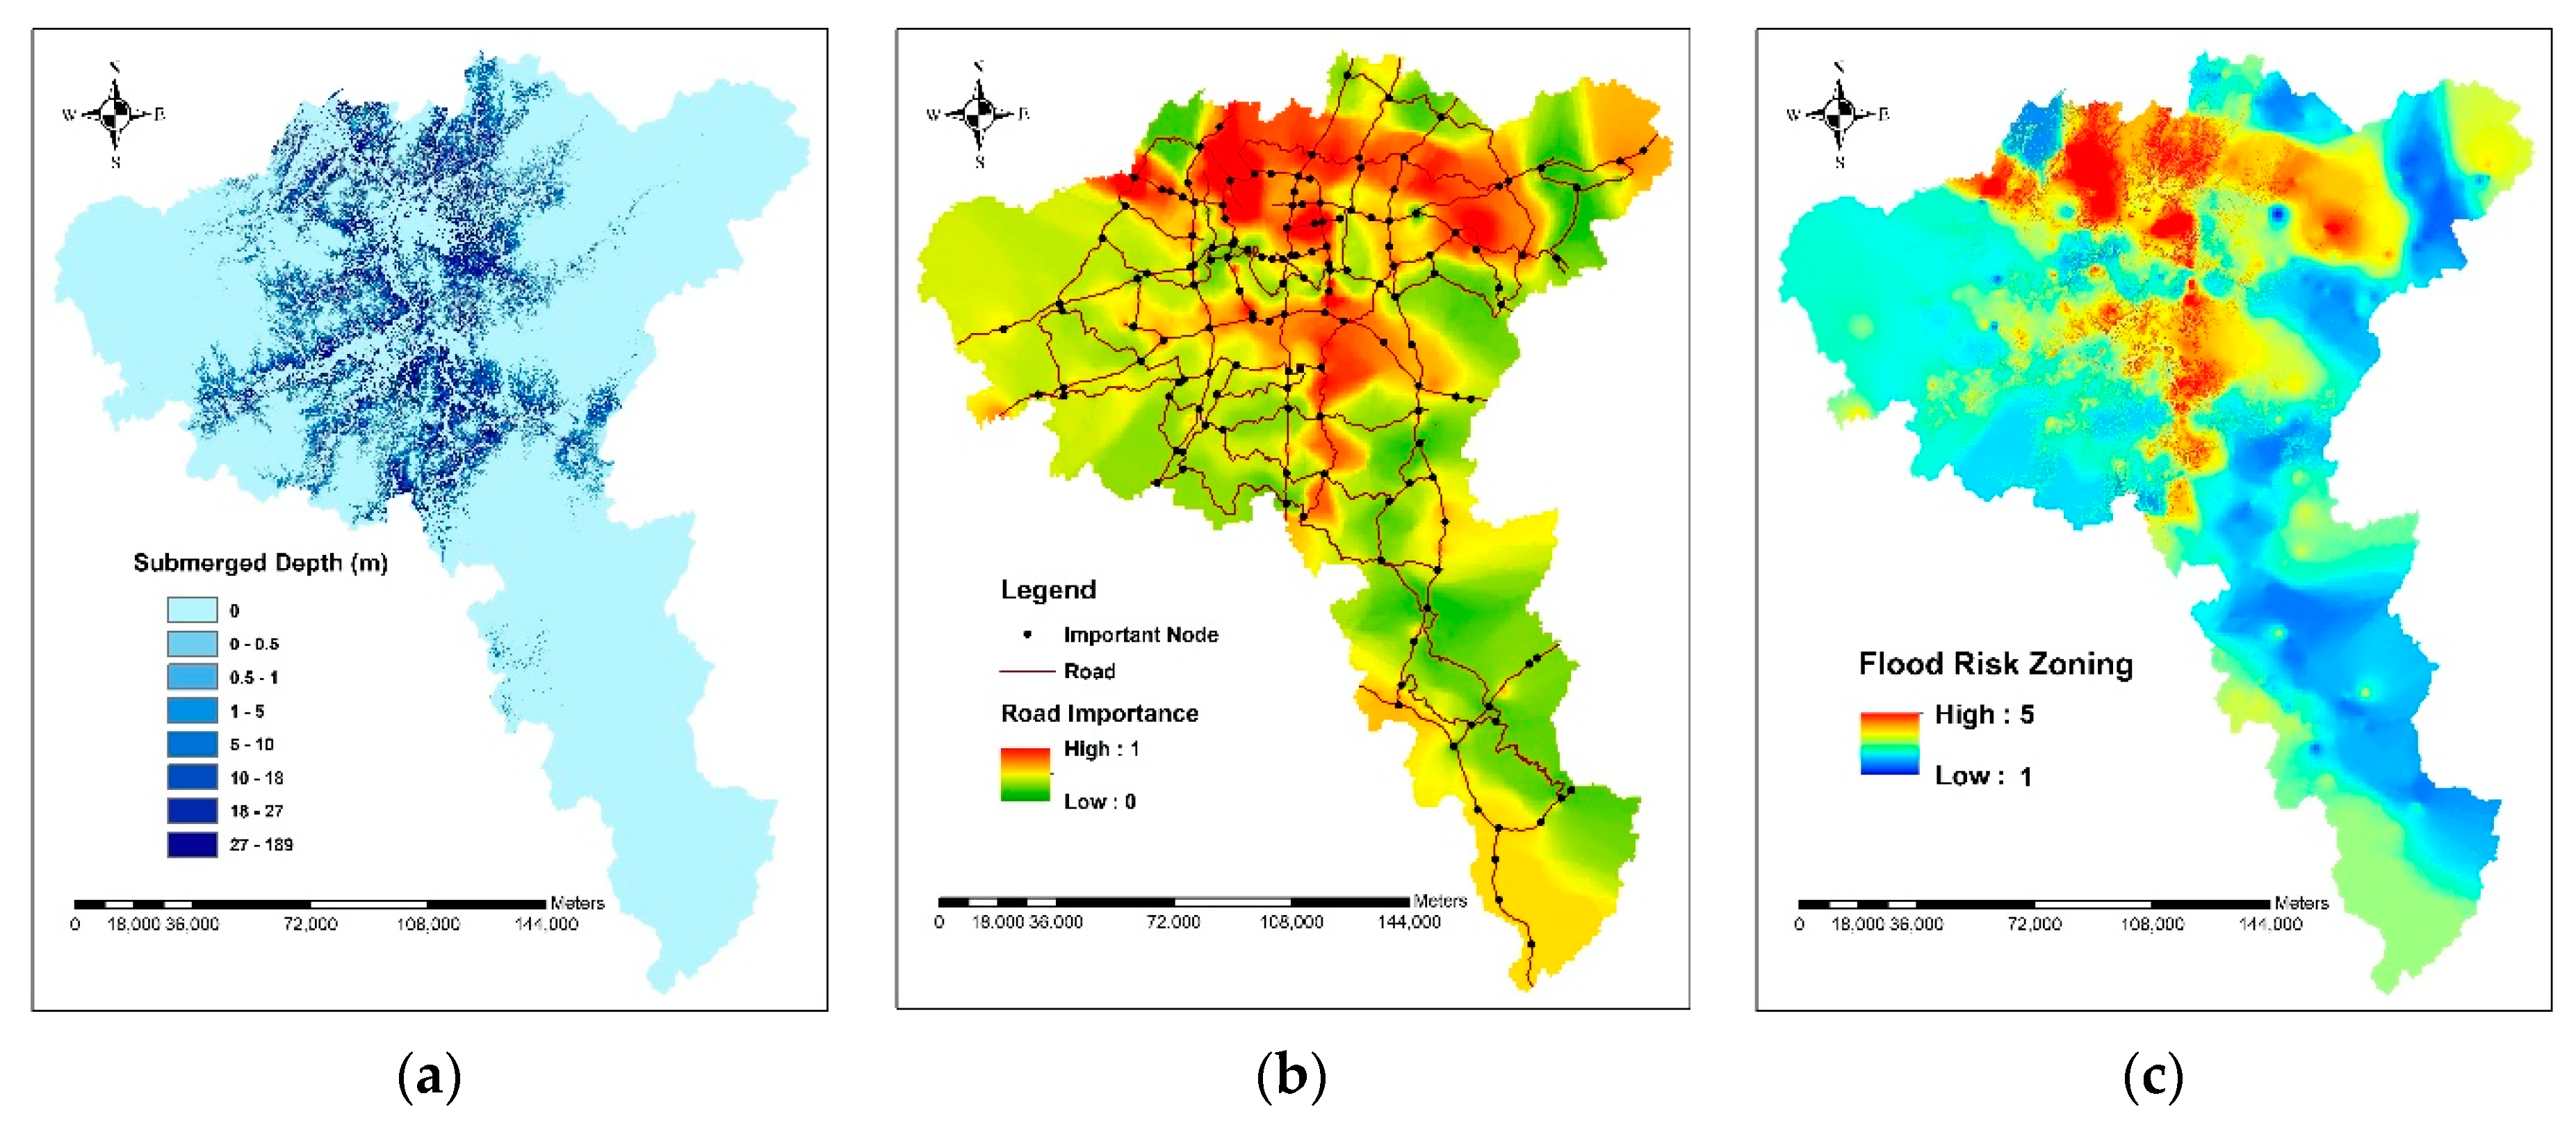
Submerged Depth
Road Importance Assessment
2.2.2. Flood Risk Grade
2.2.3. Flood Risk Assessment and Zoning
3. Results
3.1. Urban Agglomeration Scale: A Case Study of the CZTUA
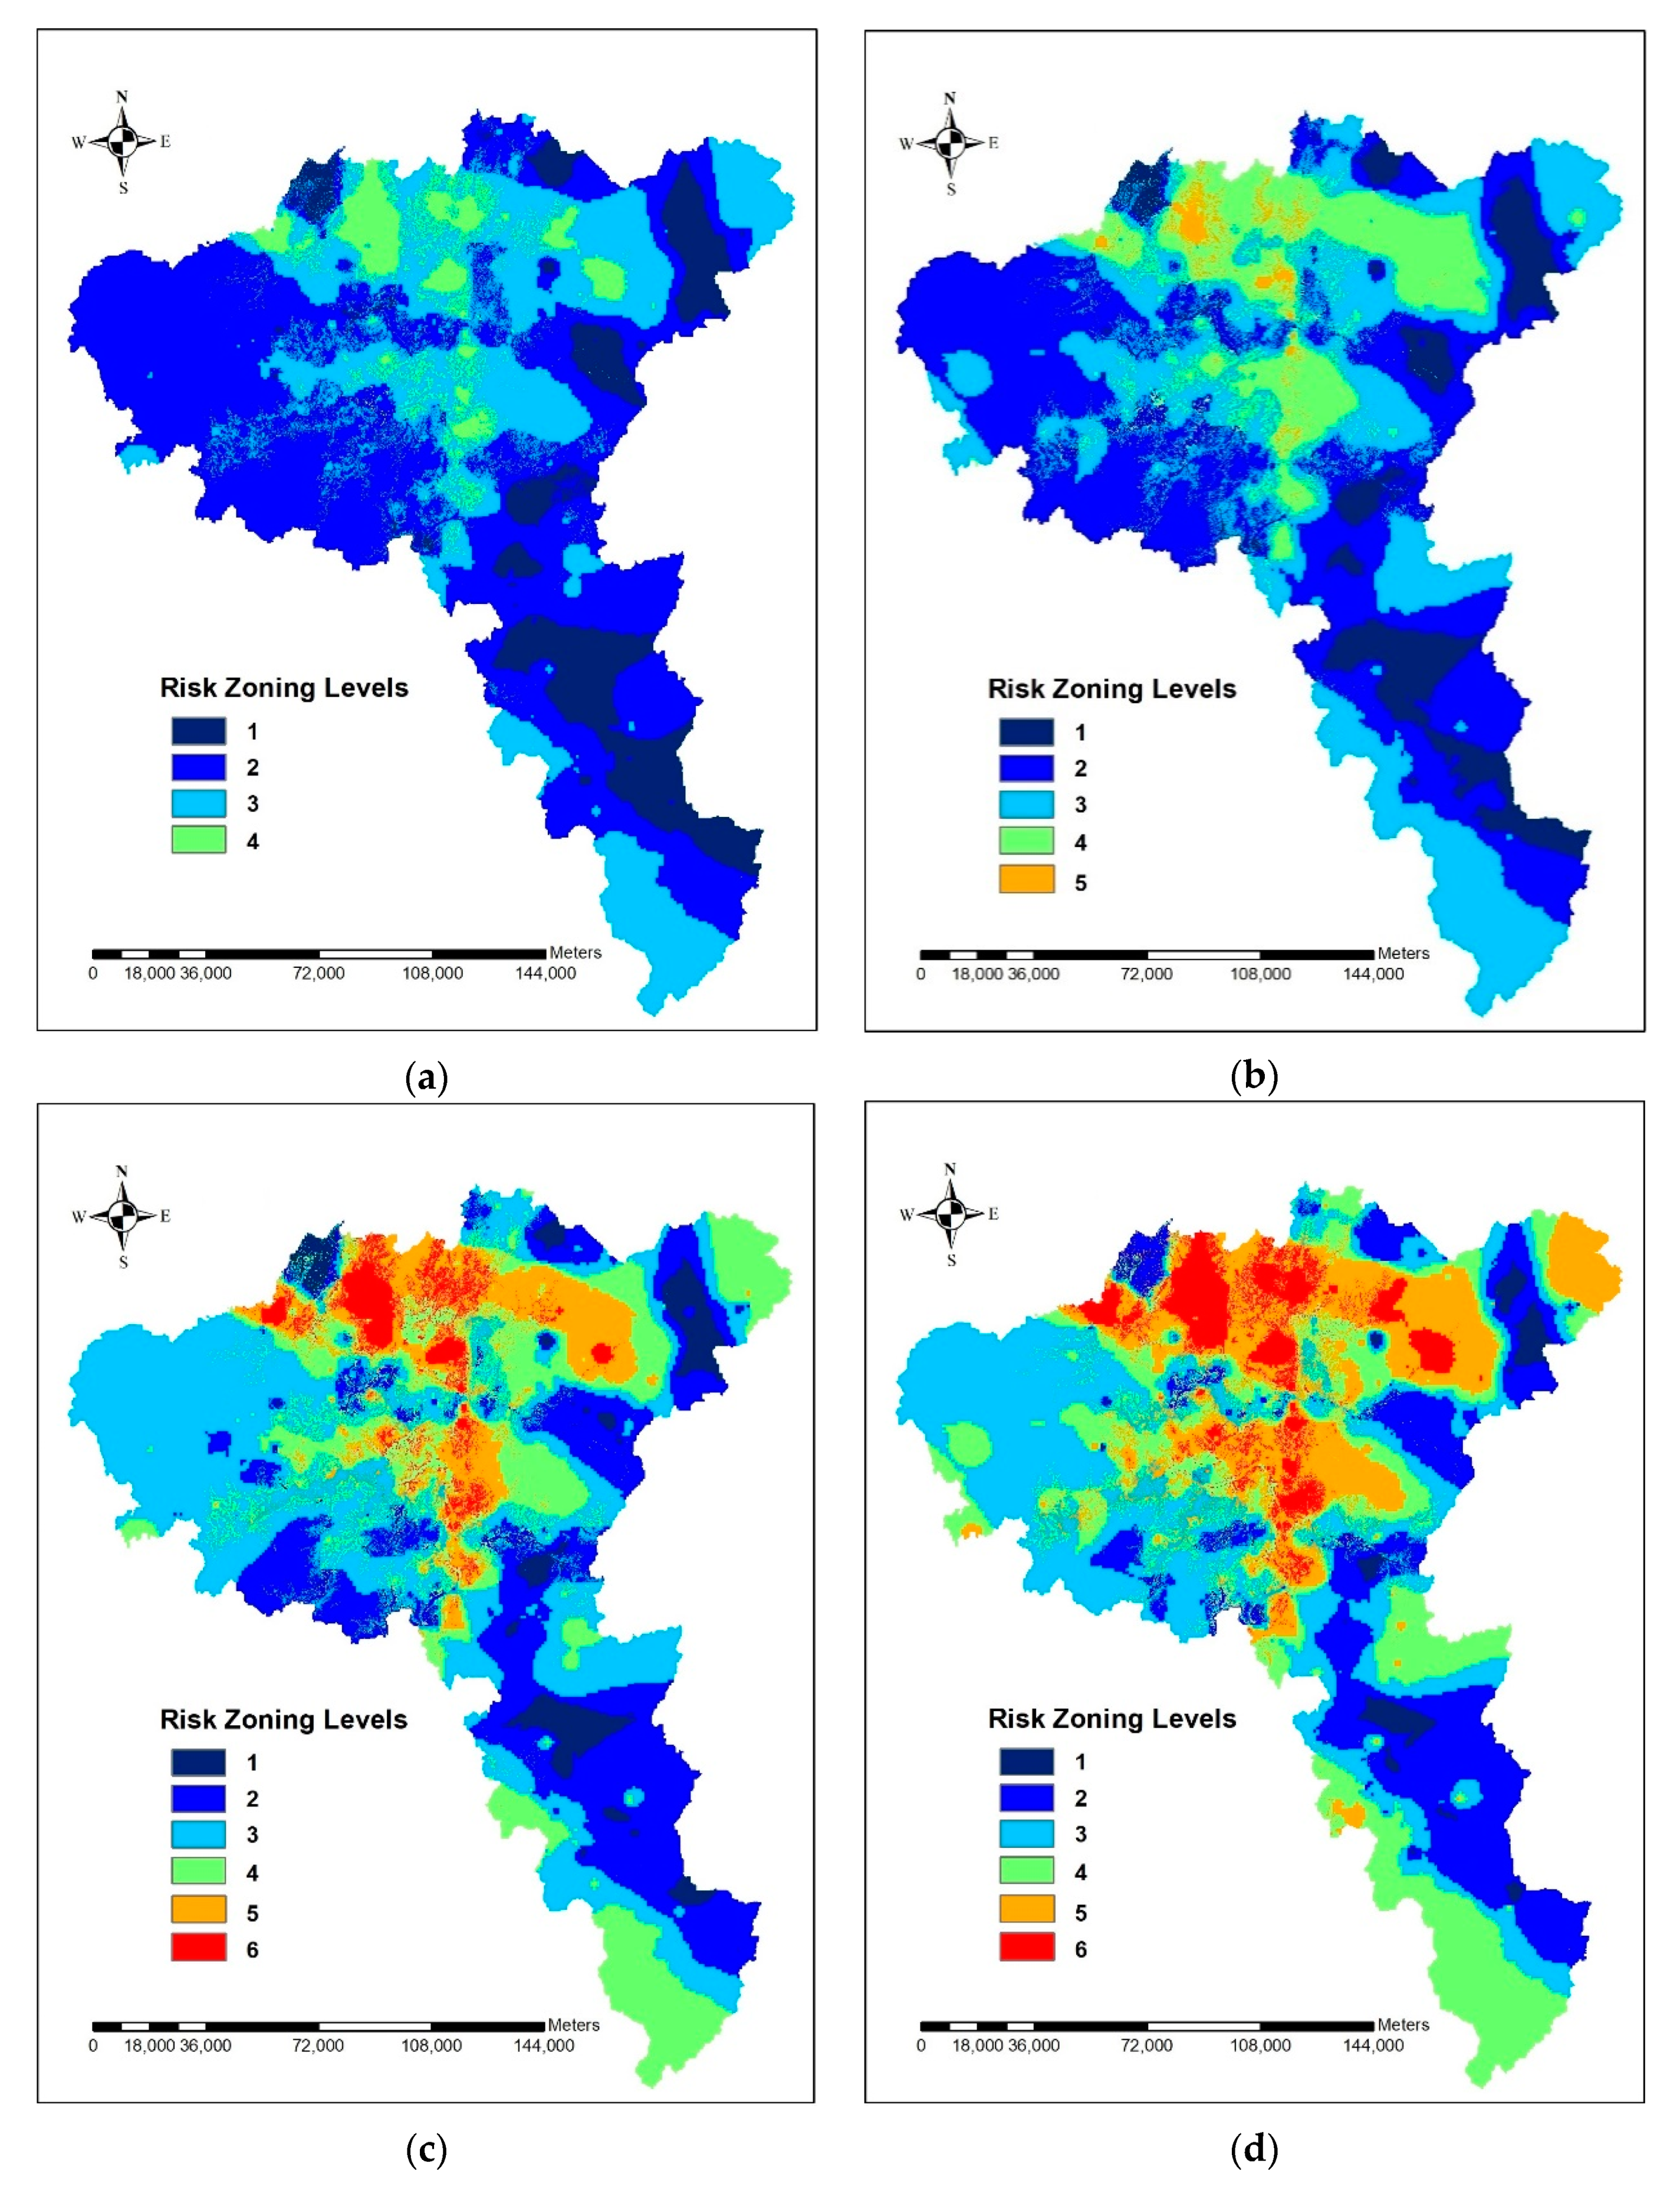
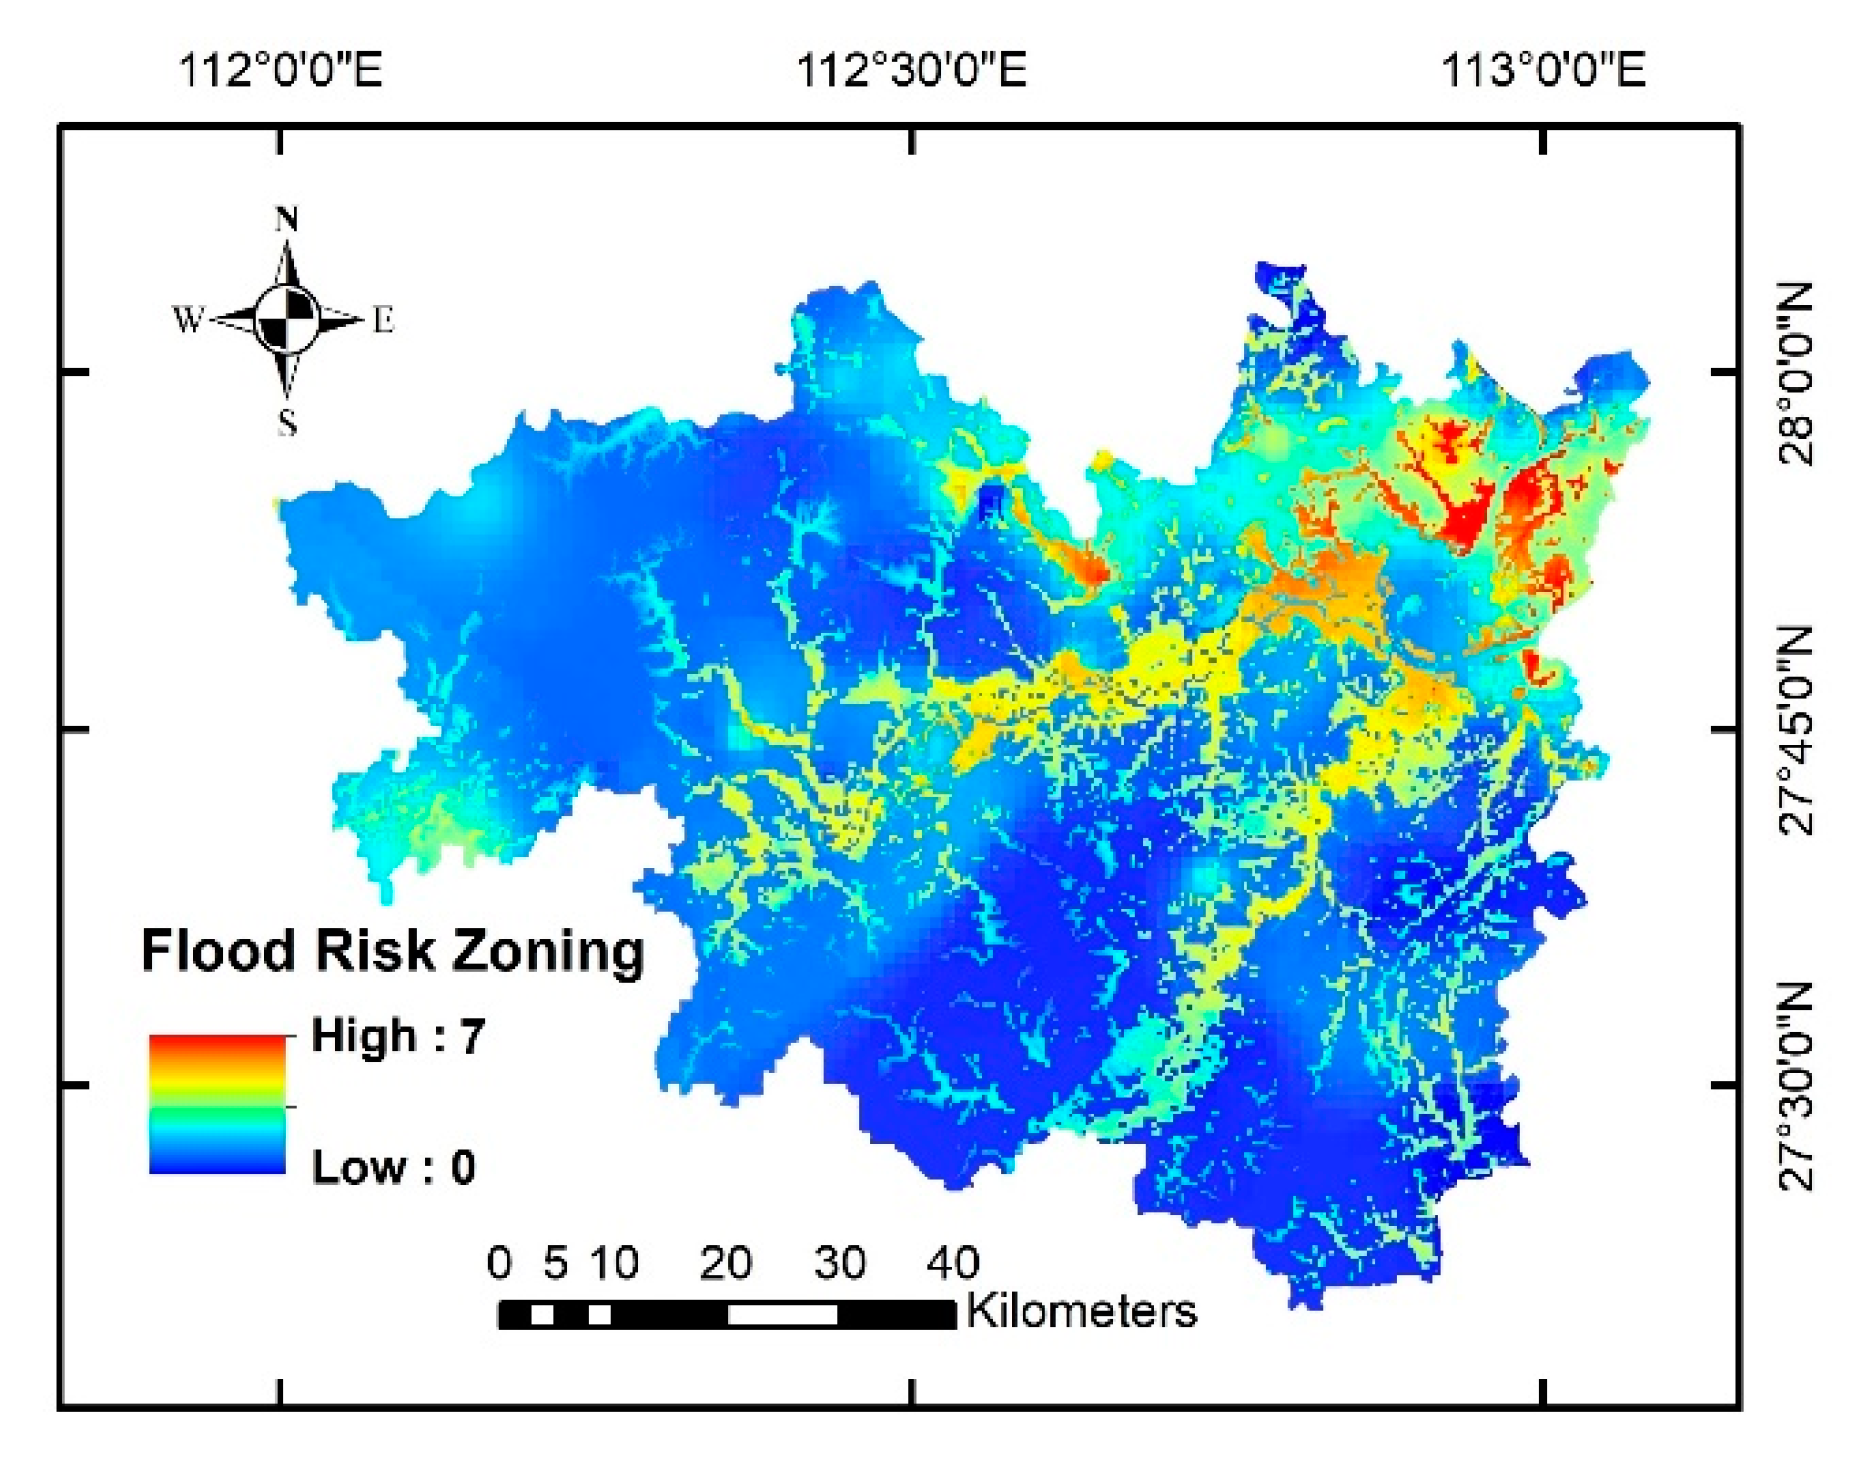
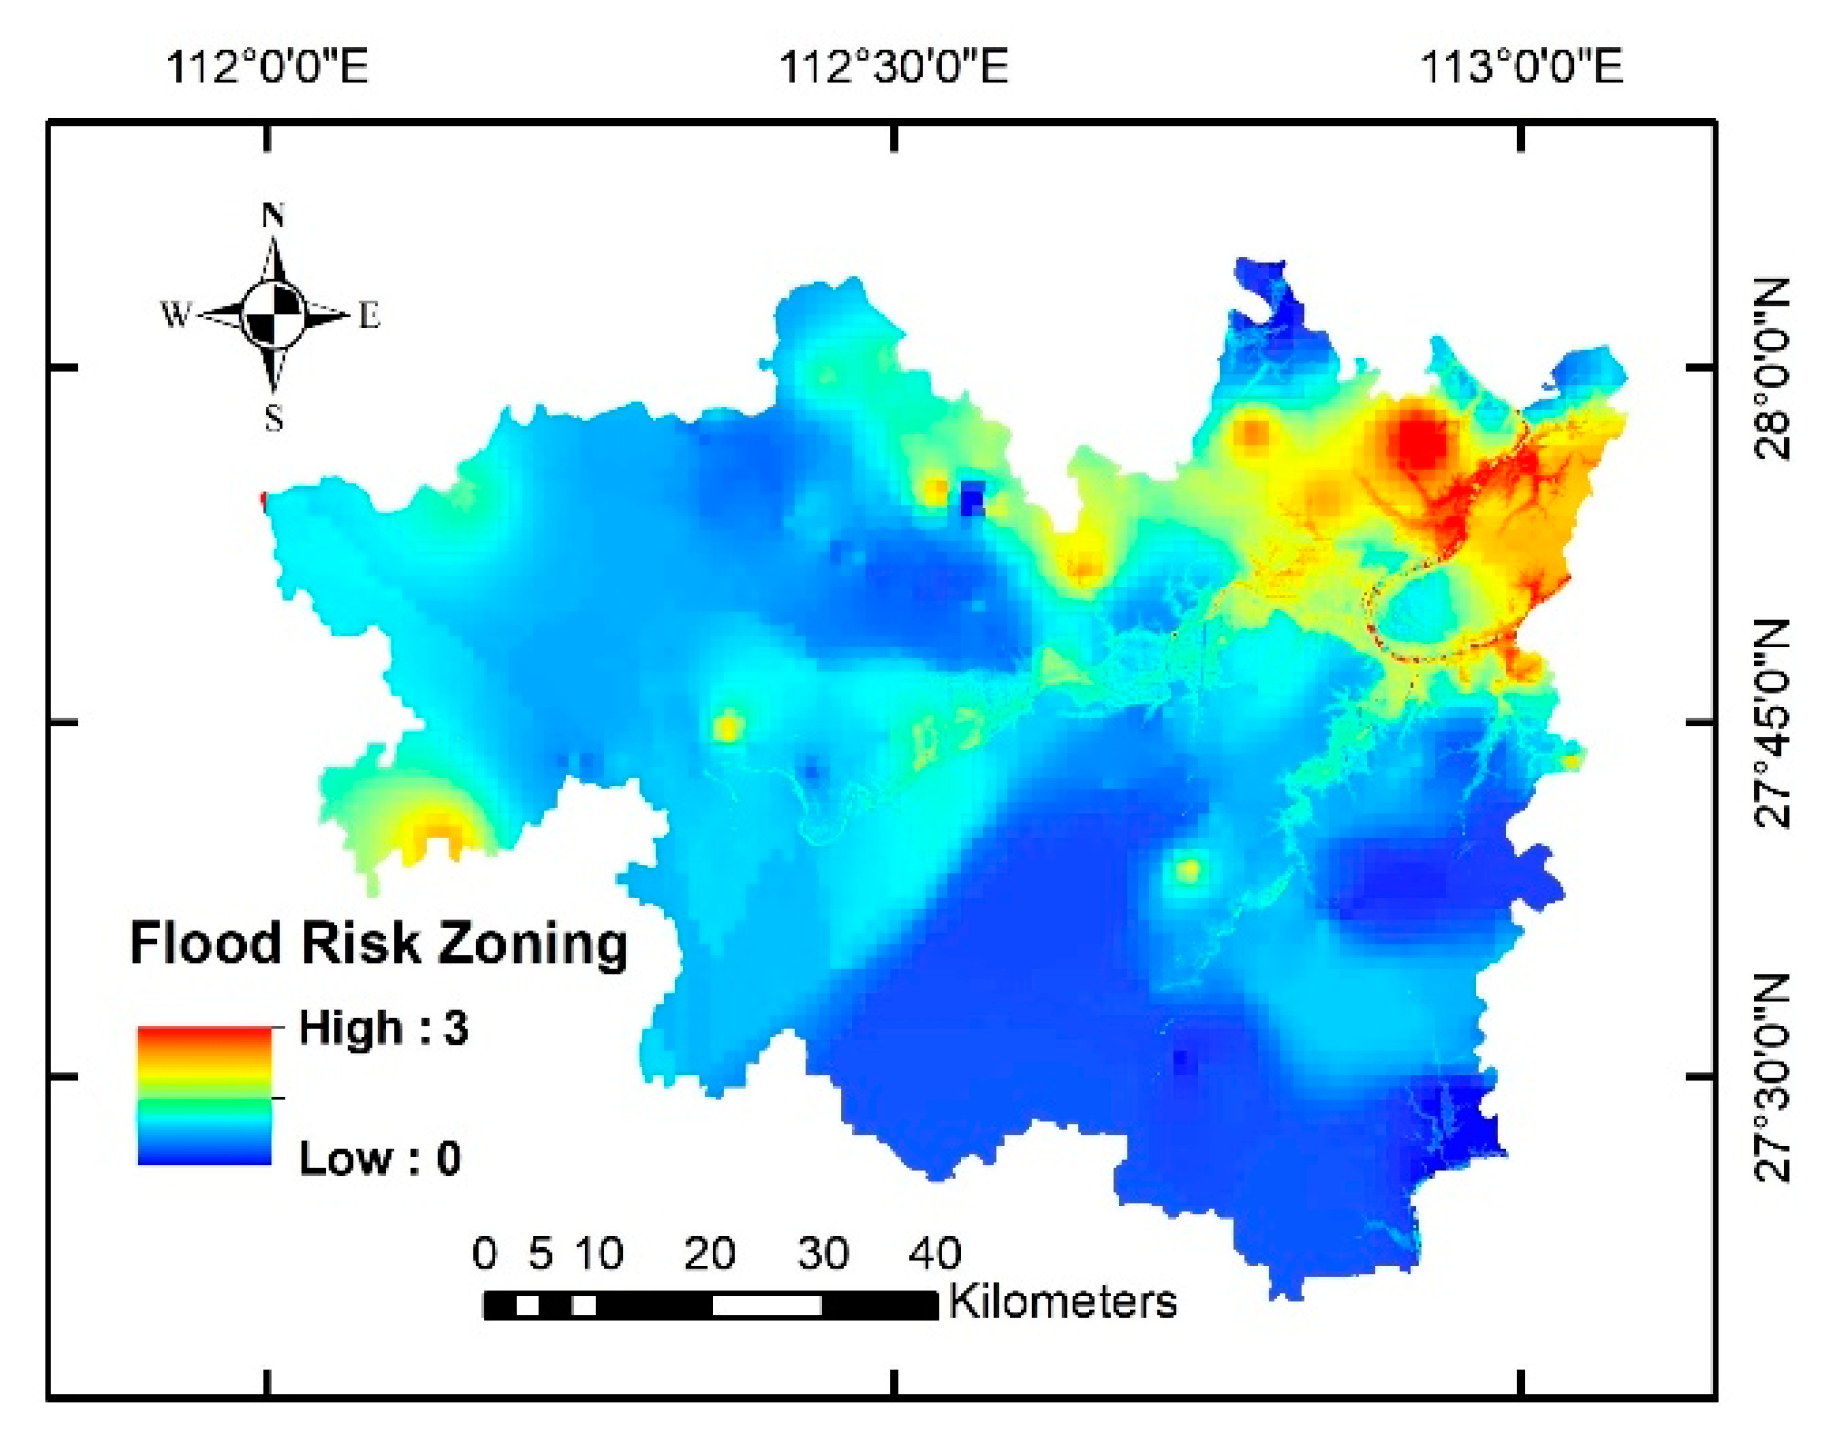
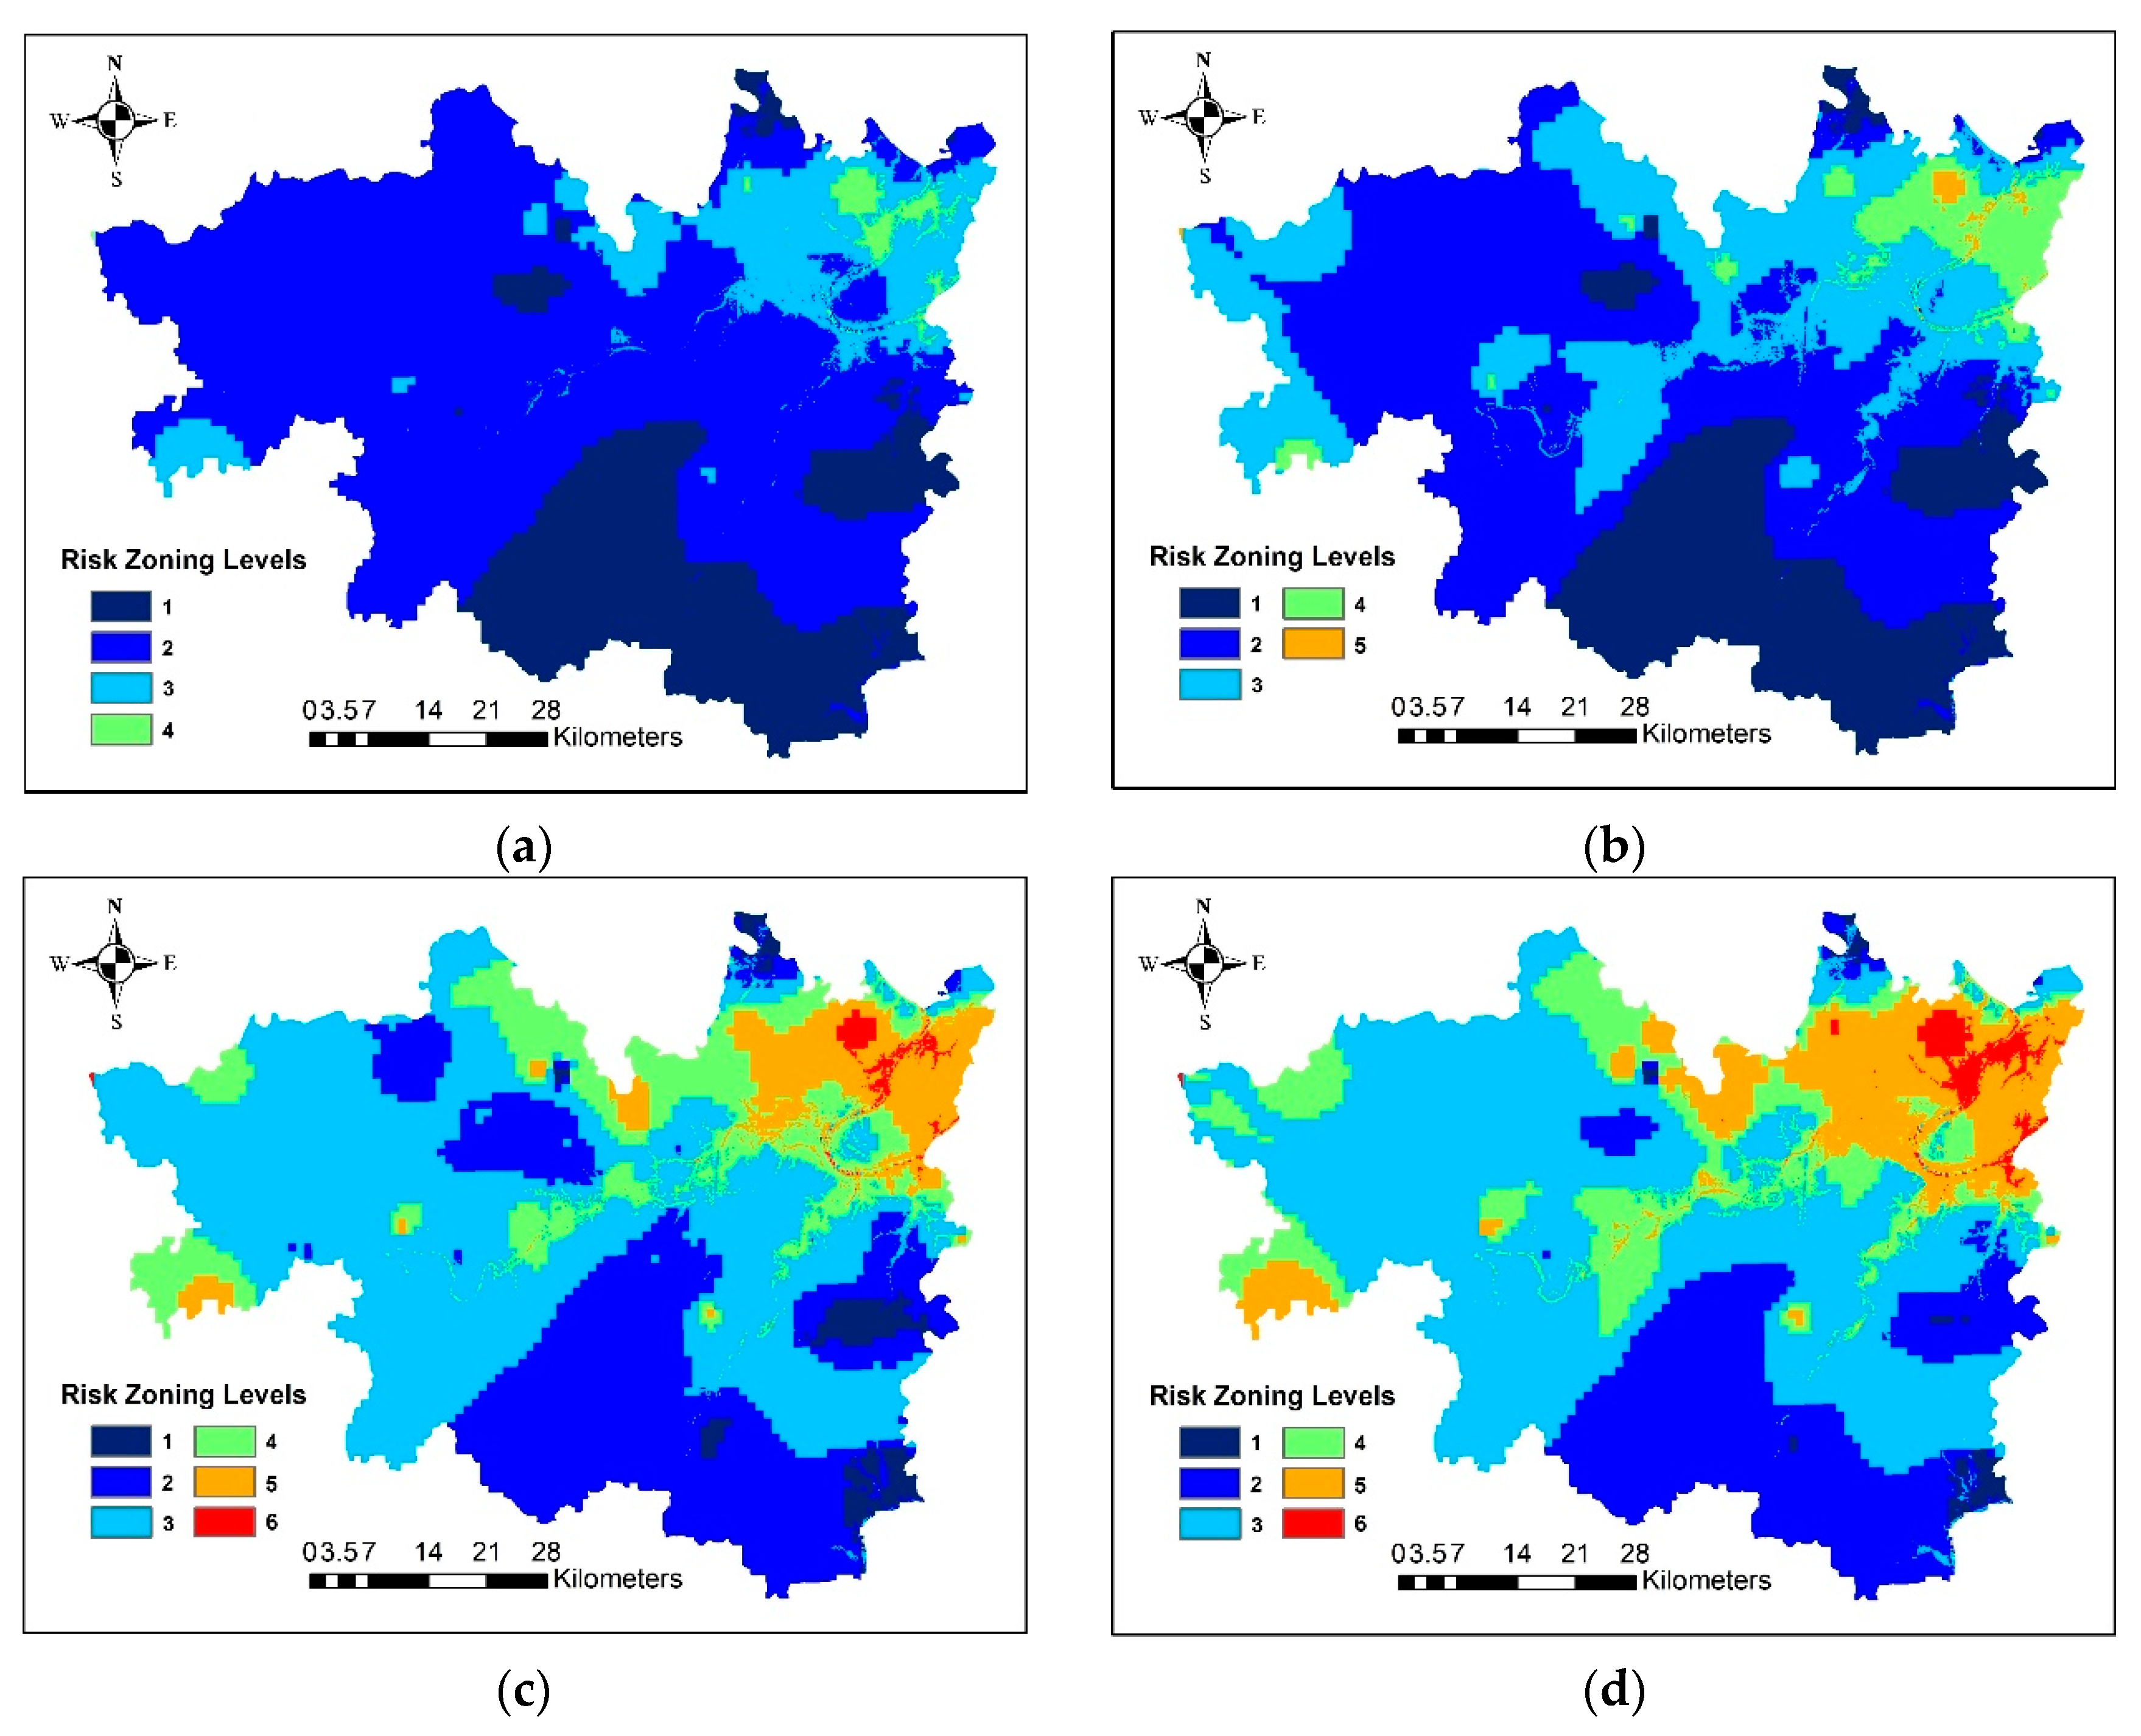
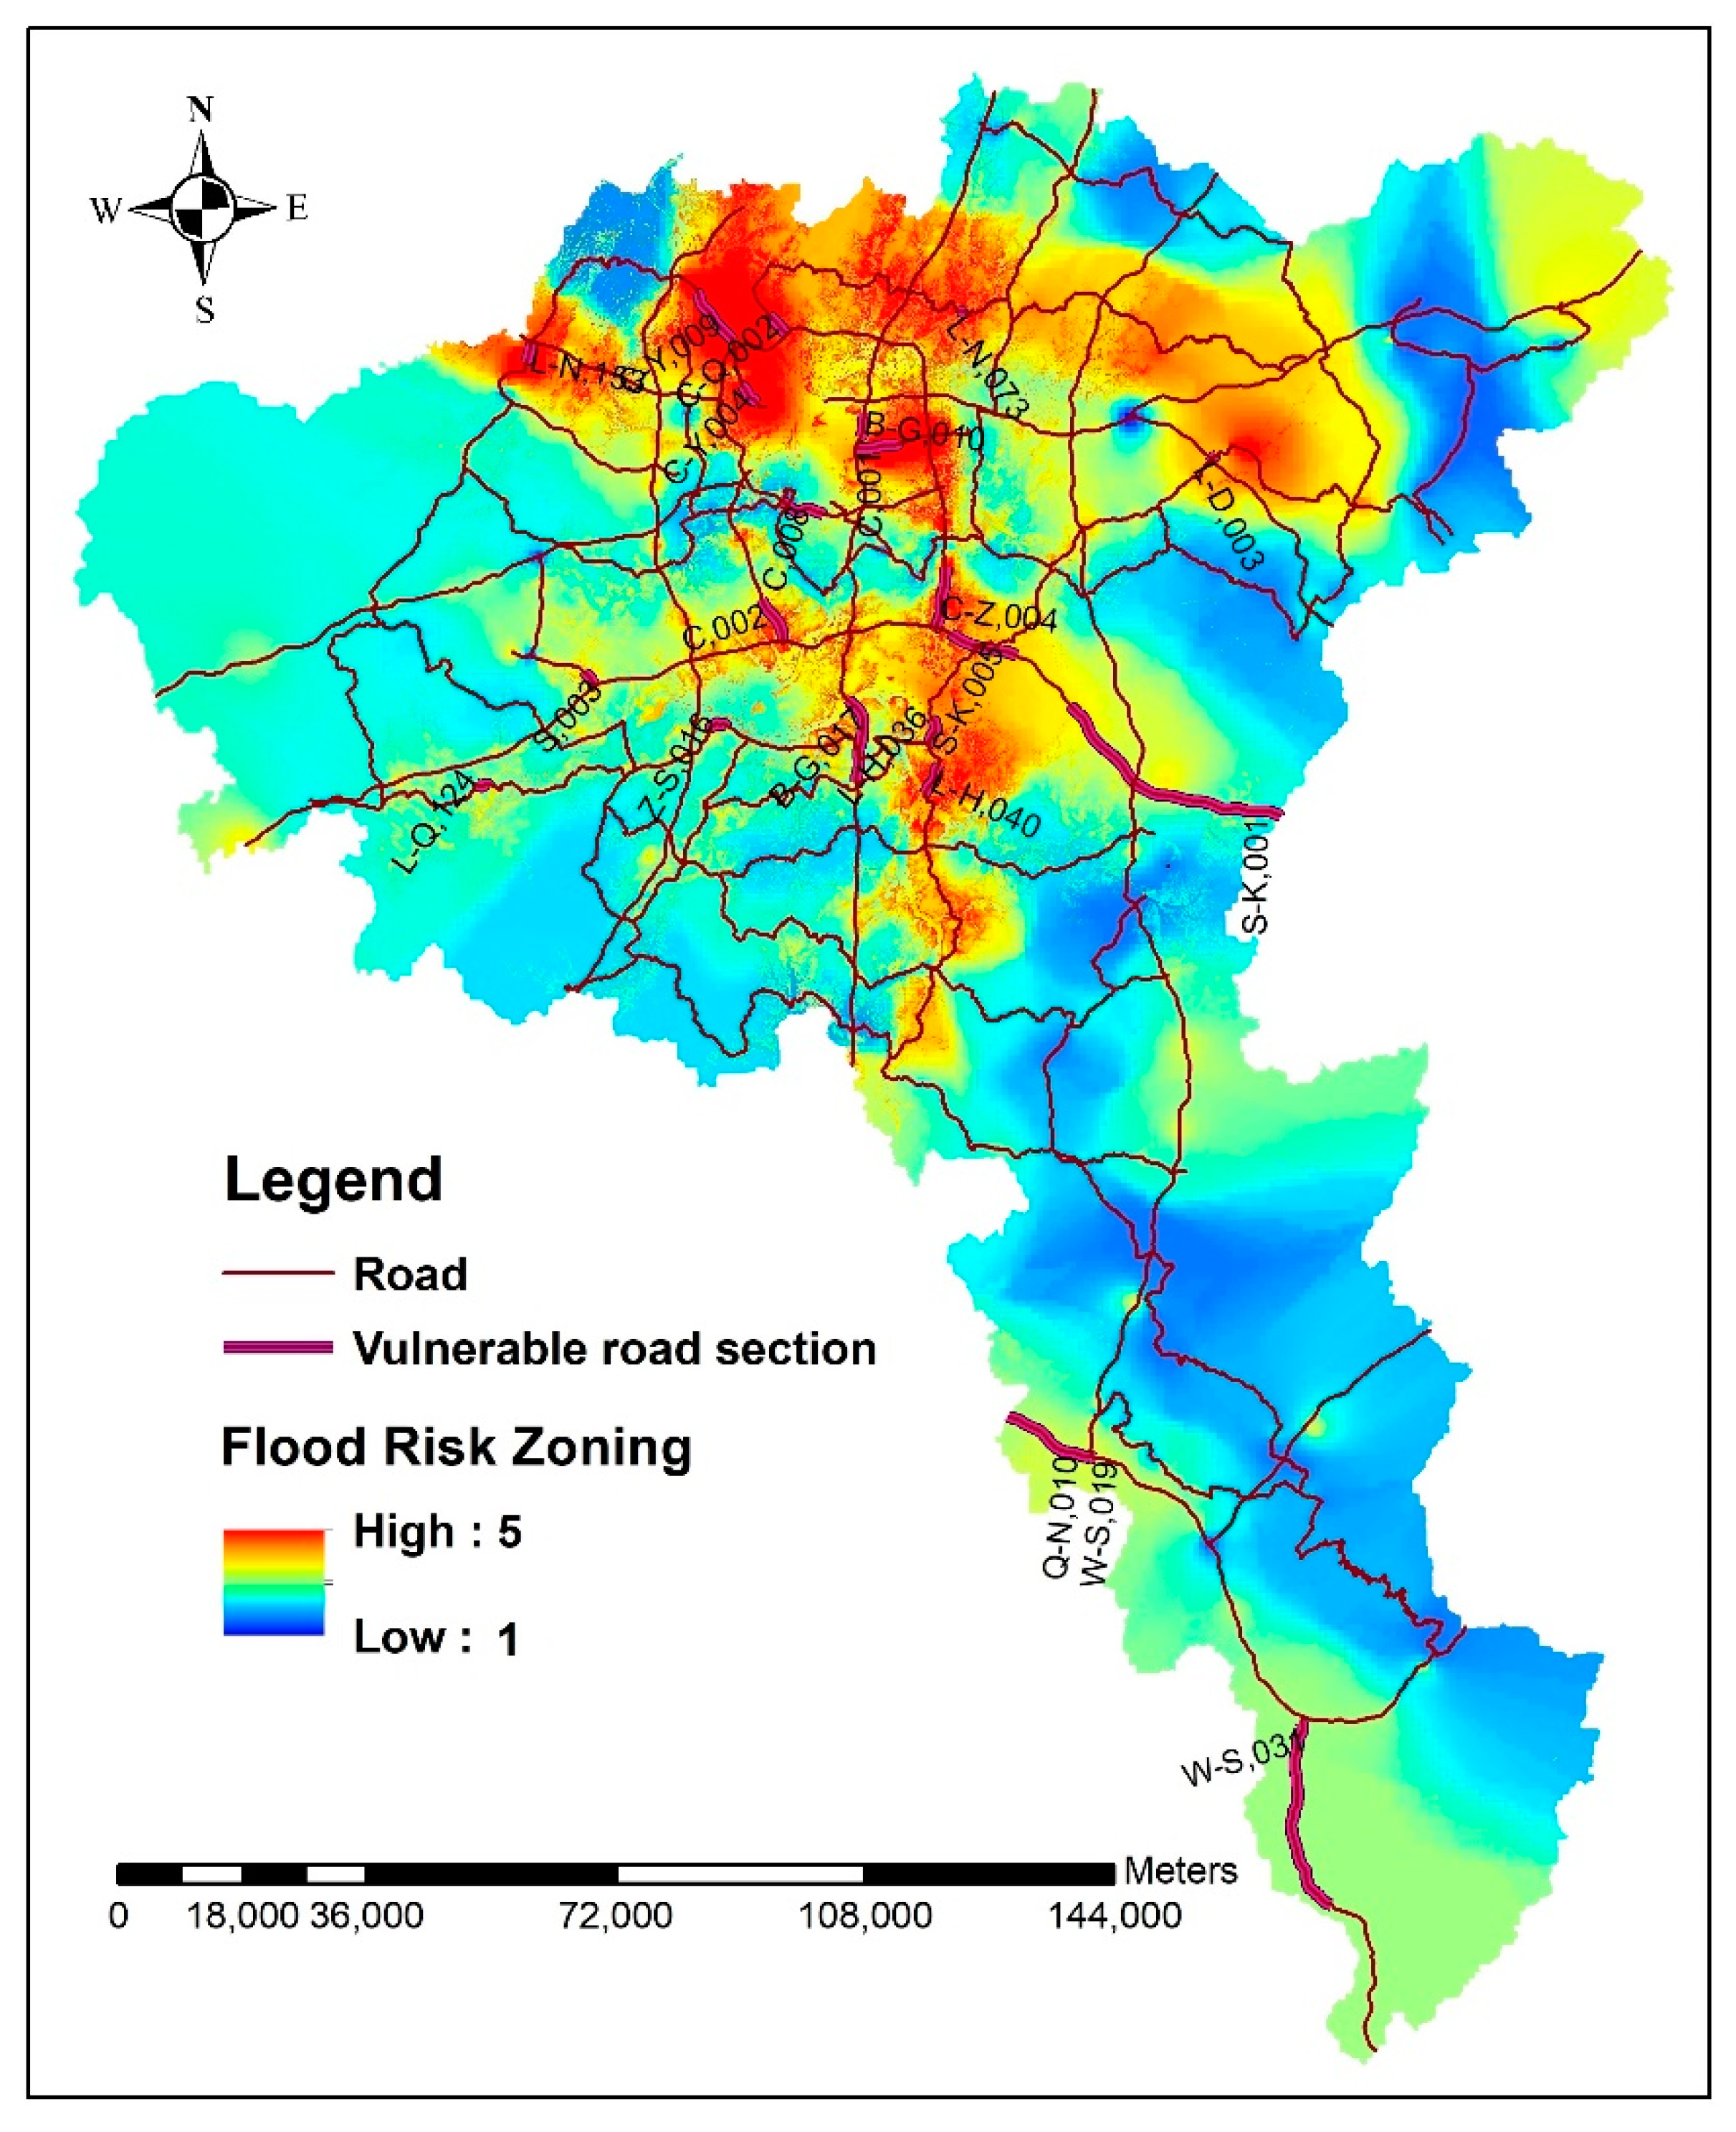
3.1.1. Results of Flood Risk Zoning
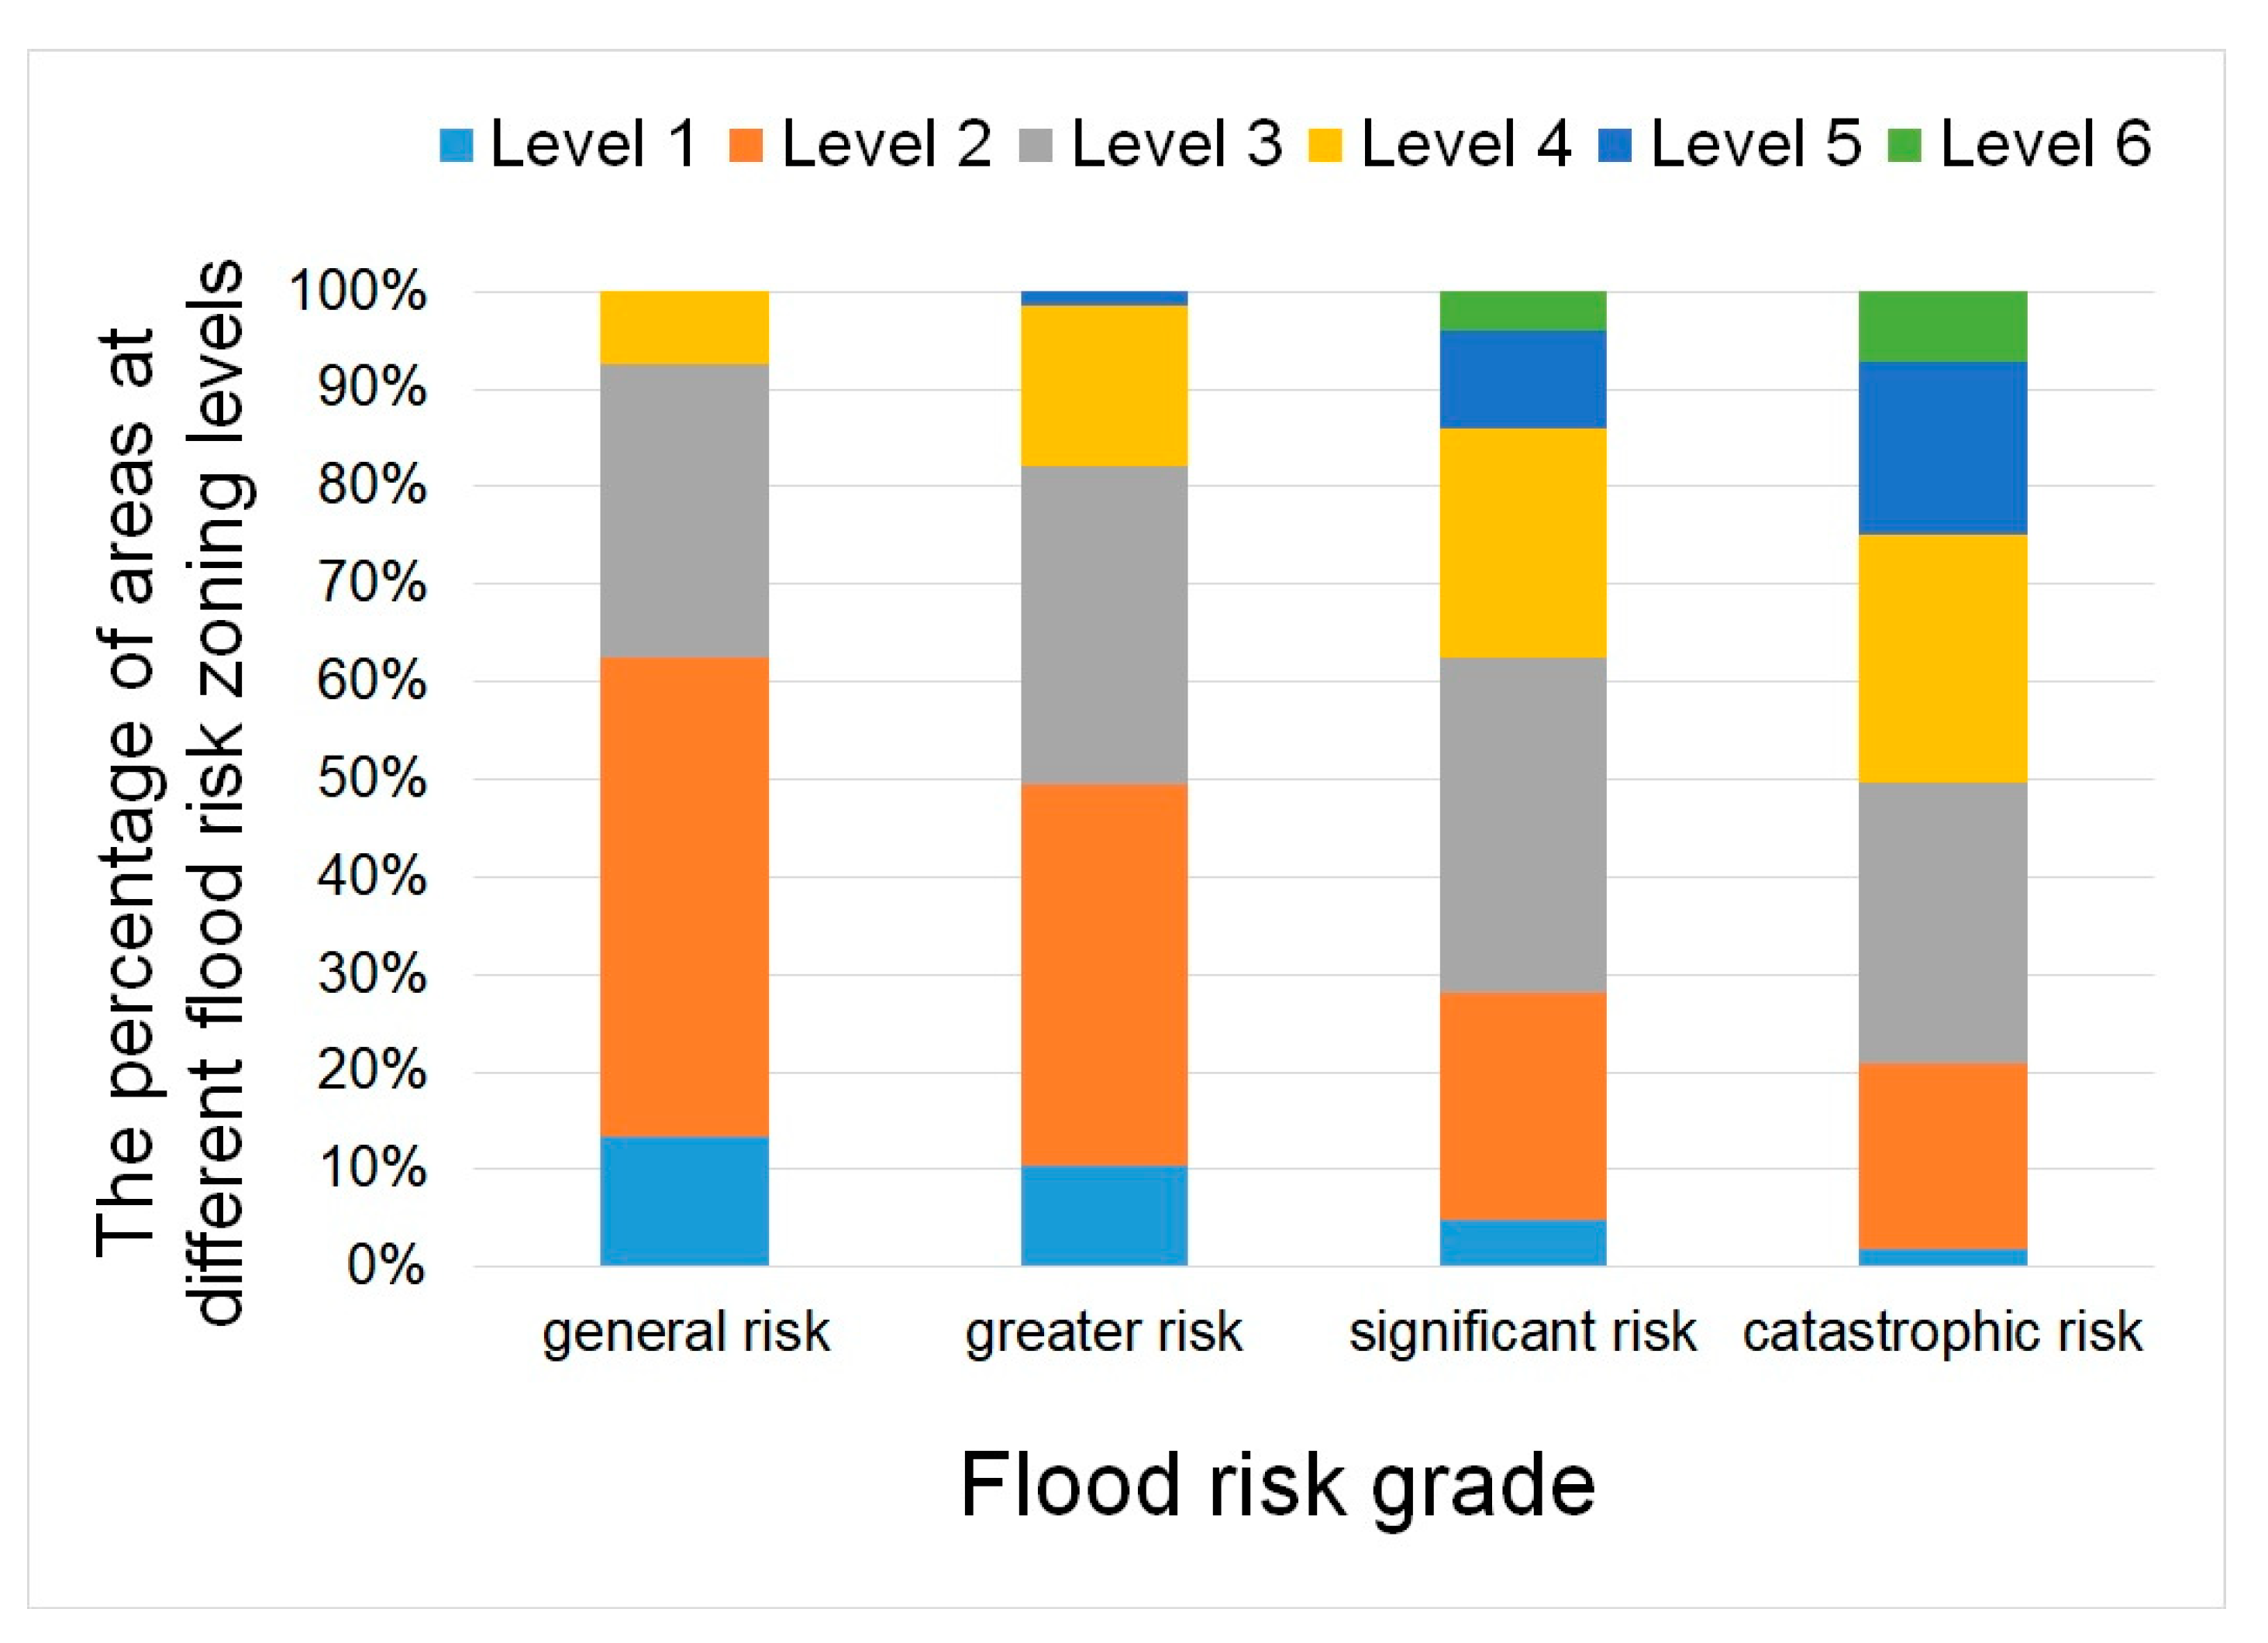
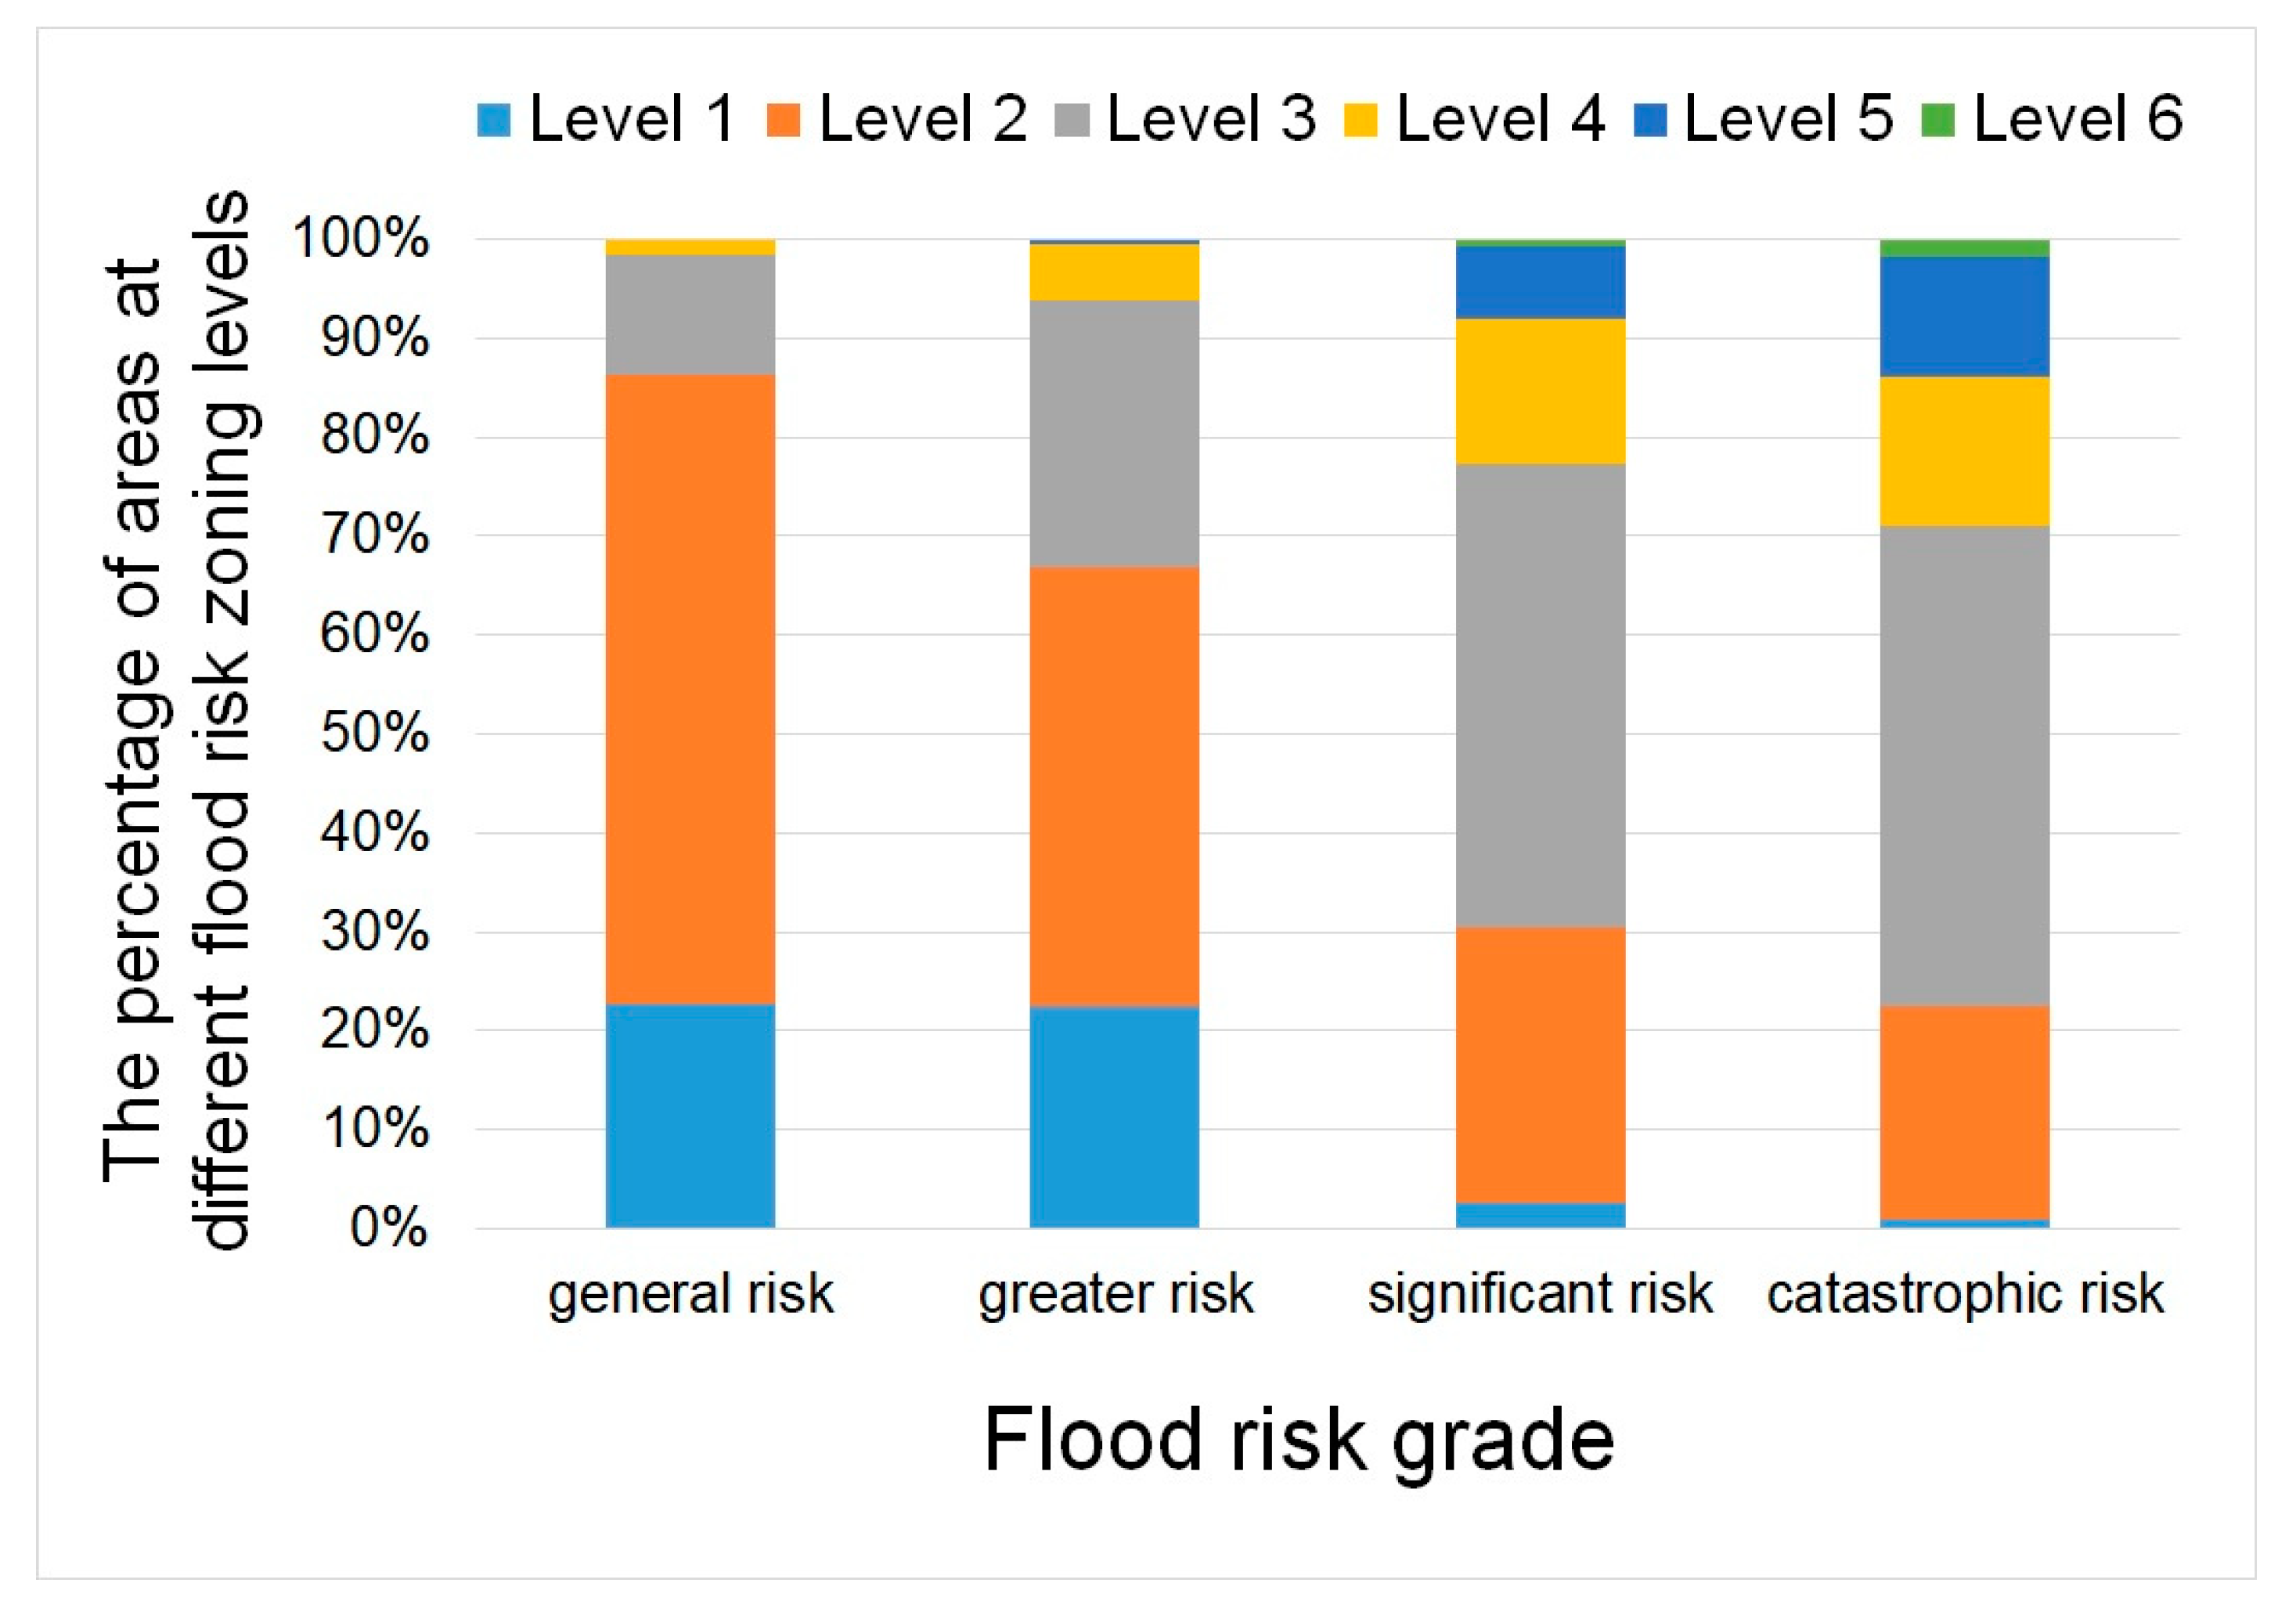
3.1.2. Zoning at Different Flood Risk Grades
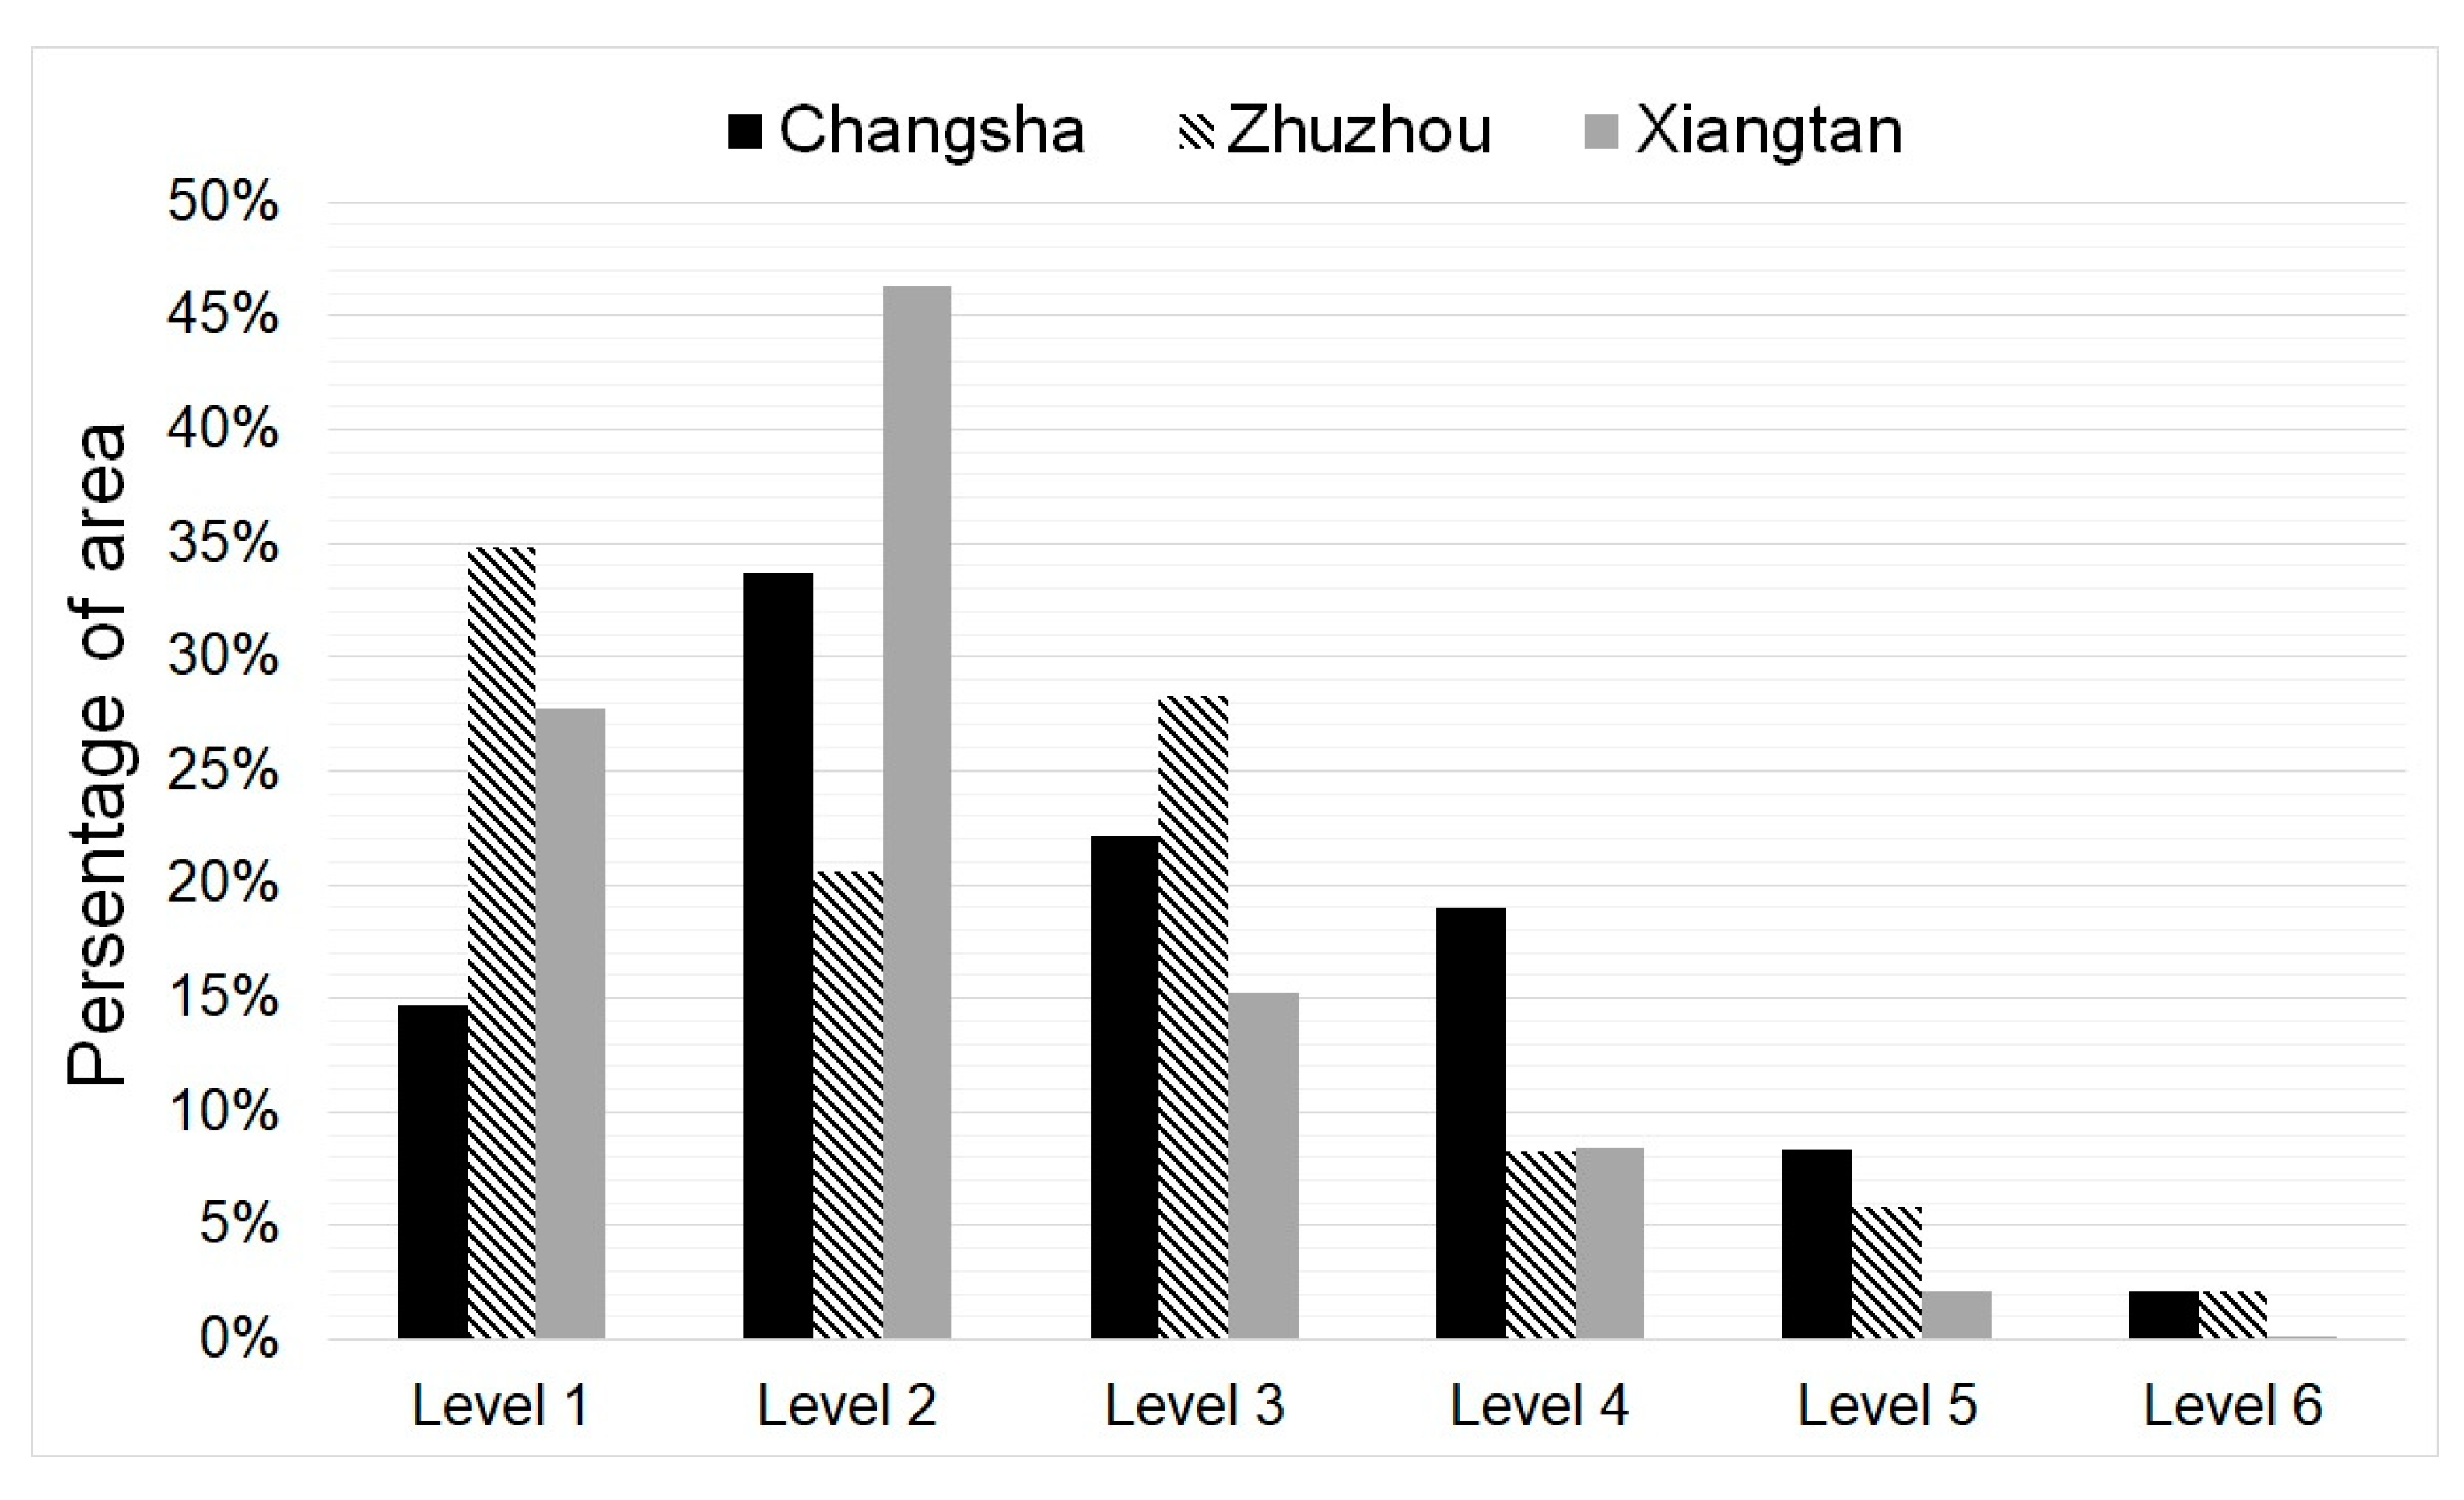
3.2. Single Urban Scale: A Case Study of Xiangtan City
4. Discussion
4.1. Discussion of Flood Risk Zoning Levels
4.1.1. Flood Risk Zoning Levels of the CZTUA
4.1.2. Flood Risk of Roads in Cities and Counties
4.2. Comparison of the Road Risk Zoning Model (RRZM) and Other Methods
5. Conclusions
Author Contributions
Funding
Acknowledgments
Conflicts of Interest
References
- Jha, A.K.; Bloch, R.; Lamond, J. Cities and Flooding: A Guide to Integrated Urban Flood Risk Management for the 21st Century; The World Bank: Washington, DC, USA, 2012. [Google Scholar]
- Beiler, M.R.O.; Treat, C. Integrating GIS and AHP to Prioritize Transportation Infrastructure Using Sustainability Metrics. J. Infrastruct. Syst. 2015, 21, 04014053. [Google Scholar] [CrossRef]
- Kundzewicz, Z.W.; Kanae, S.; Seneviratne, S.I.; Handmer, J.; Nicholls, N.; Peduzzi, P.; Mechler, R.; Bouwer, L.M.; Arnell, N.; Mach, K.; et al. Flood risk and climate change: Global and regional perspectives. Hydrol. Sci. J. 2014, 59, 1–28. [Google Scholar] [CrossRef]
- Lu, X.X.; Ran, L.S. China flood havoc highlights poor urban planning. Nat. Hazards 2011, 56, 575–576. [Google Scholar] [CrossRef]
- Zheng, Z.P.; Qi, S.Z.; Xu, Y.T. Questionable frequent occurrence of urban flood hazards in modern cities of China. Nat. Hazards 2013, 65, 1009–1010. [Google Scholar] [CrossRef]
- Huong, H.T.L.; Pathirana, A. Urbanization and climate change impacts on future urban flooding in Can Tho city, Vietnam. Hydrol. Earth Syst. Sci. 2013, 17, 379–394. [Google Scholar] [CrossRef]
- Karlsson, C.S.J.; Kalantari, Z.; Mortberg, U.; Olofsson, B.; Lyon, S.W. Natural Hazard Susceptibility Assessment for Road Planning Using Spatial Multi-Criteria Analysis. Environ. Manag. 2017, 60, 823–851. [Google Scholar] [CrossRef]
- Kalantari, Z.; Folkeson, L. Road Drainage in Sweden: Current Practice and Suggestions for Adaptation to Climate Change. J. Infrastruct. Syst. 2013, 19, 147–156. [Google Scholar] [CrossRef]
- Papaioannou, G.; Efstratiadis, A.; Vasiliades, L.; Loukas, A.; Papalexiou, S.M.; Koukouvinos, A.; Tsoukalas, I.; Kossieris, P. An Operational Method for Flood Directive Implementation in Ungauged Urban Areas. Hydrology 2018, 5, 24. [Google Scholar] [CrossRef]
- Bouvier, C.; Bouchenaki, L.; Tramblay, Y. Comparison of SCS and Green-Ampt Distributed Models for Flood Modelling in a Small Cultivated Catchment in Senegal. Geosciences 2018, 8, 122. [Google Scholar] [CrossRef]
- Salman, A.M.; Li, Y. Flood Risk Assessment, Future Trend Modeling, and Risk Communication: A Review of Ongoing Research. Nat. Hazards Rev. 2018, 19, 3. [Google Scholar]
- Wu, Y.N.; Zhong, P.A.; Zhang, Y.; Xu, B.; Ma, B.; Yan, K. Integrated flood risk assessment and zonation method: A case study in Huaihe River basin, China. Nat. Hazards 2015, 78, 635–651. [Google Scholar] [CrossRef]
- Glas, H.; Deruyter, G.; De Maeyer, P.; Mandal, A.; James-Williamson, S. Analyzing the sensitivity of a flood risk assessment model towards its input data. Nat. Hazard Earth Syst. 2016, 16, 2529–2542. [Google Scholar] [CrossRef]
- Qi, H.L.; Tian, W.P.; Li, J.C. Regional Risk Evaluation of Flood Disasters for the Trunk-Highway in Shaanxi, China. Int. J. Env. Res. Public Health 2015, 12, 13861–13870. [Google Scholar] [CrossRef]
- Yin, J.; Yu, D.P.; Yin, Z.; Liu, M.; He, Q. Evaluating the impact and risk of pluvial flash flood on intra-urban road network: A case study in the city center of Shanghai, China. J. Hydrol. 2016, 537, 138–145. [Google Scholar] [CrossRef]
- Rahman, M.R.; Saha, S. Flood hazard zonation–A GIS aided multi criteria evaluation (MCE) approach with remotely sensed data. Int. J. Geoinf. 2007, 3, 25–35. [Google Scholar]
- United States Department of Agriculture. Urban hydrology for small watersheds. Tech. Rel. 1986, 55, 2–6. [Google Scholar]
- Yao, L.; Wei, W.; Yu, Y.; Xiao, J.; Chen, L.D. Rainfall-runoff risk characteristics of urban function zones in Beijing using the SCS-CN model. J. Geogr. Sci. 2018, 28, 656–668. [Google Scholar] [CrossRef]
- Su, X.U.; Zhang, Y.; Dou, M.; Hua, R.; Zhou, Y. Spatial distribution of land use change in the Yangtze River Basin and the impact on runoff. Prog. Geogr. 2017, 36, 4. [Google Scholar]
- Wang, Z.L.; Lai, C.G.; Chen, X.H.; Yang, B.; Zhao, S.W.; Bai, X.Y. Flood hazard risk assessment model based on random forest. J. Hydrol. 2015, 527, 1130–1141. [Google Scholar] [CrossRef]
- Wang, H.; Wang, X.; Xi, W. SCS-CN-based approach for estimating collectable rainwater in waterrshed-scale. Trans. Chin. Soc. Agric. Eng. 2012, 28, 86–91. [Google Scholar]
- Michielsen, A.; Kalantari, Z.; Lyon, S.W.; Liljegren, E. Predicting and communicating flood risk of transport infrastructure based on watershed characteristics. J. Environ. Manag. 2016, 182, 505–518. [Google Scholar] [CrossRef] [PubMed]
- Cheng, S.P.; Cao, S.L.; Zhang, W. Analysis and application of urban road network structure system. Urban Roads Bridges Flood Control 2017, 5, 1–5. (In Chinese) [Google Scholar]
- Saaty, T.L. A scaling method for priorities in hierarchical structures. J. Math. Psychol. 1977, 15, 234–281. [Google Scholar] [CrossRef]
- Duan, L.Q.; Liu, L.G.; Guo, L.; Zhang, Y.J. Applying the AHP Method to the Weighted Values Determination of the Road Attributes. Hydrogr. Surv. Charting 2004, 3, 13. [Google Scholar]
- Bartier, P.M.; Keller, C.P. Multivariate interpolation to incorporate thematic surface data using inverse distance weighting (IDW). Comput. Geosci. 1996, 22, 795–799. [Google Scholar] [CrossRef]
- Chidthong, Y.; Tanaka, H.; Supharatid, S. Developing a hybrid multi-model for peak flood forecasting. Hydrol. Process. 2009, 23, 1725–1738. [Google Scholar] [CrossRef]
- Sudheer, K.P.; Jain, A. Explaining the internal behaviour of artificial neural network river flow models. Hydrol. Process. 2004, 18, 833–844. [Google Scholar] [CrossRef]
- Dixon, B. Applicability of neuro-fuzzy techniques in predicting ground-water vulnerability: A GIS-based sensitivity analysis. J. Hydrol. 2005, 309, 17–38. [Google Scholar] [CrossRef]
- Kia, M.B.; Pirasteh, S.; Pradhan, B.; Mahmud, A.R.; Sulaiman, W.N.A.; Moradi, A. An artificial neural network model for flood simulation using GIS: Johor River Basin, Malaysia. Environ. Earth Sci. 2012, 67, 251–264. [Google Scholar] [CrossRef]
- Chen, C.-S.; Chen, B.P.-T.; Chou, F.N.-F.; Yang, C.-C. Development and application of a decision group Back-Propagation Neural Network for flood forecasting. J. Hydrol. 2010, 385, 173–182. [Google Scholar] [CrossRef]
- Rumelhart, D.E.; Mcclelland, J.L. Parallel Distributed Processing: Explorations in the Microstructure of Cognition: Volume 1. Foundations; MIT Press: Cambridge, MA, USA, 1986; 564p. [Google Scholar]
- Tayfur, G.; Moramarco, T.; Singh, V.P. Predicting and forecasting flow discharge at sites receiving significant lateral inflow. Hydrol. Process. 2007, 21, 1848–1859. [Google Scholar] [CrossRef]
- Wardah, T.; Abu Bakar, S.H.; Bardossy, A.; Maznorizan, M. Use of geostationary meteorological satellite images in convective rain estimation for flash-flood forecasting. J. Hydrol. 2008, 356, 283–298. [Google Scholar] [CrossRef]
- Jiao, L.C.; Wang, L. A novel genetic algorithm based on immunity. IEEE T. Syst. Man. Cy. A 2000, 30, 552–561. [Google Scholar] [CrossRef]
- Li, H.H.; Li, M. A New Method of Image Compression Based on Quantum Neural Network. In Proceedings of the 2010 International Conference of Information Science and Management Engineering, Xi’an, China, 7–8 August 2010; pp. 567–570. [Google Scholar]
- Yan, T. An Improved Genetic Algorithm and Its Blending Application with Neural Network. In Proceedings of the 2010 2nd International Workshop on Intelligent Systems and Applications, Wuhan, China, 22–23 May 2010; pp. 1–4. [Google Scholar]
- Ouma, Y.O.; Tateishi, R. Urban Flood Vulnerability and Risk Mapping Using Integrated Multi-Parametric AHP and GIS: Methodological Overview and Case Study Assessment. Water 2014, 6, 1515–1545. [Google Scholar] [CrossRef]
- DHA, U. Internationally Agreed Glossary of Basic Terms Related to Disaster Management; UN DHA: Geneva, Switzerland, 1992. [Google Scholar]
- Crichton, D.; Mounsey, C. How the Insurance Industry Will Use Its Flood Research. In Proceedings of the Third MAFF Conference of Coastal and River Engineers, Newcastle, UK, 3–5 July 1996; pp. 131–134. [Google Scholar]
- Jenks, G.F.; Caspall, F.C. Error on Choroplethic Maps—Definition, Measurement, Reduction. Ann. Assoc. Am. Geogr. 1971, 61, 217–244. [Google Scholar] [CrossRef]
- Wu, Y.N.; Zhong, P.A.; Xu, B.; Zhu, F.L.; Ma, B. Changing of flood risk due to climate and development in Huaihe River basin, China. Stoch. Env. Res. Risk A 2017, 31, 935–948. [Google Scholar] [CrossRef]
- Dawod, G.M.; Mirza, M.N.; Al-Ghamdi, K.A. GIS-based estimation of flood hazard impacts on road network in Makkah city, Saudi Arabia. Environ. Earth Sci. 2012, 67, 2205–2215. [Google Scholar] [CrossRef]
- Jongman, B.; Kreibich, H.; Apel, H.; Barredo, J.I.; Bates, P.D.; Feyen, L.; Gericke, A.; Neal, J.; Aerts, J.C.J.H.; Ward, P.J. Comparative flood damage model assessment: Towards a European approach. Nat. Hazard Earth Syst. 2012, 12, 3733–3752. [Google Scholar] [CrossRef]


| Land Use Types | Forest | Herbaceous | Cropland | Wetland | Bare Area | Urban | Water |
|---|---|---|---|---|---|---|---|
| Runoff coefficient | 0.15 | 0.2 | 0.6 | 0.5 | 0.7 | 0.9 | 1 |
| CN | 26 | 30 | 56 | 48 | 68 | 90 | 95 |
| Index | Road Administration Grade | Design Speed | Number of Lanes | Annual Average Daily Traffic |
|---|---|---|---|---|
| Weight | 0.051 | 0.256 | 0.117 | 0.576 |
| Sample Size | Correct Evaluation | Underestimate | Overvalued | Accuracy | |
|---|---|---|---|---|---|
| Testing | 40 | 35 | 1 | 4 | 87.5% |
| City | Flood Risk | Urbanization Level | ||
|---|---|---|---|---|
| Sensitive Road Area | Urban Area to Total Area | Urban Population | Urban Road Density (km/km2) | |
| Changsha | 29.46% | 1.27% | 67.69% | 1.295 |
| Zhuzhou | 16.25% | 0.13% | 55.48% | 1.196 |
| Xiangtan | 10.71% | 0.31% | 50.11% | 1.290 |
| City | County or District | Flood Risk Zoning Level | Percentage of Sections in Sensitive Road Areas | Vulnerable Road Section (Start and End of Route, Section Code) |
|---|---|---|---|---|
| Changsha | Liuyang city | Level 3 | 34.95% | Liuyang–Dongyang, 003 |
| Ningxiang county | Level 3 | 30.46% | Liuyang–Ningxiang, 153 | |
| Yuhua district | Level 4 | 42.36% | Changsha airport expressway, 001 | |
| Tianxin district | Level 3 | 27.83% | Changsha expressway, 008 | |
| Yuelu district | Level 3 | 21.67% | Changsha–Yiyang, 004 | |
| Furong district | Level 5 | 62.33% | Beijing–Gangao, 010 | |
| Kaifu district | Level 5 | 64.92% | Changsha–Qiaoyi, 002 | |
| Changsha county | Level 6 | 79.27% | Liuyang–Ningxiang, 073 | |
| Wangcheng district | Level 5 | 72.68% | Changsha–Yiyang, 009 | |
| Zhuzhou | You county | Level 4 | 44.09% | Quanzhou–Nanning, 010 |
| Yanling county | Level 2 | 15.50% | Wuhan–Shenzhen, 031 | |
| Liling city | Level 4 | 52.21% | Shanghai–Kunming, 001 | |
| Hetang district | Level 5 | 64.23% | Shanghai–Kunming, 005 | |
| Lusong district | Level 5 | 67.45% | Liuyang–Hengyang, 036 | |
| Tianyuan district | Level 4 | 48.61% | Beijing–Gangao, 017 | |
| Shifeng district | Level 5 | 60.30% | Changsha–Zhuzhou, 004 | |
| Zhuzhou county | Level 5 | 68.72% | Liuyang–Hengyang, 040 | |
| Chaling county | Level 3 | 22.95% | Wuhan–Shenzhen, 019 | |
| Xiangtan | Xiangxiang city | Level 3 | 21.89% | Liling–Qizi, 124 |
| Shaoshan city | Level 4 | 31.89% | Shaoshan expressway, 003 | |
| Yuetang district | Level 4 | 43.19% | Shanghai–Kunming, 011 | |
| Xiangtan county | Level 3 | 25.12% | Zhuzhou–Shaoshan, 016 | |
| Yuhu district | Level 4 | 40.57% | Changtan west highway, 002 |
© 2019 by the authors. Licensee MDPI, Basel, Switzerland. This article is an open access article distributed under the terms and conditions of the Creative Commons Attribution (CC BY) license (http://creativecommons.org/licenses/by/4.0/).
Share and Cite
Chen, N.; Yao, S.; Wang, C.; Du, W. A Method for Urban Flood Risk Assessment and Zoning Considering Road Environments and Terrain. Sustainability 2019, 11, 2734. https://doi.org/10.3390/su11102734
Chen N, Yao S, Wang C, Du W. A Method for Urban Flood Risk Assessment and Zoning Considering Road Environments and Terrain. Sustainability. 2019; 11(10):2734. https://doi.org/10.3390/su11102734
Chicago/Turabian StyleChen, Nengcheng, Shuang Yao, Chao Wang, and Wenying Du. 2019. "A Method for Urban Flood Risk Assessment and Zoning Considering Road Environments and Terrain" Sustainability 11, no. 10: 2734. https://doi.org/10.3390/su11102734
APA StyleChen, N., Yao, S., Wang, C., & Du, W. (2019). A Method for Urban Flood Risk Assessment and Zoning Considering Road Environments and Terrain. Sustainability, 11(10), 2734. https://doi.org/10.3390/su11102734