Article

A New Method for Agricultural Market Share Assessment

1
The Doctoral School, The Bucharest University of Economic Studies, Bld. Dacia 41, 010404 Bucharest, Romania
2
UNESCO Department for Business Administration, The Bucharest University of Economic Studies, Calea Grivitei 2-2A, 010731 Bucharest, Romania
3
Department of Finance, The Bucharest University of Economic Studies, Mihail Moxa Str., 5–7, 010961 Bucharest, Romania
4
Department of Management, The Bucharest University of Economic Studies, Caderea Bastiliei Str. 2–10, 010374 Bucharest, Romania
*
Author to whom correspondence should be addressed.
Sustainability 2019, 11(1), 88; https://doi.org/10.3390/su11010088
Submission received: 5 November 2018 / Revised: 19 December 2018 / Accepted: 20 December 2018 / Published: 24 December 2018

Abstract

:
The Romanian market for plant protection products (PPP) is fragmented, dispersed, and very competitive. In recent years, there has been a constant decrease of farmers’ profitability, which has cascaded into the distribution of pesticides, fertilizers, and seeds. Since the structure of any market is dynamic over time, companies can determine the effectiveness of their different marketing strategies using analytical tools. As an alternative to econometric tools for predicting the market share in the farming industry, we propose the analytic network process (ANP) model, in which the market share is described as a network of nodes and clusters. Domain experts validate the ANP structure with respect to criteria and alternatives. The model allows the quantification of qualitative judgments provided by either experts or customers, through the highest eigenvalues. The eigenvalues are then further aggregated to deliver conclusive scores for the distribution of a particular market among competitors. The purpose of this research is twofold: (1) to develop an ANP-based tool for analyzing the competitive position (market share) of a company and (2) to help companies use the new tool in order to improve their business. The paper is of interest to PPP distributors, PPP manufacturers, customers, and policy-makers. The first two categories of stakeholders can use the analysis to better direct their marketing efforts, the customers can use it to select their providers, and the policy-makers can use it to evaluate and improve the control of PPP.

1. Introduction

1.1. Romanian Plant Protection Products Market

The value of the Romanian plant protection products (PPP) market increased from €227 million in 2012 to €358 million in 2014, reaching a staggering €463 million by the end of 2015 [1]. The market share shows the position of a company with respect to its competitors; it quantifies the impact that the company’s strategy and its tactical execution have had on business performance. In Romania, the market is divided between several national/regional distributors and a large number of local distributors, totaling 2560 permits granted by the Ministry of Agriculture and Rural Development for the commercialization of PPP. Together, the top ten distributors cover only 48% of the entire market share, and, while the market is evolving with an annual growth rate of 26%, the market share of large retailers follows a downtrend. While the market leader had a market share of just 12% in 2014, local distributors became increasingly competitive. The year 2014 was paradoxically designated a “good year” for Romanian agriculture: a record grain harvest induced a lower sale price and higher costs for storage and warehousing, leading to a dramatic decrease in profitability. Under such circumstances, the farmers became increasingly price-sensitive.
The distributors, representing the link between manufacturers and agricultural companies, are being forced to lower their profit margins, so they feel a pressing need to gain a stable market position in order to negotiate better conditions with producers. As mentioned, the local dealers experienced an increase in market share because they had competitive advantages. For example, pesticides are used in cases of insect attacks, immediately after rain, so delivery time is a critical factor in purchasing a product from a certain company; local distributors are more flexible than national and regional ones, offering more promptness and efficiency.

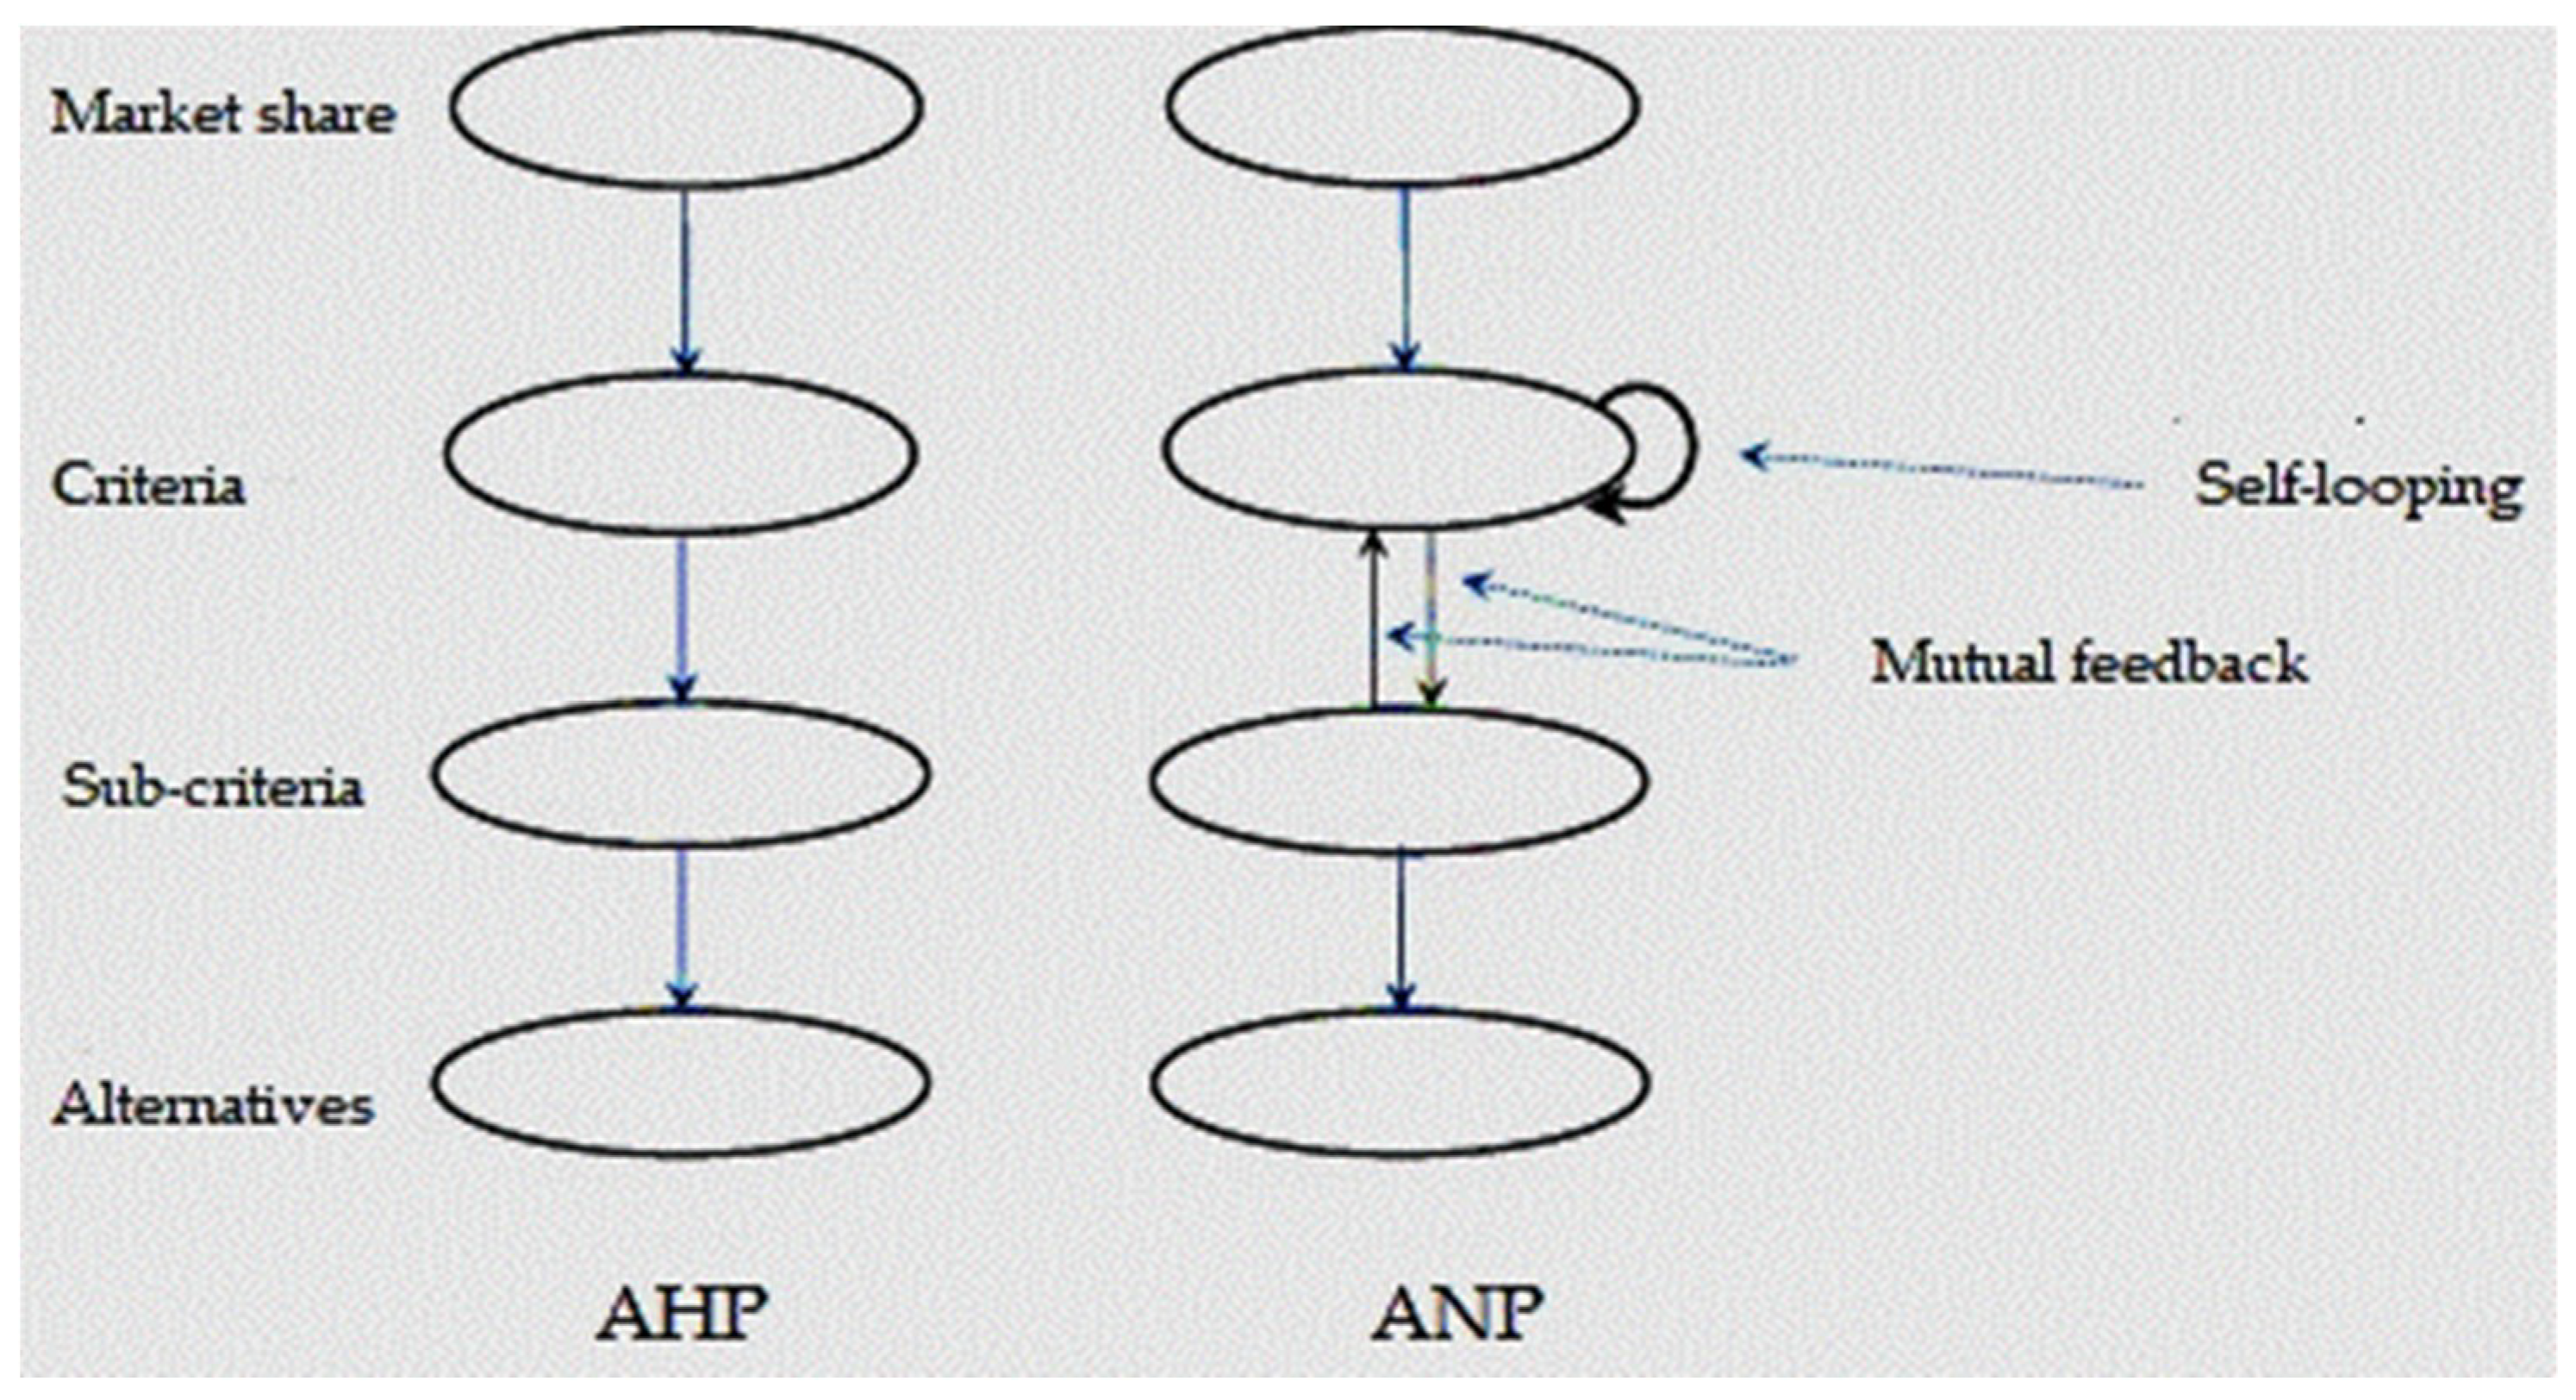
1.2. Analytic Network Process: A New Paradigm for Decision-Making

The Analytic Network Process (ANP) [2,3,4] is a general form of the Analytic Hierarchy Process (AHP), developed by Thomas L. Saaty and co-workers for multiple-discipline criteria decision-making [5,6]. The differences between the two processes are represented in Figure 1. AHP theory reflects the relative assessment of a variety of criteria using its fundamental scale from 1 to 9, through which it can integrate both qualitative/intangible and quantitative/tangible criteria to be evaluated [2]. The problem of decision-making within the AHP theory is divided into smaller structures, called clusters, on several levels of a hierarchy according to their importance, yet clusters can also be analyzed independently. A cluster contains one or more nodes, and in the case of interconnected clusters, the hierarchy turns into a network. The priorities of the clusters are obtained through pairwise comparisons.
Given the multicriteria decision context resulting from the factors presented in Section 1.1 (price sensitivity, storage cost, delivery time, flexibility), there is a stringent need for a tool to reconcile the opinions of both customers and experts. The ANP market share model is such a tool, providing strategic decision support for local, regional, or national distributors in order to help them strengthen their market position.
The development of the ANP model is much faster than traditional methods like regression or discriminant analyses. Having a validated model and assuming no changes in competitors’ strategies, a company can redirect its efforts in order to improve its performance and to deploy strategic decisions with market share growth objectives.
The utility of our study is twofold: at a macroeconomic level, the governmental decision-maker could use the resulting “theoretical” market share to implement agricultural policies, while at a microeconomic level, the analysis could be used as a feedback instrument by a particular competitor willing to improve its market performance.
Section 2 provides a review of AHP applications to marketing, supply chain management, and the specific paradigm of business-to-business (B2B). Section 3 explains the methodology used for building the model, applies the methodology specifically to the chosen market, and presents the technique of pairwise comparison in detail. Section 4 concludes the paper.

2. Literature Review

2.1. Analytic Hierarchy Process in Marketing and Supply Chain Management

Despite its apparently complicated apparatus, AHP has been whole-heartedly adopted by marketing science from its very beginning. In their avant la lettre 1981 paper, Vargas and Saaty analyzed the decision a company has to make as to whether to lease or to buy in terms of factors, hierarchy, and priorities, anticipating the future AHP concept [7]. The first proper application of AHP to marketing appeared later [8]. The authors used AHP (along with the technique of quality function deployment) for long-term, strategic decision-making in marketing policy. As in the present paper, their analysis showed how a company can evaluate itself among its competitors. More recently, in 2016 Mendes et al. performed an AHP analysis of their company’s market position in order to take steps towards it becoming a demand-driven company [9]. Wu et al. [10] integrated ANP into a complex marketing strategy tool for private hotel managers, aimed at gaining an advantage within their competitive environment. Kim and Kim used AHP to diagnose the customer relationship management (CRM) of a company [11]; they conducted primary and secondary research (see Section 3 below) to build a hierarchical map of key performance indicators for the CRM scorecard. Lam and Chin applied AHP to detect critical factors in the practice of company conflict management, coming up with a communication model to be used in relationships with both clients and suppliers [12].
Within the Supply Chain Management (SCM) framework, Gorane and Kant [13] aggregated data from two companies in a pairwise comparison (see Section 4 below) and then applied AHP to determine the critical elements for a successful preparation and execution of SCM. Examining the obstacles for the implementation of green SCM in Indian manufacturing industries, other researchers [14] identified and prioritized the critical barriers via AHP. Fu et al. [15] applied a fuzzy AHP to decide whether or not to externalize B2B transactions via the Internet; their analysis pointed out the alteration of AHP scores of the strategic factors involved in the decision when moving from one industry to another under different degrees of market freedom. Similarly, Cheng and Lee [16] applied ANP to the problem of outsourcing reverse logistics, an important component of SCM in global high-tech manufacturing, while Liu and Hai [17] designed a voting AHP method for selecting suppliers.
For an extensive review of AHP applications in operations management/operational research, the reader is referred to references [18,19].

2.2. Business-to-Business Marketing

In many analyses, delivery time and price are the only two criteria taken into consideration when quantifying farmers’ satisfaction with a distribution company. In reality, there are a multitude of factors that influence customer satisfaction within the B2B market, first and foremost of which is the quality of the delivered products. These factors are all important in building the customer–supplier relationship, in the Internet era as well as before [20,21]. Even if social integrative relationships between manufacturer and suppliers can be built with the aid of information technology [22], B2B purchases are still centered on cost, quality, relationship management, and technological criteria [23,24,25,26]. Distributors also are trying to mitigate the inherent risks associated with the use of their product by providing know-how and experience. Subjective/qualitative factors like trust, involvement, customer loyalty, and retention influence the distributor’s performance [27,28,29,30]. For example, trust is defined as the belief of a company that a business partner will undertake the actions that will positively impact that company and will not act improperly or to its detriment [31]; clearly, this belief is hard to quantify.
Mapping a particular market is a sensitive, continuous process, with each player trying to use any available data in order to outgrow its competitors [32]. Going deeper into the relationship analysis of B2B markets, Vieira et al. [33] distinguished between subjective, customer-focused effects (loyalty, willingness to recommend, etc.) and objective, provider-focused outcomes (market share, share of business, etc.). Building on the relational antecedents, mediators, and objective outcomes, concepts previously introduced by Palmatier et al. [34], who analyzed the share of business using four competing interaction models of relationship marketing. Defined as the “proportion of potential sales to a specific customer captured by a seller” ([35] (p. 213); [33]), share of business is a reciprocal performance objective measure of the market share. The results of Vieira et al. [33] point out the limited predictive power of relational constructs with respect to objective outcomes and also advocate for the low portability of such studies across different industries and different economic cultures.
There are several econometric approaches in the literature for computing/predicting the market share and more generally for mathematically describing the effect of trust and loyalty on creating value within a B2B market [36,37,38,39].
As recent studies suggest, a new trend in the global business environment is that customer companies tend “to reduce the number of suppliers to focus on establishing stable and close relationships with a small number of them” [39] (p. 289).
Overall, one can group the factors influencing the success of agricultural distributors into five main categories: product based, comparative performance, process control, supply, and brand functions [40]. We shall use a similarly improved structure in designing the ANP model of the Romanian PPP market share.

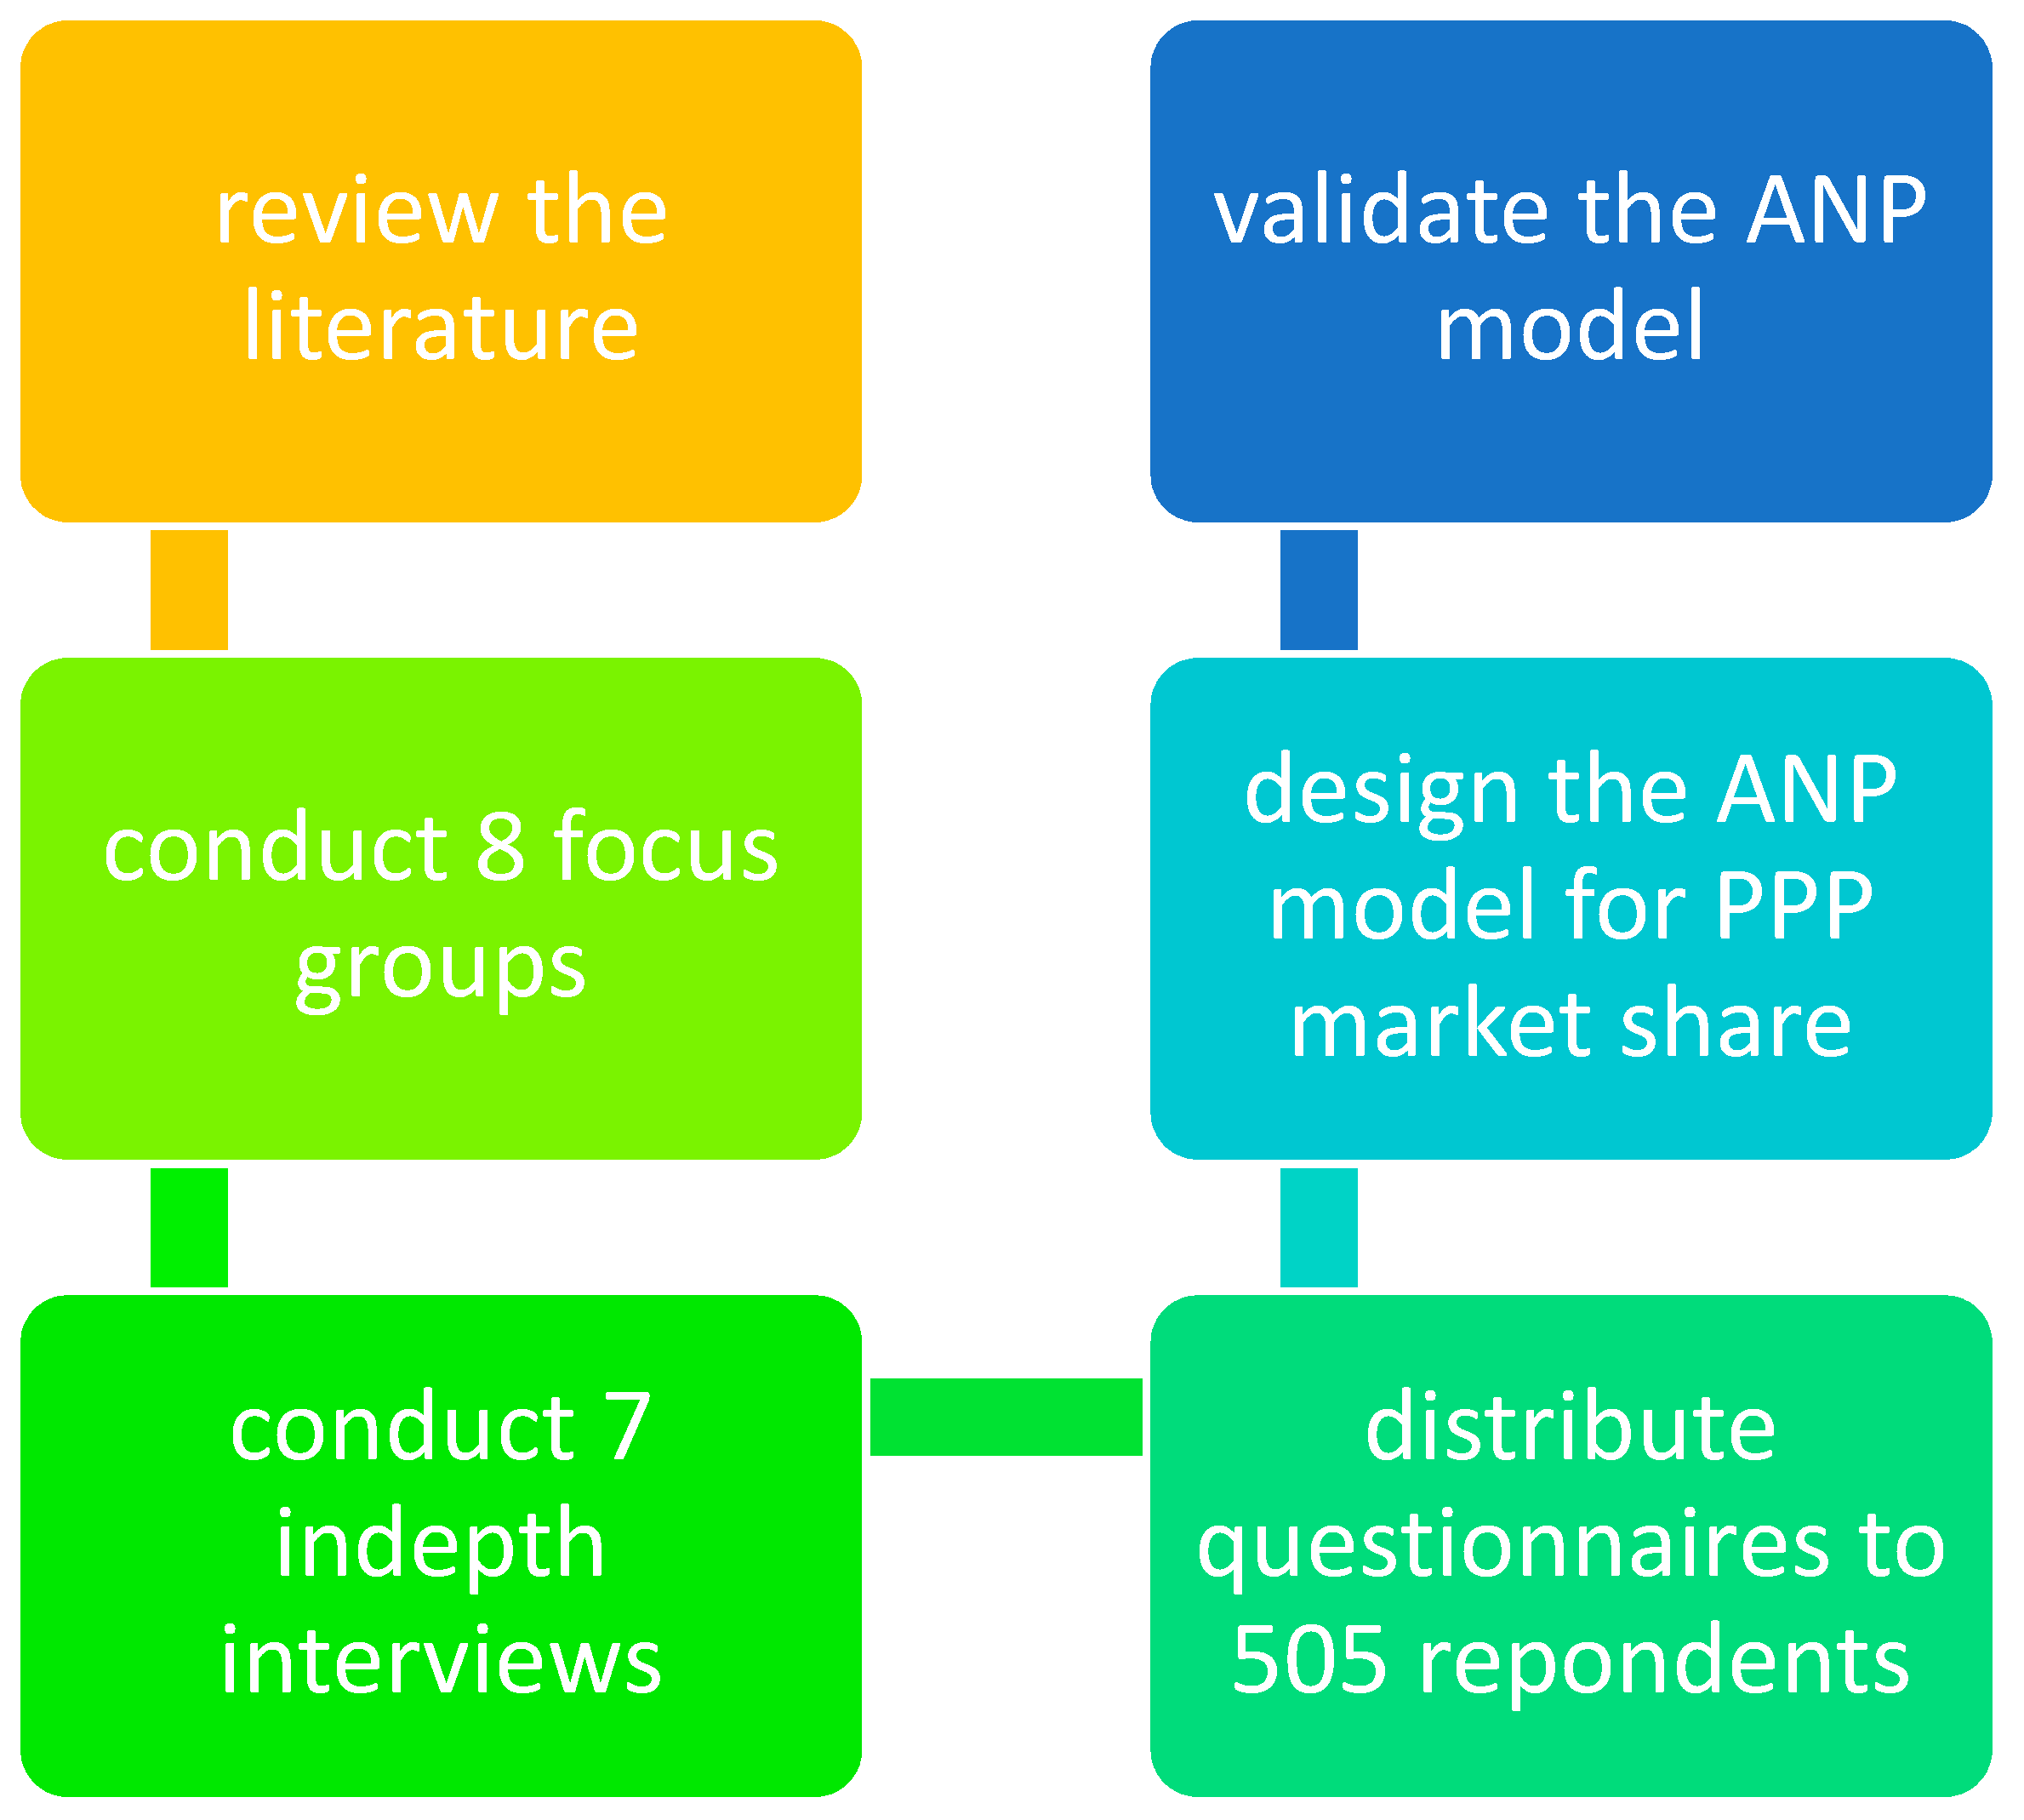
3. Research Design and Method
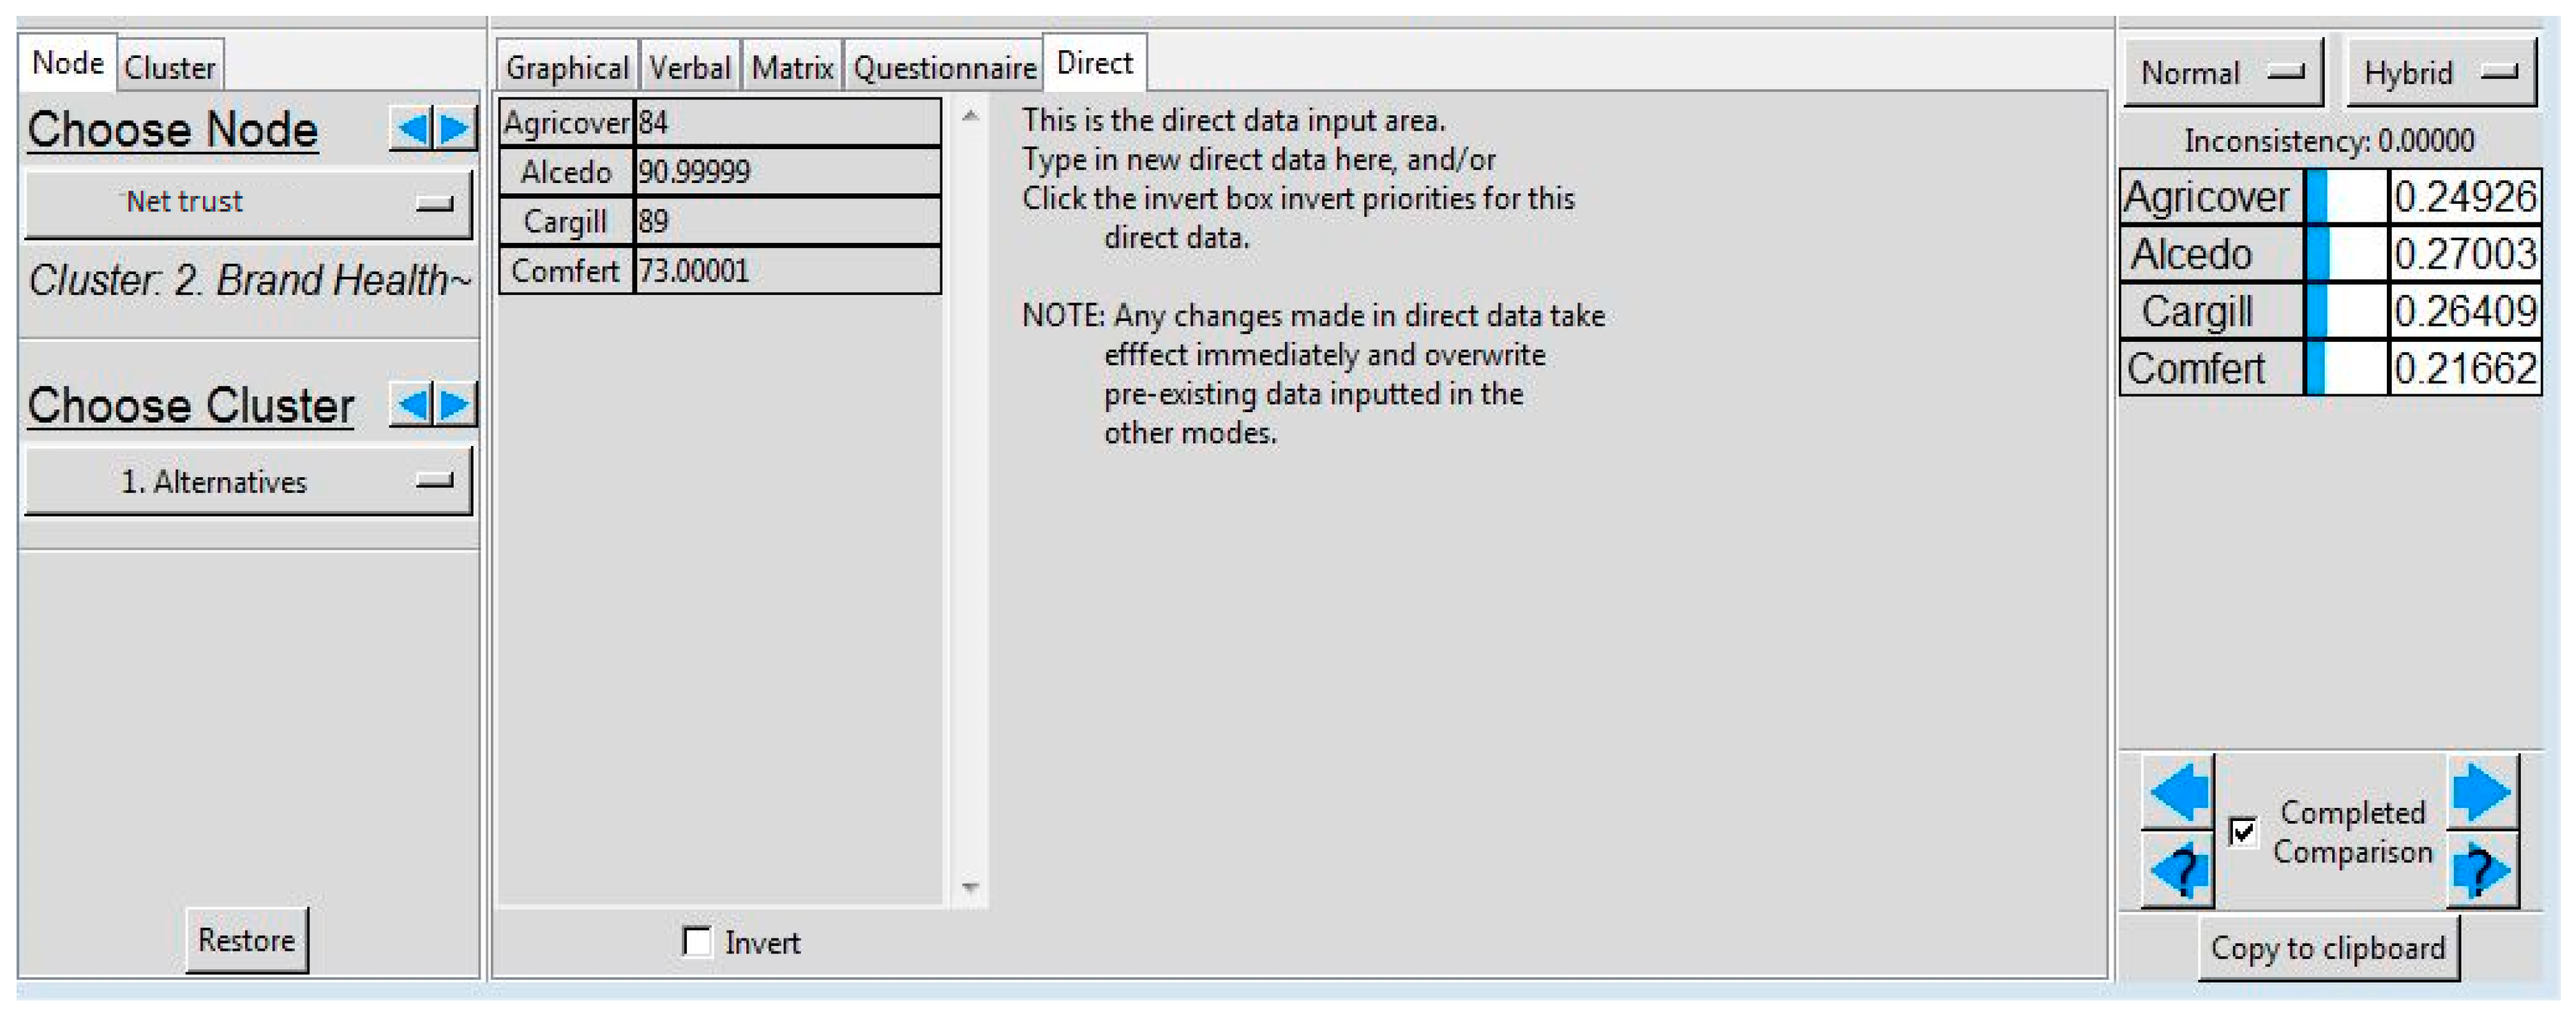
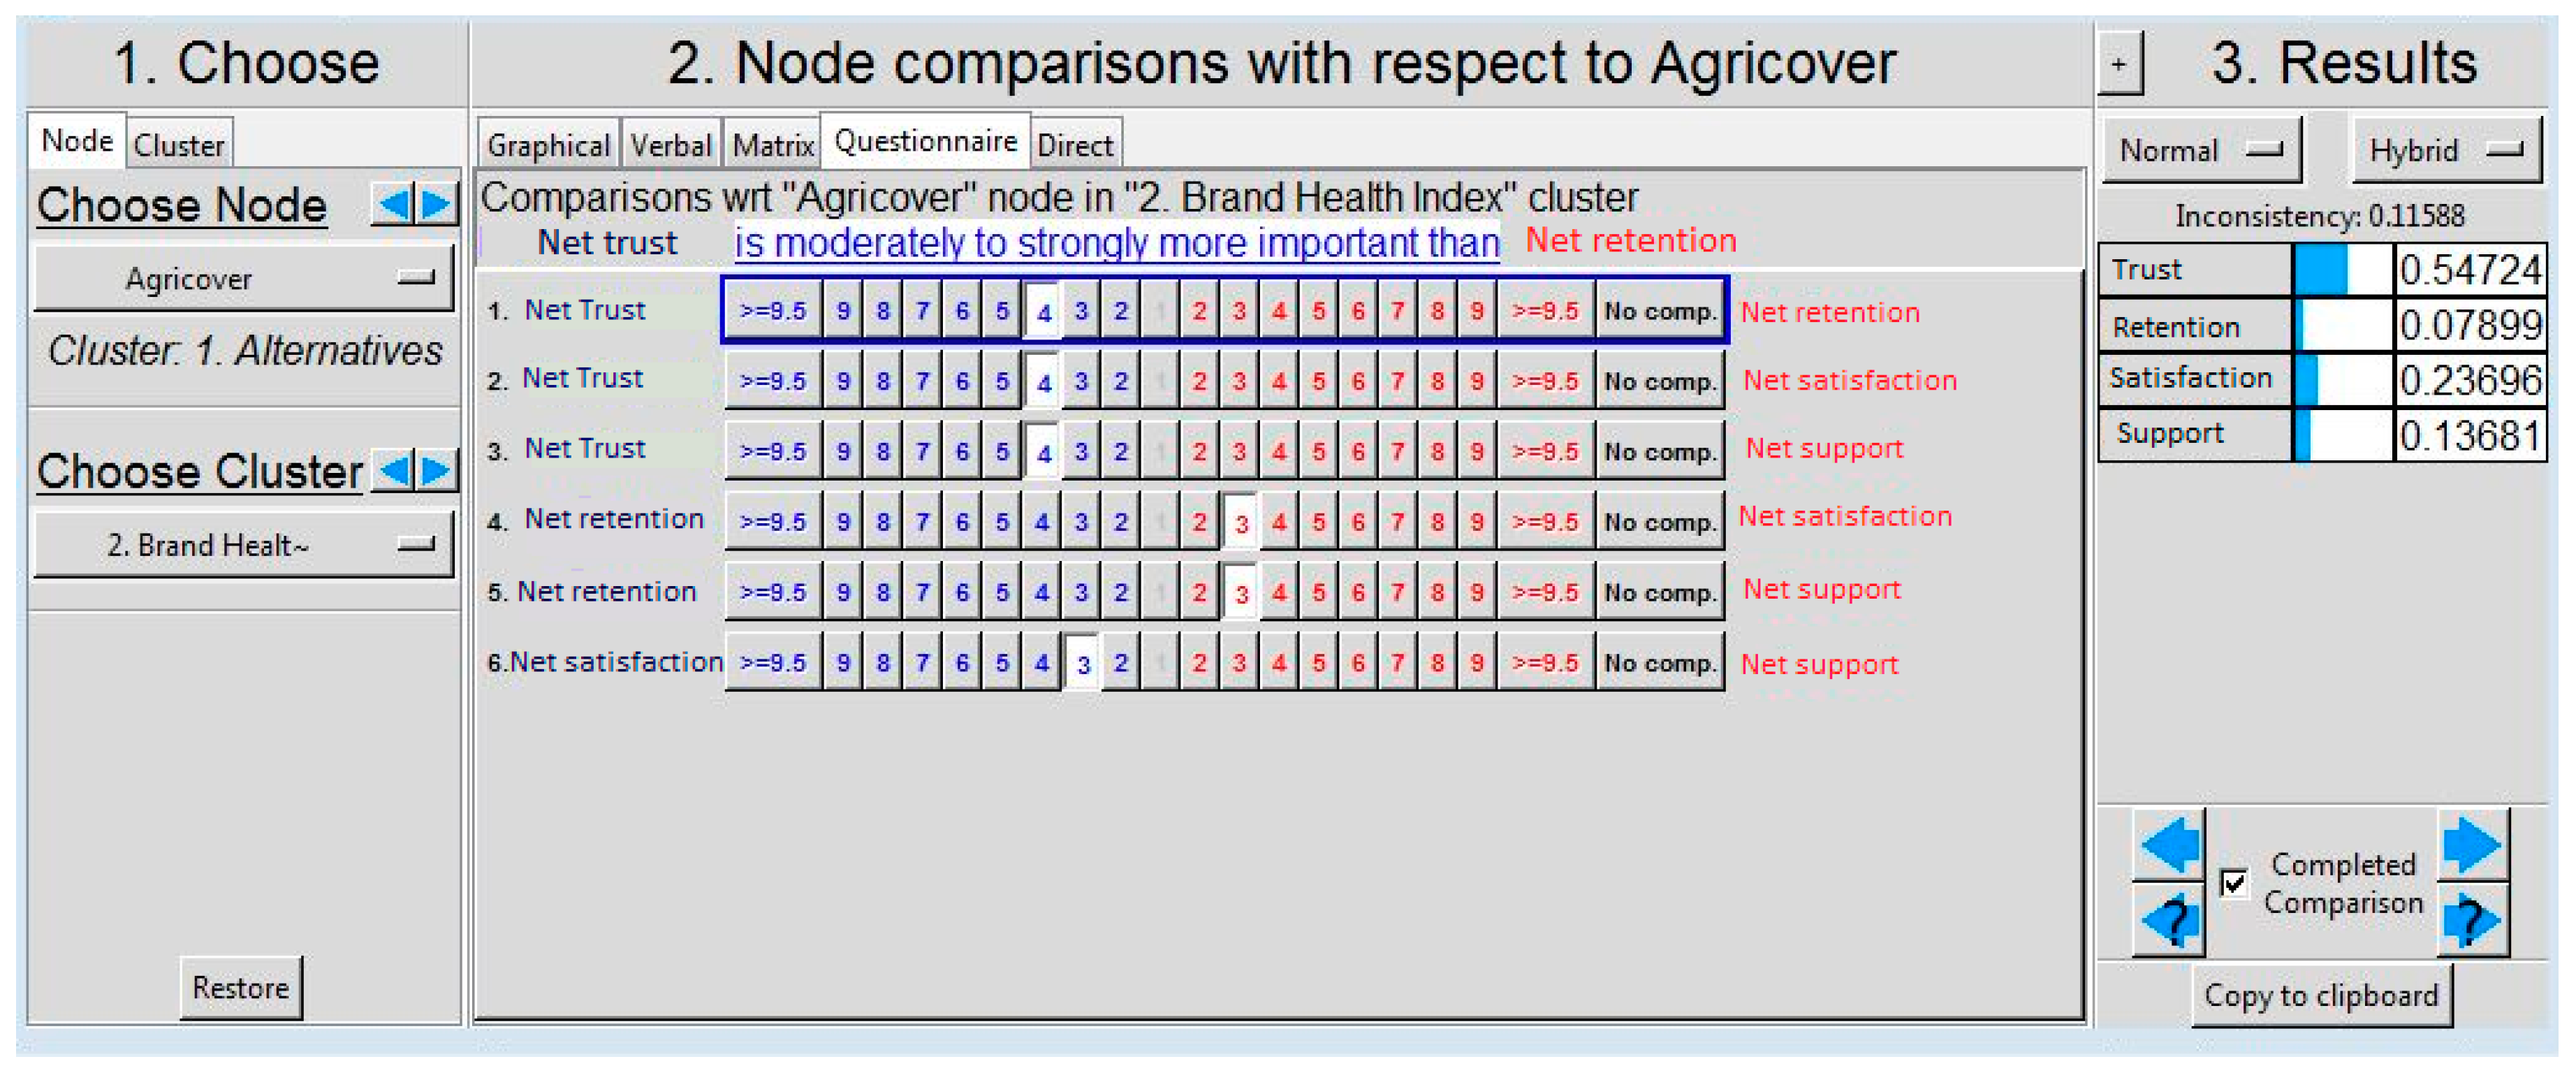
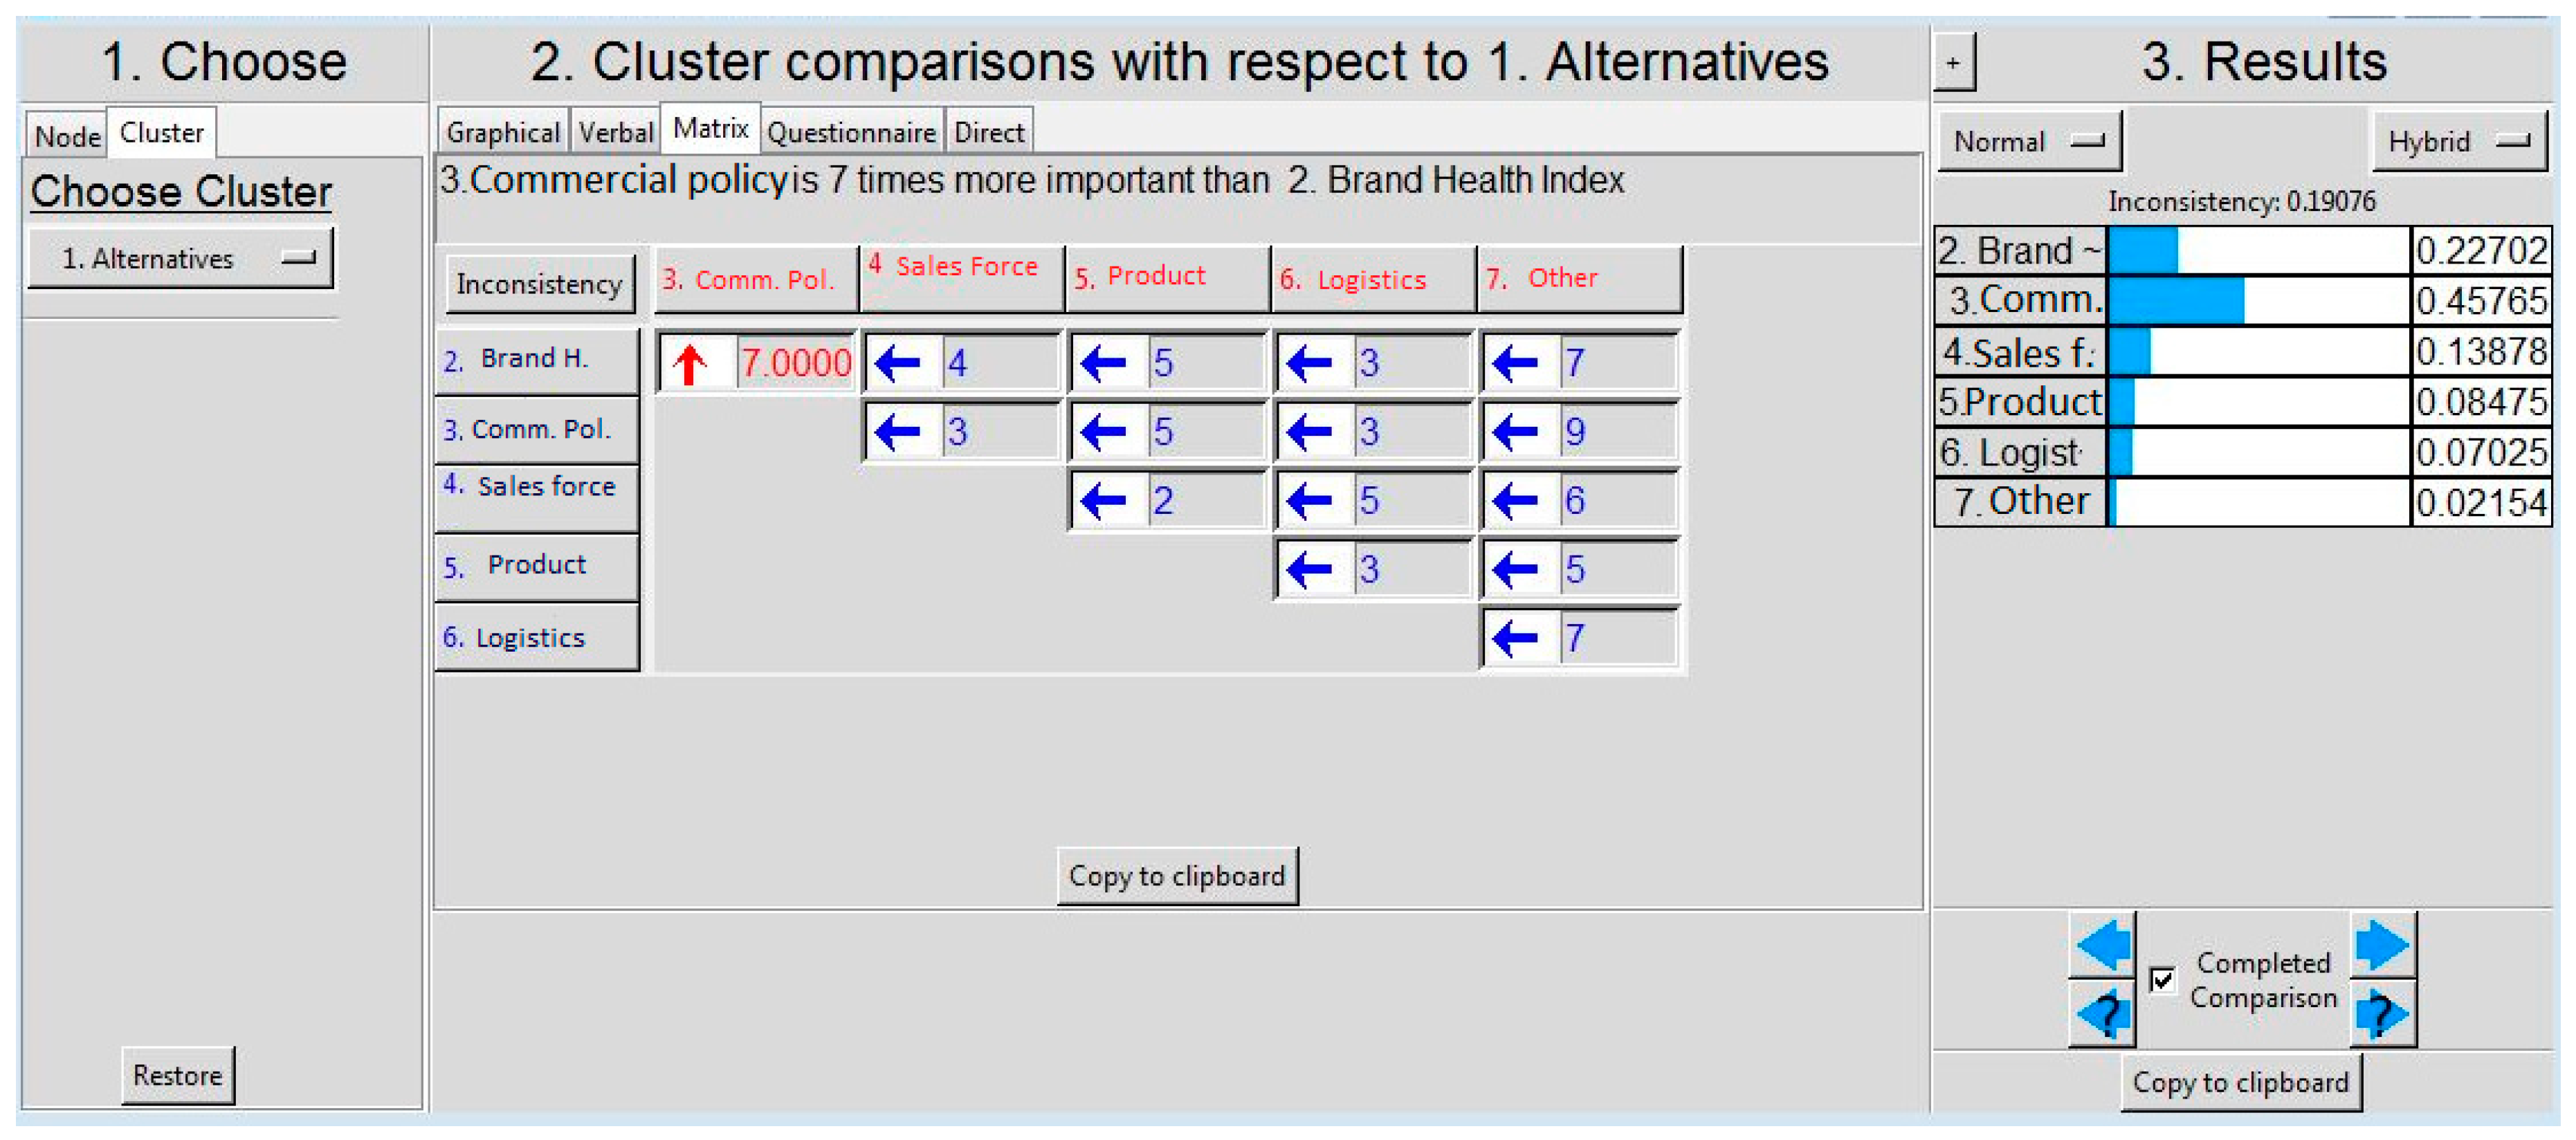
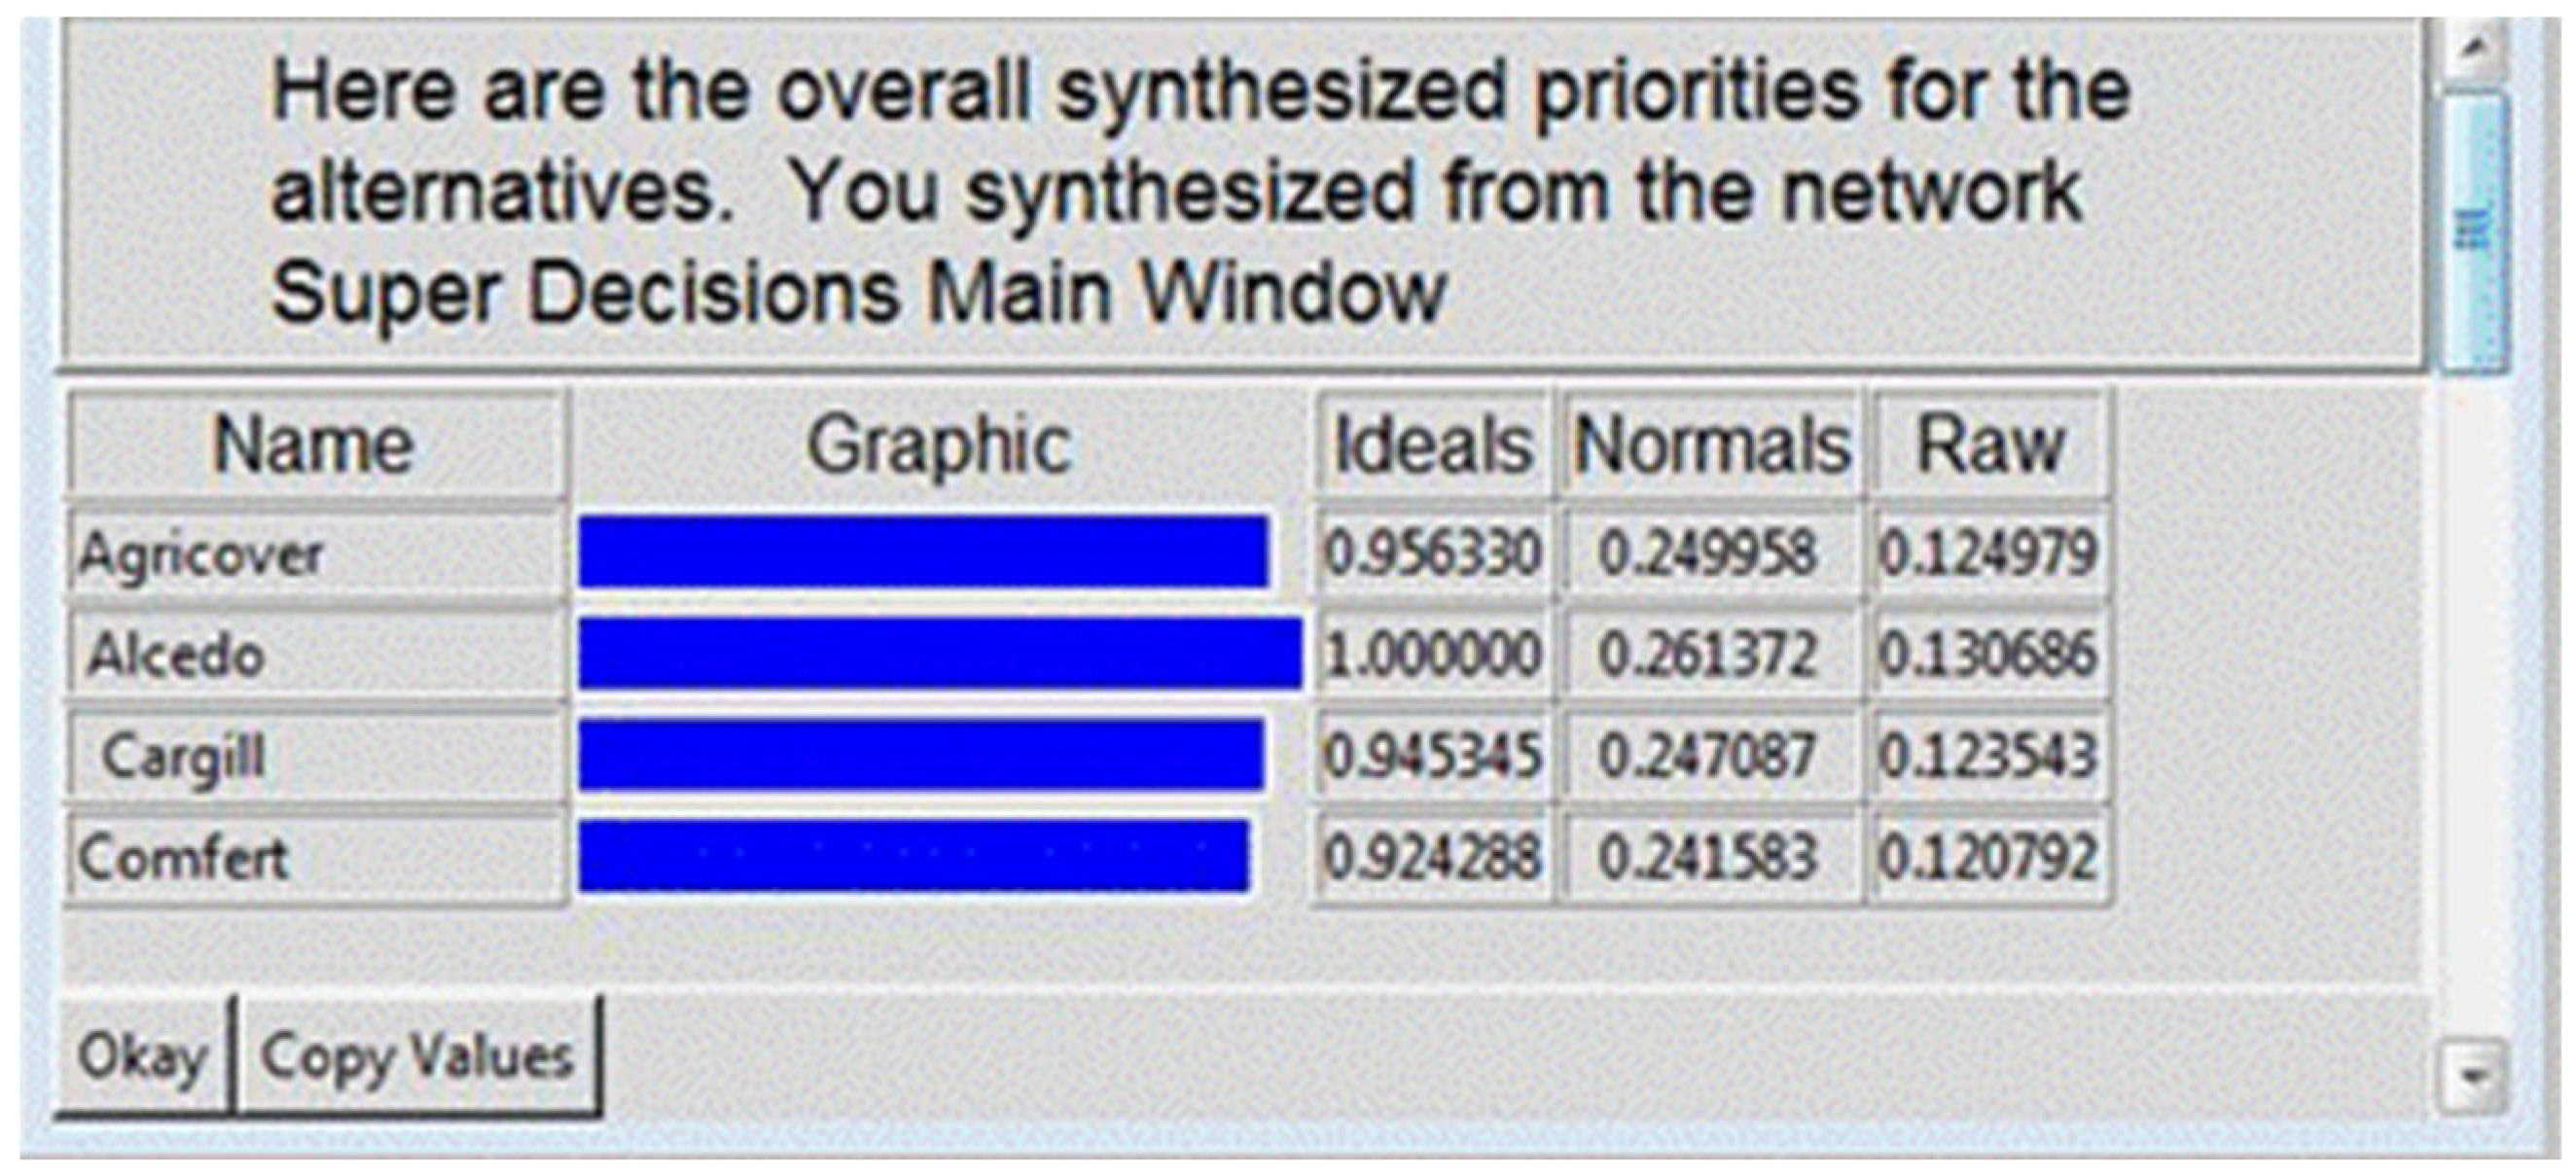
The design of our research used a hybrid method combining quantitative and qualitative methodologies (Appendix A). Data was collected from a market research study, media monitoring, and management and client experience. To identify the dimensions of satisfaction and the factors that determine whether or not to buy from a particular distributor, we conducted a two-stage qualitative study. The first stage was an interview with the managers of a distribution company; it consisted of eight mini-focus groups of four managers with in-house expertise. In the second stage, we turned the attention to the farmers. Their insight was captured during seven in-depth interviews, with an emphasis on noticing the differences in perception and on validating the set of variables to be used for quantitative research. Thus, for the development of the questionnaire, we chose to include the following components generating satisfaction and influencing a distributor’s performance: Brand health index, Trade conditions, Products, Delivery, Servicing, Sales force, and Supply.
Next, the quantitative study was aimed at determining the relative positioning of the companies in the industry, according to the farmers’ perception of a number of performance indicators. Each feature identified in the qualitative research phase was framed together with related subcategories. A quantitative study was then conducted, using a questionnaire administered during a 60 min face-to-face interview with each farmer. The surveyed population was represented by Romanian agricultural enterprises that work with more than 100 hectares of crop (wheat, corn, etc.) to make sure that these farmers continued to set up the technological sheet of a culture. The sample consisted of 505 farmers, among which 300 were a national representative sample, and 205 were a boost sample. The sampling method employed was non-probabilistic purposive sampling in which the members were selected in accordance with the purpose of our study. The results were used to develop the ANP market share model and perform pairwise comparisons to competitors with respect to each node. Dedicated software (Super Decisions) was used. Within this model, the relevant alternatives are represented by the main distributors of agricultural inputs, and the main criteria according to which they are judged are the following: Brand health index, Commercial policy, Sales force, Products, Logistics, and Servicing. The estimation of the market share is structured as a network of nodes and clusters. The decision alternatives in the model are the competing companies, and the results are coefficients that describe the relative dominance of the alternatives. The results obtained with the Super Decisions software were validated with the actual market share measured by the annual industry study conducted by Kleffmann Group Romania.
The list of clusters from the secondary research, literature review, and primary research (quantitative and qualitative) is given in Table 1. Similar ANP designs for different economic applications are given in references [41,42,43].

4. Results

Figure 2 shows the Node/Cluster window in the model implementation software Super Decisions (available at [44]). For example, the sales force cluster consists of the following nodes: level of technical expertise and understanding of agriculture; promptness and responsiveness; friendly, willing to help farmers; stability of personnel; networking skills; and seriousness, keeping promises.
After all clusters and nodes are created, we select one node in a cluster and connect it with other nodes in other clusters; to represent the connections, the program draws arrows between the connected nodes. Connections from a criterion to an alternative can be set to be either one-way or two-way. Moreover, criteria which do not communicate with alternatives and exert influences only upon themselves are self-looped. In order to make a decision in a real situation, it is important to keep in mind what alternatives are available on the market, namely, the competitors.
Next, the nodes within a cluster are pairwise compared according to how important they are to the nodes from other clusters connected to their own. We also make pairwise comparisons among clusters, in order to determine to which extent (expressed in priority vectors) each cluster influences the market share.
In the resulting ANP model, we compare companies according to performance for a particular cluster, and we compare clusters according to the importance for the company’s performance and nodes according to the focus and strategy of each player on the market.
The input data for comparison comes from three sources: farmers working with PPP distribution companies, experts in competitive intelligence who monitor the activity of competitors and identify their strategic directions, and persons in the top management of a PPP distribution company who know the market.
Farmers working with distribution companies can do a comparison of the players according to delivery time, price, the confidence they have, etc. This first input was collected through the quantitative study presented in Section 3 and was used to evaluate each of the nodes of the “alternatives” cluster depending on each node in clusters 2–7.
The interface of the Super Decisions software allows us to make comparisons in two ways: directly or through the questionnaire. The scores obtained for each company during the study were introduced in the direct mode—this mode of questionnaire is used if the judgments are made from a qualitative point of view and expressed numerically by a fundamental scale (see below). A detailed discussion of the optimal choice of numerical scale can be found in references [45,46,47].
Figure 2 depicts such a comparison of companies with respect to the level of trust, based on the experience the farmers had with each company. The window consists of three areas. The first one is “Choose”. This is where we choose
  • If we want to compare nodes between themselves, or clusters (in Figure 2 we have nodes);
  • The nodes for the pairwise comparisons (net trust); and
  • The defining clusters where the compared nodes are (in Figure 2 we have a cluster with the competitors, previously set as the alternatives of the model): Agricover, Alcedo, Cargill, Comfert.
The second area is the “Node/cluster comparisons with respect to …”, where paired comparisons are actually made directly. The third area is “Results”.
The relative importance of the compared nodes is calculated via priority vectors from the matrix obtained after evaluations. We can find it by clicking on the tab “Matrix” from the second window. Mathematically, a priority vector is the eigenvector of the matrix obtained via the value judgments. The vectors reflect the relative priorities of elements that sum up to 1. After completing all the comparisons for a node, we move to the next one, and continue until we make all possible comparisons.
The second input source is the Competitive Intelligence (CI) expert who tracks the competitors’ activity and communication (profiling), so she can express an objective standpoint regarding the strategy and focus of each of the market players. The CI expert compares nodes (pairwise) within each cluster (2–7) with respect to each node (competitor) from the alternatives cluster and evaluates the strategy of each competitor. Due to the qualitative nature of the judgments, we used the questionnaire mode. Pairs were compared using a carefully designed tool—the fundamental scale [3]—used to convert verbally expressed judgments into numerical scores (see Table 2).
Resorting to the fundamental scale depicted in Table 2 and her knowledge regarding the competitive environment, the CI expert fills in the questionnaire on how nodes are compared in each cluster with respect to each competitor, as shown in Figure 3.
The last round of comparisons within the modelling stage was made by experts in the specific field of activity. Top management expressed their opinion with respect to the clusters and how much they influence the company performance, as shown in Figure 4.
Top management believes that the criteria that influence the company performance and determine whether the consumers choose that particular company as a business partner are as follows: Favorable commercial policy, Brand health index, and Sales force. The Product cluster is not in the top three, because in the case of local distributors, they tend to have approximately the same product from the same producers.

5. Discussion

Once the pairwise comparison was conducted, the Super Decisions program built three matrices, named unweighted supermatrix, weighted supermatrix, and limit supermatrix.
The unweighted supermatrix is a two-dimensional matrix that contains the general priorities of paired comparisons, which we have seen for each comparison in the results area on the right. The weighted supermatrix is obtained as a product between priorities from the unweighted supermatrix and priorities obtained from cluster comparison. The limit supermatrix is obtained by multiplying the supermatrix by itself until it stabilizes; that is, all the columns of the limit supermatrix are identical. These columns represent the market shares we had to estimate in their initial raw form. The results for estimated market shares are summarized in Figure 5.
The relative market shares of the alternatives included in the model—0.249, 0.261, 0.247, and 0.241—were found as synthesized results in the software and obtained through normalizing the values for the alternatives taken from the limit supermatrix raw column.
To understand the significance of these results, we need to compare them with the available market data; in our case, the data were obtained from the study conducted by the research company Kleffmann [1].
Given two datasets—the normalized one from the Super Decisions software (column 1, Table 3) and the actual normalized one (column 3, Table 3)—we computed two matrices: A for the estimated market shares (Table 4) and B for the real market shares (Table 5). We denote the alternatives Agricover, Alcedo, Cargill, and Comfert by A1, A2, A3, and A4, respectively, and depict the market share of each alternative in both cases: Super Decisions and reality.
The validation of the results was done by determining how close to each other the eigenvectors of matrices A and B are. When two vectors are close, they are called compatible. This compatibility index is calculated using the Hadamard product for matrices—a binary operation performed between two matrices of the same size so that the new item (i, j) is the resulting product between matrix elements of order (i, j) from the initial matrices [2]. The recommended upper threshold for the Compatibility Index is 1.1. In our case, the value of the Compatibility Index was 1.14, quite close to the threshold, so we can conclude that the model is suitable for improving the company’s performance. The difference of 0.04 is explained by the fact that input data from farmers is biased by general perception towards market players that have more business lines and activities related to planting material, fertilizers, diesel trade, agricultural funding, etc.

6. Conclusions

If companies want to survive and flourish in the market, they need to rethink their strategies in terms of market share assessments. Many companies ignore their actual market share, disregarding the fact that market shares are a reflection of consumer choices. We consider the market share to be one of the most important metrics for business success. By engaging in this type of measurement, companies can determine the effectiveness of their efforts in implementing different strategies. Additionally, market share models can help companies obtain insights into the impact of each brand’s marketing efforts in the context of a competitive market.
As an alternative to econometric tools for computing the market share, the paper advances the idea that market share can be measured by analytic network processes, and offers such a tool for the farming industry. The models for estimating market shares are an effective way of reflecting the market situation and of transforming experts’ knowledge into usable intelligence. This allows the quantification of qualitative judgments, which would not be possible in traditional market share assessment methods. The research is confined to the knowledge level of experts taking part in the study and is relevant strictly to their industry. The model was validated by the Compatibility Index measurement, which proved that the model is suitable for improving companies’ performance in the market.
The paper is of interest to PPP distributors, PPP manufacturers, customers, and policy-makers. The first two categories of stakeholders can use the analysis to better direct their marketing efforts. The customers can use it to select their providers, while the policy-makers can use it to evaluate and improve the control of pesticides.
The main limitation of the methodology proposed in this paper is its mathematical complexity. It may be challenging to explain the ANP concept and the process it involves to a company’s management team, so it may be regarded as a bit too complex as a decision tool to be adopted by a company. However, the ANP model is a powerful instrument which can provide a deep understanding of the problem under research: how different factors affect the market share in the PPP industry.
Another possible critique of the present work is that we did not process the data by using alternatives to Saaty’s scale, like the scale in reference [48] and that by Ma and Zheng [49]. We could have then compared the results and provided a distinct validation. Nonetheless, it is generally accepted today that the Saaty scale is more robust than the Likert scale, and this is why we used it to the exclusion of any and all others.

Author Contributions

Conceptualization, A.P.; Methodology, A.P. and S.H.; Software, A.P.; Formal Analysis, A.P. and S.H.; Investigation, R.P.; Resources, A.P. and M.N.; Writing-Original Draft Preparation, A.P. and M.N.; Writing—Review & Editing, S.H. and R.P.

Funding

This research received no external funding.

Conflicts of Interest

The authors declare no conflict of interest.

Appendix A

Figure A1. Research design. Source: Authors’ own processing.
Sustainability 11 00088 g0a1

References

  1. Gimbasanu, G. The Evolution of the Plant Protection Product Market. Kleffmann Group Romania. 2016. Available online: http://agrointel.ro/41432/cum-a-evoluat-piata-produselor-pentru-protectia-plantelor-studiu-kleffmann-group/ (accessed on 7 April 2016).
  2. Saaty, T.L. The Analytic Hierarchy and Analytic Network Measurement Processes: Applications to Decisions under Risk. Eur. J. Pure Appl. Math. 2008, 1, 122–156. [Google Scholar]
  3. Saaty, T.L. Theory and Applications of the Analytic Network Process; RWS Publications: Pittsburgh, PA, USA, 2005; ISBN 978-971-8886031-6-3. [Google Scholar]
  4. Saaty, T.L. Fundamentals of the Analytic Network Process. In Proceedings of the International Symposium on the Analytic Hierarchy Process, Kobe, Japan, 12–14 August 1999. [Google Scholar]
  5. Saaty, T.L.; Vargas, L.G. Models, Methods, Concepts & Applications of the Analytic Hierarchy Process; Kluwer Academic Publishers: Boston, MA, USA, 2001. [Google Scholar]
  6. Saaty, T.L. Highlights and critical points in the theory and application of the Analytic Hierarchy Process. Eur. J. Oper. Res. 1994, 74, 426–447. [Google Scholar] [CrossRef]
  7. Vargas, L.G.; Saaty, T.L. Financial and intangible factors in fleet lease or buy decision. Ind. Mark. Manag. 1981, 10, 1–10. [Google Scholar] [CrossRef]
  8. Lu, M.H.; Madu, C.N.; Kuei, C.; Winkour, D. Integrating QFD, AHP and benchmarking in strategic marketing. J. Bus. Ind. Mark. 1994, 9, 41–50. [Google Scholar] [CrossRef]
  9. Mendes, P.; Leal, J.E.; Thomé, A.M.T. A maturity model for demand-driven supply chains in the consumer product goods industry. Int. J. Prod. Econ. 2016, 179, 153–165. [Google Scholar] [CrossRef]
  10. Wu, C.-S.; Lin, C.-T.; Lee, C. Optimal marketing strategy: A decision-making with ANP and TOPSIS. Int. J. Prod. Econ. 2010, 127, 190–196. [Google Scholar] [CrossRef]
  11. Kim, H.-S.; Kim, Y.-G. A CRM performance measurement framework: Its development process and application. Ind. Mark. Manag. 2009, 38, 477–489. [Google Scholar] [CrossRef]
  12. Lam, P.-K.; Chin, K.-S. Identifying and prioritizing critical success factors or conflict management in collaborative new product development. Ind. Mark. Manag. 2005, 34, 761–772. [Google Scholar] [CrossRef]
  13. Gorane, S.; Kant, R. A case study for predicting the success possibility of supply chain practices implementation using AHP approach. J. Bus. Ind. Mark. 2016, 31, 137–151. [Google Scholar] [CrossRef]
  14. Govindan, K.; Kaliyan, M.; Kannan, D.; Haq, A.N. Barriers analysis for green supply chain management implementation in Indian industries using analytic hierarchy process. Int. J. Prod. Econ. 2014, 147, 555–568. [Google Scholar] [CrossRef]
  15. Fu, H.-P.; Chao, P.; Chang, T.-H.; Chang, Y.-S. The impact of market freedom on the adoption of third-party electronic marketplaces: A fuzzy AHP analysis. Ind. Mark. Manag. 2008, 37, 698–712. [Google Scholar] [CrossRef]
  16. Cheng, Y.-S.; Lee, F. Outsourcing reverse logistics of high-tech manufacturing firms by using a systematic decision-making approach: TFT-LCD sector in Taiwan. Ind. Mark. Manag. 2010, 39, 1111–1119. [Google Scholar] [CrossRef]
  17. Liu, F.H.F.; Hai, H.L. The voting analytic hierarchy process method for selecting supplier. Int. J. Prod. Econ. 2005, 97, 308–317. [Google Scholar] [CrossRef]
  18. Subramanian, N.; Ramanathan, R. A review of applications of Analytic Hierarchy Process in operations management. Int. J. Prod. Econ. 2012, 138, 215–241. [Google Scholar] [CrossRef]
  19. Vaidya, O.S.; Kumar, S. Analytic hierarchy process: An overview of applications. Eur. J. Oper. Res. 2006, 169, 1–29. [Google Scholar] [CrossRef]
  20. Boyd, D.E.; Spekman, R.E. Internet usage within B2B relationships and its impact on value creation: A conceptual model and research propositions. J. Bus.-Bus. Mark. 2004, 11, 9–34. [Google Scholar] [CrossRef]
  21. Goodman, P.S.; Fichman, M.; Lerch, F.J.; Snyder, P.R. Customer-firm relationships, involvement, and customer satisfaction. Acad. Manag. J. 1995, 38, 1310–1324. [Google Scholar]
  22. Anselmi, K.; Frankel, R.; Whipple, J.M. Performance in product versus service supplier relationships. J. Bus.-Bus. Mark. 2002, 9, 27–43. [Google Scholar] [CrossRef]
  23. Liu, A.H.; Bui, M.; Leach, M. Considering technological impacts when selecting food suppliers: comparing retailers’ buying behavior in the United States and Europe. J. Bus.-Bus. Mark. 2013, 20, 81–98. [Google Scholar] [CrossRef]
  24. Mysen, T.; Svensson, G.; Hogevold, N. Relationship quality—relationship value and power balance in business relationships: Descriptives and propositions. J. Bus.-Bus. Mark. 2012, 19, 248–285. [Google Scholar] [CrossRef]
  25. Kumar, A.; Grisaffe, D.B. Effects of extrinsic attributes on perceived quality, customer value, and behavioral intentions in B2B settings: A comparison across goods and service industries. J. Bus.-Bus. Mark. 2004, 11, 43–74. [Google Scholar] [CrossRef]
  26. Claycomb, V.; Frankwick, G.L. The dynamics of buyers’ perceived costs during the relationship development process. J. Bus.-Bus. Mark. 1997, 4, 1–37. [Google Scholar] [CrossRef]
  27. Skard, S.; Nysveen, H. Trusting beliefs and loyalty in B-to-B self-services. J. Bus.-Bus. Mark. 2016, 23, 257–276. [Google Scholar] [CrossRef]
  28. Rajagopal, A. Buyer-supplier relationship and operational dynamics. J. Oper. Res. Soc. 2009, 60, 313–320. [Google Scholar] [CrossRef]
  29. Sirdeshmukh, D.; Singh, J.; Sabol, B. Consumer trust, value, and loyalty in relational exchanges. J. Mark. 2002, 66, 15–37. [Google Scholar] [CrossRef]
  30. Rexha, N. Integrating relationship marketing activities with offering quality in the supplier’s relational marketing program. J. Bus.-Bus. Mark. 2000, 7, 1–17. [Google Scholar] [CrossRef]
  31. Anderson, J.C.; Narus, J.A. A model of distributor firm and manufacturer firm working partnerships. J. Mark. 1990, 54, 42–58. [Google Scholar] [CrossRef]
  32. Storbacka, K.; Nenonen, S. Competitive arena mapping: market innovation using morphological analysis in business markets. J. Bus.-Bus. Mark. 2012, 19, 183–215. [Google Scholar] [CrossRef]
  33. Vieira, A.L.; Winklhofer, H.; Ennew, C. The effects of relationship marketing on share of business—A synthesis and comparison of models. J. Bus.-Bus. Mark. 2014, 21, 85–110. [Google Scholar] [CrossRef]
  34. Palmatier, R.W.; Dant, R.P.; Grewal, D.; Evans, K.R. Factors influencing the effectiveness of relationship marketing: A meta-analysis. J. Mark. 2006, 70, 136–153. [Google Scholar] [CrossRef]
  35. Palmatier, R.W.; Sheer, L.K.; Houston, M.B.; Evans, K.R.; Gopalakrishna, S. Use of relationship marketing programs in building customer-salesperson and customer–firm relationships: Differential influences on financial outcomes. Int. J. Res. Mark. 2007, 24, 210–223. [Google Scholar] [CrossRef]
  36. Fok, D.; Franses, P.H.; Paap, R. Econometric analysis of the market share attraction model. In Advances in Econometrics: Econometric Models in Marketing; Franses, P.H., Montgomery, A., Eds.; Marcel Dekker: New York, NY, USA, 2002; pp. 223–257. [Google Scholar]
  37. Fok, D.; Franses, P.H. Forecasting market shares from models for sales. Int. J. Forecast. 2001, 17, 121–128. [Google Scholar] [CrossRef] [Green Version]
  38. Lau, G.T.; Chin, H.W. Trustworthiness of Salespeople in the Business-to-Business Market: The Five C’s. J. Bus.-Bus. Mark. 2003, 10, 1–33. [Google Scholar] [CrossRef]
  39. Ruiz-Molina, M.E.; Gil-Saura, I. Relationship and market conditions: outcomes in marketing channels. J. Bus.-Bus. Mark. 2012, 19, 289–308. [Google Scholar] [CrossRef]
  40. King, R.P.; Hand, M.S.; DiGiacomo, G.; Clancy, K.; Gomez, M.I.; Hardesty, S.D.; Lev, L.; McLaughlin, E.W. Comparing the Structure, Size, and Performance of Local and Mainstream Food Supply Chains; Economic Research Report 99; U.S. Department of Agriculture, Economic Research Service: Washington, DC, USA, 2010.
  41. Agapie, A.; Bratianu, C. survey design using individual numerical scales in the framework of analytic hierarchy process. Manag. Mark. 2011, 6, 195–204. [Google Scholar]
  42. Bratianu, C.; Agapie, A.; Orzea, I. Modelling organizational knowledge dynamics using Analytic Hierarchy Process (AHP). Electron. J. Knowl. Manag. 2011, 9, 236–247. [Google Scholar]
  43. Bratianu, C.; Agapie, A.; Orzea, I. Knowledge dynamics modelling using Analytic Hierarchy Process (AHP). In Proceedings of the European Conference on Intellectual Capital, Nicosia, Cyprus, 18–19 April 2011; pp. 94–102. [Google Scholar]
  44. SuperDecisions Software. Available online: http://www.SuperDecisions.com (accessed on 25 January 2018).
  45. Radutu, A.; Agapie, A. Analytic Hierarchy Processes (AHP) in service of local knowledge transfer. In Proceedings of the European Conference on Knowledge Management, Belfast, North Ireland, UK, 1–2 September 2016; pp. 1071–1079. [Google Scholar]
  46. Agapie, A. Determining the best Response using Simulated Annealing for AHP Survey Design. In Proceedings of the International Conference on Business Excellence, Brasov, Romania, 12–13 October 2012; pp. 1–4. [Google Scholar]
  47. Agapie, A. Numerical scales for decision makers preference judgments in the analytic hierarchy process. In Proceedings of the International Conference on Business Excellence, Brasov, Romania, 15–16 October 2010; pp. 1–4. [Google Scholar]
  48. Likert, R. A Technique for the measurement of attitudes. Arch. Psychol. 1932, 140, 1–55. [Google Scholar]
  49. Franek, J.; Kresta, A. Judgement scales and consistency measure in AHP. Procedia Econ. Financ. 2014, 12, 164–173. [Google Scholar] [CrossRef]
Figure 1. Schematic representation of the Analytic Hierarchy Process (AHP) and the Analytic Network Process (ANP) for the market share model. Source: Authors’ own representation based on [2].
Sustainability 11 00088 g001
Figure 2. Node comparison with respect to net trust regarding distributors, based on farmers’ opinion. Source: Authors’ own processing.
Sustainability 11 00088 g002
Figure 3. Comparison based on the knowledge of the Competitive Intelligence (CI) expert. Source: Authors’ own processing and research.
Sustainability 11 00088 g003
Figure 4. Comparison based on Top Management experience. Source: Authors’ own calculation.
Sustainability 11 00088 g004
Figure 5. The summarized results from the Super Decisions program reflecting the estimated market share for the four distributors. Source: Authors’ own processing.
Sustainability 11 00088 g005
Table 1. Clusters and nodes chosen from primary/secondary sources for the ANP model.
Secondary Research/Literature Review [28,40]Primary Research/Qualitative and Quantitative Studies (8 Focus Groups Conducted with Experts, 7 in-Depth Interviews Conducted with Farmers)
Product based:
Demand
Preferences
Services
Availability
Product
Information
Delivery cost
Product:
Range of products
Product variation
Product availability
Quality of products
Comparative performance:
Value for money
Price sensitivity
Buying cost
Services cost
Guarantee
Cross promotion
Value addition
Competitiveness
Buyer support
Trade Policy:
Final prices
Flexibility in payment
Flexibility in negotiating price
Terms of payment
Special offers
Process control:
Quality functions deployment
Routing supplies
Inventory management
Order generation
Order compliance
Stock transfer
Time management
Team work
Conformance quality
Servicing:
Ease of trading
Accuracy of documents
Time to get the documents
Supply design:
Display
PoS (Point of Sale) support
Availability
Delivery
Responsiveness
Prospecting
Negotiation
Supplier involvement
Delivery:
Delivery time
Promptness of delivery in emergency situations
Accuracy of delivered order
Brand functions:
Reputation
New brand extensions
Loyalty
Social status
Strong referral
Brand Health Index:
Advocacy
Customer Satisfaction
Reputation/Trust
Retention
Sales Force:
Level of technical expertise and understanding of agriculture
Promptness and responsiveness
Friendliness, willingness to help farmer
Stability of personnel
Networking skills
Seriousness, keeping promises
Others:
Loans and financing facilities
Technical consulting
Loyalty programs
Source: Authors’ own processing and research based on references [28,40].
Table 2. Fundamental scale.
1Equal importance
3Experience and judgement slightly favor one activity over another
5Experience and judgement strongly favor one activity over another
7An activity is favored very strongly over another; its dominance is demonstrated in practice
9The evidence favoring one activity over another is of the highest possible order of affirmation
2,4,6,8Intermediate values
Source: Authors’ own design based on reference [3].
Table 3. Comparison between the obtained values and the actual ones.
CompetitorSuper Decisions Normalized ValuesActual Data from Kleffmann StudyNormalized Data from Kleffmann Study
Agricover (A1)25.0%6.91%25%
Alcedo (A2)26.1%11.78%42%
Cargill (A3)24.7%4.17%15%
Comfert (A4)24.2%5.08%18%
Source: Authors’ own processing and research.
Table 4. Matrix A of estimated values.
Alternative 1Alternative 2Alternative 3Alternative 4
Alternative 1A1/A1A2/A1A3/A1A4/A1
Alternative 2A1/A2A2/A2A3/A2A4/A2
Alternative 3A1/A3A2/A3A3/A3A4/A3
Alternative 4A1/A4A2/A4A3/A4A4/A4
AgricoverAlcedoCargillComfert
Agricover11.045660.988510.96649
Alcedo0.956330410.945350.92429
Cargill101.2%1.0578110.97772
Comfert1.03466721.081911.022781
Source: Authors’ own processing and research.
Table 5. Matrix B of actual data.
Alternative 1Alternative 2Alternative 3Alternative 4
Alternative 1A1/A1A1/A2A1/A3A1/A4
Alternative 2A2/A1A2/A2A2/A3A2/A4
Alternative 3A3/A1A3/A2A3/A3A3/A4
Alternative 4A4/A1A4/A2A4/A3A4/A4
AgricoverAlcedoCargillComfert
Agricover10.586511.656681.359376
Alcedo1.705011712.824662.317753
Cargill60%0.3540310.820544
Comfert0.73563140.43145241.218701
Source: Authors’ own processing and research.

