Article

Spatially Differentiated Trends between Forest Pest-Induced Losses and Measures for Their Control in China

1
College of Economics and Management, Beijing Forestry University, Beijing 100083, China
2
General Station of Forest and Grassland Pest Management, National Forestry and Grassland Administration, Key Laboratory of National Forestry and Grassland Administration on Forest Pest Monitoring and Warning, Shenyang 110034, China
*
Author to whom correspondence should be addressed.
Sustainability 2019, 11(1), 73; https://doi.org/10.3390/su11010073
Submission received: 26 October 2018 / Revised: 11 December 2018 / Accepted: 14 December 2018 / Published: 23 December 2018

Abstract

:
Historically, China has exhibited spatial differentiation in issues ranging from population distribution to ecological or economic development; forest pest-control work exemplifies this tendency. In recent times, global warming, man-made monoculture tree-plantations, increasing human population density, and intensified international trade aggravate forest pest outbreaks. Although the Chinese government has complied with internationally recommended practices, some aspects of pest management remain unaddressed due to existing differential regional imbalance in forest pest distribution and control capacities. Evidence shows that the high-income provinces in the south have taken advantage of economic and technological superiority, resulting in the adoption of more efficient pest-control measures. In contrast, the economically underdeveloped provinces of the northwest continue to experience a paucity of financial support that has led to serious threats of pest damage that almost mirror the demarcations of the Hu Huanyong Line. In this paper, we propose the introduction of a Public–Private–Partnership (PPP) model into forest pest control and the combination of the national strategies to enact regional prevention measures to break away from current spatially differentiated trends in China.

1. Introduction

Forest pests are considered the most expensive species in the world, causing gross yield losses of up to at least 10% to 16% before harvest, and are responsible for the destruction of more than 350 million ha of global forestland [1]. Indeed, invasive pests alone are associated with a cost of more than USD 7 billion [2]. They not only destroy forests and infrastructure, but also spread diseases among humans and animals. It has been estimated that the USA and Brazil lose more than USD 14 and 17.7 billion each, annually [3,4]. China is projected to face similarly alarming consequences, wherein it might sustain ecological and economic losses of approximately USD 16.94 billion, which exceeds 10% of the total annual national forestry output [5]. However, the other major issue facing the Chinese government is the existence of serious spatial differences among provinces in both, pest-induced losses and pest-control measures. These striking contrasts attracted our research interest with respect to how the distribution on either side of the Hu Huanyong Line is regulated and the reasons for the observed differences among provinces.
Spatial differences have been present for centuries, when the population gathered around the river culture under the mild climate conditions and ecological environment of south-eastern China [6]. In 1935, the accomplished geographer Hu Huanyong discovered this uneven population density distribution wherein south-eastern China, comprising only 36% of the country’s territory, was found to be home to 96% of the population, while the northwest comprised the rest [7]. The partition has been shown as divided by a line that runs from the northeast of Heilongjiang to the southwest of Yunnan provinces and has become internationally known as the Hu Line. After several scientific studies, this line was demonstrated to be super-positioned to the ecological environment, running very close to the 400-mm rainfall line that divides China into semi-humid and semi-arid regions, with low socioeconomic status of the residents being present concomitant with the eco-fragile region and economic development attained in the southeast thanks to the superior resources of the region [8,9]. Therefore, we first hypothesized that forest pest-induced losses and control measures would also be governed by the Hu line distribution pattern on the basis of the higher suitability of the environment for pest breeding and feeding, and sufficient funds to control pests and associated forest losses, in the southeast region of the country.
However, the Chinese government developed an enormous forest plantation plan called Six Key Forestry Programs (SKFPs) in 2001, including the Forest Protection Project focused in the north, and the fast growing High-yield Timber Program near the south, as well as other projects that together contributed to the plantation of forests reaching 69.33 million ha in 2016 [10,11]. The extremely high increase of monoculture tree-plantations with lower biodiversity, young forest stands, and large-scale afforestation, dangerously reduce natural resistance and thus facilitate pest outbreaks [12,13]. According to available statistics, forest pests have already infested 12.11 million ha, which accounts for over 17% of forest plantations, thereby threatening the ecological safety of the entire region [14,15] and making China one of the countries with the most pest outbreaks in the world, with more than 8000 forest pest species, including 5020 species of forest insects, 2918 species of microbial pathogens, 160 species of rodents and lagomorphs, and 145 hazardous plant species [16]. Pests under the strongest control pressure in the east are Bursaphelenchus xylophilus, Hyphantria cunea, and Mikania micrantha, while in the west, the most pressured pests are forest pikas [17,18]. As a result of the threat of global warming, and the pressure from economic development from southeast to northwest, transportation has carried along invasive pests that are spreading rapidly across regions with suitable environments and fewer natural enemies [19,20,21]. As this trend continues, even the unsuitable environment of the northwest now has more forest pests, while the lower capacity for the control of potential damage in the region places a heavier burden on local governments to take the necessary measures to control this potentially disastrous situation.
These findings have attracted global attention and call for the adoption of efficient measures for controlling pest outbreaks, especially measures based on ecological and economic mathematical theory, thereby establishing an effective Meteorological Driven Ecological Network Structure, Pulse Differential Equation, or System Dynamics Modelling to predict pest outbreak trends and their potential impact on the environmental variables. The establishment of these methods could benefit the most from the optimization of surveillance and prevention strategies, thus converting theory into actual, specific control measures [22,23,24]. The strategies adopted for forest pest management have progressed through four stages: From reliance on natural defenses, to chemical control, to integrated management, and to ecological prevention [25]. The available literature on pest control, dating from around the early twentieth century to the 1940s, focused on biological measures for pest control, combined with advances in agricultural technology and artificial capture [12]. Around the 1970s, chemical control measures emerged and exhibited remarkable effectiveness [26], but at the cost of severe environmental degradation that urged Food and Agriculture Organization (FAO) (1967) to submit its first integrated pest-control report in an effort to lessen pesticide pollution and improve pest-control measures [27,28]. By the mid-1990s, the USA first established integrated pest management (IPM) funds for experts to verify the effectiveness of IPM systems, signaling the commencement of IPM measures [29]. At present, ecological prevention measures, such as sustainable pest management, and forest health monitoring, which includes the assessment of pest-control system dynamics or pest-impulse responses, have been introduced into IPM to boost the effectiveness of regulating pest population density during outbreaks [30,31,32,33]. This strategy also encourages farmer cooperation and makes predictions from software-based models to implement effective forest pest management [22,34,35].
China has followed internationally approved management measures for fighting forest pest-induced damage, and released Forestry Pest Control Regulations, Major Exotic Forestry Pest Emergency Measures, and other relevant regulations to standardize forest pest management [36,37]. The State Forestry Pest Control Administration (SFPCA) has adopted several measures, such as biochemical prevention by spraying 4.15 million ha of forest area via airplane annually [15], and a focus towards the “3S” (Remote Sensing, Geographical Information System, and Global Positioning System) technology to complete automatic diagnostic monitoring systems, while using an economic approach to calculate the losses incurred from pest damage during a five-year cycle to monitor the effectiveness of forest pest control [5,38,39,40,41]. All these measures demanded an annual investment, in excess of USD 561.2 million, that is steadily increasing [15]. Based on these facts, the SFPCA has approved a proposal aimed at a 90% improvement in pest-damage prediction accuracy, a 100% improvement in the rate of quarantining to ensure the quality of seeds in their place of origin, and a reduction to below four per thousand in the forest pest-damage rate by 2020 [42]. The administration is now under pressure to meet these targets as regional economic–ecological imbalances affect forest pest-distribution and control capacities.
According to the Chinese Forest pest-control regulations, forest pests should be controlled by the managers. As for ecological forest services, the funds should be input by local governments, and for the most dangerous or large outbreak areas of commercial forests, the money should be paid both by managers and local governments [36]. After the SKFPs, the Chinese own the richest timber resources, providing the most ecological services in the northwest, and commercial timbers for forest production in the southeast [43]. The government has already established a forest pest-control system via the State Forest Administration with a primary level consisting of forest quarantine or monitoring stations and other cooperative organizations for the prevention of pest outbreaks [44]. However, overall, the burden of control is carried out by the primary forest stations in the counties with weaker infrastructures, and the funds are mostly input by the local governments, triggering an extremely unjust imbalance in the control measures in each province, even when considering the “Hu line” distribution regularities [19,20,21]. In particular, after Premier Li Keqiang stated that China should break the traditional demographic pattern in order to allow people from all regions to benefit from modernization, the government put forward several policies, such as poverty reduction, ecological construction, and other supports to erase the imbalance barrier of the “Hu line” [45]. It seems that the combination of these policies is a promising opportunity to improve pest-control efficiency and reduce the burden on local governments regarding pest-control work.
Therefore, in this study, we aimed to (i) verify pest-induced forest losses and control measures mostly according to the “Hu line” distribution regularities; (ii) conduct an empirical assessment to analyze the causes of spatial differentiation in economic development, and pest-induced forest losses and control measures. We then analyzed the most serious invasive pest, i.e., Bursaphelenchus xylophilus, as an example to evaluate our hypothesis of a clear-cut spatial differentiation in agreement with “Hu line” regularities on record. Finally, we set out to explore the methods combining current policies with forest pest-control work to break the “Hu line” barrier, which could not only protect forest resources, but also overcome regional imbalances while achieving a higher degree of efficiency in regards to pest control.

2. Materials and Methods

2.1. Literature Review

We reviewed the literature on the economic aspects associated with pest management, starting from an international perspective, leading to China, using the Web of ScienceTM database and a special string of keywords related to pest-control management to identify the relevant papers. Next, we used the ‘refine’ function for Web of Science to restrict the search for results to the relevant field; this step limited retrieved sources to 1630 from the years 1997 to 2017. We analyzed each source manually to reject the irrelevant papers and retained only those containing information regarding pest control. Finally, a total of 136 papers were selected for thorough research. Most of these papers deal with pest-induced losses, spatial trends, and control measures in economic aspects. Following this, we used the same method to identify literature from the Chinese National Knowledge Infrastructure (CNKI) so as to determine the pest-control situation in China and obtained 163 papers. Furthermore, we explored reports, chapters, and related books that provided the initial estimates of the forest pest-control situation in China and elsewhere and visited the website of SFPCA or consulted with the staff for detailed knowledge on pest control. We extended our quest beyond forest pests to include instances of “natural disasters” “Hu Line”, and “pest-outbreak influencing factors” to ensure a more thorough analysis.

2.2. The Explanation of Spatial Distribution Factors

First, we asked whether the forest pest, and the loss associated to it, were consistent with the ‘Hu line’ distribution regularities and whether there were enough control measures or investment funds in each province. Finally, we showed the values obtained, by presenting them on the Chinese map to summarize the distribution pattern.
We selected the forest pest area as the regional pest outbreak situation, influenced by natural or artificial factors including illness, insects, rodents, and harmful plants to indicate that the forest would be infested by other living creatures during growth, reproduction, transportation, or storage, causing timber dysplasia or even death and, concomitantly, ecological and economic losses. Forest pest rate was defined as the ratio of forest pest area to host species area to represent forest pest-control pressure in a standardized measure across provinces.
Following this, we utilized forest pest-mediated total loss to estimate the extent of damage in each province. These factors consisted of economic loss and ecological service loss that were calculated by SFPCA from 2006 to 2010. Economic losses comprised losses due to tree growth-cessation, quality reduction, and death, non-timber forest quality reduction, useless forest land, and payment of pest-induced disasters. As for ecological losses, these were derived from the biomass estimation method to evaluate the reduction in ecological services and using forest ecological service loss values to multiply stumpage volume loss values [5,46]. Finally, we combined ecological with economic loss to estimate total loss and showed each loss on the map to compare with pest-control measures in each province.
We also utilized the forest pest-control area and control rate to represent the control measures of each province, depending on the different proportion in which they had adopted chemical control, biochemistry, artificial physics, or biological control measures to mitigate forest pest infestation of timber, bamboo, or seedlings. The control rate is the ratio of the forest pest-control area to forest pest area. We showed the pest-control rate on the map that could represent the status of control measures taken more directly than the control area, thus eliminating the disturbance of each province’s territorial area. We also show the airplane control area in Figure 7, as this measure could reflect the payment, technology, pest damage serious degree. and even the attention degree of each adopted province.
Finally, we highlight forest pest investment funds and per area funds on the Chinese map to represent the spatial differences in each province in investment funds and compared with the pest area and pest-induced loss to tell whether the most severe damage occurred in the province with the higher funds. The funds were invested by local governments, central budget, social companies, and others, and the per area funds were the ratio of pest area to input money that represent the funds situation of per forest pest area and, to some extent, it could reflect the attention degree or economic force of pest control in each province.

2.3. Simultaneous Equation Model (SEM) and Influencing Factors

To analyze the factors responsible for spatial distribution and recent control effects, we established the SEM and selected forest pest area, control area, and investment funds as the three main endogenous variables that could better represent the pest-outbreak and control-measures situation in each province. However, these factors would also be influenced by exogenous variables, such as climate conditions, (i.e., temperature, relative humidity, rainfall, or sunshine hours), which most markedly influence pest overwintering, development, or reproduction thereby threatening the artificial forest with an outbreak [13,14,16]. As for control measures, these are not only influenced by the corresponding workers and stations, but also by the farmers, as the forests were controlled by the local government and the forest owners, especially after the collective forest tenure reform allowed farmers to get more forest land, thus becoming strong actors in the fight to resist forest pests [47]. Economic development status, forest income, and rural-farmer consumer level might also affect forest pest investment funds when deciding whether enough measures are being taken to control forest pests [48,49].
Therefore, we selected the following variables: Forest control area (ha), artificial forest (ha), mean annual temperature (°C), mean annual air pressure (hPa), mean annual sunshine hours (h), annual accumulated rainfall (mm), and relative humidity (%) impact degree to the forest pest area (ha). We also evaluated the degree of significance of forest pest workers, control stations, investment funds (CNY), and rural population to the control measures, and GDP, forest income, rural consumption to the investment situation in each province. All data collected were for 31 provinces, from 2003 to 2017; all forest pest-related data are from [15]. The rural situation and GDP are from [14], climate variables are from [50]. Except pest area, control area and investment funds calculated the progress already mentioned, the pest station was situated in provinces, cities, or counties, forest pest institutions, forest plant quarantine stations, and primary monitoring stations with the relative staff that comprising the factors of control workers.
We utilized a SEM, which is a three-stage least squares (3sls) combined two-stage least square method with seemingly unrelated regression to overcome these endogenous features [51]. The formula was established as follows: α 1 7 , β 1 4 , r 1 3 are the coefficients of each factor, and α 0 , β 0 , r 0 are the constant terms, u 1 3 are the disturbing terms, and i represents each province. We used logarithmic (ln) for all the variables to represent the elasticity so as to make the data more stable.
l n p e s t   a r e a j = α 0 + α 1 l n c o n t r o l   a r e a j + α 2 l n a r t i f i c i a l   f o r e s t j + α 3 l n t e m p e r a t u r e j + α 4 l n p r e s s u r e j + α 5 l n s u n s h i n e   h o u r s j + α 6 l n r a i n f a l l j + α 7 l n r e l a t i v e   w i t n e s s j + u 1 l n c o n t r o l   a r e a j = β 0 + β 1 l n f u n d s j + β 2 l n s t a t i o n s j + β 3 l n w o r k e r s j + β 4 l n r u r a l   p o p u l a t i o n j + u 2 l n f u n d s j = r 0 + r 1 l n G D P j + r 2 l n f o r e s t   i n c o m e j + r 3 l n r u r a l   c o m s u m p t i o n j + u 3

3. Results and Discussion

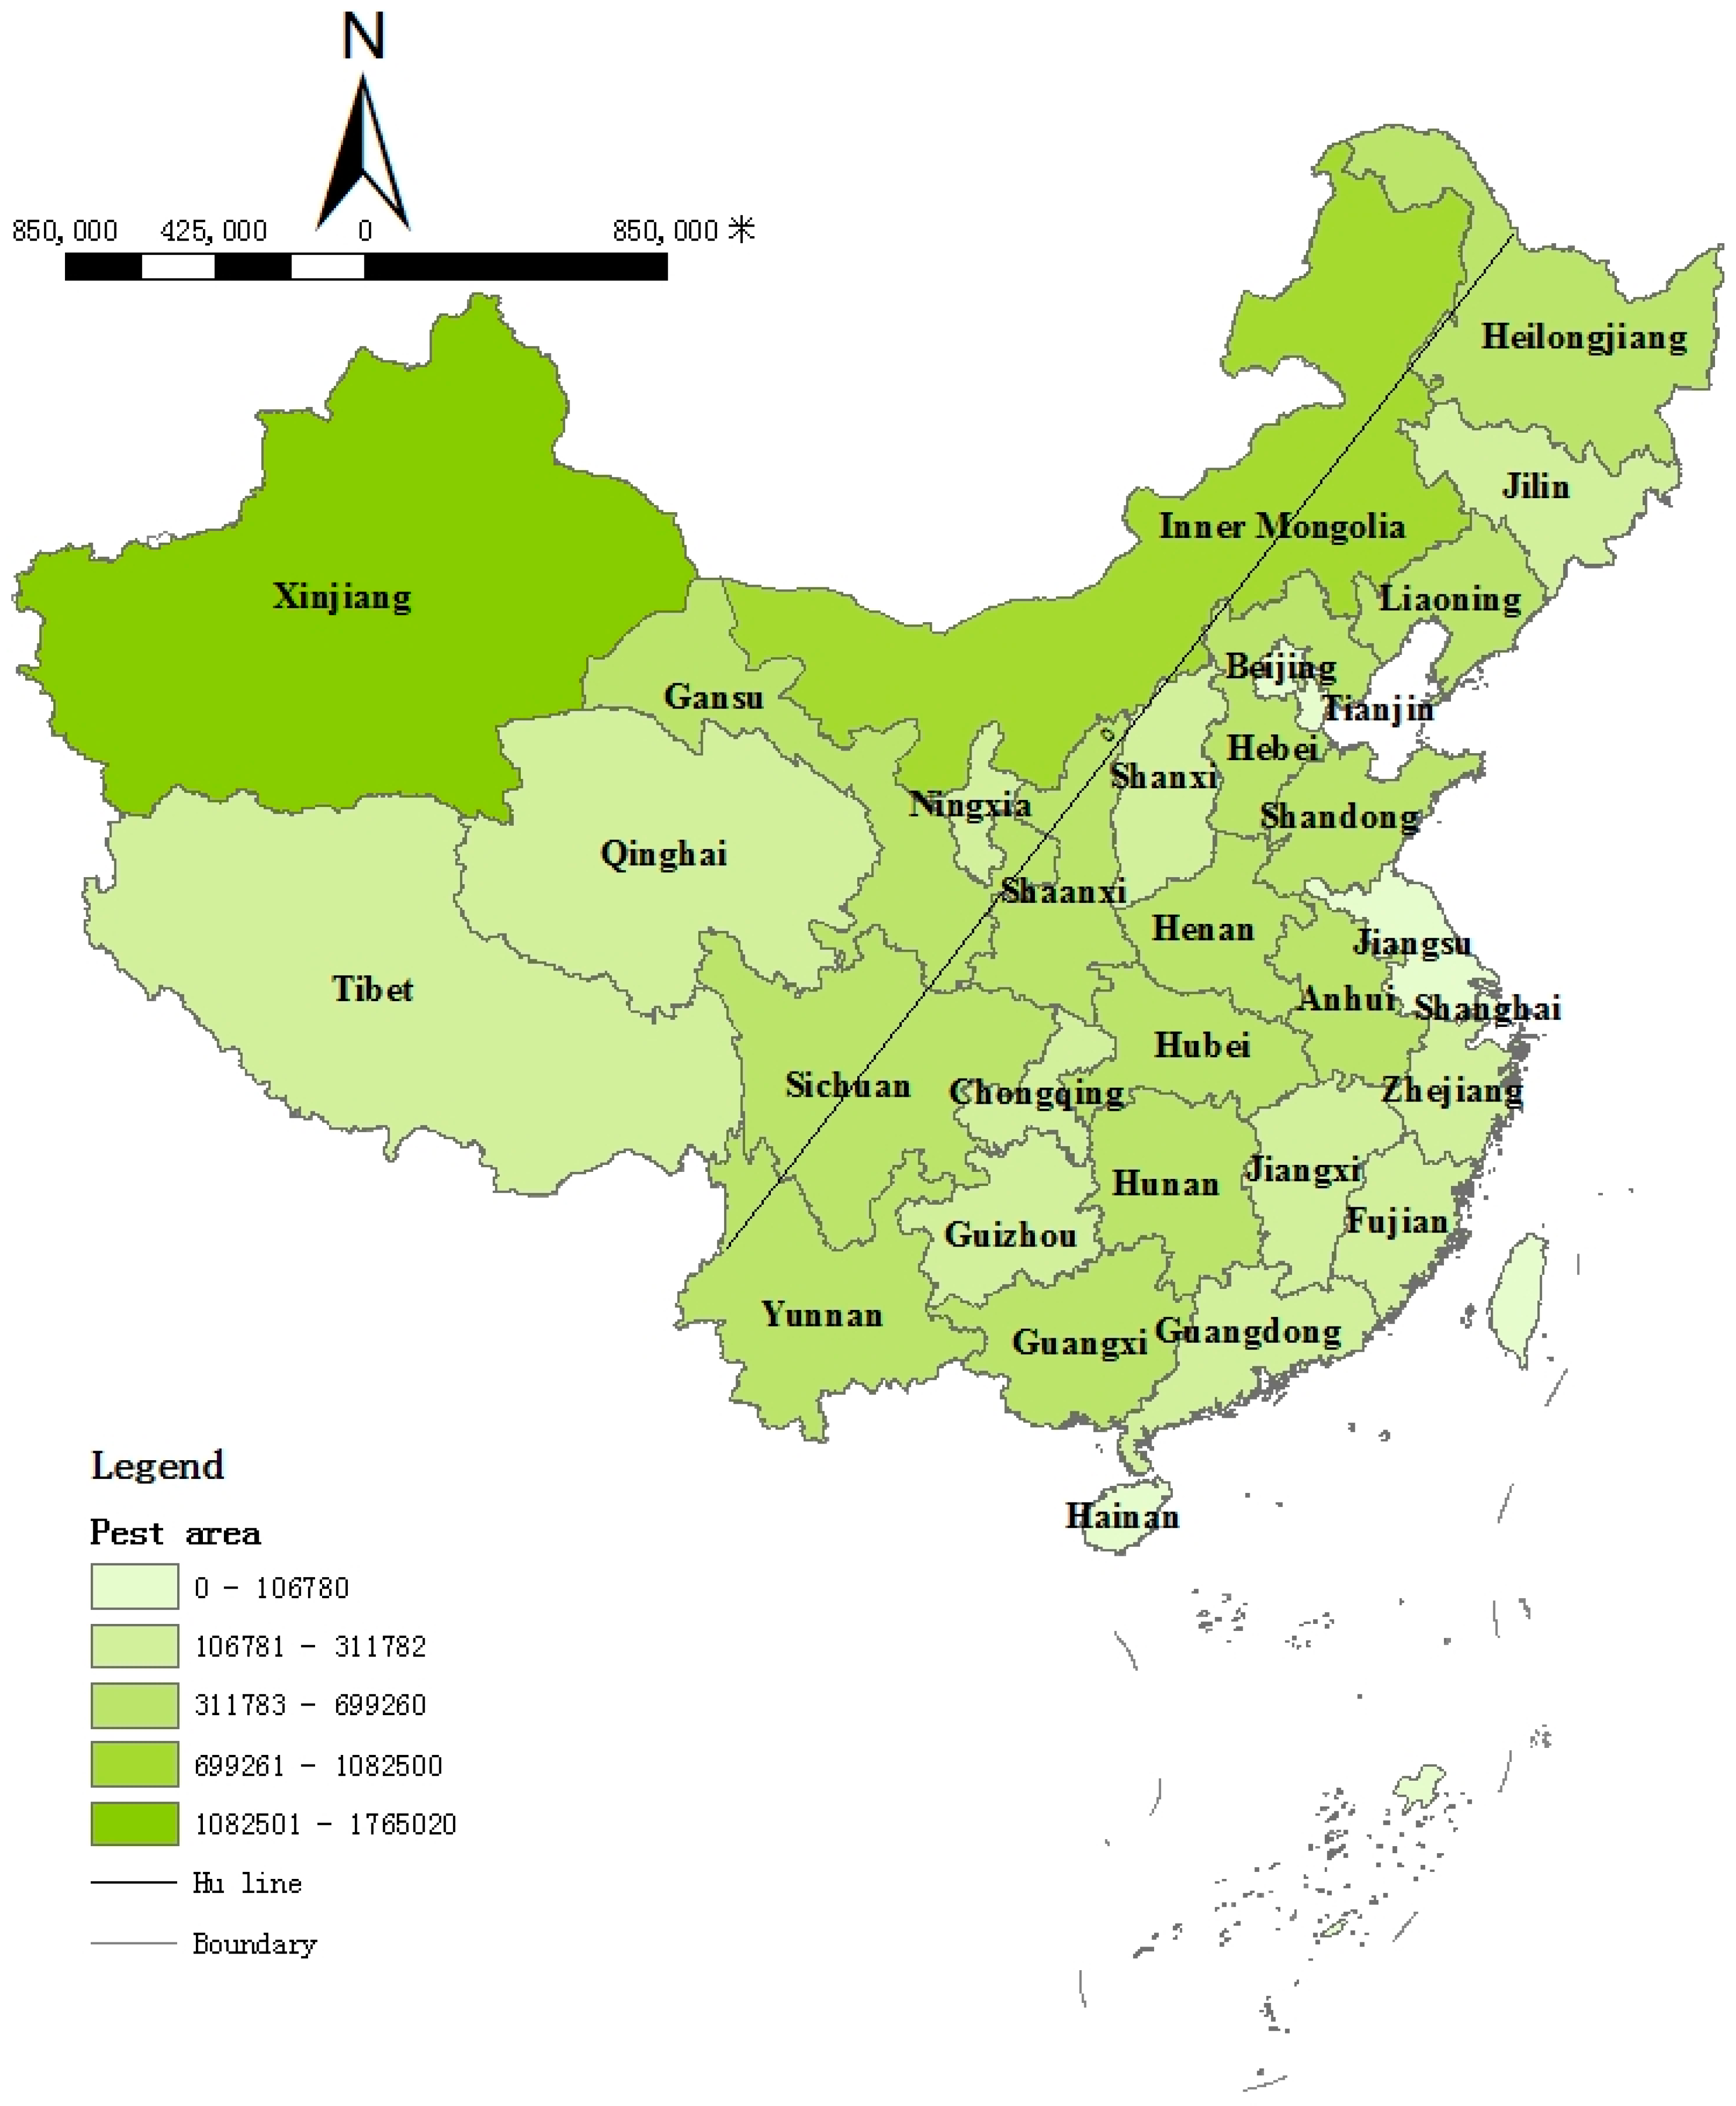
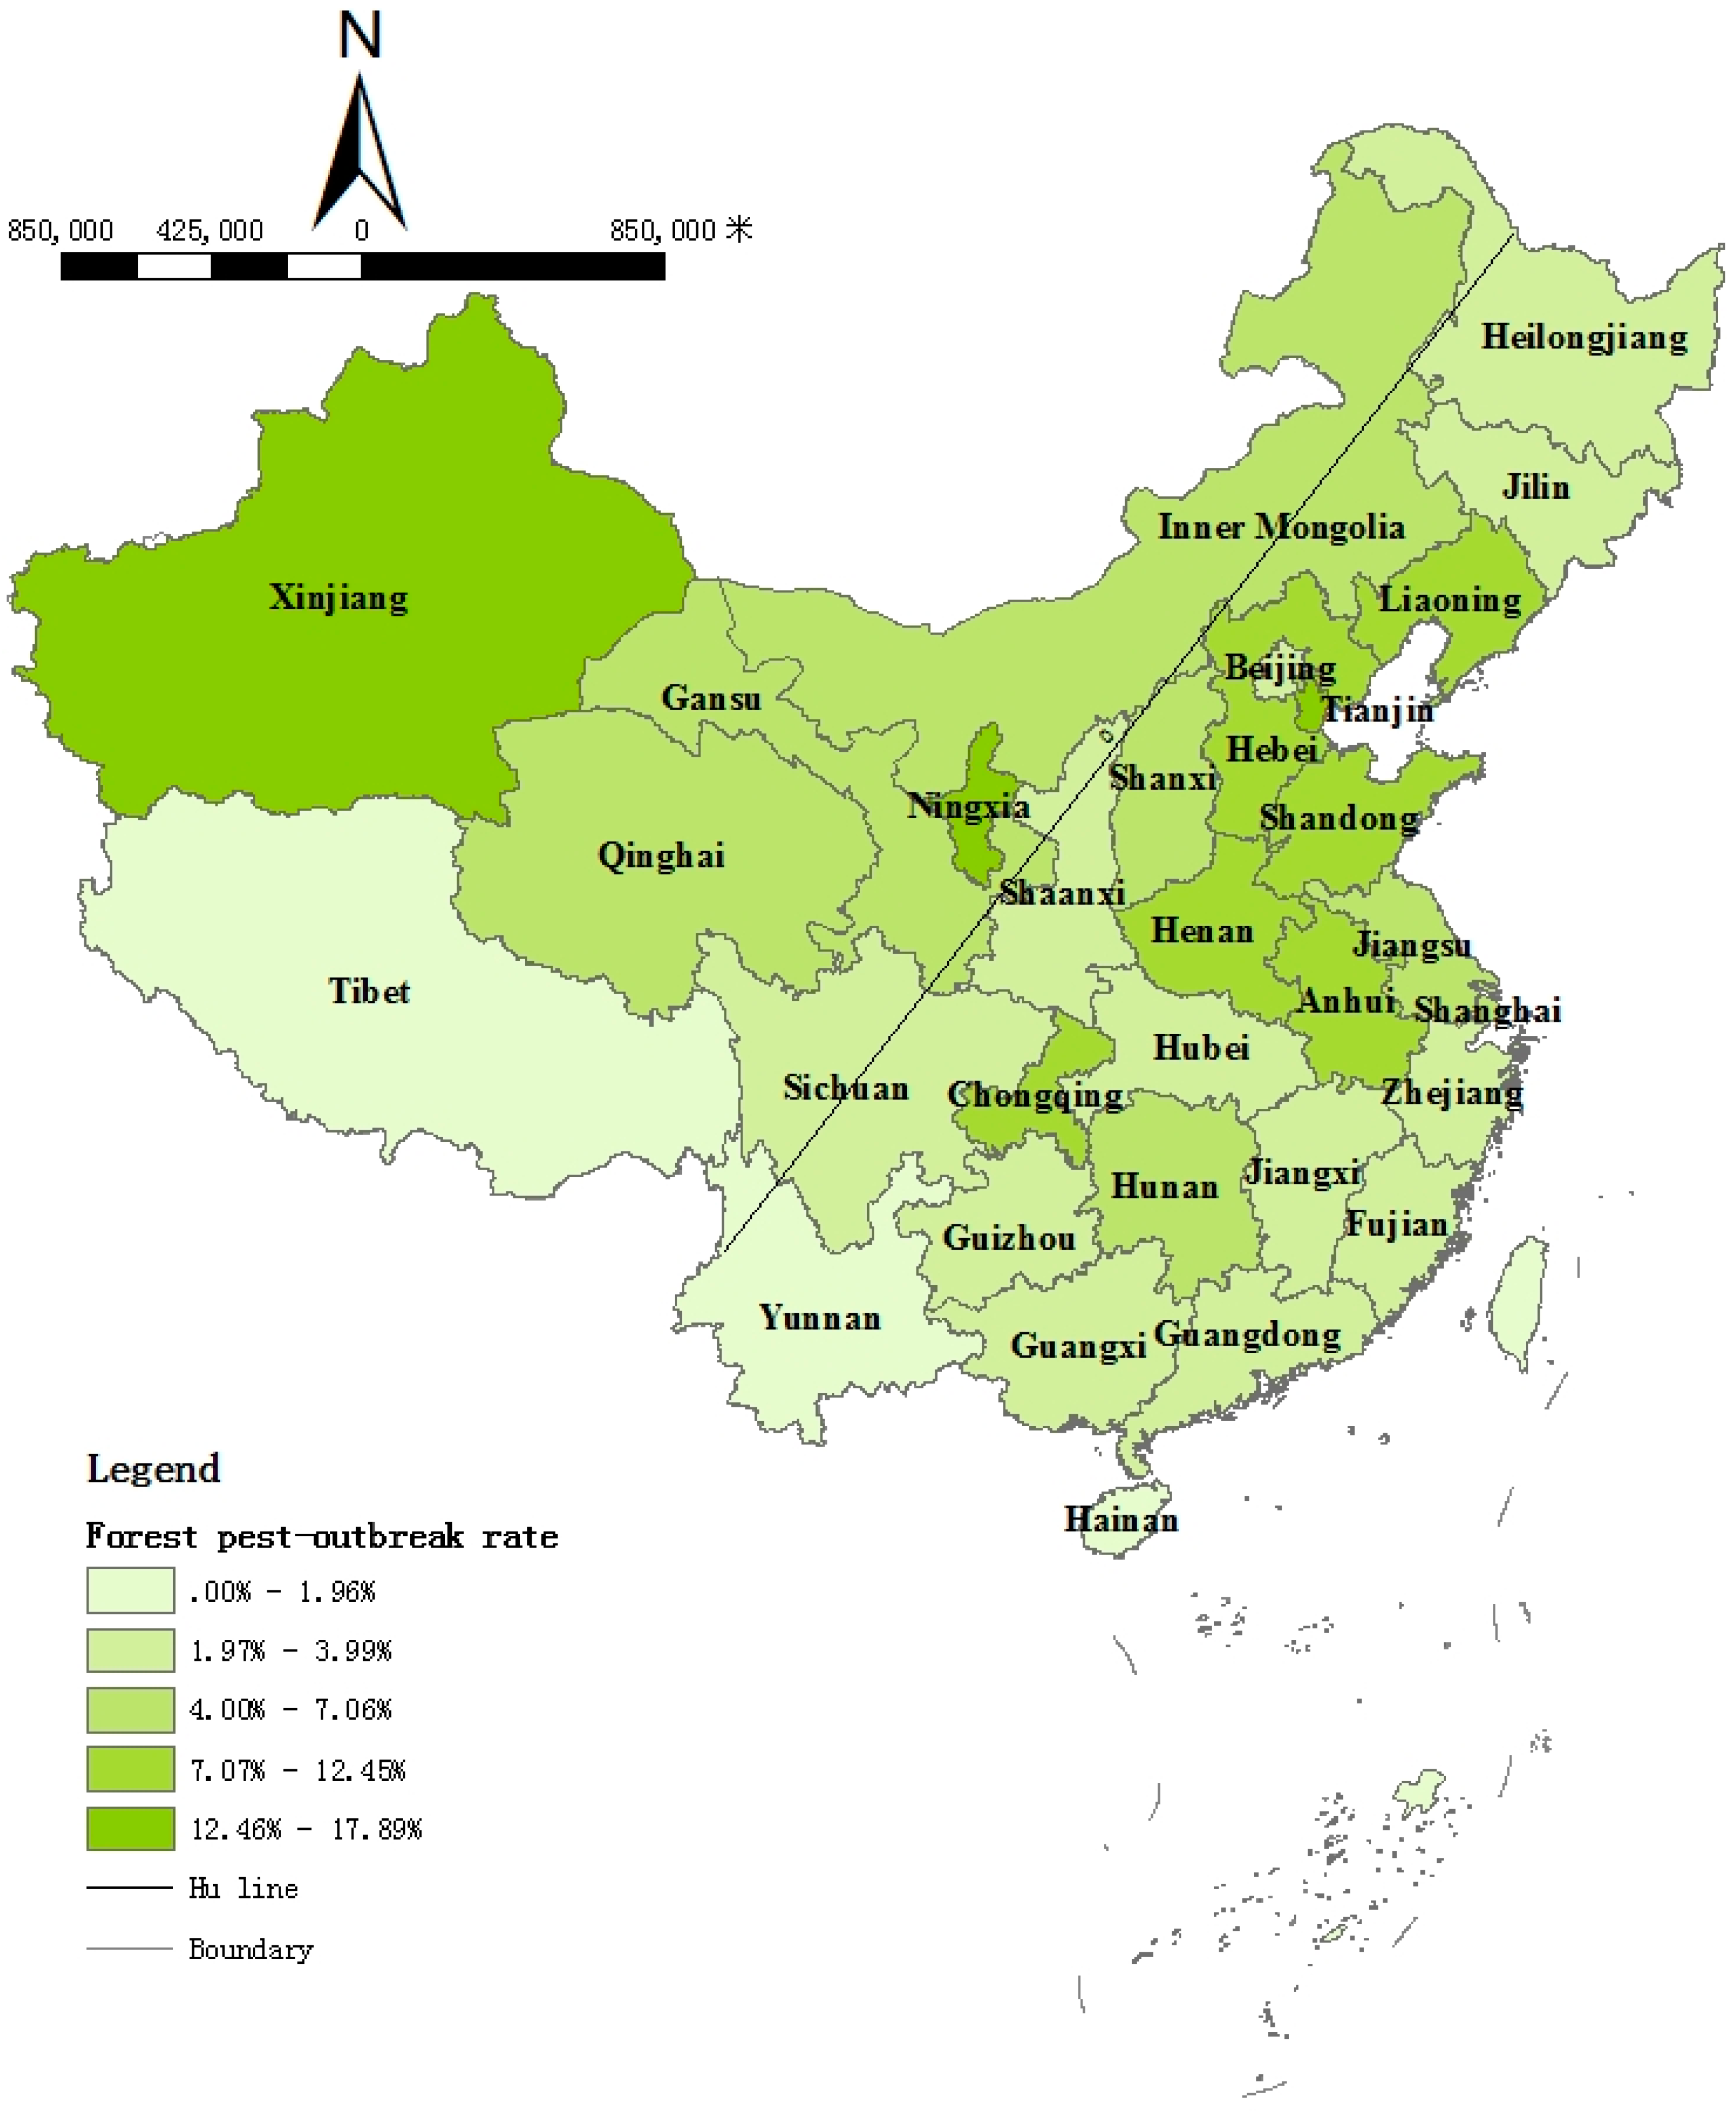
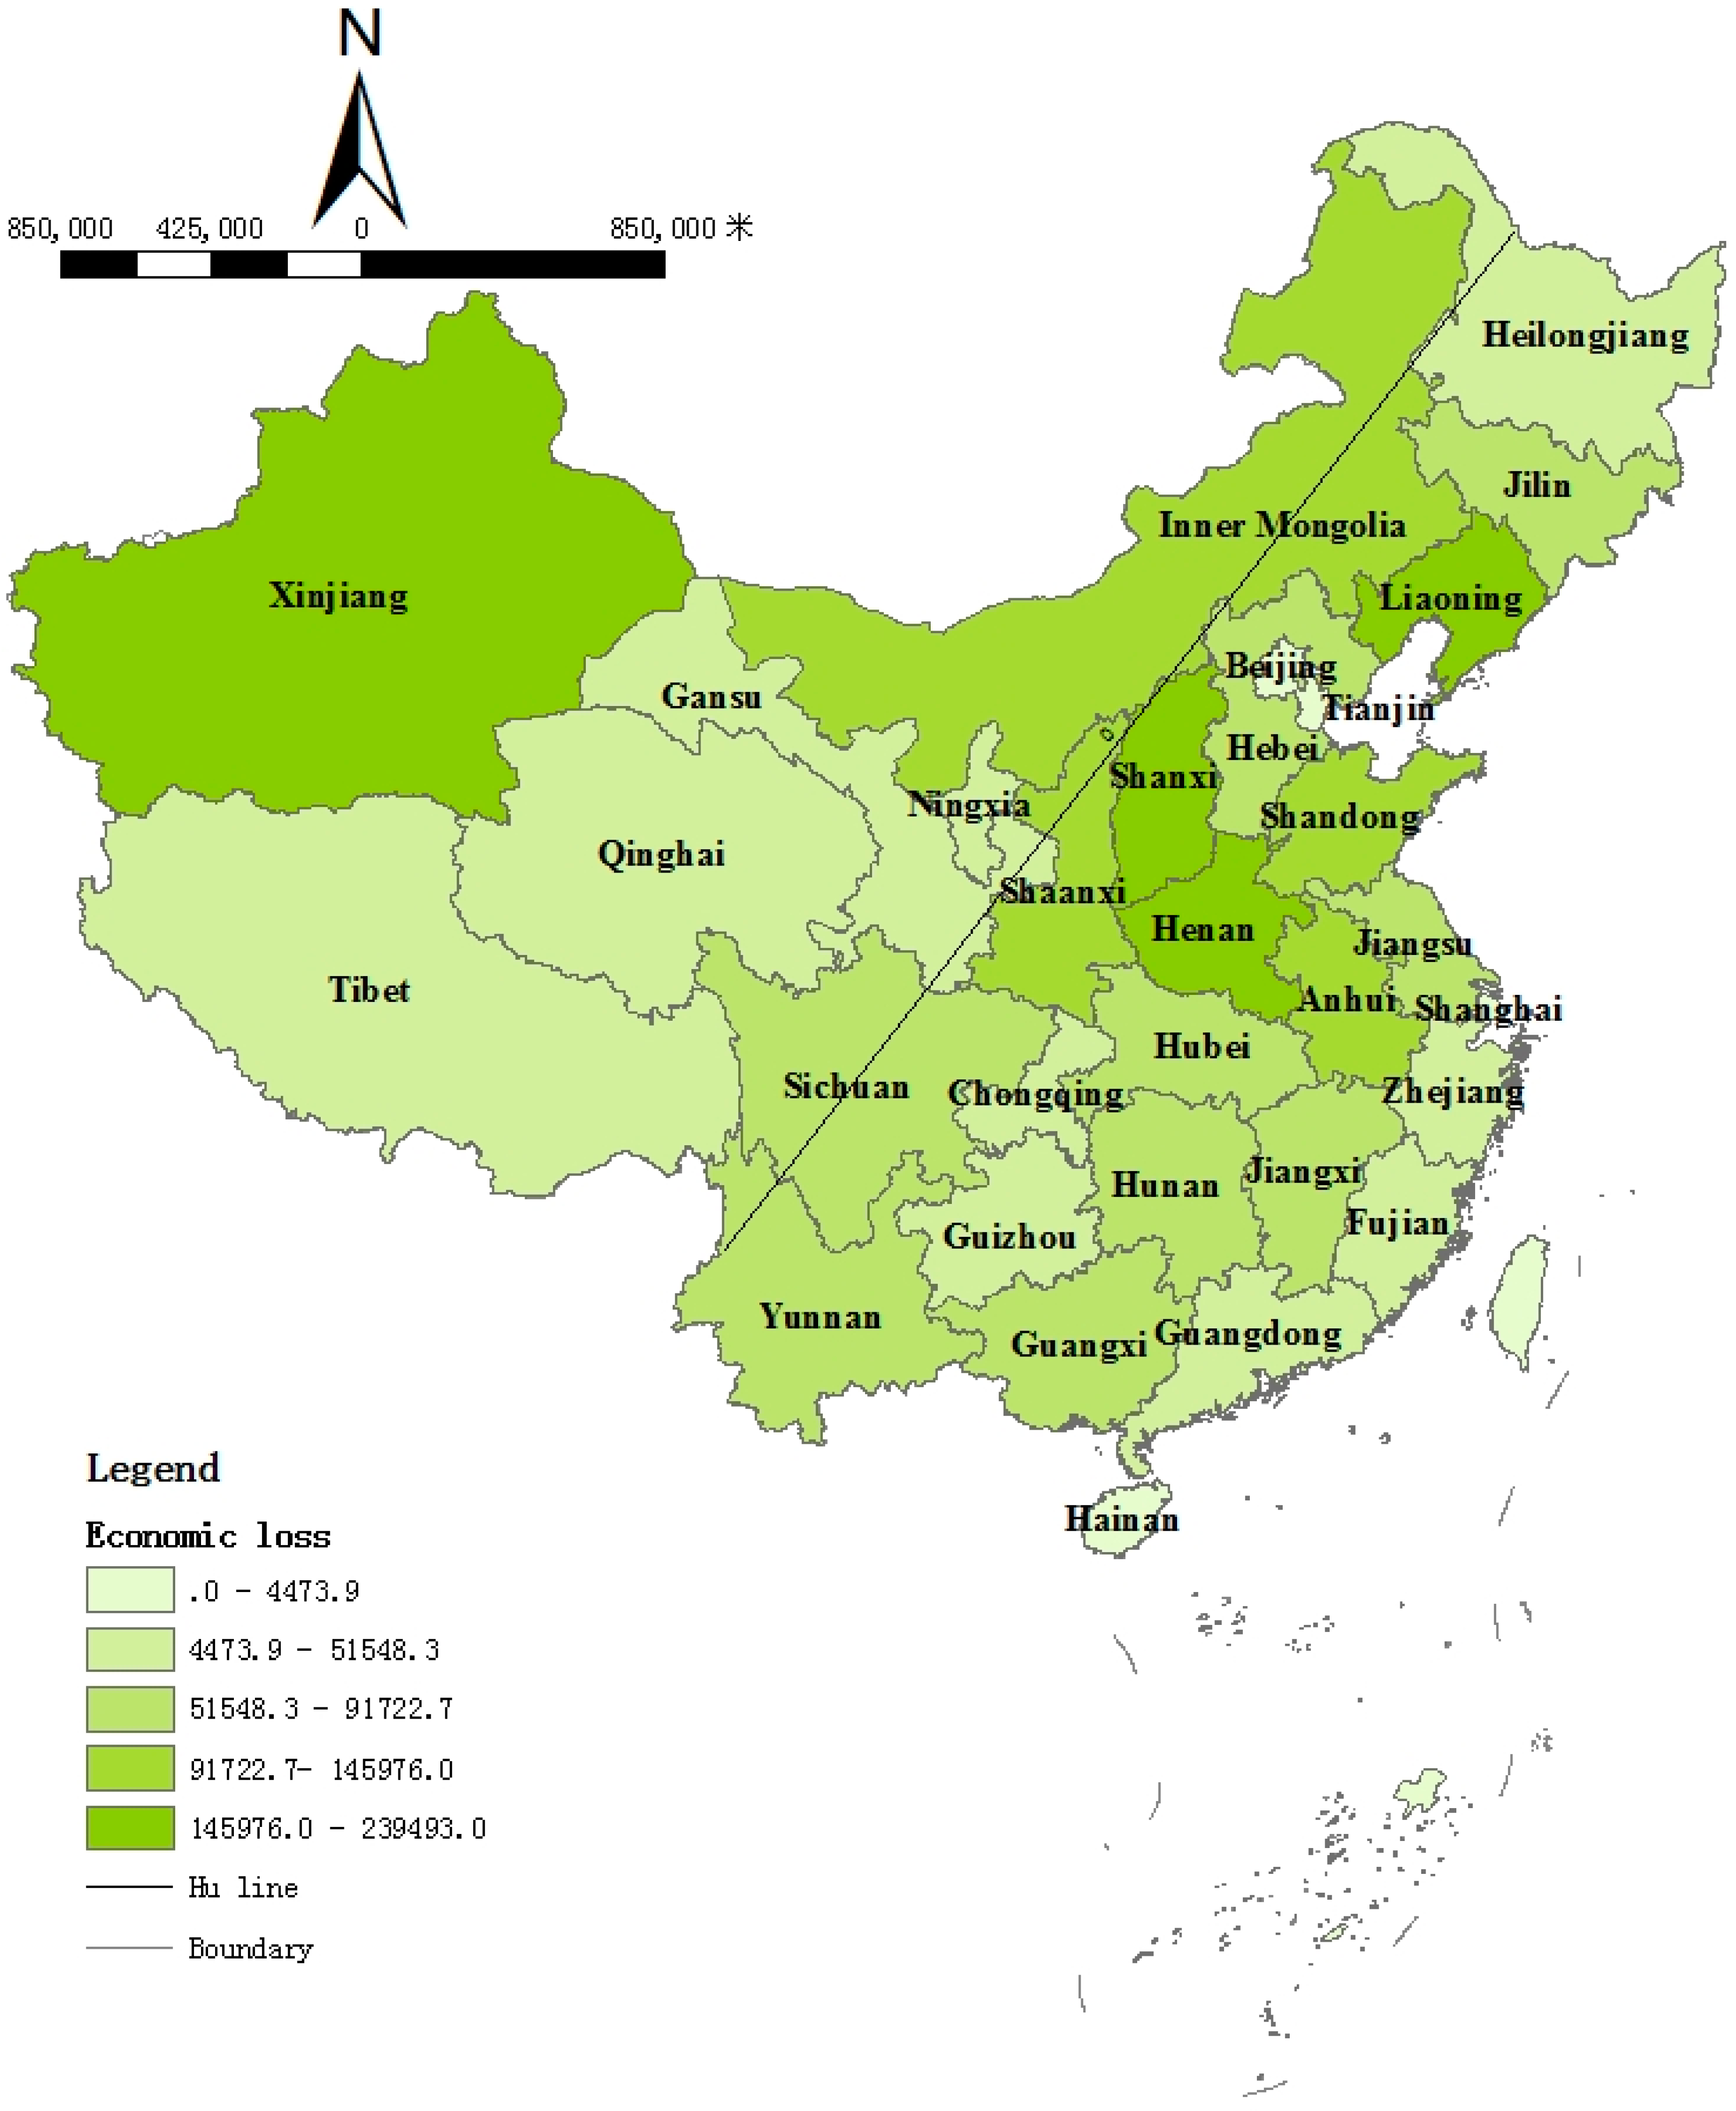
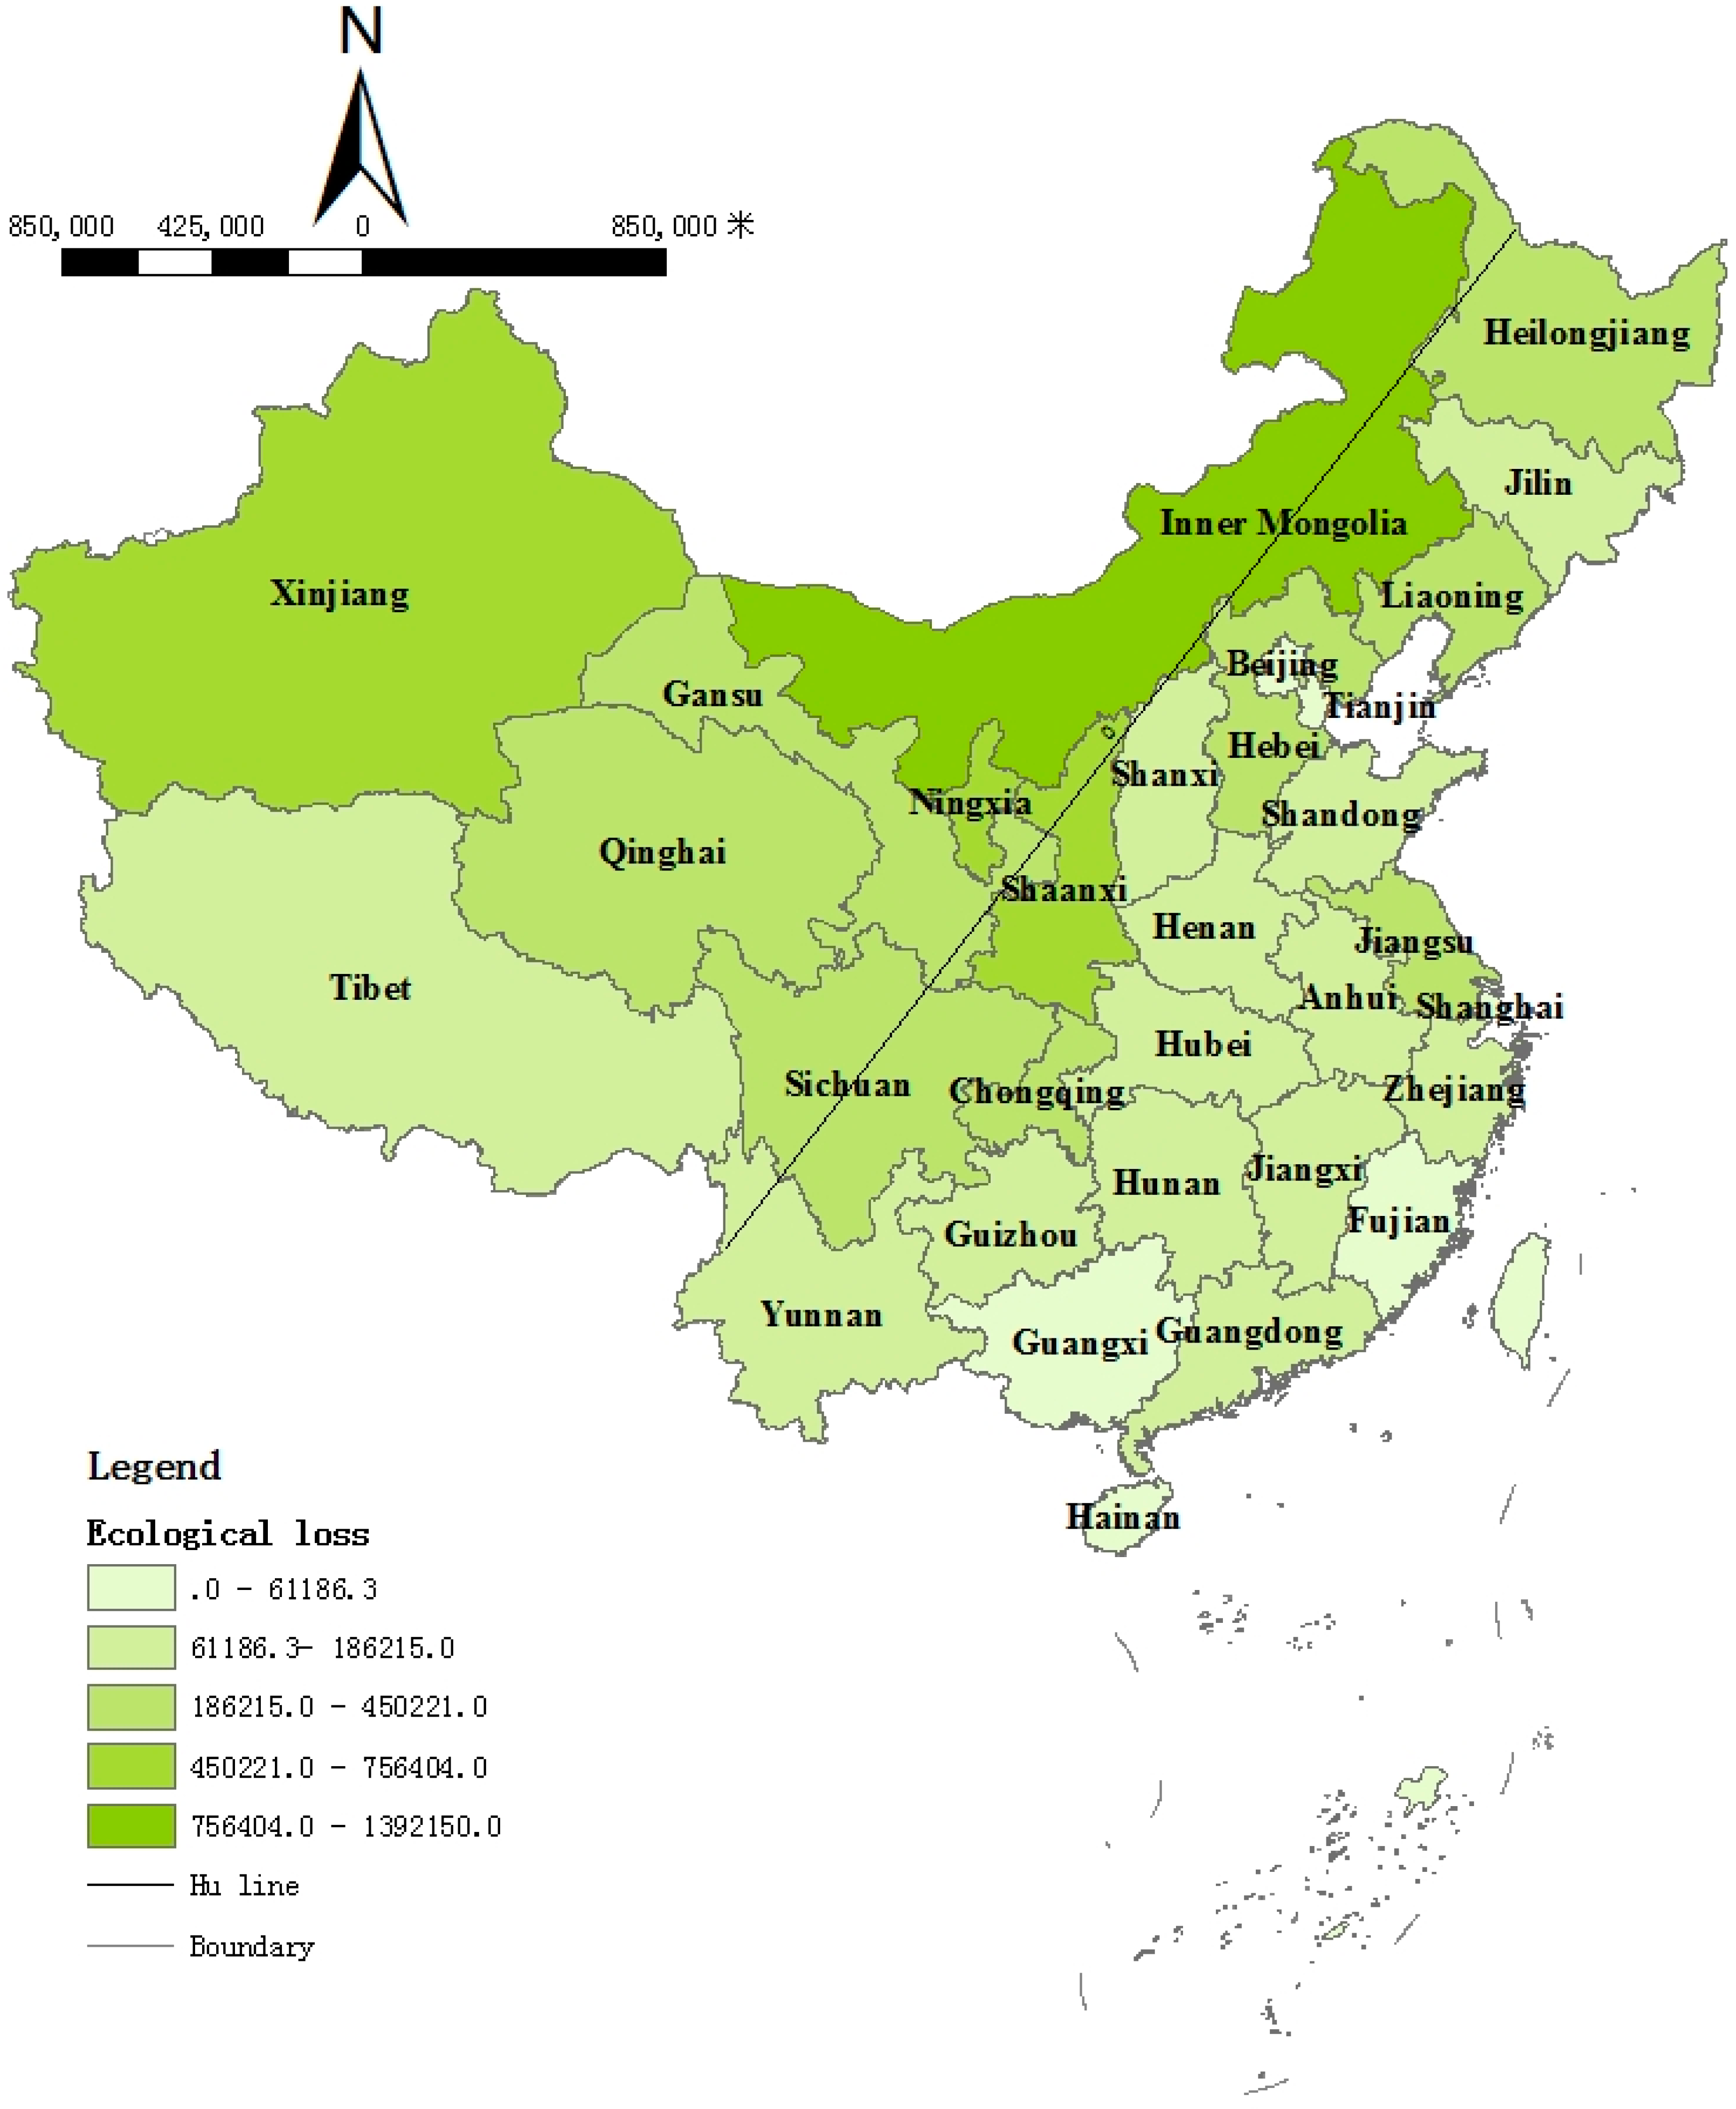
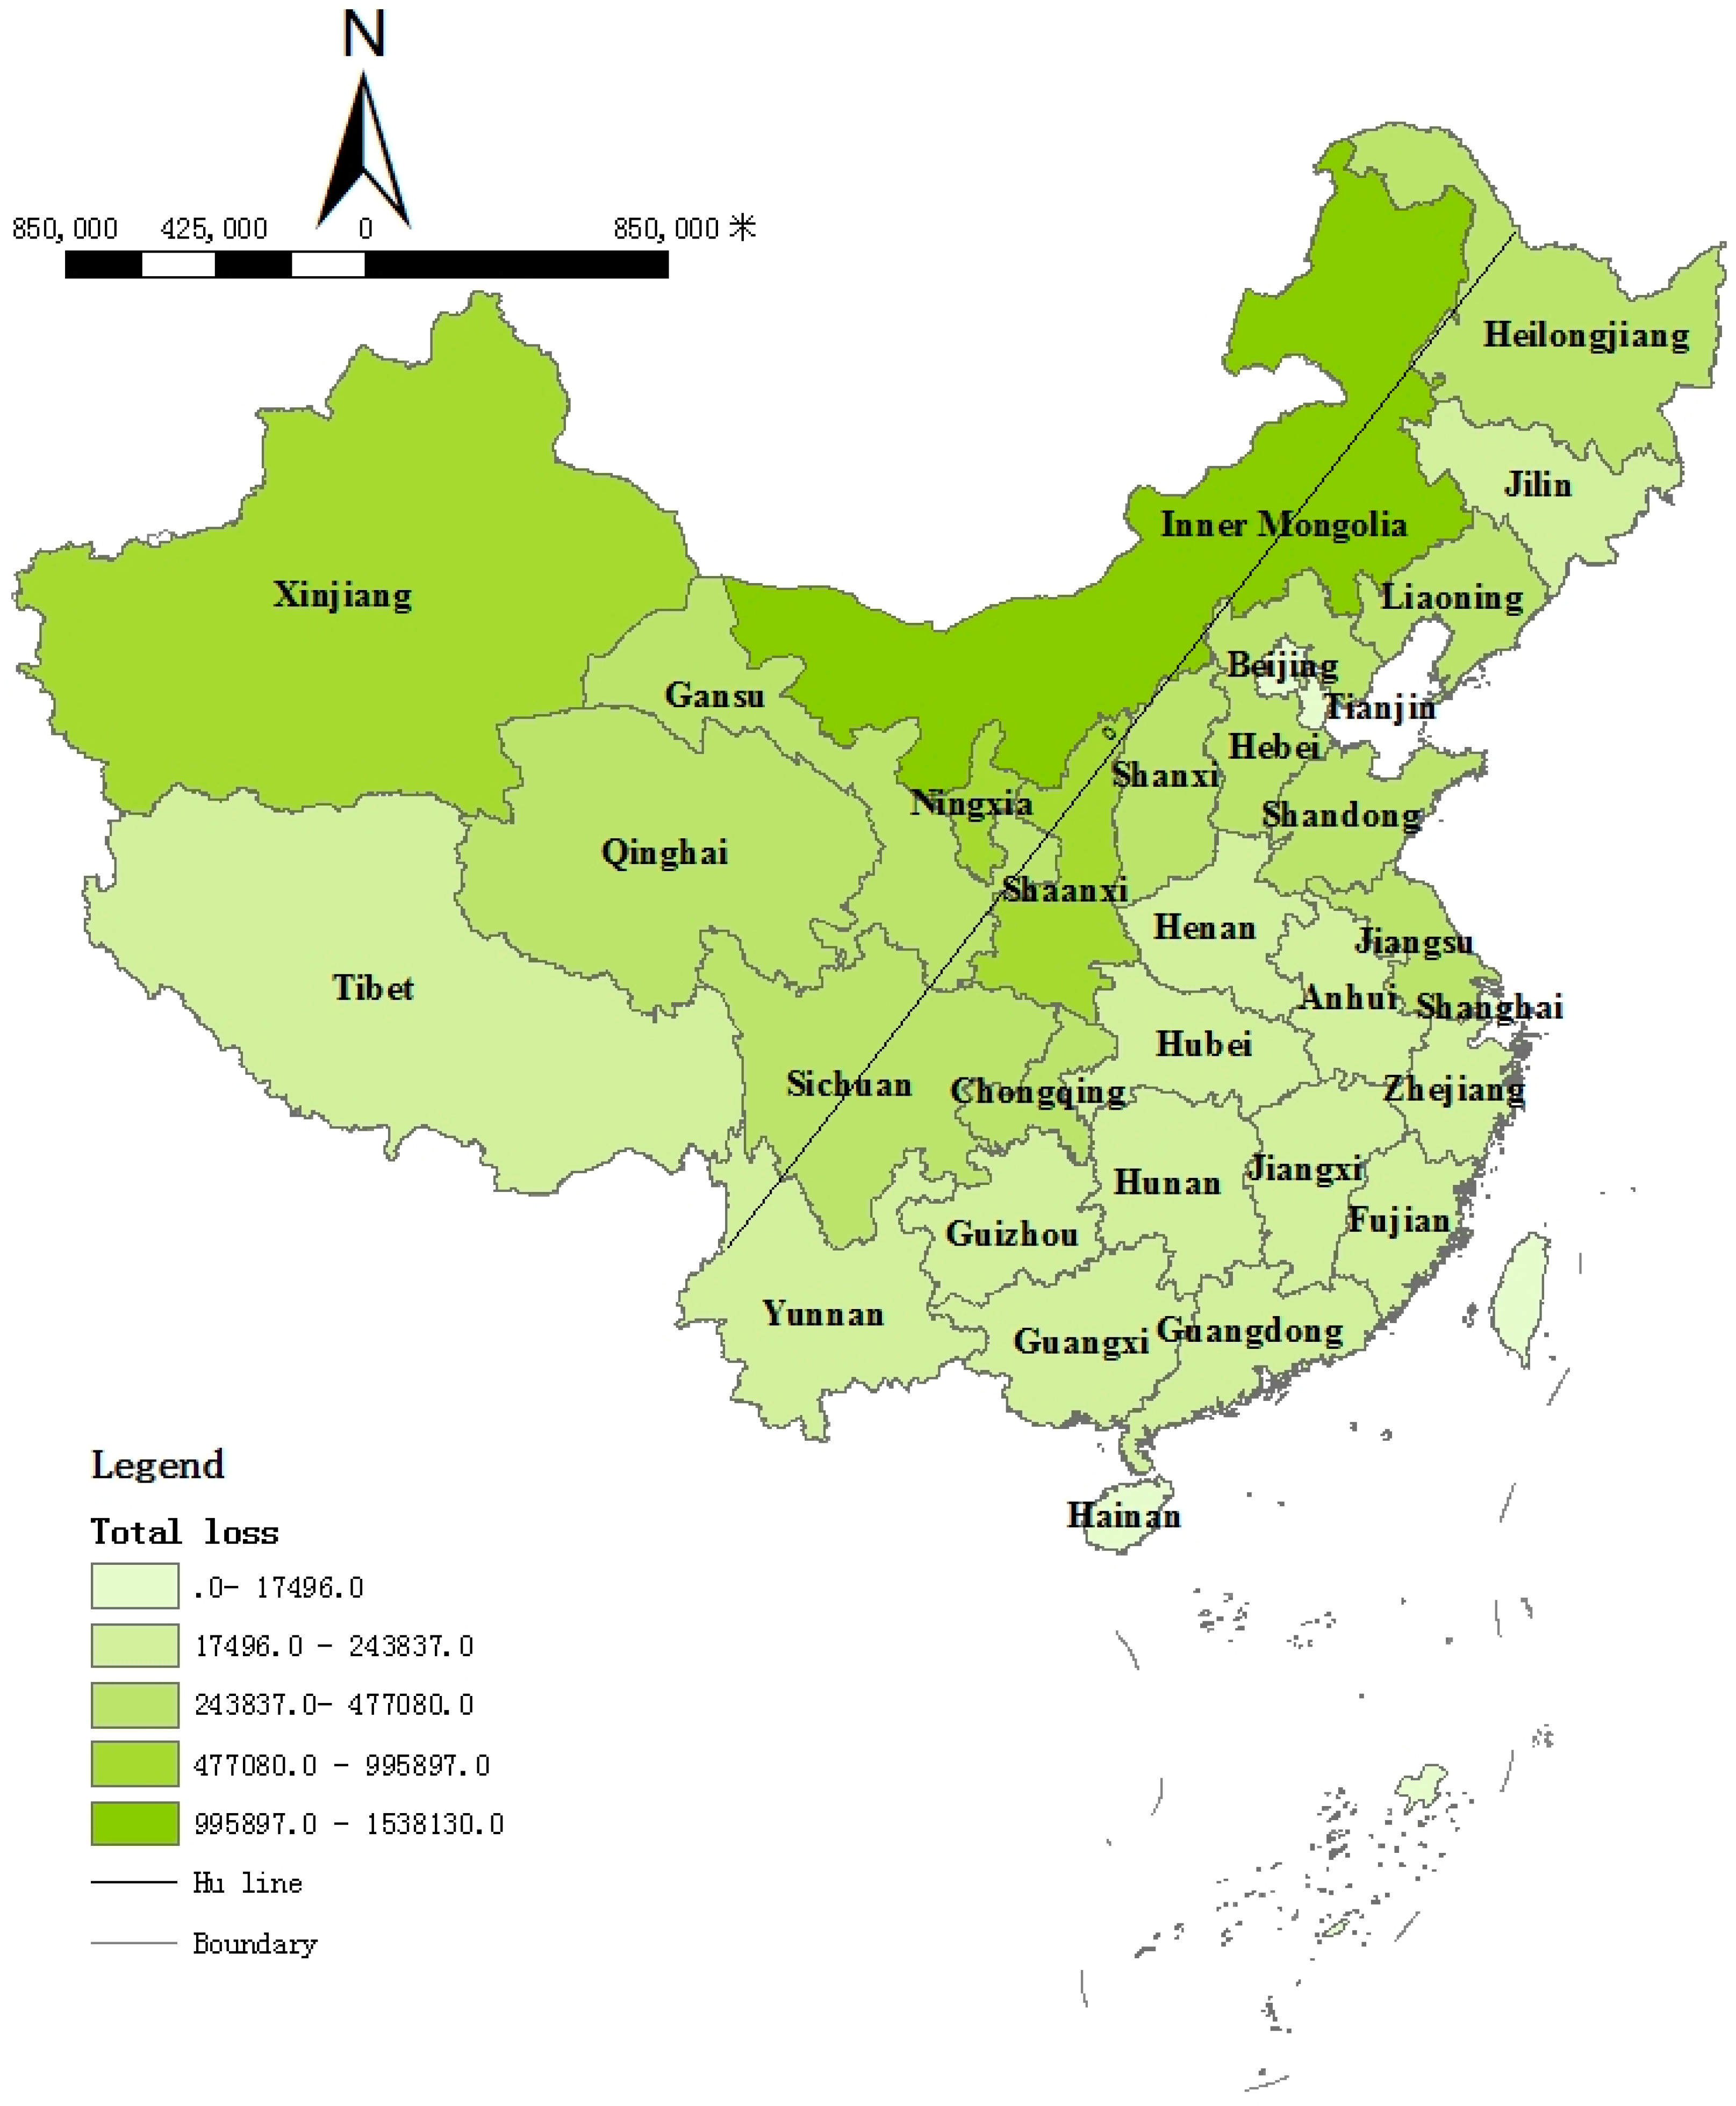
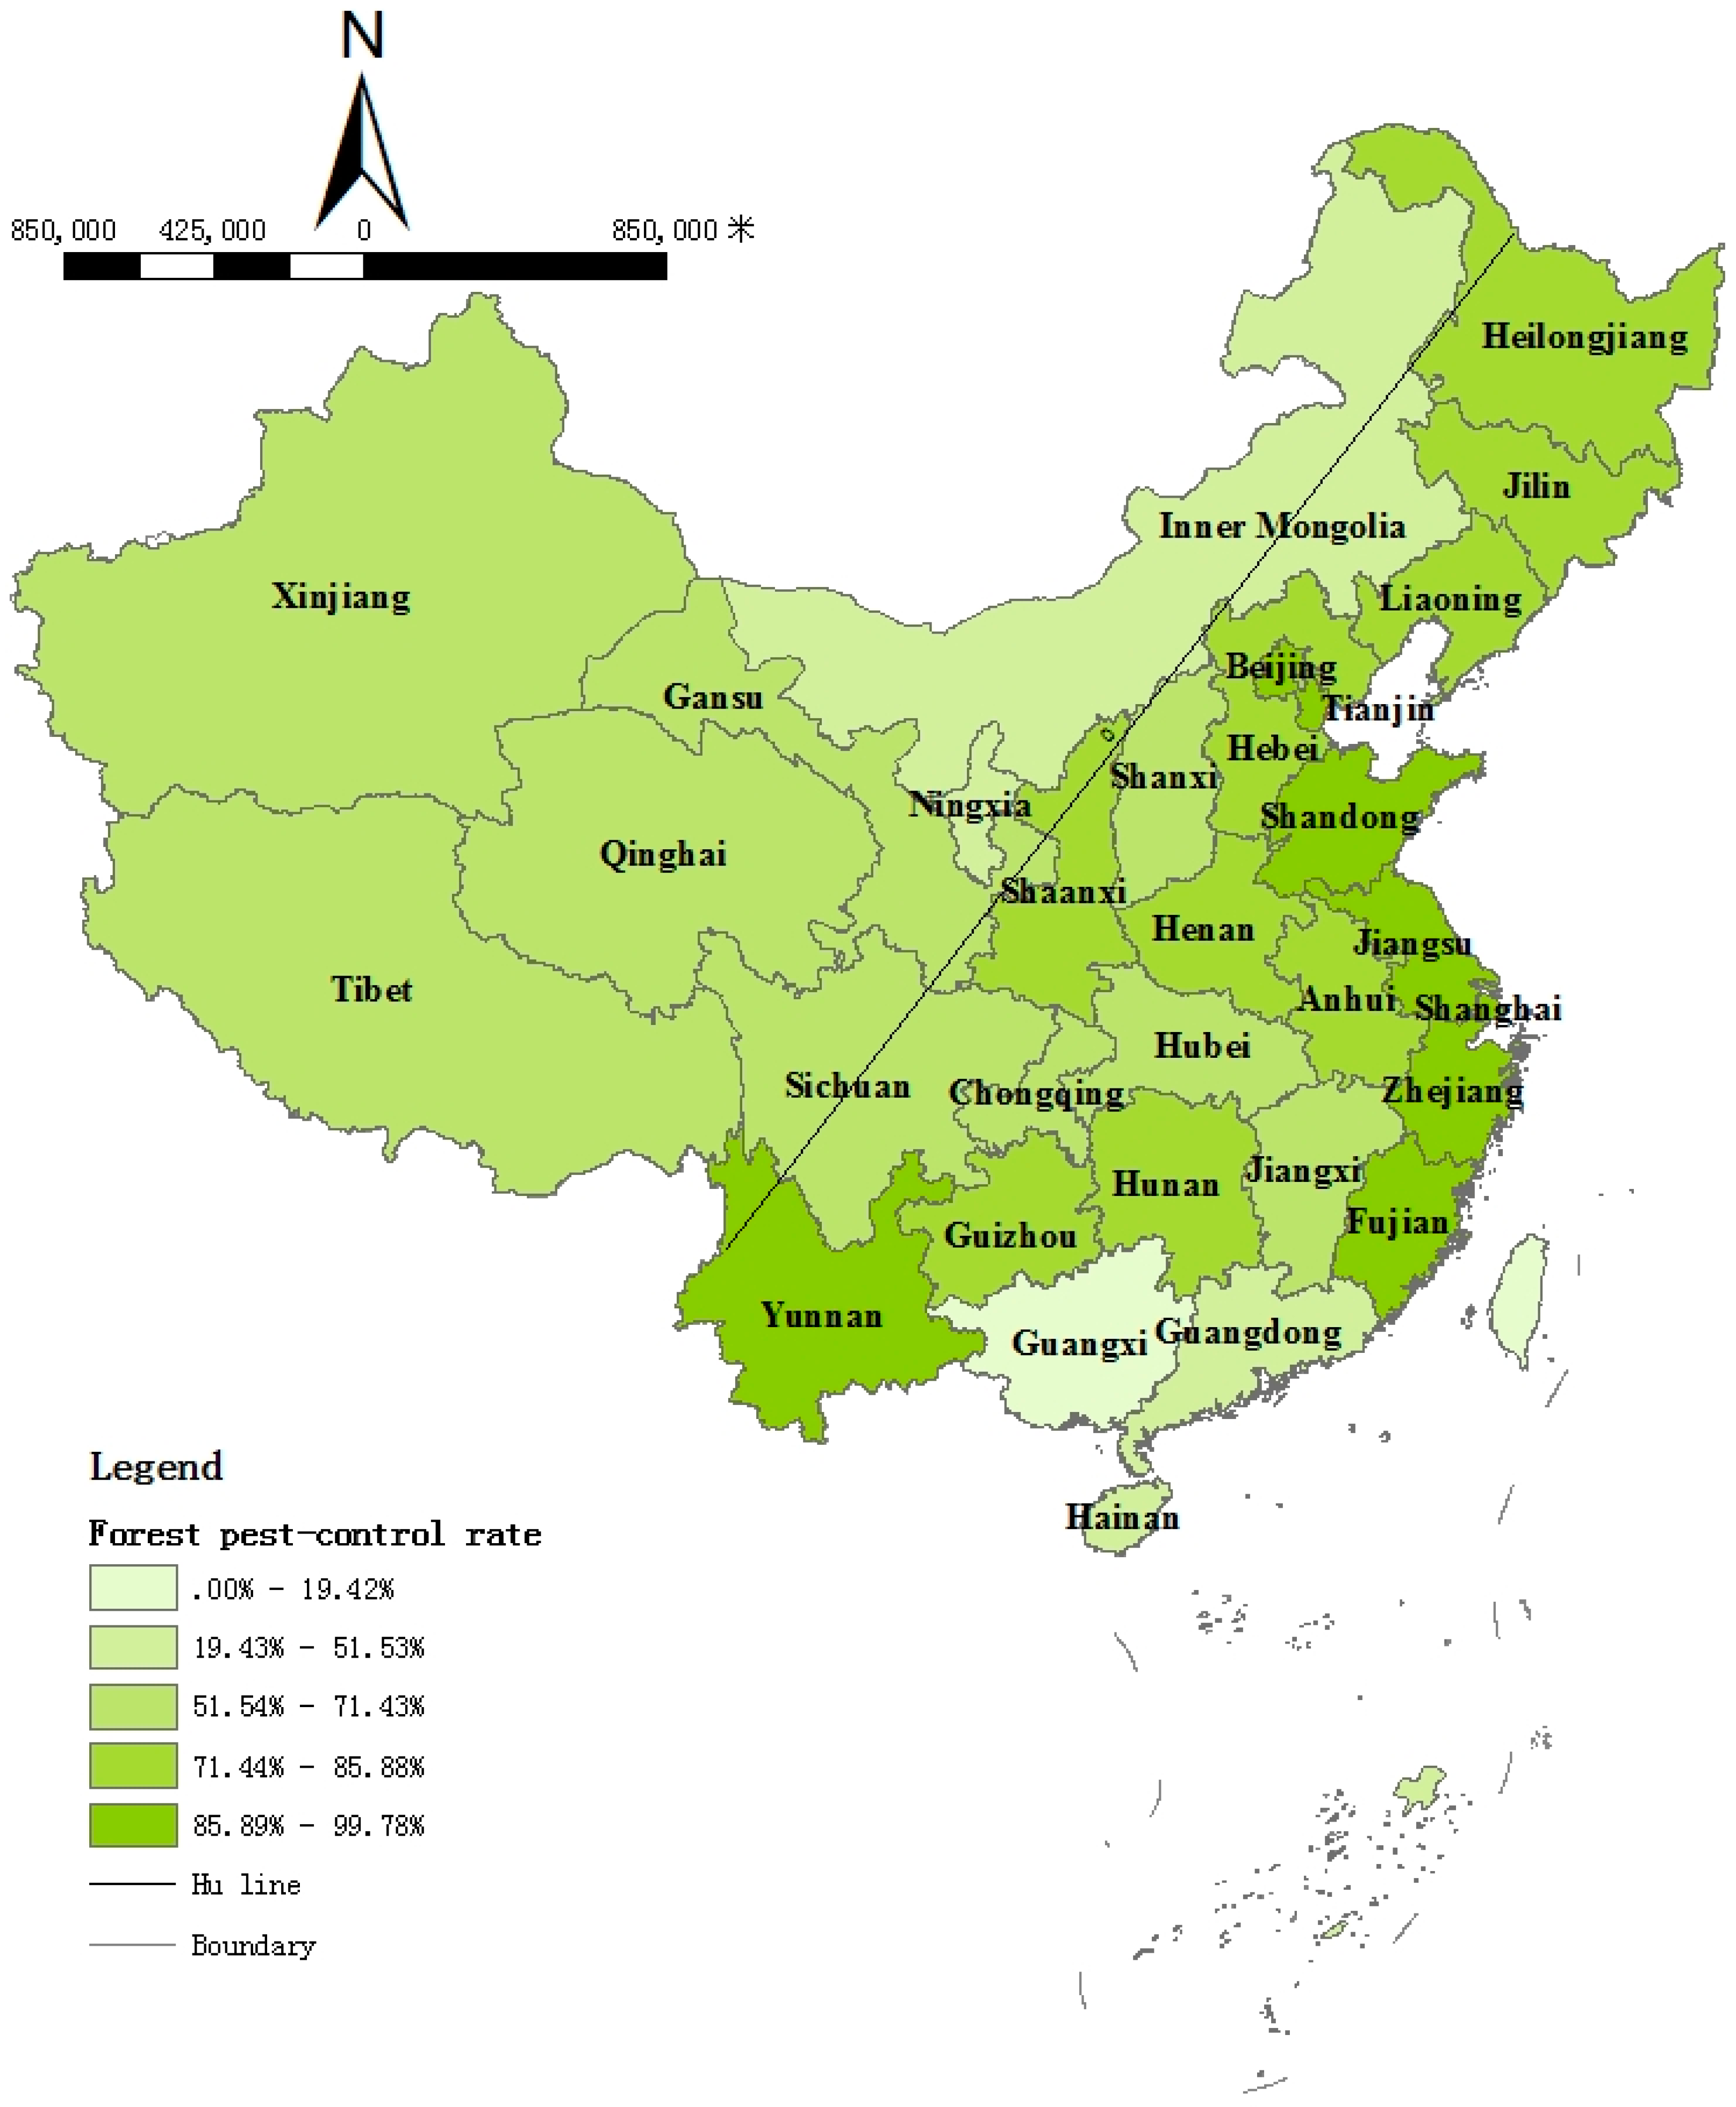
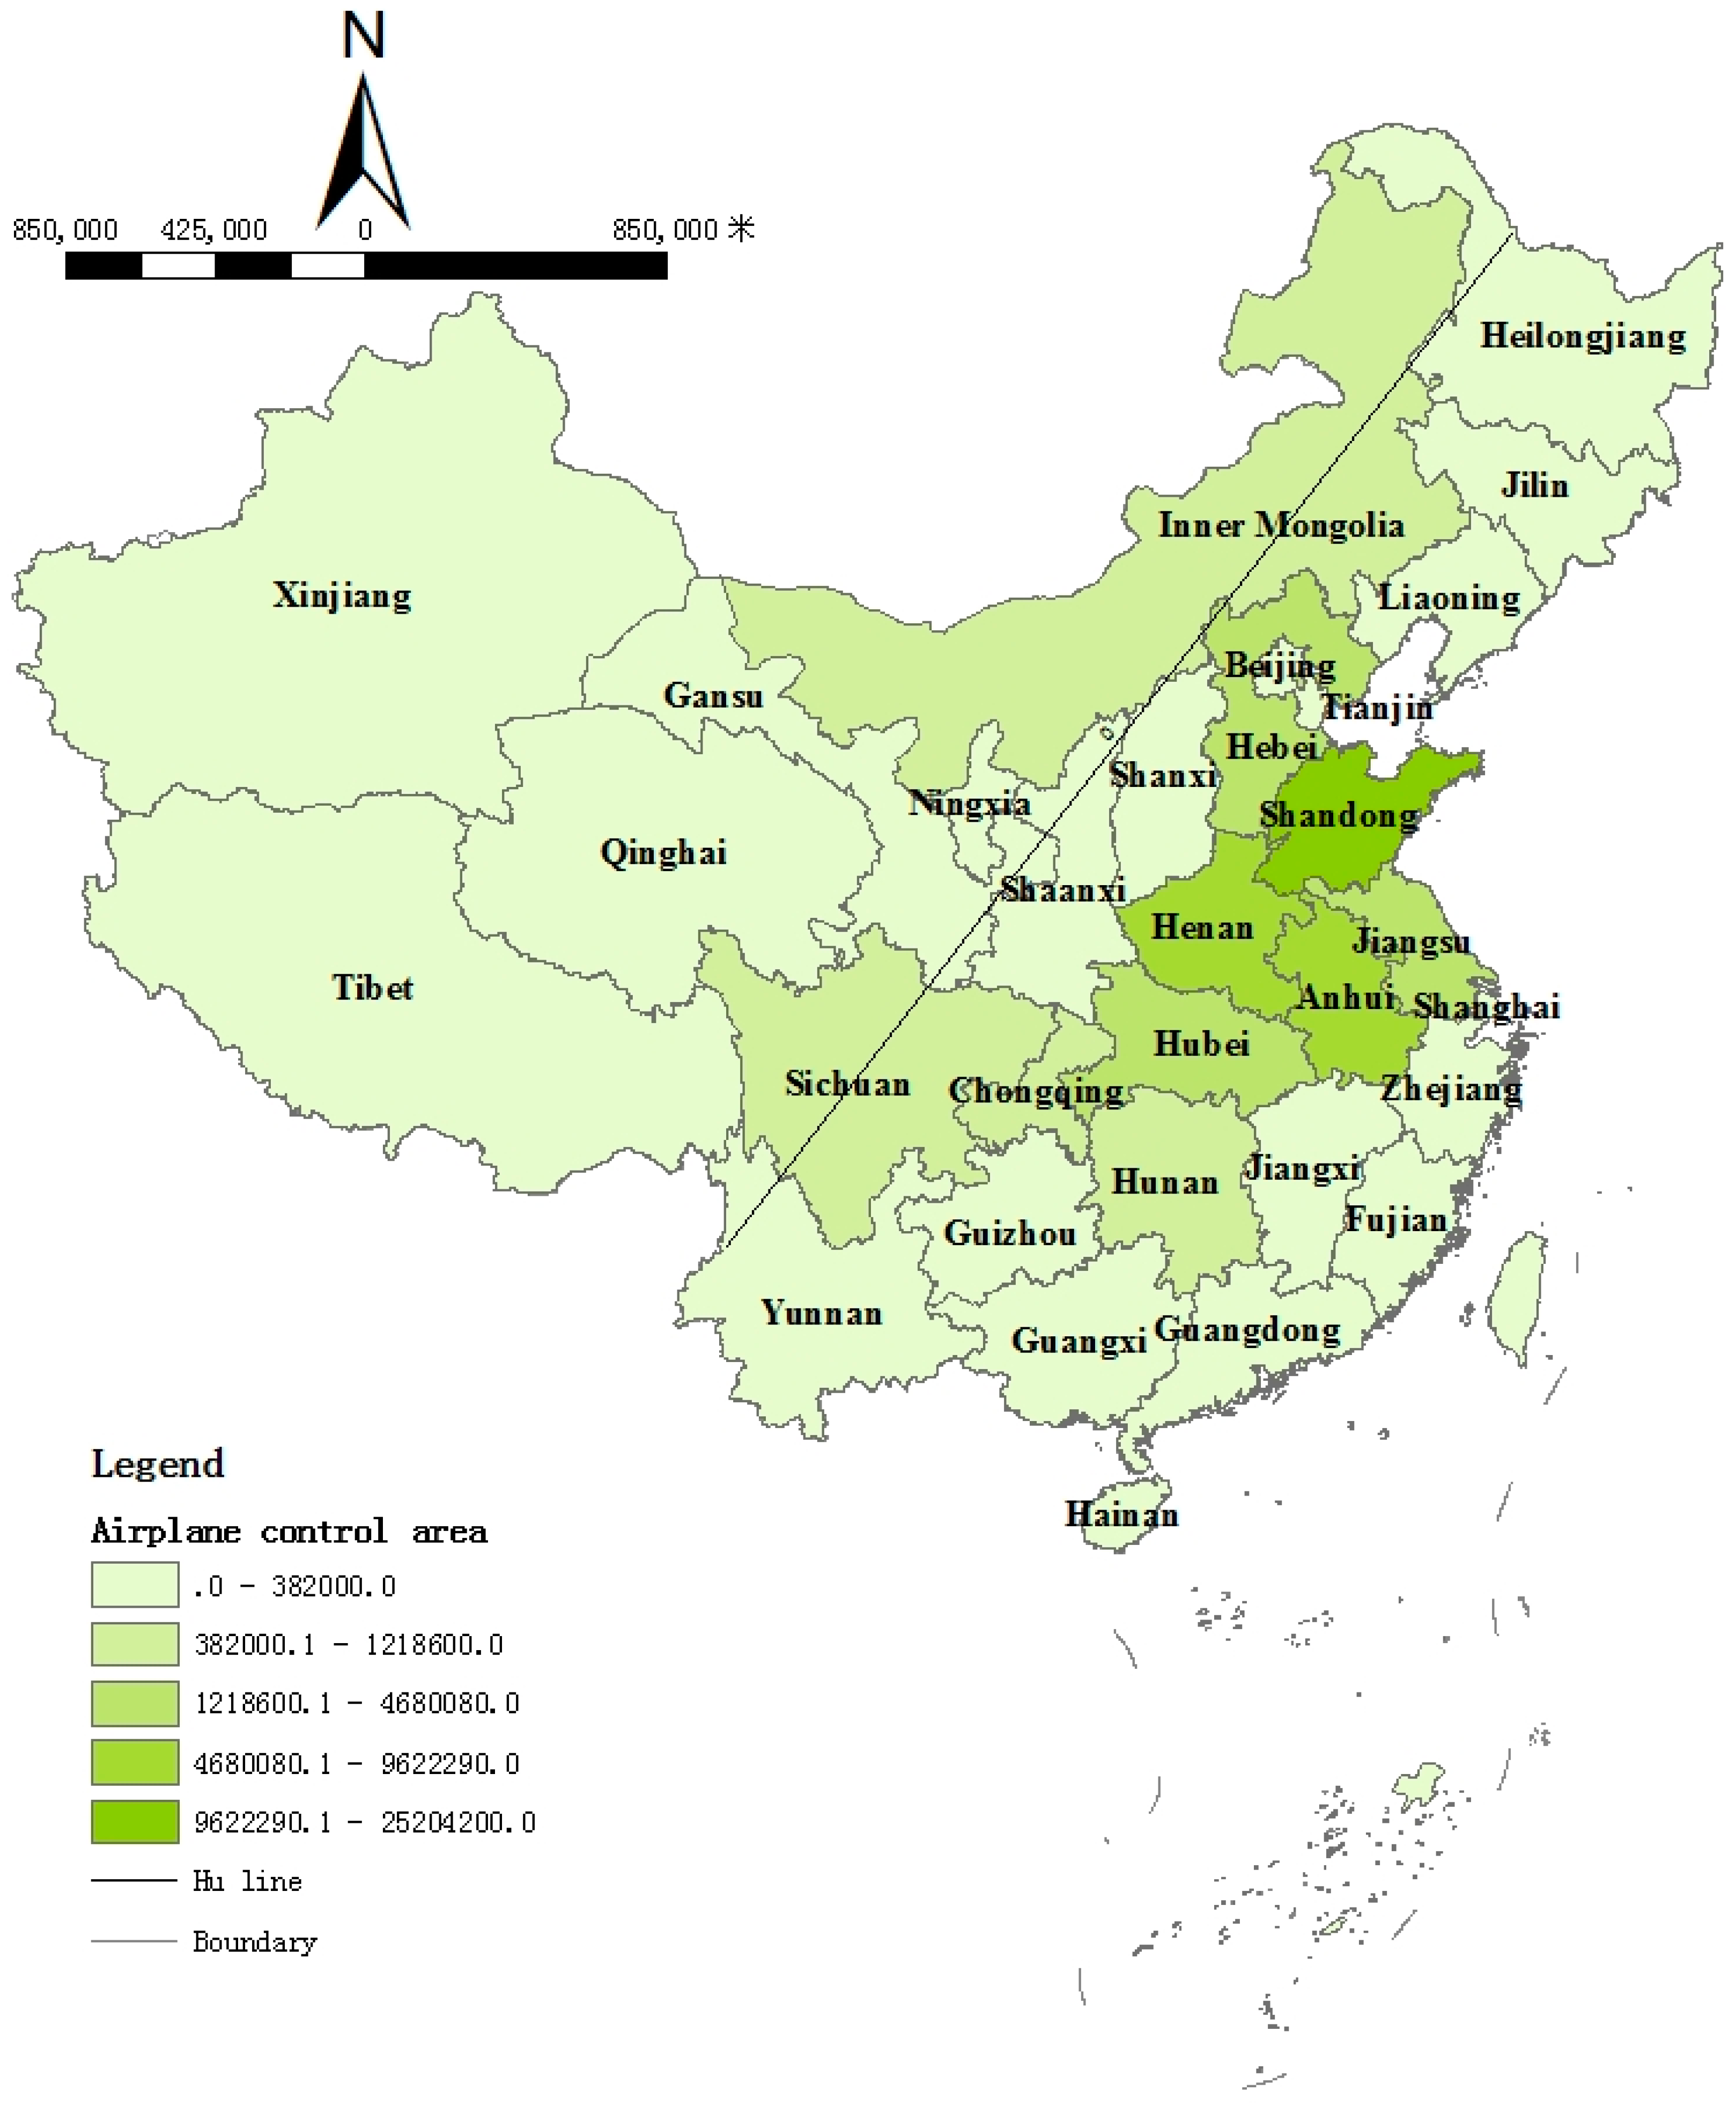
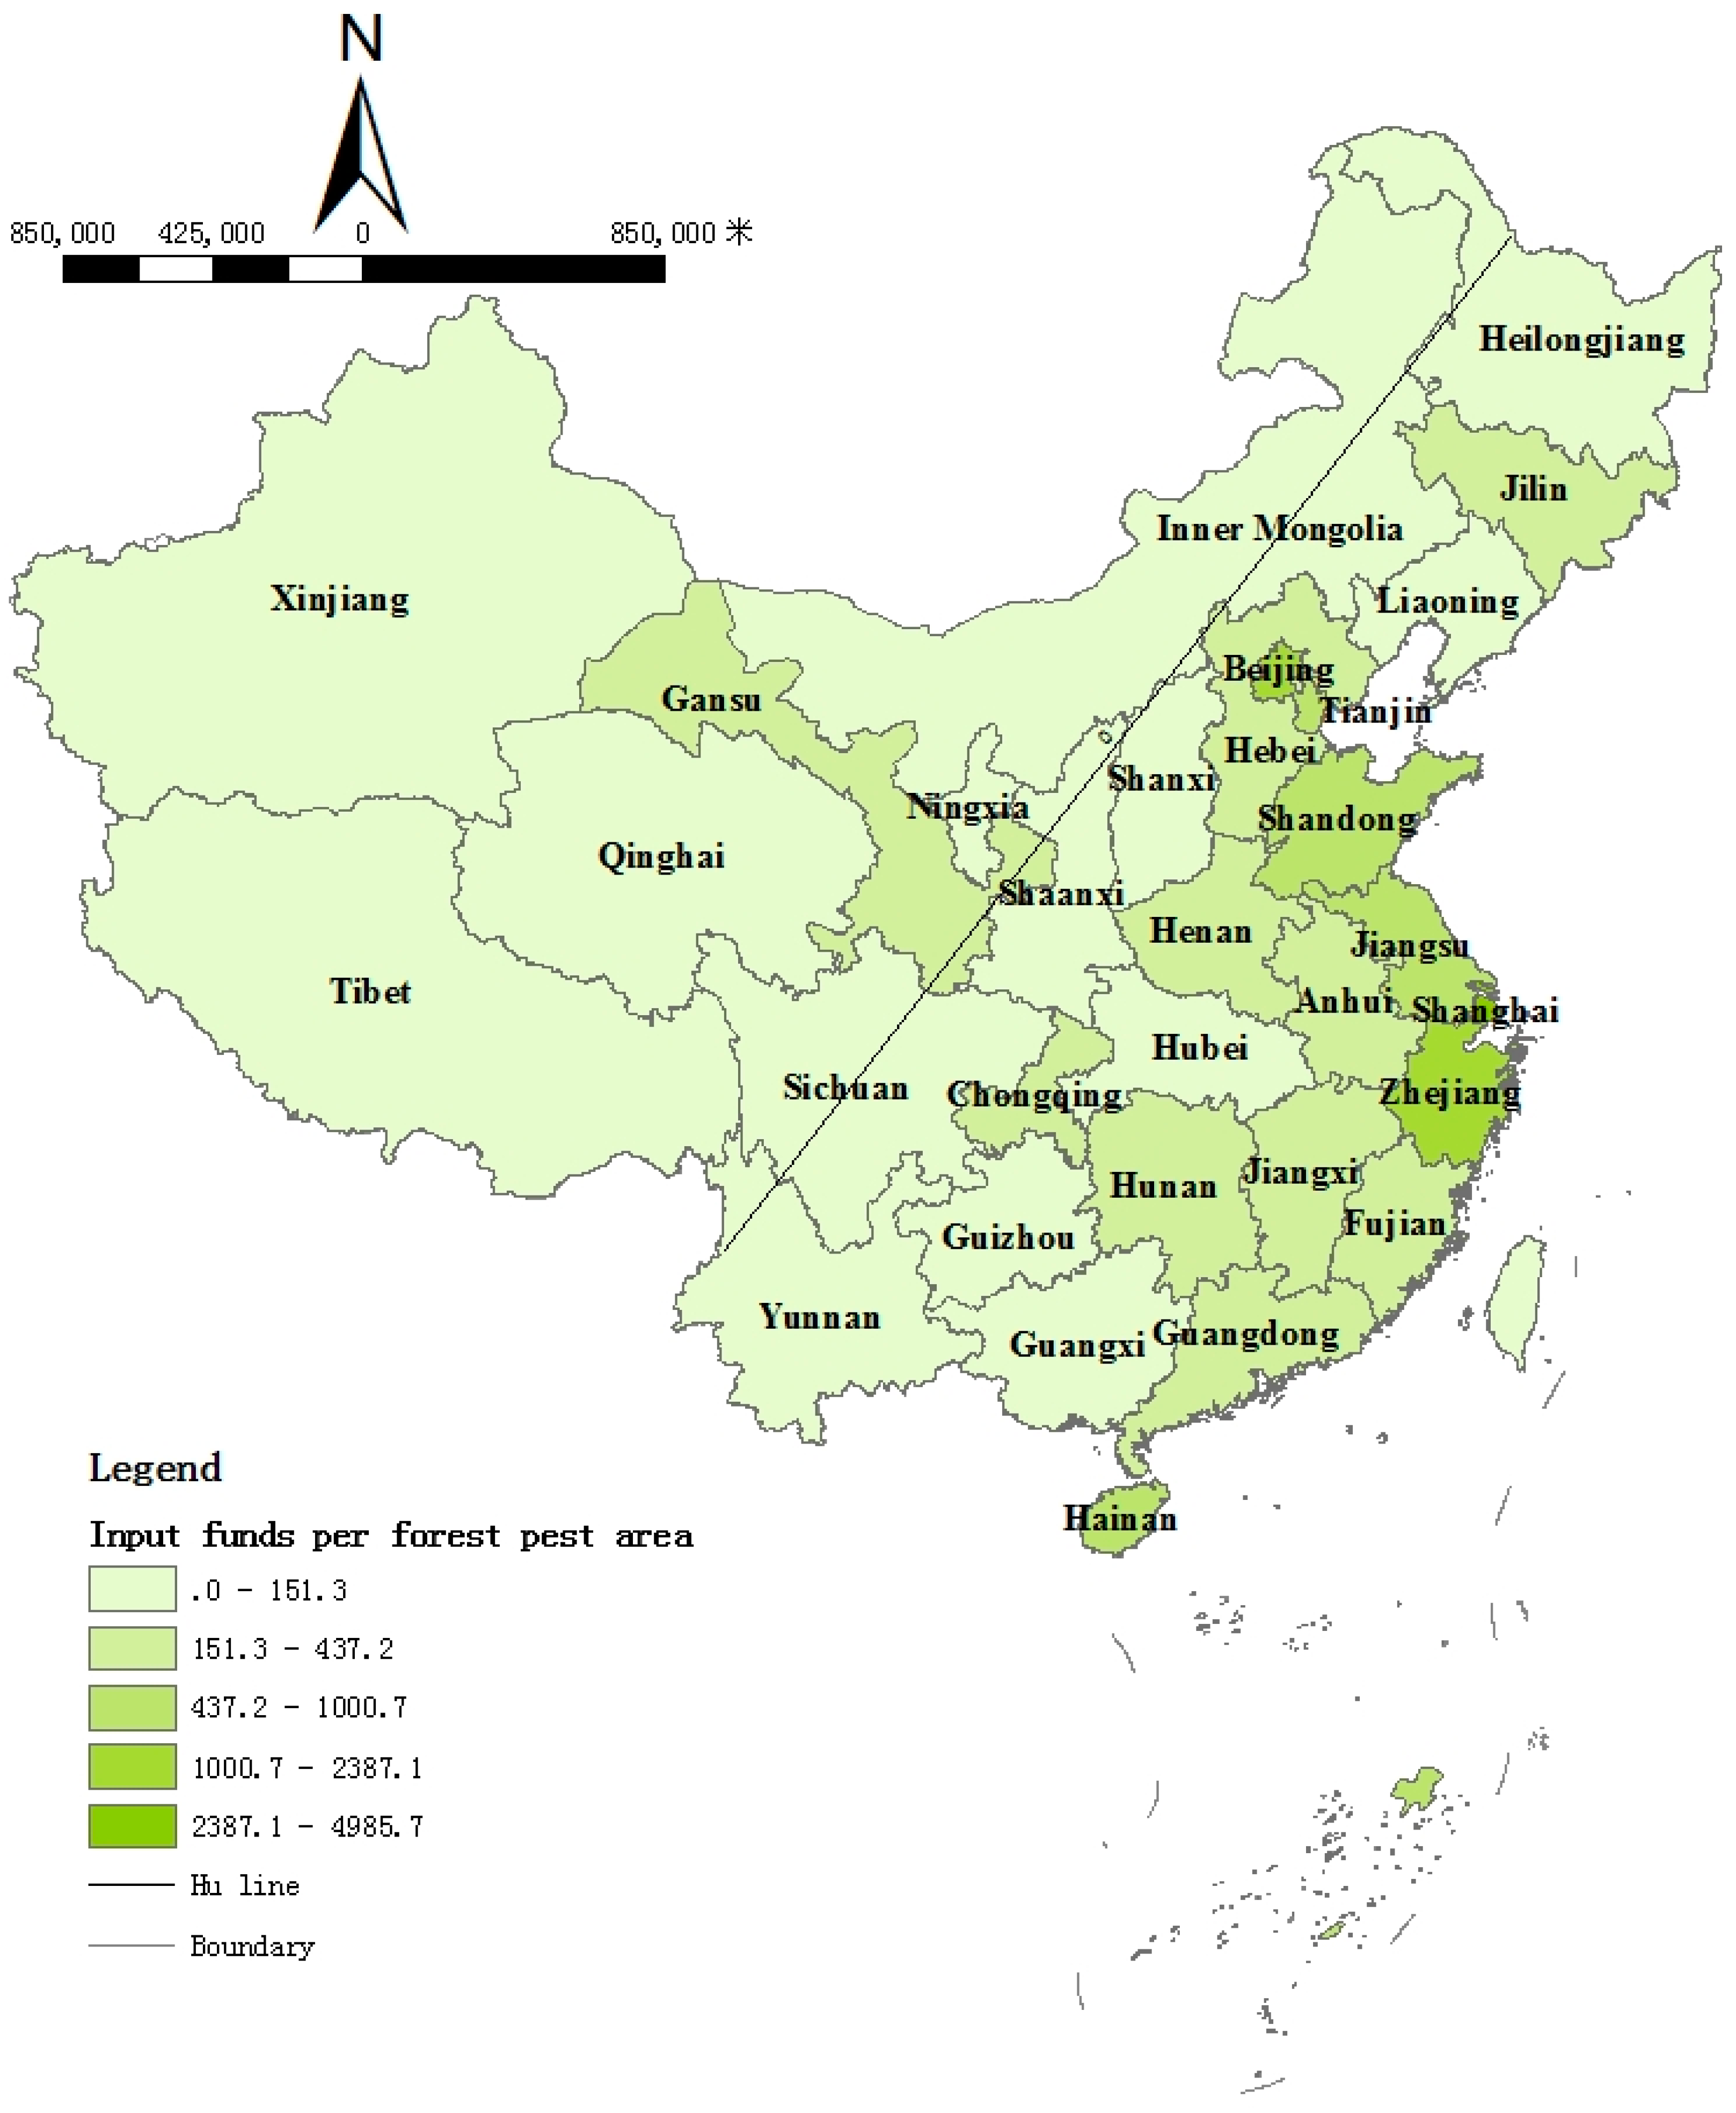
3.1. Forest Pest Damage and Management Differences between the Southwest and the Northeast

We present the final results of our calculation using each model with relative variables on the Chinese map using the ArcGIS software in Figure 1, Figure 2, Figure 3, Figure 4, Figure 5, Figure 6, Figure 7 and Figure 8. As for the details, Figure 1 shows the forest pest outbreak situation of each province. Nearly the entirety of China is affected by pests, although the problem in the northwest region is more serious than in the southeast, especially in Xinjiang and Inner Mongolia. Figure 2 shows that, with regard to forest pest-control rate, Xinjiang was the most damaged province in the northwest, while the provinces around Bohai sea coastal areas were also seriously affected, especially for Shandong. Figure 3, Figure 4 and Figure 5 show the economic, ecological, and total loss, respectively, mostly in agreement with pest-outbreak area and the rate distribution rule; economic loss in the southeast was more serious than ecological loss, while total loss was highest in the southeast, especially in Xinjiang and Inner Mongolia.
With respect to control measures, as shown in Figure 6, Figure 7 and Figure 8, most of the south-eastern part showed higher values than the north-western part, both for control area, airplane area or input funds per forest pest area, especially in the eastern coastland, where the level of economic stability ensures the input of sufficient funds for forest pest-control work. Airplane control might be more convenient to control pest-induced forest damage, while threatening ecological and environmental balance by poisoning the fauna and the wildlife feeding on it.
Overall, forests in the southwest experienced mostly economic losses as they are basically commercial forests, while forests of the northwest experienced more ecological losses resulting in a shrinkage of forest ecosystem services provided to nearby densely populated areas. Additionally, total forest pest-induced loss in the northwest was more severe than in the southwest, albeit with lower control measures or input funds that worsened the forest pest-outbreak-damage situations. These results convinced us to continue to study the factors responsible for these spatial differences in pursuit of suitable proposals for the improvement of the situation.
The shades on the map from dark to light green represent the degree from severe to gentle, and the line on each map is the ‘Hu Huanyong’ line. The north-western region includes Xinjiang, Gansu, Tibet, Qinghai, Ningxia, Inner Mongolia, and half of Sichuan, 10% of Yunnan provinces. The south-eastern region includes Heilongjiang, Jilin, Liaoning, Hebei, Beijing, Tianjin, Shanxi, Shaanxi, Shandong, Henan, Hunan, Hubei, Chongqing, Jiangsu, Shanghai, Anhui, Zhejiang, Jiangxi, Guizhou, Guangdong, Fijian, Guangxi, Hainan, half of Sichuan and 90% of Yunnan provinces. The map in these figures was generated by the software of ArcGIS. Area units in Figure 1 and Figure 7 are hectare; those in Figure 3, Figure 4 and Figure 5, and Figure 8 are ten thousand Chinese yuan, and those in Figure 2 and Figure 6 are percentages (%). All data are mean values from the Forestry Statistical Yearbook from 2013 to 2017, except forest pest-loss values, which were obtained from published papers and SFPCA.

3.2. Factors Influencing Forest Pest Control

We used the SEM to analyze the factors influencing forest pest control and their significant effects. As can be seen in Table 1, the model passed the significance test of 1%, indicating that the SEM is considerably effective, and all the endogenous variables passed the significance test. All factors associated with investment funds were significant; when GDP, forest income, and rural consumption increased by 1%, the forest pest control funds would increase by 0.71%, 0.14%, and 0.1%, respectively. This indicates that local economic development could help increase funds for pest control with significant correlativity, and an increase in the forest income of the county or the availability of sufficient funds for farmers to manage forest production would help release the burden of funds for pest control in each province. As for control measures, except for forest pest stations, the type of establishment did not pass the significance test. Other factors, such as affected pest-control funds and workers or rural population numbers, all passed the significance test of 1%, and if each factor increased by 1%, the control measures would decrease by 0.19% and increase by 0.36%. 0.62%, respectively. Therefore, we might conclude that the recent input of funds is not sufficient to increase control measures, but the associated employees could, to some extent, play an important role in control measures, and the enthusiasm of local farmers should be encouraged to release the control burden on the local government. Moreover, infrastructure development should also be improved according to pest outbreaks in each province and thus fortify the stations system.
As for the forest pest, this was regarded as the negative factor, and we hypothesized that control measures or natural conditions might mitigate emerging pest outbreaks. However, the affected endogenous factor affecting control measures could not reduce recent pest outbreaks, and the artificial forest would also increase pest area by 0.24%. Fortunately, current climate conditions could, to some extent, help reduce the prevalence of pests—a 1% increase in ambient air pressure, rainfall, or relative humidity would lead to a decrease in pest area by 0.3%, 0.14%, and 0.46%, respectively. This indicates that the environment possesses a natural capacity for resilience against pests, whereas deleterious artificial factors (e.g., poorly planned forest plantations) or insufficient control measures might induce a pest outbreak and thus add to the burden on control work by the local government; indeed, it might even threaten ecological safety and influence forestry production trade.

3.3. Realistic Significance of the Influencing Factors on Forest Pest Outbreak

After analyzing the spatial distribution regularities of forest pest outbreaks, associated loss, control measures and spatial differences in funds provided for control measures, we found that the climatic situation could influence pest outbreak; artificial forest increased pest area, and the input of funds is significantly influenced by local economic development status, although not enough to control the pest. Thus, we examined the most dangerous pest species, Bursaphelenchus xylophilus, as an example to verify the modulation of pest movement under the influencing factors. B. xylophilus is an invasive insect carried by Monochamus alternatus Hope (MAH) that has been highlighted as one of the most dangerous species by SFPCA and is considered a global menace [52]. When MAH punctures the tree surface to feed, B. xylophilus drills into the resin and destroys the xylem [53]. The available literature suggests that the insect destroys over 0.33 million ha of pinewood, causing annual economic losses in excess of USD 276.92 million [54]. As shown in Figure 9, the first appearance of B. xylophilus in the city of Nanjing overlapped with the intensification of international trade in 1982, and then rapidly expanded to the delta of the Yangtze River, which supports a flourishing economy in China [46]. The rapid spread was aided by global warming and developing transportation that supplied a spawning environment for B. xylophilus, causing damage to spread consistently along the ‘Hu Line’ from the southeast to the northwest between 1998 and 2015 [55]. Although SFPCA has taken several measures to reduce the damage by constantly improving technology, there are historical spatial differences in natural and social-economic aspects leading to an expansion of the original forest pest-damage area elsewhere, owing to invasion by other more dangerous species that add further obstacles to pest-control management, under conditions of lower capacity for control. This reminds us of the need for further discussions surrounding the divisional strategies that can be utilized to improve control efficiency, particularly with regard to the influencing factors identified in the present study.

4. Conclusions

We conclude that the SKFPs led to an increase in forest coverage by artificial forests characterized by high vulnerability and limited ecological defense capacity. Additionally, owing to economic development in China over the past decades, transportation has enabled the spread of the invasive pest from the southeast to the northwest. Along with global warming and adaptability changes, this led to record forest pest outbreaks, placing the heavy burden of pest-control work on local governments. This altered the distribution of forest pest outbreaks around China, which are increasing annually, particularly pest-induced forest loss, which are more severe in the northwest. This is particularly true with regard to ecological service losses, together with insufficient control measures that further compromise control work, consistent with spatial differences regularities drawn by the ‘Hu Line’, especially with regard to income and capacity differences.
Meanwhile, as current control measures fall short of satisfying province-specific protection demands, particularly for provinces with low economic development that precludes the procurement of sufficient funding support, actual investment in control measures is needed for the northwest and even for the entire country, to enable the release of this control burden on local governments. The law regulates that forest pests should be controlled by the managers and that forest pest-control measures are, for the most part, the responsibility of the government; however, forest farmers are also important stakeholders possessing the rights for forest management and they should be encouraged to participate in pest-control work. This has led to the introduction of the Public–Private–Partnership (PPP) model by adopting community co-management, integrated with a market mechanism, or specialized regional management strategies [58].
To be more specific, forest control measures could combine forest pest-control measures with national regionalization strategies, such as SKFPs, to help achieve ecological construction with mixed plantations and eliminate absolute poverty and lower the wealth gap by 2020 [59]. Furthermore, in the northwest, the Great Western Development Project and the Belt and Road Initiative development process promise to ensure economic development [60,61], while improving the new collective forestry property tenure reforms and the Tripartite Rural Land Entitlement System to encourage farmer willingness to participate in control work [48,62]. Meanwhile, monitoring systems should be set up for the governments of each province to increase their accountability for pest control by establishing an evaluation system. Besides government initiatives, participating farmers should be motivated to set up forest ranger posts or to purchase forest insurance policies through eco-compensation to improve the livelihood of the local farmers [63,64,65]. Furthermore, mobilizing other social forces, such as professional control companies with access to technology and investment funds, hiring competent pest-control teams, and through diversified investment channels to induce existing forest insurance schemes, should be adopted so as to incorporate both risk aversion and financial profit increment functions. This would not only reduce the burden upon SFPCA and improve its control efficiency, but it would also, to a certain extent, help in breaking away from the trend of an accentuation in progress of spatial differences on forest pest-control innovation reform.

Author Contributions

Y.W. conceived and designed the paper. Q.C. wrote the paper. Y.C. provided the data and revised the paper.

Funding

This research was funded by Chinese Forest Pest Cost Responsibility Investigation System, grant number 2017-R04 and in this paper, the exchange rate of one US dollar to Chinese yuan was 6.5 (1 US$ = 6.5 CNY).

Acknowledgments

We gratefully acknowledge Sen Wang for his comments and suggestions for improvement, and Chunping Mei, and Pradeep Baral for checking the paper. Similarly, we also thank Hongjun Su for the insightful discussion about forest pest losses.

Conflicts of Interest

The authors declare no conflict of interest.

Data Availability

The authors declare that all data supporting the analyses and findings of this study are available within the article.

References

  1. FAO. Global Forest Resources Assessment 2010—Main Report; FAO: Rome, Italy, 2010. [Google Scholar]
  2. Bradshaw, C.J.; Leroy, B.; Bellard, C.; Roiz, D.; Albert, C.; Fournier, A.; Barbet-Massin, M.; Salles, J.M.; Simard, F.; Courchamp, F. Massive yet Grossly Underestimated Global Costs of Invasive Insects. Nat. Commun. 2016, 7, 12986. [Google Scholar] [CrossRef] [PubMed]
  3. Dainese, M.; Schneider, G.; Krauss, J.; Steffan-Dewenter, I. Complementarity among Natural Enemies Enhances Pest Suppression. Sci. Rep. 2017, 7, 8172. [Google Scholar] [CrossRef] [PubMed]
  4. Oliveira, C.M.; Auad, A.M.; Mendel, S.M. Crop Losses and the Economic Impact of Insect Pests on Brazilian Agriculture. Crop Prot. 2014, 56, 50–54. [Google Scholar] [CrossRef]
  5. Song, Y.S.; Su, H.J.; Yu, H.Y. The Loss Assessment of Chinese Forest Pest Disasters. China For. Pests 2011, 6, 1–4. (In Chinese) [Google Scholar]
  6. Yajuan, L.I.; Chen, T.; Wang, J.; Wang, D. Temporal-Spatial Distribution and Formation of Historic and Cultural Villages in China. Geogr. Res. 2013, 32, 1477–1485. (In Chinese) [Google Scholar]
  7. Hu, H.Y. The Distribution of Population in China, with Statistics and Maps. Acta Geogr. Sin. 1935, 2, 33–74. (In Chinese) [Google Scholar]
  8. Gao, Y.; Zheng, J.; Bu, M. Rural-urban income gap and agricultural growth in China: An empirical study on the provincial panel data, 1978–2010. China Agric. Econ. Rev. 2014, 6, 92–107. [Google Scholar] [CrossRef]
  9. Hu, Z.; Wang, Y.; Liu, Y.; Long, H.; Peng, J. Spatio-Temporal Patterns of Urban-Rural Development and Transformation in East of the “Hu Huanyong Line”, China. ISPRS Int. J. Geoinf. 2016, 5, 24. [Google Scholar] [CrossRef]
  10. Delang, C.O. China’s Key Forestry Programs: Economic, Social and Ecological Rationales. Int. J. Glob. Environ. Issues 2016, 15, 281–299. [Google Scholar] [CrossRef]
  11. Ji, L.; Zhen, W.; Wang, X.; An, L. Forest Insect Pest Management and Forest Management in China: An Overview. Environ. Manag. 2011, 48, 1107–1121. [Google Scholar] [CrossRef]
  12. Fares, S.; Mugnozza, G.S.; Corona, P.; Palahí, M. Sustainability: Five Steps for Managing Europe’s Forests. Nat. News 2015, 519, 407–409. [Google Scholar] [CrossRef] [PubMed]
  13. Zidon, R.; Tsueda, H.; Morin, E.; Morin, S. Projecting Pest Population Dynamics under Global Warming: The Combined Effect of Inter- and Intra-Annual Variations. Ecol. Appl. 2016, 26, 1198–1210. [Google Scholar] [CrossRef] [PubMed]
  14. State Statistical Bureau. National Bureau of Statistics, 2003–2017. Available online: http://data.stats.gov.cn/easyquery.htm?cn=E0103 (accessed on 10 December 2018). (In Chinese)
  15. SFA. Forestry Statistics Yearbook (2003–2017); China Forestry Publishing House. Available online: http://navi.cnki.net/KNavi/YearbookDetail?pcode=CYFD&pykm=YCSRT&bh (accessed on 18 December 2018). (In Chinese).
  16. Häggman, H.; Raybould, A.; Borem, A.; Fox, T.; Handley, L.; Hertzberg, M.; Lu, M.Z.; Macdonald, P.; Oguchi, T.; Pasquali, G.; et al. Genetically Engineered Trees for Plantation Forests: Key Considerations for Environmental Risk Assessment. Plant Biotechnol. J. 2013, 11, 785–798. [Google Scholar] [CrossRef] [PubMed]
  17. Zhang, K.; Song, C.; Zhang, Y.; Zhang, Q. Natural disasters and economic development drive forest dynamics and transition in China. For. Policy Econ. 2017, 76, 56–64. [Google Scholar] [CrossRef]
  18. Zhao, Y.X.; Wu, J.; Luo, Y.Q.; Tao, J. Forest Invasion Insect Identification and Control Measures of China. Plant Quar. 2015, 29, 42–47. (In Chinese) [Google Scholar]
  19. Arvind, K.; Akhilesh, K. Effect of Abiotic and Biotic Factors on Incidence of Pests and Predator in Cowpea Vigna unguiculata. Legume Res. 2015, 38, 121–125. [Google Scholar] [CrossRef]
  20. Ge, X.; Chao, J.; Chen, L.; Qiu, S.; Zhao, Y.; Wang, T.; Zong, S. Predicting the Potential Distribution in China of Euwallacea fornicates (Eichhoff) under Current and Future Climate Conditions. Sci. Rep. 2017, 7, 906. [Google Scholar] [CrossRef]
  21. Blake, G.; Sandler, H.A.; Coli, W. An Assessment of Grower Perceptions and Factors Influencing Adoption of IPM in Commercial Cranberry Production. Renew. Agric. Food Syst. 2007, 22, 134–144. [Google Scholar] [CrossRef]
  22. Damos, P. Modular structure of web-based decision support systems for integrated pest management. A review. Agron. Sustain. Dev. 2015, 35, 1347–1372. [Google Scholar] [CrossRef] [Green Version]
  23. Sun, K.; Zhang, T.; Tian, Y. Dynamics analysis and control optimization of a pest management predator–prey model with an integrated control strategy. Appl. Math. Comput. 2017, 292, 253–271. [Google Scholar] [CrossRef]
  24. Rout, T.M.; Moore, J.L.; McCarthy, M.A. Prevent, search or destroy? A partially observable model for invasive species management. J. Appl. Ecol. 2014, 51, 804–813. [Google Scholar] [CrossRef] [Green Version]
  25. Stallman, H.R.; James, H.S., Jr. Determinants Affecting Farmers’ Willingness to Cooperate to Control Pests. Ecol. Econ. 2015, 117, 182–192. [Google Scholar] [CrossRef]
  26. Hoskins, W.M.; Borden, A.D.; Michelbacher, A.E. Recommendations for a More Discriminating Use of Insecticides. In Proceedings of the 6th Pacific Science Congress, Berkeley, CA, USA, 24 July–12 August 1939; pp. 119–123. [Google Scholar]
  27. Ullyett, E.C. Insects, Man and the Environment. J. Econ. Entomol. 1951, 44, 459–464. [Google Scholar] [CrossRef]
  28. FAO. Report of the First Session of the FAO Panel of Experts on Integrated Pest Control; FAO: Rome, Italy, 1967; Volume 9, pp. 18–22. [Google Scholar]
  29. Norton, G.A.; Holling, C.S. Proceedings of a Conference on Pest Management. Int. Inst. Appl. Syst. Anal. 1997, 10, 25–29. [Google Scholar]
  30. Bulmer, M.S.; Bachelet, I.; Raman, R.; Rosengaus, R.B.; Sasisekharan, R. Targeting an Antimicrobial Effector Function in Insect Immunity as a Pest Control Strategy. Proc. Natl. Acad. Sci. USA 2009, 106, 12652–12657. [Google Scholar] [CrossRef] [PubMed]
  31. Potter, K.; Conkling, B. Forest Health Monitoring: National Status, Trends and Analysis 2015; U.S. Department of Agric: Washington, DC, USA, 2017; Volume 198, pp. 1–213.
  32. Tang, S.; Xiao, Y.; Chen, L.; Cheke, R.A. Integrated Pest Management Models and Their Dynamical Behavior. Bull. Math. Biol. 2005, 67, 115–135. [Google Scholar] [CrossRef]
  33. Ordano, M.; Gullen, L.; Rull, J.; Lasa, R.; Aluja, M. Temporal Dynamics of Diversity in a Tropical Fruit (Tephritidae) Fly Ensemble and Their Implications on Pest Management and Biodiversity Conservation. Biodivers. Conserv. 2013, 22, 1557–1575. [Google Scholar] [CrossRef]
  34. Puente, M.; Darnall, N.; Forkner, R.E. Assessing Integrated Pest Management Adoption: Measurement Problems and Policy Implications. Environ. Manag. 2011, 48, 1013–1023. [Google Scholar] [CrossRef]
  35. Wyckhuys, K.A.G.; O’Neil, R.J. Local Agro-Ecological Knowledge and its Relationship to Farmers’ Pest Management Decision Making in Rural Honduras. Agric. Hum. Values 2007, 24, 307–321. [Google Scholar] [CrossRef]
  36. State Council of the People’s Republic of China. Forestry Pest Control Regulations. 1989. Available online: http://www.forestry.gov.cn/main/3950/content-459886.html (accessed on 14 March 2017). (In Chinese)
  37. State Forestry Administration (SFA). Major Exotic Forestry Pest Emergency Measures. 2005. Available online: http://www.forestry.gov.cn/portal/main/s/150/content-204816.html (accessed on 2 November 2007). (In Chinese)
  38. Dong, Z.H.; Xu, Y.; Cui, D.Y.; Chao, Y. Development and Application of Forecast Function in the Information Management System of Forest. China For. Pests 2017, 36, 9–12. (In Chinese) [Google Scholar]
  39. Qin, J.; Yang, X.; Yang, Z.; Luo, J.T.; Lei, X.F. New Technology of Using Meteorological Information in Forest Insect Pest Forecast and Warning Systems. Pest Manag. Sci. 2017, 73, 2509–2518. [Google Scholar] [CrossRef]
  40. Liu, P.; Liang, Q.L.; Chen, M.; Liu, Z.J.; Sheng, Z.H.; Su, Y.L. Construction on Index System of Forest pest Disaster Loss Assessment. Sci. Silvae Sin. 2016, 52, 101–107. (In Chinese) [Google Scholar] [CrossRef]
  41. Cai, Q.; Zhang, D.H.; Li, Y.; Zhu, L.Y. Empirical Study of Forest Pest Control Efficiency in China. For. Pest Dis. 2016, 3, 34–37. (In Chinese) [Google Scholar]
  42. SFPCA. The Notice of the Forest Pest Control “Forth Rate” Target during the 13th Five Years by SFA. 2016. Available online: http://www.forestpest.org/statutefile/lawunion/4028949e58e29b94015900e7097100b7.html (accessed on 15 December 2016). (In Chinese).
  43. Liu, J.; Li, S.; Ouyang, Z.; Tam, C.H.; Chen, X. Ecological and Socioeconomic Effects of China’s Policies for Ecosystem Services. Proc. Natl. Acad. Sci. USA 2008, 105, 9477. [Google Scholar] [CrossRef] [PubMed]
  44. Ma, A.G. China Forest Pest Situation; China Forestry Publishing House: Shenyang, China, 2008. (In Chinese) [Google Scholar]
  45. Chen, M.X.; Gong, Y.H.; Li, Y. Population Distribution and Urbanization on Both Sides of the Hu Huanyong Line: Answering the Premier’s Question. J. Geogr. Sci. 2016, 26, 1593–1610. [Google Scholar] [CrossRef]
  46. Yan, J. The Economic Analysis and Measures Study of Chinese Forestry Pest Disaster Management. Ph.D. Thesis, Beijing Forestry University, Beijing, China, 2008; p. 264. (In Chinese). [Google Scholar]
  47. Liu, C.; Liu, H.; Wang, S. Has China’s New Round of Collective Forest Reforms Caused an Increase in the Use of Productive Forest Inputs? Land Use Policy 2017, 64, 492–510. [Google Scholar] [CrossRef]
  48. Seidl, R.; Thom, D.; Kartz, M.; Martin-Benito, D.; Pettonie, M.; Vacchiano, G.; Jan, W.; Ascoli, D. Forest Disturbances under Climate Change. Nat. Clim. Chang. 2017, 7, 395. [Google Scholar] [CrossRef] [PubMed]
  49. Early, R.; Bradley, B.A.; Dukes, J.S.; Lawler, J.J.; Olden, J.D.; Blumenthal, D.M.; Gonzalez, P.; Grosholz, E.D.; Ibañez, I.; Miller, L.P.; et al. Global Threats from Invasive Alien Species in the Twenty-First Century and National Response Capacities. Nat. Commun. 2016, 7, 12485. [Google Scholar] [CrossRef]
  50. Meteorological Statistical Yearbook, 2003–2017; China Meteorological Press. Available online: http://navi.cnki.net/KNavi/YearbookDetail?pcode=CYFD&pykm=YZGQX&bh= (accessed on 6 September 2018). (In Chinese).
  51. Chen, Q. Advanced Econometrics and Stata Applications 2; Adv Educ Publishing House: Beijing, China, 2014. (In Chinese) [Google Scholar]
  52. Buckley, S.; Drinkall, N.J.; Thoms, E.M. Review of Research on the Control of Pine Wood Nematode (Bursaphelenchus xylophilus) using the Fumigant Sulfuryl Fluoride and Current Status for Inclusion in ISPM No.15. Julius-Kühn-Archiv 2010, 15, 848–853. [Google Scholar] [CrossRef]
  53. Mamiya, Y. Pathology of the Pine Wilt Disease Caused by Bursaphelenchus xylophilus. Annu. Rev. Phytopathol. 1983, 21, 201–220. [Google Scholar] [CrossRef]
  54. SFPCA. The Calendar of Forest Pest Control; China Forestry Publishing House: Beijing, China, 2010. [Google Scholar]
  55. Han, Y.; Wang, Y.; Xiang, Y.; Jianren, Y.E. Prediction of Potential Distribution of Bursaphelenchus xylophilus in China Based on Maxent Ecological Niche Model. J. Nanjing For. Univ. 2015, 39, 6–10. (In Chinese) [Google Scholar]
  56. SFA. Notice of the State Forest Administration (No.4 of 2017): Notice of Bursaphelenchus xylophilus Outbreak Regions. Available online: http://www.forestry.gov.cn/main/3600/content-941990.html (accessed on 20 January 2017). (In Chinese)
  57. SFPCA. Bursaphelenchus xylophilus. Available online: http://www.forestpest.org/quarantine/pest/40289447520b927501520b96613d0357.html (accessed on 22 May 2015). (In Chinese).
  58. Jindal, R.M.; Patel, T.G.; Waller, S.G. Public-Private Partnership Model to Provide Humanitarian Services in Developing Countries. J. Am. Coll. Surg. 2017, 224, 988–993. [Google Scholar] [CrossRef] [PubMed]
  59. Zhang, K.; Dearing, J.A.; Dawson, T.P.; Dong, X.; Yang, X.; Zhang, W. Poverty Alleviation Strategies in Eastern China Lead to Critical Ecological Dynamics. Sci. Total Environ. 2015, 506–507, 164–181. [Google Scholar] [CrossRef] [PubMed]
  60. Li, W.; Liu, Y.J.; Yang, Z. Preliminary Strategic Environmental Assessment of the Great Western Development Strategy: Safeguarding Ecological Security for a New Western China. Environ. Manag. 2012, 49, 483–501. [Google Scholar] [CrossRef] [PubMed]
  61. Seele, P.; Helbing, D. Boost sustainability through social justice in China’s Belt and Road Initiative. Nature 2018, 555, 311. [Google Scholar] [CrossRef] [PubMed]
  62. Tao-Zhong, T.L.; Yang, H. Discussion on the Essence of Tripartite Rural Land Entitlement System of Farmland Property Rights: Seeking the Appropriate Expression of Policy on Law. China Land Sci. 2017, 31, 64–72. (In Chinese) [Google Scholar]
  63. Qin, T.; Gu, X.; Tian, Z.; Pan, H.; Deng, J.; Wan, L. An empirical analysis of the factors influencing farmer demand for forest insurance: Based on surveys from Lin’an County in Zhejiang Province of China. J. For. Econ. 2016, 24, 37–51. [Google Scholar] [CrossRef]
  64. Shang, W.; Gong, Y.; Wang, Z.; Stewardson, M.J. Eco-compensation in China: Theory, practices and suggestions for the future. J. Environ. Manag. 2018, 210, 162–170. [Google Scholar] [CrossRef] [PubMed]
  65. Pimentel, D.; Zuniga, R.; Morrison, D. Update on the environmental and economic costs associated with alien-invasive species in the United States. Ecol. Econ. 2005, 52, 273–288. [Google Scholar] [CrossRef]
Figure 1. Forest pest area.
Sustainability 11 00073 g001
Figure 2. Forest pest-outbreak rate.
Sustainability 11 00073 g002
Figure 3. Economic loss.
Sustainability 11 00073 g003
Figure 4. Ecological loss.
Sustainability 11 00073 g004
Figure 5. Total loss.
Sustainability 11 00073 g005
Figure 6. Forest pest-control rate.
Sustainability 11 00073 g006
Figure 7. Airplane control area.
Sustainability 11 00073 g007
Figure 8. Input funds per forest pest area.
Sustainability 11 00073 g008
Figure 9. Bursaphelenchus xylophilus expansion pattern from 1998 to 2015 (Unit: county). This source has already been published by State Forestry Administration of China (SFA)and SFPCA [56,57].
Sustainability 11 00073 g009
Table 1. Factors affecting forest pest-control effect.
Ln (Pest Area) Ln (Control Area) Ln (Funds)
Coef.Z ValueCoef.Z ValueCoef.Z Value
ln(Control Area)0.72 ***19.07ln(Funds)−0.19 ***−3.07ln(GDP)0.71 ***18.28
ln(Artificial Forest)0.24 ***8.3ln(workers)0.36 ***3.98
ln(Temperature)−0.01−0.17ln(stations)−0.00−0.00ln(Forest Income)0.14 ***4.89
ln(Pressure)−0.3 ***−2.69
ln(Sunshine Hours)−0.06−0.66ln(Rural Population)0.62 ***11.97ln(Rural Consumption)0.1 *1.85
ln(Rainfall)−0.14 **−2.36
ln(Relative Witness)−0.45 **−2.18cons7.77 ***10.22cons1.88 ***4.08
cons5.78 ***3.45
R2 = 0.898p = 0.00 R2 = 0.513p = 0.00 R2 = 0.735p = 0.00
Endogenous variables: Pest Area, Control Area and Funds. Exogenous variables: Artificial Forest, Temperature, Pressure, Sunshine Hours, Rainfall, Relative Witness, workers, stations, Rural Population, GDP, Forest Income and Rural Consumption; * All values of the variables were logged to represent elasticity, and the results were expressed as percentage. *, ** and *** indicate significant at 10%, 5%, and 1% level, respectively.

