Evaluation of the Supply-Side Efficiency of China’s Real Estate Market: A Data Envelopment Analysis


Abstract
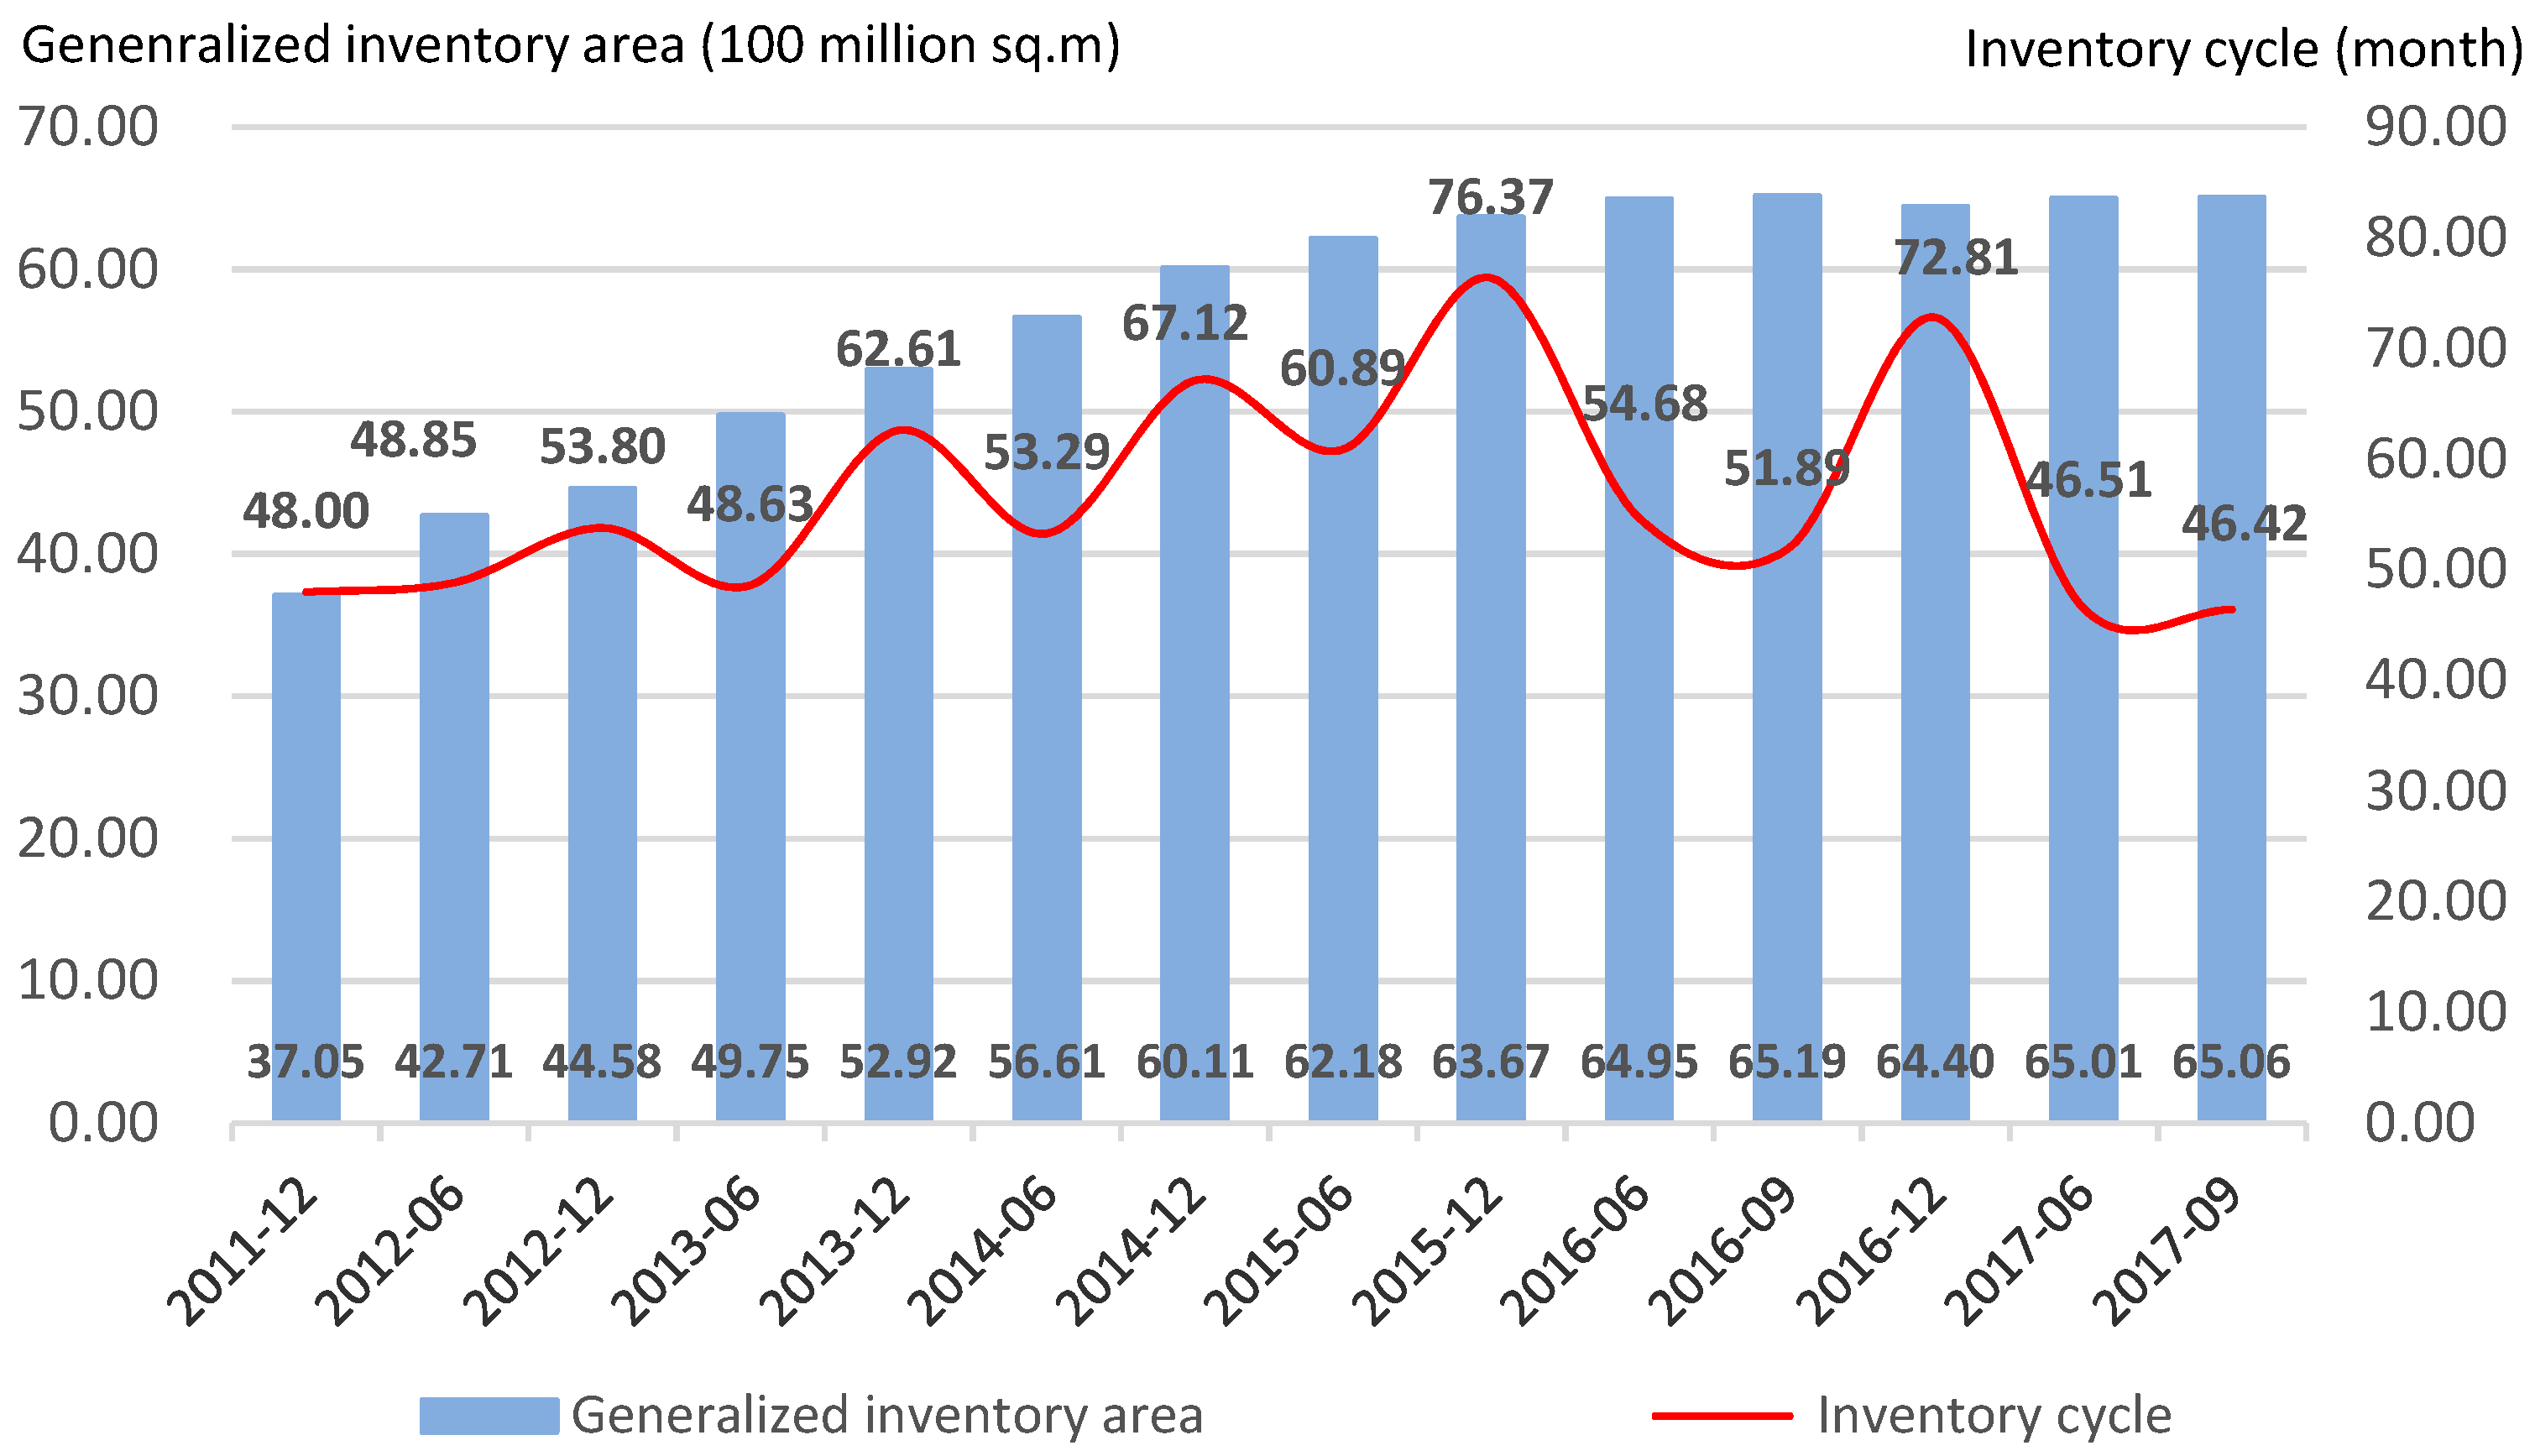
1. Introduction
2. Literature Review
3. Methodology
3.1. The CCR Model
- (1)
- The DMU is DEA-inefficient when ;
- (2)
- The DMU is DEA-efficient when and ;
- (3)
- The DMU is weakly DEA-inefficient when and .
3.2. The BCC Model
4. Empirical Analysis
4.1. Input and Output Variable Selection
4.2. Data Resources
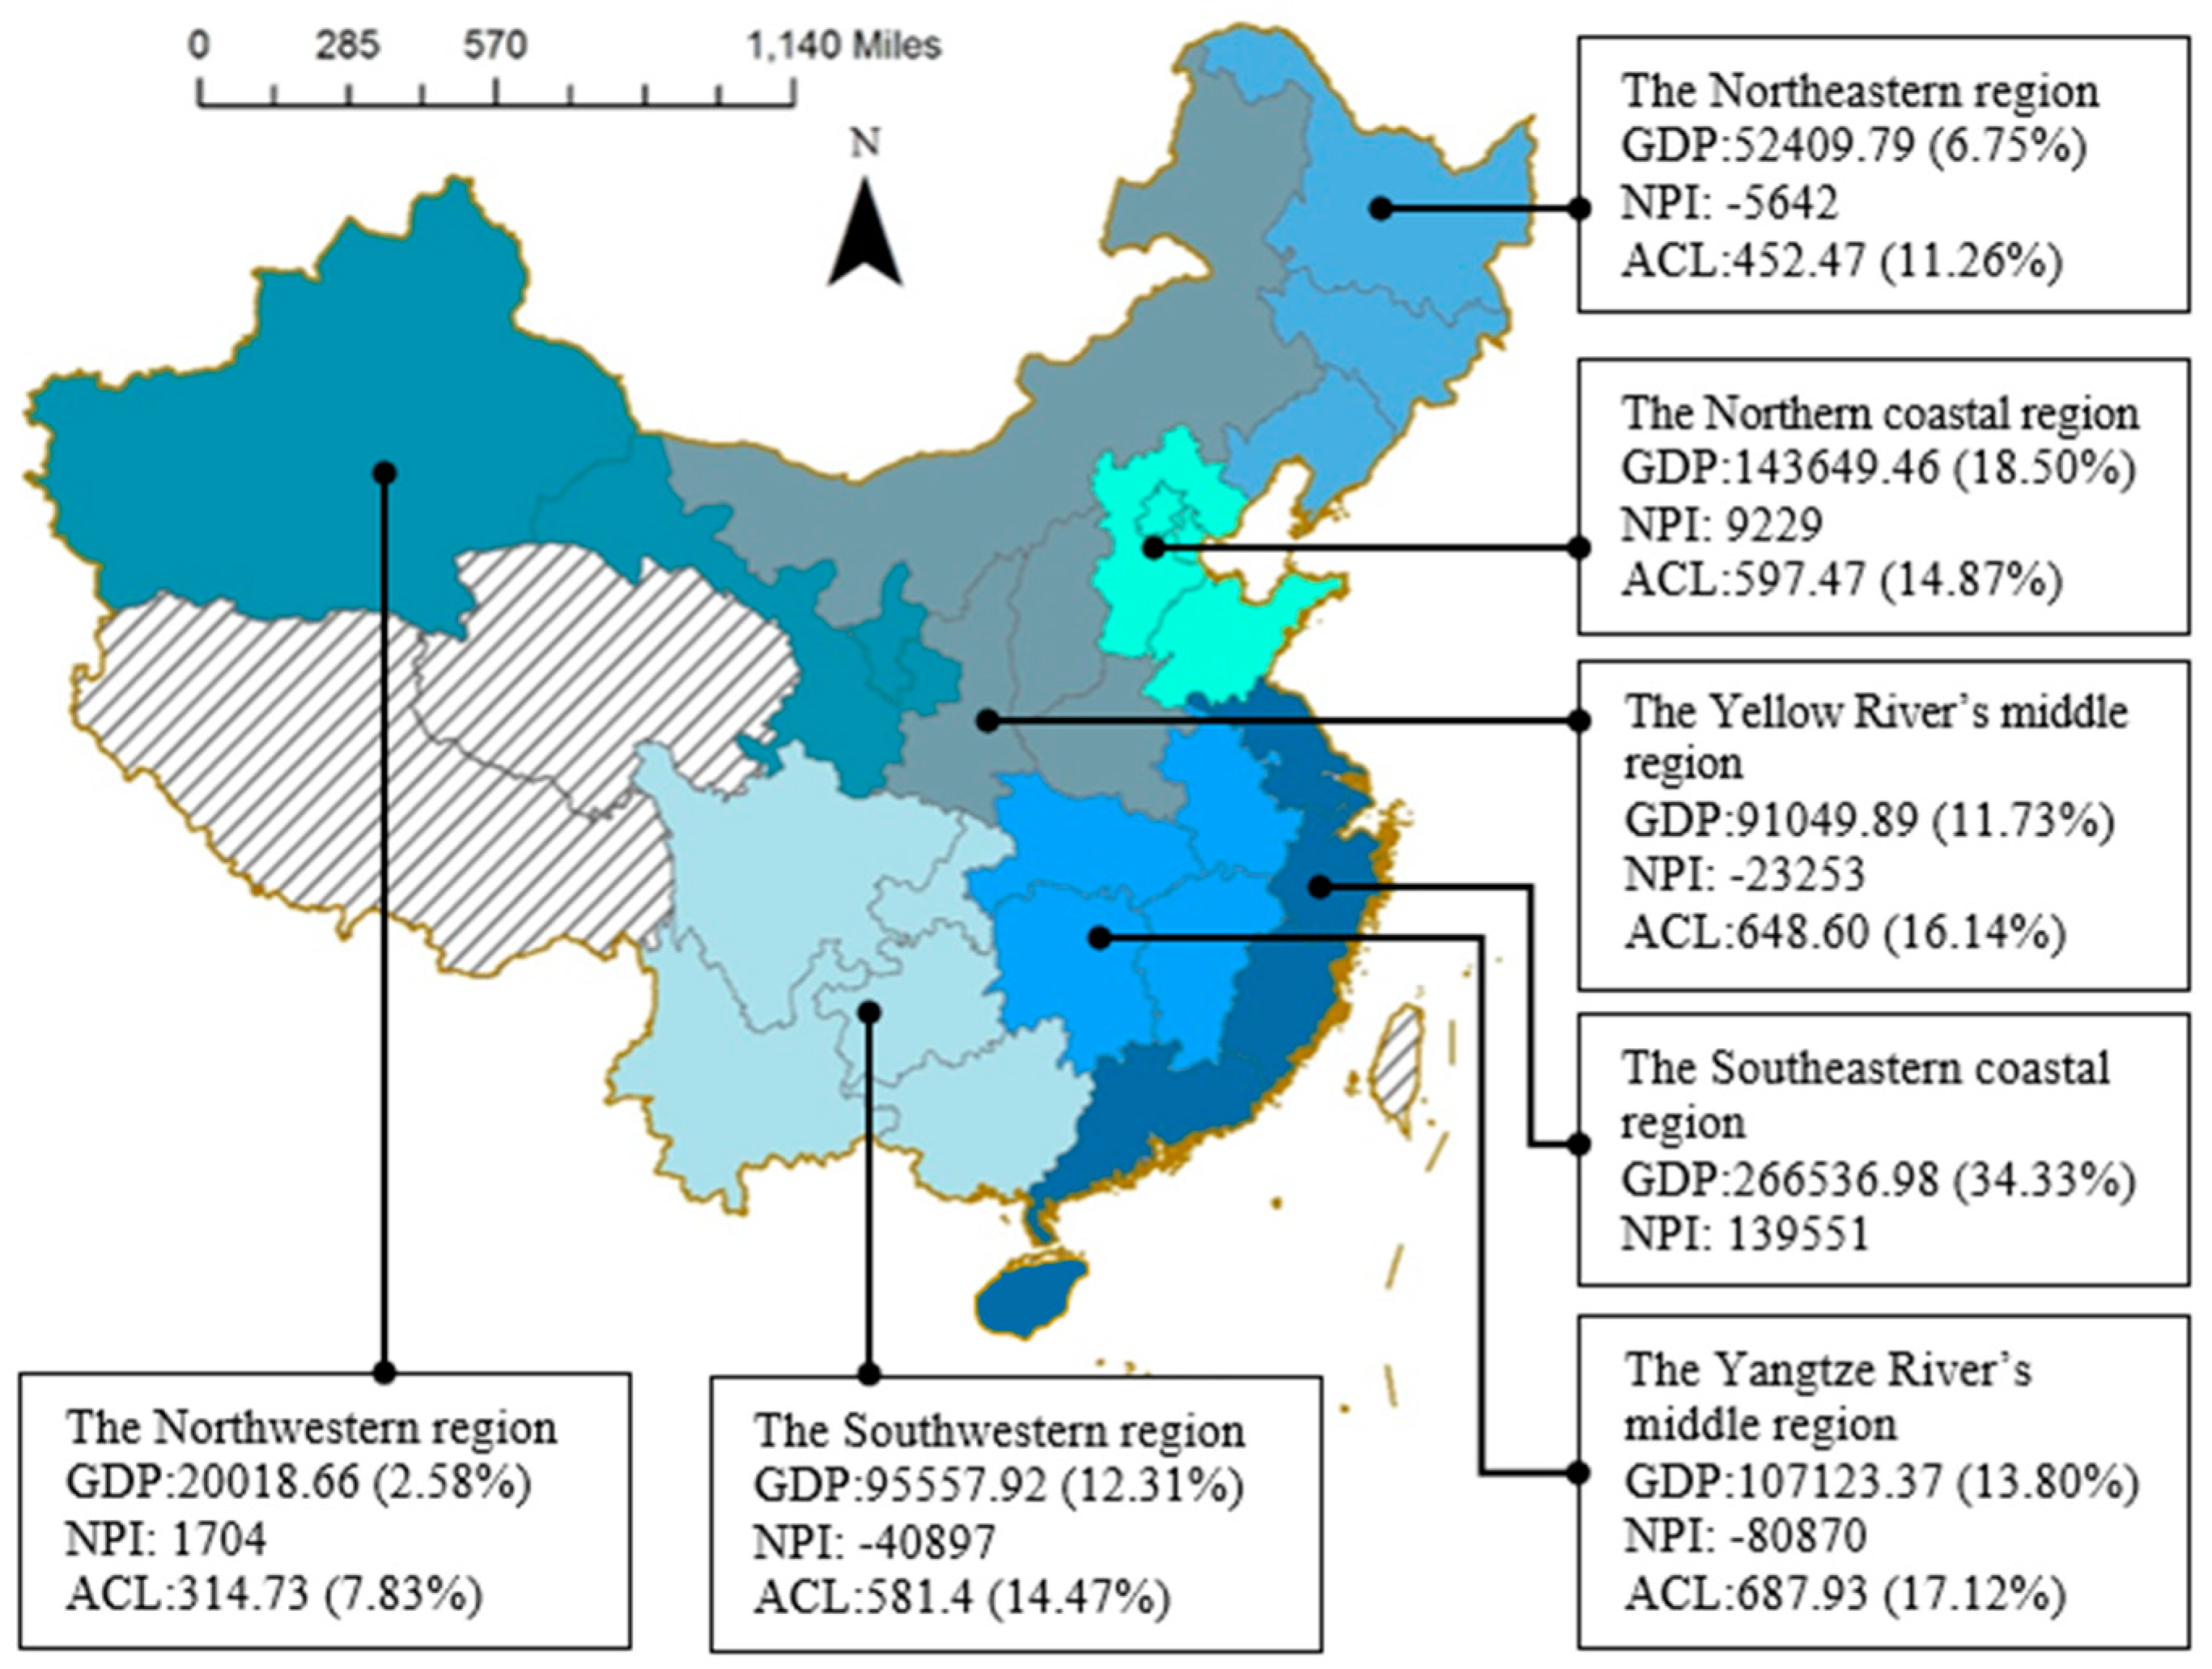
4.3. Division of Research Areas
5. Results and Discussion
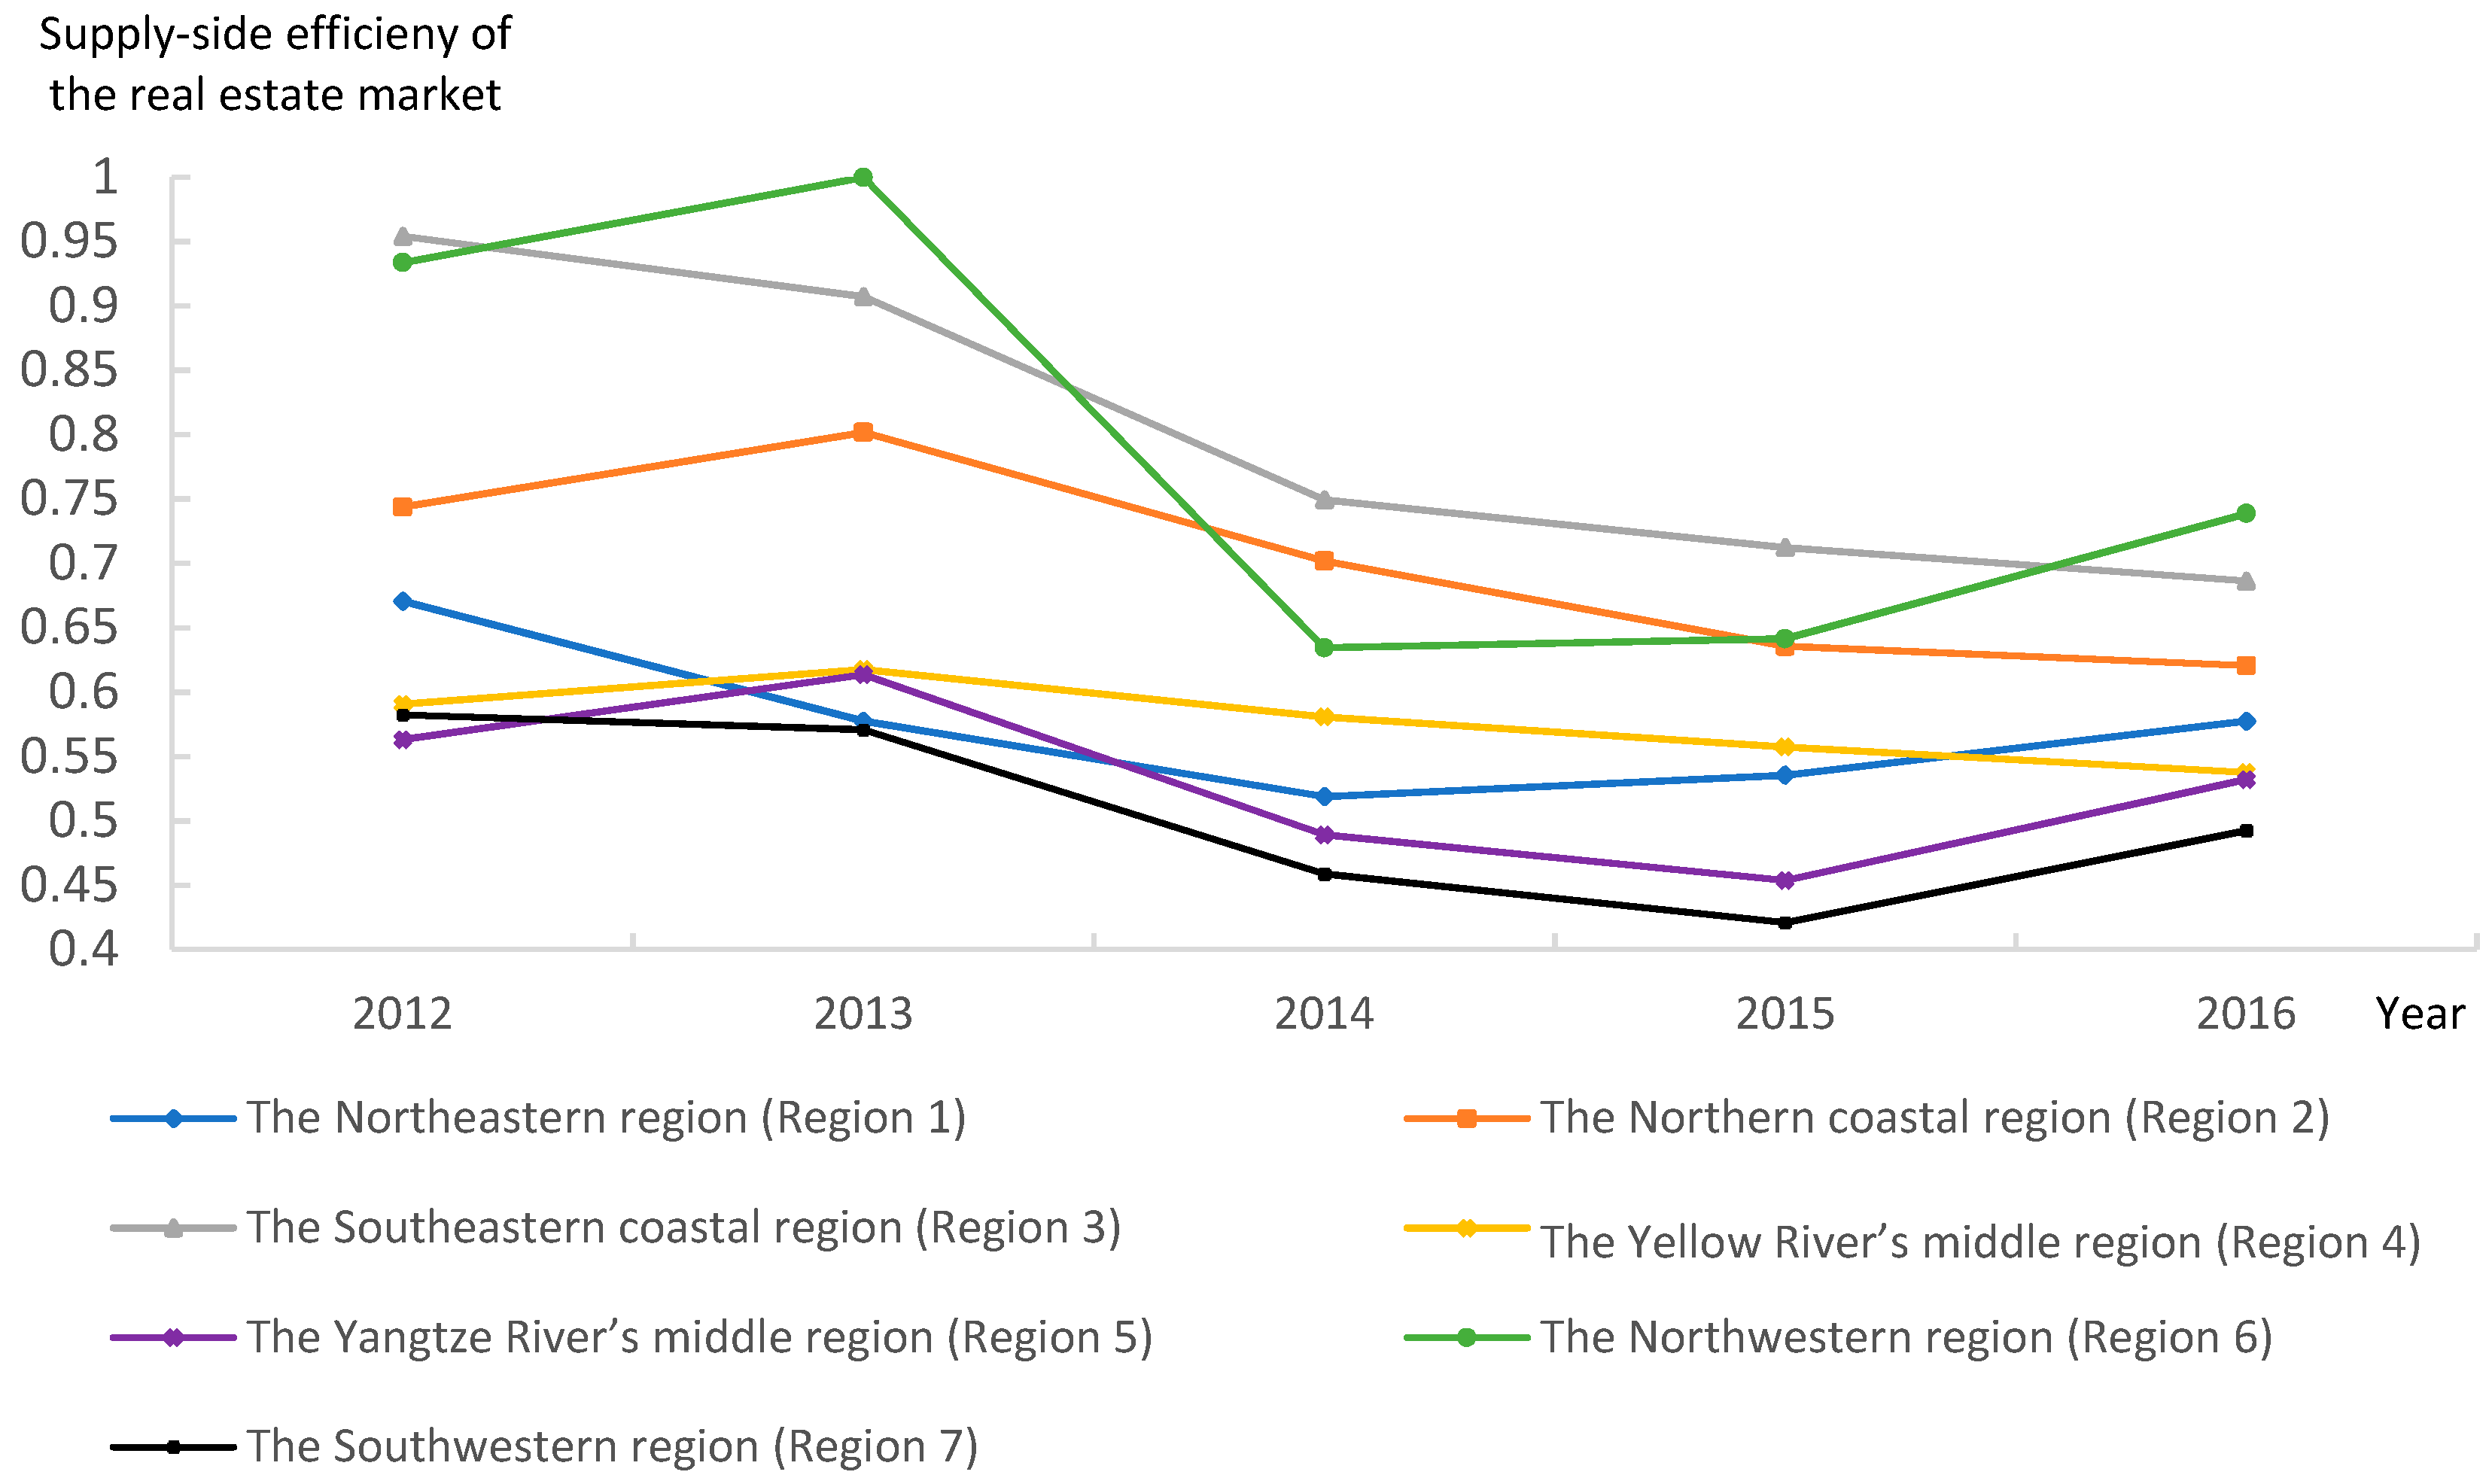
5.1. Comparison and Trend Analysis
5.2. Input Redundancy and Output Deficiency Analysis
5.3. Scale Benefit Analysis
6. Conclusions and Policy Recommendations
Author Contributions
Funding
Conflicts of Interest
References
- Wang, C.; Le, A. Measuring the Macroeconomic Performance among Developed Countries and Asian Developing Countries: Past, Present, and Future. Sustainability 2018, 10, 3664. [Google Scholar] [CrossRef]
- Liu, Q. Xi Jinping Held the Eleventh Meeting of Leading Group for Financial and Economic Affairs. Available online: http://www.xinhuanet.com//politics/2015-11/10/c_1117099915.htm (accessed on 5 November 2018).
- Chinloy, P.; Wu, Z. The Inventory-Sales Ratio and Homebuilder Return Predictability. J. Real Estate Financ. Econ. 2013, 46, 397–423. [Google Scholar] [CrossRef]
- Mittal, J.; Kashyap, A. Real estate market led land development strategies for regional economic corridors—A tale of two mega projects. Habitat Int. 2015, 47, 205–217. [Google Scholar] [CrossRef]
- Shen, X.; Huang, X.; Li, H.; Li, Y.; Zhao, X. Exploring the relationship between urban land supply and housing stock: Evidence from 35 cities in China. Habitat Int. 2018, 77, 80–89. [Google Scholar] [CrossRef]
- Chu, S. Macroeconomic policies and housing market in Taiwan. Int. Rev. Econ. Financ. 2018, 58, 404–421. [Google Scholar] [CrossRef]
- Lee, C.L.; Stevenson, S.; Lee, M. Futures Trading, Spot Price Volatility and Market Efficiency: Evidence from European Real Estate Securities Futures. J. Real Estate Financ. Econ. 2014, 48, 299–322. [Google Scholar] [CrossRef]
- Kopczuk, W.; Munroe, D. Mansion Tax: The Effect of Transfer Taxes on the Residential Real Estate Market. Am. Econ. J. Econ. Policy 2015, 7, 214–257. [Google Scholar] [CrossRef]
- Yeh, Q.J. The application of data envelopment analysis in conjunction with financial ratios for bank performance evaluation. J. Oper. Res. Soc. 1996, 47, 980–988. [Google Scholar] [CrossRef]
- Farrell, M.J. The Measurement of Productive Efficiency. J. R. Stat. Soc. Ser. A 1957, 120, 253–290. [Google Scholar] [CrossRef]
- Kumbhakar, S.C.; Lien, G.; Hardaker, J.B. Technical efficiency in competing panel data models: A study of Norwegian grain farming. J. Product. Anal. 2014, 41, 321–337. [Google Scholar] [CrossRef]
- Leone, V.; Ravishankar, G. Frontiers of commercial real estate portfolio performance: Are sector-region-efficient diversification strategies a myth or reality? J. Prop. Res. 2018, 35, 95–116. [Google Scholar] [CrossRef]
- Charnes, A.; Cooper, W.W.; Rhodes, E. Measuring efficiency of decision-making units. Eur. J. Oper. Res. 1978, 2, 429–444. [Google Scholar] [CrossRef]
- Wang, W.K. A knowledge-based decision support system for measuring the performance of government real estate investment. Expert Syst. Appl. 2005, 29, 901–912. [Google Scholar] [CrossRef]
- Wei, F.; Li, Y.; Gao, R.; Sun, J. Study on the Evaluation Model of the Investment Efficiency of Real Estate Industry Based on Super Efficiency DEA; Springer: Berlin/Heidelberg, Germany, 2011; pp. 111–118. [Google Scholar]
- Ahmed, A.A.; Mohamad, A. Data envelopment analysis of efficiency of real estate investment trusts in Singapore. Int. J. Law Manag. 2017, 59, 826–838. [Google Scholar] [CrossRef]
- Charnes, A.; Cooper, W.; Lewin, A.Y.; Seiford, L.M. Data Envelopment Analysis Theory, Methodology and Applications. J. Oper. Res. Soc. 1997, 48, 332–333. [Google Scholar] [CrossRef]
- Cook, W.D.; Tone, K.; Zhu, J. Data envelopment analysis: Prior to choosing a model. Omega-Int. J. Manag. Sci. 2014, 44, 1–4. [Google Scholar] [CrossRef]
- Charnes, A.; Cooper, W.W.; Mellon, B. Blending aviation gasolines—A study in programming interdependent activities in an integrated oil company. Econometrica 1952, 20, 135–159. [Google Scholar] [CrossRef]
- Coelli, T.J.; Rao, D.S.P.; Donnell, C.J.; Battese, G.E. An Introduction to Efficiency and Productivity Analysis; Springer: New York, NY, USA, 2005. [Google Scholar]
- Chancellor, W.; Lu, W. A Regional and Provincial Productivity Analysis of the Chinese Construction Industry: 1995 to 2012. J. Constr. Eng. Manag. 2016, 142, 05016013. [Google Scholar] [CrossRef]
- Li, Y.; Liu, C. Labour productivity measurement with variable returns to scale in Australia’s construction industry. Archit. Sci. Rev. 2012, 55, 110–118. [Google Scholar] [CrossRef]
- Xue, X.; Shen, Q.; Wang, Y.; Lu, J. Measuring the productivity of the construction industry in China by using DEA-based Malmquist productivity indices. J. Constr. Eng. Manag. ASCE 2008, 134, 64–71. [Google Scholar] [CrossRef]
- Kourtit, K.; Suzuki, S.; Nijkamp, P. Tracing high-sustainability performers among world cities—Design and application of a multi-temporal data envelopment analysis. Habitat Int. 2017, 68, 43–54. [Google Scholar] [CrossRef]
- Lu, X.; Kuang, B.; Li, J. Regional difference decomposition and policy implications of China’s urban land use efficiency under the environmental restriction. Habitat Int. 2018, 77, 32–39. [Google Scholar] [CrossRef]
- Zhang, Y.; Hongchun, G.U. China’s Inter-provincial Energy Efficiency of Construction Industry in 2005–2010: An Empirical Study Based on DEA Model. Constr. Econ. 2013, 4, 13–21. [Google Scholar]
- Sueyoshi, T.; Goto, M. DEA-DA for bankruptcy-based performance assessment: Misclassification analysis of Japanese construction industry. Eur. J. Oper. Res. 2009, 199, 576–594. [Google Scholar] [CrossRef]
- Hu, X.; Liu, C. Managing undesirable outputs in the Australian construction industry using Data Envelopment Analysis models. J. Clean. Prod. 2015, 101, 148–157. [Google Scholar] [CrossRef]
- Kapelko, M.; Horta, I.M.; Camanho, A.S.; Lansink, A.O. Measurement of input-specific productivity growth with an application to the construction industry in Spain and Portugal. Int. J. Prod. Econ. 2015, 166, 64–71. [Google Scholar] [CrossRef]
- San-Jose, L.; Retolaza, J.; Lamarque, E. The Social Efficiency for Sustainability: European Cooperative Banking Analysis. Sustainability 2018, 10, 3271. [Google Scholar] [CrossRef]
- Tsolas, I.E. Modelling profitability and effectiveness of Greek-listed construction firms: An integrated DEA and ratio analysis. Constr. Manag. Econ. 2011, 29, 795–807. [Google Scholar] [CrossRef]
- Dan, T.; Wang, G.; Cao, D. Growth Characteristics and Impacting Factors of the Total Factor Productivity in the Construction Industry. J. Tongji Univ. 2015, 43, 1901–1907. [Google Scholar]
- Li, H.; Li, X.; Soh, C.K. An integrated strategy for sustainable development of the urban underground: From strategic, economic and societal aspects. Tunn. Undergr. Space Technol. 2016, 55, 67–82. [Google Scholar] [CrossRef]
- Yang, G.; Fukuyama, H.; Chen, K. Investigating the regional sustainable performance of the Chinese real estate industry: A slack-based DEA approach. Omega 2018. [Google Scholar] [CrossRef]
- Liu, F.F.; Chen, C. The worst-practice DEA model with slack-based measurement. Comput. Ind. Eng. 2009, 57, 496–505. [Google Scholar] [CrossRef]
- Chen, Y.; Chen, Z.; Xu, G.; Tian, Z. Built-up land efficiency in urban China: Insights from the General Land Use Plan (2006–2020). Habitat Int. 2016, 51, 31–38. [Google Scholar] [CrossRef]
- Zhu, H. How to shorten the project development cycle. China Real Estate 2015, 23, 39–43. [Google Scholar]
- Chang, R.; Soebarto, V.; Zhao, Z.; Zillante, G. Facilitating the transition to sustainable construction: China’s policies. J. Clean. Prod. 2016, 131, 534–544. [Google Scholar] [CrossRef]
- Li, Z.; Tang, D.; Han, M.; Bethel, B. Comprehensive Evaluation of Regional Sustainable Development Based on Data Envelopment Analysis. Sustainability 2018, 10, 3897. [Google Scholar] [CrossRef]
- Zhang, B.; Lu, D.; He, Y.; Chiu, Y. The efficiencies of resource-saving and environment: A case study based on Chinese cities. Energy 2018, 150, 493–507. [Google Scholar] [CrossRef]
- Ma, M.; Shen, L.; Ren, H.; Cai, W.; Ma, Z. How to Measure Carbon Emission Reduction in China’s Public Building Sector: Retrospective Decomposition Analysis Based on STIRPAT Model in 2000–2015. Sustainability 2017, 9, 1744. [Google Scholar] [CrossRef]
- Wang, J.; Shu, D. Research on the Differences of Economic Fluctuation of China’s Eastern, Central and Western Regions. Res. Econ. Manag. 2012, 9, 5–11. [Google Scholar]
- Liu, F. Thoughts on the Regional Division of the 11th Five-Year Plan. Surv. Res. Rep. 2005, 65, 1–15. [Google Scholar]
- Liu, H.; Jiang, P. Price elasticity of land supply and related impact factors in China. J. Tsinghua Univ. 2015, 55, 56–62. [Google Scholar]
- Wei, Y.; Lam, P.T.; Chiang, Y.; Leung, B.Y.; Seabrooke, W. An Exploratory Analysis of Impediments to China’s Credit Control on the Real Estate Industry: An institutional perspective. J. Contemp. China 2014, 23, 44–67. [Google Scholar] [CrossRef]
- Su, C.W.; Yin, X.C.; Tao, R.; Zhou, H. Are housing prices improving GDP or vice versa? A cross-regional study of China. Appl. Econ. 2018, 50, 1–14. [Google Scholar]
- Du, J.; Peiser, R.B. Land supply, pricing and local governments’ land hoarding in China. Reg. Sci. Urban Econ. 2014, 48, 180–189. [Google Scholar] [CrossRef]
- Adelaja, A.O.; Hailu, Y.G.; Tekle, A.T.; Seedang, S. Evidence of land hoarding behavior in US agriculture. Agric. Financ. Rev. 2010, 70, 377–398. [Google Scholar] [CrossRef]
- Cai, H.; Wang, Z.; Zhang, Q. To build above the limit? Implementation of land use regulations in urban China. J. Urban Econ. 2017, 98, 223–233. [Google Scholar] [CrossRef]
- Wang, Y.; Li, X.; Li, W.; Tan, M. Land titling program and farmland rental market participation in China: Evidence from pilot provinces. Land Use Policy 2018, 74, 281–290. [Google Scholar] [CrossRef]
- Keqiang, W.; Kexing, M.; Hongmei, L. Study on the operating mechanism of construction land reduction in Shanghai City. China Land Sci. 2016, 30, 3–12. [Google Scholar]
- Ma, M.; Cai, W. Do commercial building sector-derived carbon emissions decouple from the economic growth in Tertiary Industry? A case study of four municipalities in China. Sci. Total Environ. 2019, 650, 822–834. [Google Scholar] [CrossRef]
- Cheung, D.M.W.; Tang, B.S. Recreation space or urban land reserve? Land-use zoning patterns and the transformation of open space in Hong Kong. J. Urban Plan. Dev. 2016. [Google Scholar] [CrossRef]
- Johansson, T.; Segerstedt, E.; Olofsson, T.; Jakobsson, M. Revealing social values by 3D city visualization in city transformations. Sustainability 2016, 8, 195. [Google Scholar] [CrossRef]
- Ho, S.; Rajabifard, A. Towards 3D-enabled urban land administration: Strategic lessons from the BIM initiative in Singapore. Land Use Policy 2016, 57, 1–10. [Google Scholar] [CrossRef]
- Wang, Z.; Lunian, Q.I. Study on the Land Use Function to Update Ideas under the Guidance of Flexible Land Uses: A Case Study of Suzhou Industrial Park. Mod. Urban Res. 2017, 2, 114–119. [Google Scholar]
- Long, H.; Wu, X.; Wang, W.; Dong, G. Analysis of urban-rural land-use change during 1995-2006 and its policy dimensional driving forces in Chongqing, China. Sensors 2008, 8, 681–699. [Google Scholar] [CrossRef] [PubMed]
- Broitman, D.; Koomen, E. Residential density change: Densification and urban expansion. Comput. Environ. Urban Syst. 2015, 54, 32–46. [Google Scholar] [CrossRef]
- Silva, E. Afterword: From Sustainable Development to Environmental Governance. In Environmental Governance in Latin America; Palgrave Macmillan: London, UK, 2016; pp. 326–335. [Google Scholar]
- Ma, M.; Cai, W.; Wu, Y. China Act on the Energy Efficiency of Civil Buildings (2008): A decade review. Sci. Total Environ. 2019, 651, 42–60. [Google Scholar] [CrossRef] [PubMed]
- Vahaaho, I. An introduction to the development for urban underground space in Helsinki. Tunn. Undergr. Space Technol. 2016, 55, 324–328. [Google Scholar] [CrossRef]
- Ma, M.; Cai, W.; Cai, W. Carbon abatement in China’s commercial building sector: A bottom-up measurement model based on Kaya-LMDI methods. Energy 2018, 165, 350–368. [Google Scholar] [CrossRef]
- Jana, A.; Sarkar, S. Disparate housing strategies and practices of public and private enterprises in India: Analysis of middle class housing and new towns. Cities 2018, 72, 339–347. [Google Scholar] [CrossRef]
- Lin, Y.; Ma, Z.; Zhao, K.; Hu, W.; Wei, J. The Impact of Population Migration on Urban Housing Prices: Evidence from China’s Major Cities. Sustainability 2018, 10, 3169. [Google Scholar] [CrossRef]
- Caerteling, J.S.; Halman, J.I.M.; Doree, A.G. Technology commercialization in road infrastructure: How government affects the variation and appropriability of technology. J. Prod. Innov. Manag. 2008, 25, 143–161. [Google Scholar] [CrossRef]
- Cao, J.; Chan, J.; Li, H.; Mahdjoubi, L.; Love, P. REALMEDIA: Providing multimedia-based real-estate services through the Internet. Autom. Constr. 2001, 10, 275–289. [Google Scholar] [CrossRef]


| Type | Attribute | Variable |
|---|---|---|
| Input | Labor | Number of enterprises; number of employed persons |
| Input | Land | Land space pending development of enterprises; floor space of buildings started this year; floor space of buildings under construction; land space purchased this year of enterprises |
| Input | Capital | Investment completed this year of enterprises; total value of land purchased of enterprises |
| Input | Technology | Expenditure on research and development (R&D) of enterprises; net worth of owned equipment and machinery |
| Output | Economy | Floor space of commercial buildings sold; total sale of commercial buildings sold of enterprises; revenue from the principal business of enterprises; operating profits of enterprises |
| Output | Society | The added value of the real estate industry; related taxes on real estate; per capita floor space of urban residents |
| Type | Variable | Definition | Unit |
|---|---|---|---|
| Input | Average number of persons engaged in the real estate industry (NPRE) | The average number of employees in a real estate-related enterprise in a certain year, which is calculated from monthly data. | persons |
| Input | Land space pending the development of real estate enterprises (LPRE) | The sum of the land area belonging to the enterprise which owns the obtained land use rights in various ways in the current year and various land resources acquired but not developed in previous years. | 10,000 m2 |
| Input | Investment completed of real estate enterprises (ICRE) | Total investment in land purchase, housing construction, etc. for real estate enterprises in each year. | 100 million yuan |
| Input | The net worth of owned equipment and machinery (NWEM) | The actual value of the company’s construction machinery and equipment after use and wear, which is calculated by subtracting the net value after depreciation from the original value. | 100 million yuan |
| Output | Revenue from the principal business of enterprises (RPBE) | The income of the main business, such as sales of goods and provision of labor services. | 100 million yuan |
| Output | The added value of the real estate industry (AVRE) | All the valuable achievements of all real estate-related enterprises in a country during a certain period, which are calculated by the market price. | 100 million yuan |
| Year | Statistics | NPRE | LPRE | ICRE | NWEM | RPBE | AVRE |
|---|---|---|---|---|---|---|---|
| 2012 | Mean | 71,786.79 | 2503.12 | 1660.08 | 13,604.73 | 1755.68 | 850.03 |
| Standard deviation | 44,162.24 | 1668.89 | 1118.47 | 11,170.50 | 1393.17 | 840.13 | |
| Maximum | 189,590.00 | 6579.70 | 4299.38 | 50,720.36 | 5854.69 | 3643.87 | |
| Minimum | 10,883.00 | 408.10 | 254.37 | 337.56 | 277.61 | 87.51 | |
| 2013 | Mean | 77,488.90 | 2605.99 | 2125.76 | 15,872.26 | 2434.08 | 999.58 |
| Standard deviation | 43,437.19 | 1764.17 | 1414.85 | 13,264.77 | 2109.86 | 953.46 | |
| Maximum | 201,153.00 | 7080.44 | 5567.94 | 63,085.69 | 9510.96 | 4207.46 | |
| Minimum | 14,844.00 | 424.18 | 336.23 | 314.72 | 352.69 | 104.05 | |
| 2014 | Mean | 81,971.31 | 2608.61 | 2469.22 | 19,599.92 | 2285.79 | 1056.91 |
| Standard deviation | 44,390.02 | 1905.41 | 1606.06 | 28,224.05 | 1894.25 | 1008.90 | |
| Maximum | 196,656.00 | 7575.81 | 6206.10 | 155,294.94 | 7540.12 | 4486.92 | |
| Minimum | 15,944.00 | 505.83 | 429.15 | 344.66 | 344.09 | 114.28 | |
| 2015 | Mean | 88,994.10 | 2718.63 | 2957.11 | 20,937.86 | 2415.13 | 1141.62 |
| Standard deviation | 49,357.93 | 2061.15 | 1896.06 | 23,450.53 | 2097.97 | 1113.81 | |
| Maximum | 211,205.00 | 9095.07 | 7241.45 | 112,311.07 | 8238.36 | 5117.95 | |
| Minimum | 17,444.00 | 750.97 | 558.97 | 311.81 | 291.87 | 97.05 | |
| 2016 | Mean | 94,734.69 | 2598.59 | 3264.63 | 19,474.59 | 3096.98 | 1309.73 |
| Standard deviation | 52,134.80 | 2065.25 | 2115.44 | 16,668.65 | 2865.79 | 1318.84 | |
| Maximum | 224,619.00 | 9326.77 | 8240.22 | 74,648.84 | 11,204.32 | 6229.50 | |
| Minimum | 18,831.00 | 733.37 | 654.80 | 410.95 | 368.59 | 102.57 |
| NPRE | LPRE | ICRE | NWEM | |
|---|---|---|---|---|
| RPBE | 0.801 *** (0.000) | 0.742 *** (0.000) | 0.884 *** (0.000) | 0.781 *** (0.000) |
| AVRE | 0.840 *** (0.000) | 0.731 *** (0.000) | 0.847 *** (0.000) | 0.725 *** (0.000) |
| Region | Characteristic | Included Provinces |
|---|---|---|
| The northeastern region (Region 1) | This region is an old industrial area in China, which has a low level of development in the service industry and the high-tech industry. The population is in a state of continuous outflow. | Liaoning, Jilin, and Heilongjiang |
| The northern coastal region (Region 2) | The provinces in this region are close to China’s capital, with a dense population, convenient transportation, and developed science, education, and culture. | Beijing, Tianjin, Hebei, and Shandong |
| The southeastern coastal region (Region 3) | This region achieved modernization early and has close economic relations with other countries. It has obvious development advantages with the largest GDP and population inflows among all regions. | Shanghai, Jiangsu, Zhejiang, Fujian, Guangdong, and Hainan. |
| The Yellow River’s middle region (Region 4) | The development level of this region is at the medium stage. It is located inland with little openness to the outside world, and its task of industrial restructuring is arduous. | Inner Mongolia, Shaanxi, Shanxi, and Henan |
| The Yangtze River’s middle region (Region 5) | With excellent agricultural production conditions, a dense population, and a low degree of openness, this region has the largest net outflow of population in China. | Hubei, Hunan, Jiangxi, and Anhui |
| The northwestern region (Region 6) | As one of the major inhabited areas of ethnic minorities in China, this region has both the lowest level of economic development and construction land area among all regions. | Xinjiang, Gansu, and Ningxia |
| The southwestern region (Region 7) | Although this region has the largest number of impoverished people in China, after the successful implementation of the develop-the-west strategy, its GDP was at the forefront in the research areas, so its development potential is relatively high. | Sichuan, Chongqing, Guizhou, Yunnan, and Guangxi |
| Date | Policies and Regulations | Content Related to Land Supply-Side Reform |
|---|---|---|
| March 2015 | Notice on optimizing the housing and land supply structure in 2015 and promoting the sustainable development of the real estate market | Reduce or stop the supply of residential land in cities and counties where housing supply is significantly high; promote the adjustment of land-use structure |
| April 2015 | Notice on standardizing the evaluation of land-saving evaluation of construction projects | Establish an intensive land evaluation and assessment mechanism to improve the land-use efficiency |
| September 2015 | Opinions on land-use policy for supporting new industries and promoting mass innovation | Use a variety of methods to supply new industrial land |
| November 2015 | Guidance on playing a leading role in new consumption and fostering new power of supply-side | Optimize new construction land structure; change the situation of low land use efficiency |
| Region | Redundancy Value of NPRE (persons) | Redundancy Value of LPRE (10,000 m2) | Redundancy Value of ICRE (100 million yuan) | Redundancy Value of NWEM (100 million yuan) | Redundancy Value of RPBE (100 million yuan) | Redundancy Value of AVRE (100 million yuan) |
|---|---|---|---|---|---|---|
| Region 1 | 71,520.78 (46.56%) | 3714.98 (64.62%) | 3352.74 (43.79%) | 22,860.15 (56.60%) | 1826.45 (42.91%) | 0.00 (0.00%) |
| Region 2 | 222,979.95 (49.08%) | 5424.45 (59.34%) | 3137.56 (20.52%) | 33,378.68 (39.59%) | 4575.86 (29.34%) | 0.00 (0.00%) |
| Region 3 | 163,524.74 (22.51%) | 11,438.19 (47.70%) | 8482.26 (26.22%) | 72,921.13 (38.58%) | 2610.96 (6.44%) | 0.00 (0.00%) |
| Region 4 | 224,298.76 (57.56%) | 3512.37 (58.37%) | 3136.26 (32.75%) | 37,436.22 (53.56%) | 3879.82 (54.50%) | 0.00 (0.00%) |
| Region 5 | 226,897.87 (52.84%) | 9773.48 (72.36%) | 5810.57 (46.38%) | 50,855.86 (53.86%) | 1758.16 (16.15%) | 0.00 (0.00%) |
| Region 6 | 23,630.272 (2.63%) | 1834.66 (55.01%) | 55.06 (2.30%) | 4372.09 (30.40%) | 512.68 (27.39%) | 0.00 (0.00%) |
| Region 7 | 259,990.61 (54.01%) | 9958.86 (73.06%) | 6126.29 (41.16%) | 44,524.70 (61.54%) | 2097.40 (21.97%) | 0.00 (0.00%) |
| Rate | 43.55% | 60.59% | 31.79% | 47.16% | 19.22% | 0.00% |
| Year | Region 1 | Region 2 | Region 3 | Region 4 | Region 5 | Region 6 | Region 7 |
|---|---|---|---|---|---|---|---|
| 2012 | ▲ | ▲ | ▲ | ▲ | ▲ | ▲ | ▲ |
| 2013 | ▲ | ▲ | ▲ | ▲ | ▲ | ○ | ▲ |
| 2014 | ▲ | ▲ | ▽ | ▲ | ▲ | ▲ | ▲ |
| 2015 | ▲ | ▲ | ▽ | ▲ | ▲ | ▲ | ▲ |
| 2016 | ▲ | ▲ | ▽ | ▲ | ▲ | ▲ | ▲ |
© 2019 by the authors. Licensee MDPI, Basel, Switzerland. This article is an open access article distributed under the terms and conditions of the Creative Commons Attribution (CC BY) license (http://creativecommons.org/licenses/by/4.0/).
Share and Cite
Li, K.; Ma, Z.; Zhang, G. Evaluation of the Supply-Side Efficiency of China’s Real Estate Market: A Data Envelopment Analysis. Sustainability 2019, 11, 288. https://doi.org/10.3390/su11010288
Li K, Ma Z, Zhang G. Evaluation of the Supply-Side Efficiency of China’s Real Estate Market: A Data Envelopment Analysis. Sustainability. 2019; 11(1):288. https://doi.org/10.3390/su11010288
Chicago/Turabian StyleLi, Kai, Zhili Ma, and Guozhou Zhang. 2019. "Evaluation of the Supply-Side Efficiency of China’s Real Estate Market: A Data Envelopment Analysis" Sustainability 11, no. 1: 288. https://doi.org/10.3390/su11010288
APA StyleLi, K., Ma, Z., & Zhang, G. (2019). Evaluation of the Supply-Side Efficiency of China’s Real Estate Market: A Data Envelopment Analysis. Sustainability, 11(1), 288. https://doi.org/10.3390/su11010288