1. Introduction
Africa is experiencing rapid urbanization [
1,
2]. While the global urban transition is estimated to have occurred around 2010, this region will continue to host a dramatic shift from rural to urban livelihoods in the coming years [
3]. Megacities and secondary cities across Africa are both expected to grow rapidly (with the latter receiving the lion’s share of growth) [
3]. These rapid changes represent opportunities and challenges, particularly for cities in Sub-Saharan Africa [
4], where the urban transition has been matched by technological, economic, and public health innovations [
5]. Alongside this rapid urbanization, diets in this region (and across the developing world) have also favoured increasing sugar and saturated fat consumption [
6]. Under this nutrition transition, many cities have come to host public health challenges resulting from both under-nutrition and over-consumption [
7]. Popkin et al. [
8] draw attention to the dietary challenges faced by the urban poor as urban food systems are overwhelmed by cheap and easily accessible processed foods. As a result, urban growth, poverty and nutrition have become intertwined causal factors in a damaging prognosis for future generations in Sub-Saharan Africa.
These intertwined hazards have been framed as sustainability challenges in the Sustainable Development Goals (SDGs) adopted by the United Nations on 25 September 2015 [
9]. Among the 17 goals adopted in this resolution, SDG 1 (No Poverty), SDG 2 (Zero Hunger) and SDG 11 (Sustainable Cities and Communities) highlight the interwoven dietary and demographic shifts described so far. While other authors have theorized the network of relationships connecting these SDGs [
10], the concept of the urban food desert has provided a helpful theoretical anchor for the intersection of SDGs 1,2, and 11. Early conceptions of the term focused almost exclusively on the spatial availability of supermarkets [
11,
12,
13]. Recently, however, the term has evolved to incorporate the accessibility of a broader range of food retail outlets and specific food items [
14]. Current work on the topic has embraced the complexity of modern urban food systems, integrating both economic and political concerns [
15,
16].
In a novel approach to the urban food desert concept, Battersby and Crush [
17] defined the African urban food desert as “poor, often informal, urban neighbourhoods characterised by high food insecurity and low dietary diversity, with multiple market and non-market food sources but variable household access to food” (p. 149). This definition was situated in contrast to predominantly Euro-American conceptualizations of the term that often left out the unique contributions of informal food retail (for example, street vending and unregulated food markets) and non-market food sources (for example, food remittances and urban agriculture) in determining household food insecurity in the African context. Battersby and Crush note that, while these food system activities are difficult to define and measure, they are frequently relied upon by poor urban households in the southern African context. This definition also recognizes the contribution of poverty and informality to urban household food insecurity. While the consideration of poverty in the development of food deserts has been previously highlighted through investigations into redlining (the spatial avoidance of poor areas for profit-driven food retailing) [
13], the causal structure is different in the Battersby and Crush definition. Instead of focusing on the availability of food, Battersby and Crush re-focus the definition of urban food deserts towards the accessibility of food and thus open the concept to the broader poverty contexts that constrain food access [
18]. In defining food deserts by access, Battersby and Crush have shifted the term from a primarily spatial measure to a conceptual framework. While both the concept of the urban food desert and the informal sector are contested in the literature, the Battersby and Crush definition is a conceptually helpful tool for understanding grounded realities of urban food security in the Global South.
Despite the adoption of the SDG goals, and the extensive literature on urban food deserts, urban food insecurity in developing countries is relatively under-studied. Those studies that have been undertaken tend to focus more on food production and the availability dimension of food insecurity [
19]. In Mozambique, there is also a public policy tendency to respond to food insecurity with food production programs. That said, there has been growing research interest in other dimensions and drivers of urban food security in Mozambican cities [
20,
21,
22]. This paper takes a broader, non-productionist approach to urban food insecurity through a study of the adjoining mainland cities of Maputo and Matola in southern Mozambique. These cities have been selected as case studies for this investigation because of the widespread challenge of food insecurity faced by households in both cities. Preliminary studies have also indicated that, as the Battersby and Crush urban food desert definition highlights, there may be an intersection between resource poverty and food insecurity in Maputo [
20,
21,
22]. As a result, these cities are a fertile ground for testing this definition of urban food deserts empirically.
This paper provides an analysis and comparison of the predictors of severe food insecurity in Maputo and Matola based on data from a Hungry Cities Partnership (HCP) household survey conducted in 2014. To achieve this aim, the investigation assesses the predictive relationship between household family structure and severe food insecurity in Maputo and Matola. This relationship is then tested against household resource poverty (defined by limited access to water, electricity, cash, medical care, and cooking fuel) to determine whether any observed relationships between household family structure and severe food insecurity change when resource poverty is controlled. The results of this investigation assess the contribution of household demographics to the severe food insecurity vulnerabilities associated with urban food deserts. Through this analysis, this investigation will assess the validity of the assertion in the Battersby and Crush definition that resource poverty is associated with urban food insecurity and whether that relationship is further nuanced by broader systems of social support. If that is the case, then the urban food desert definition may need to evolve further to include considerations of social structure and support when assessing and explaining urban food security.
Background on Maputo and Matola
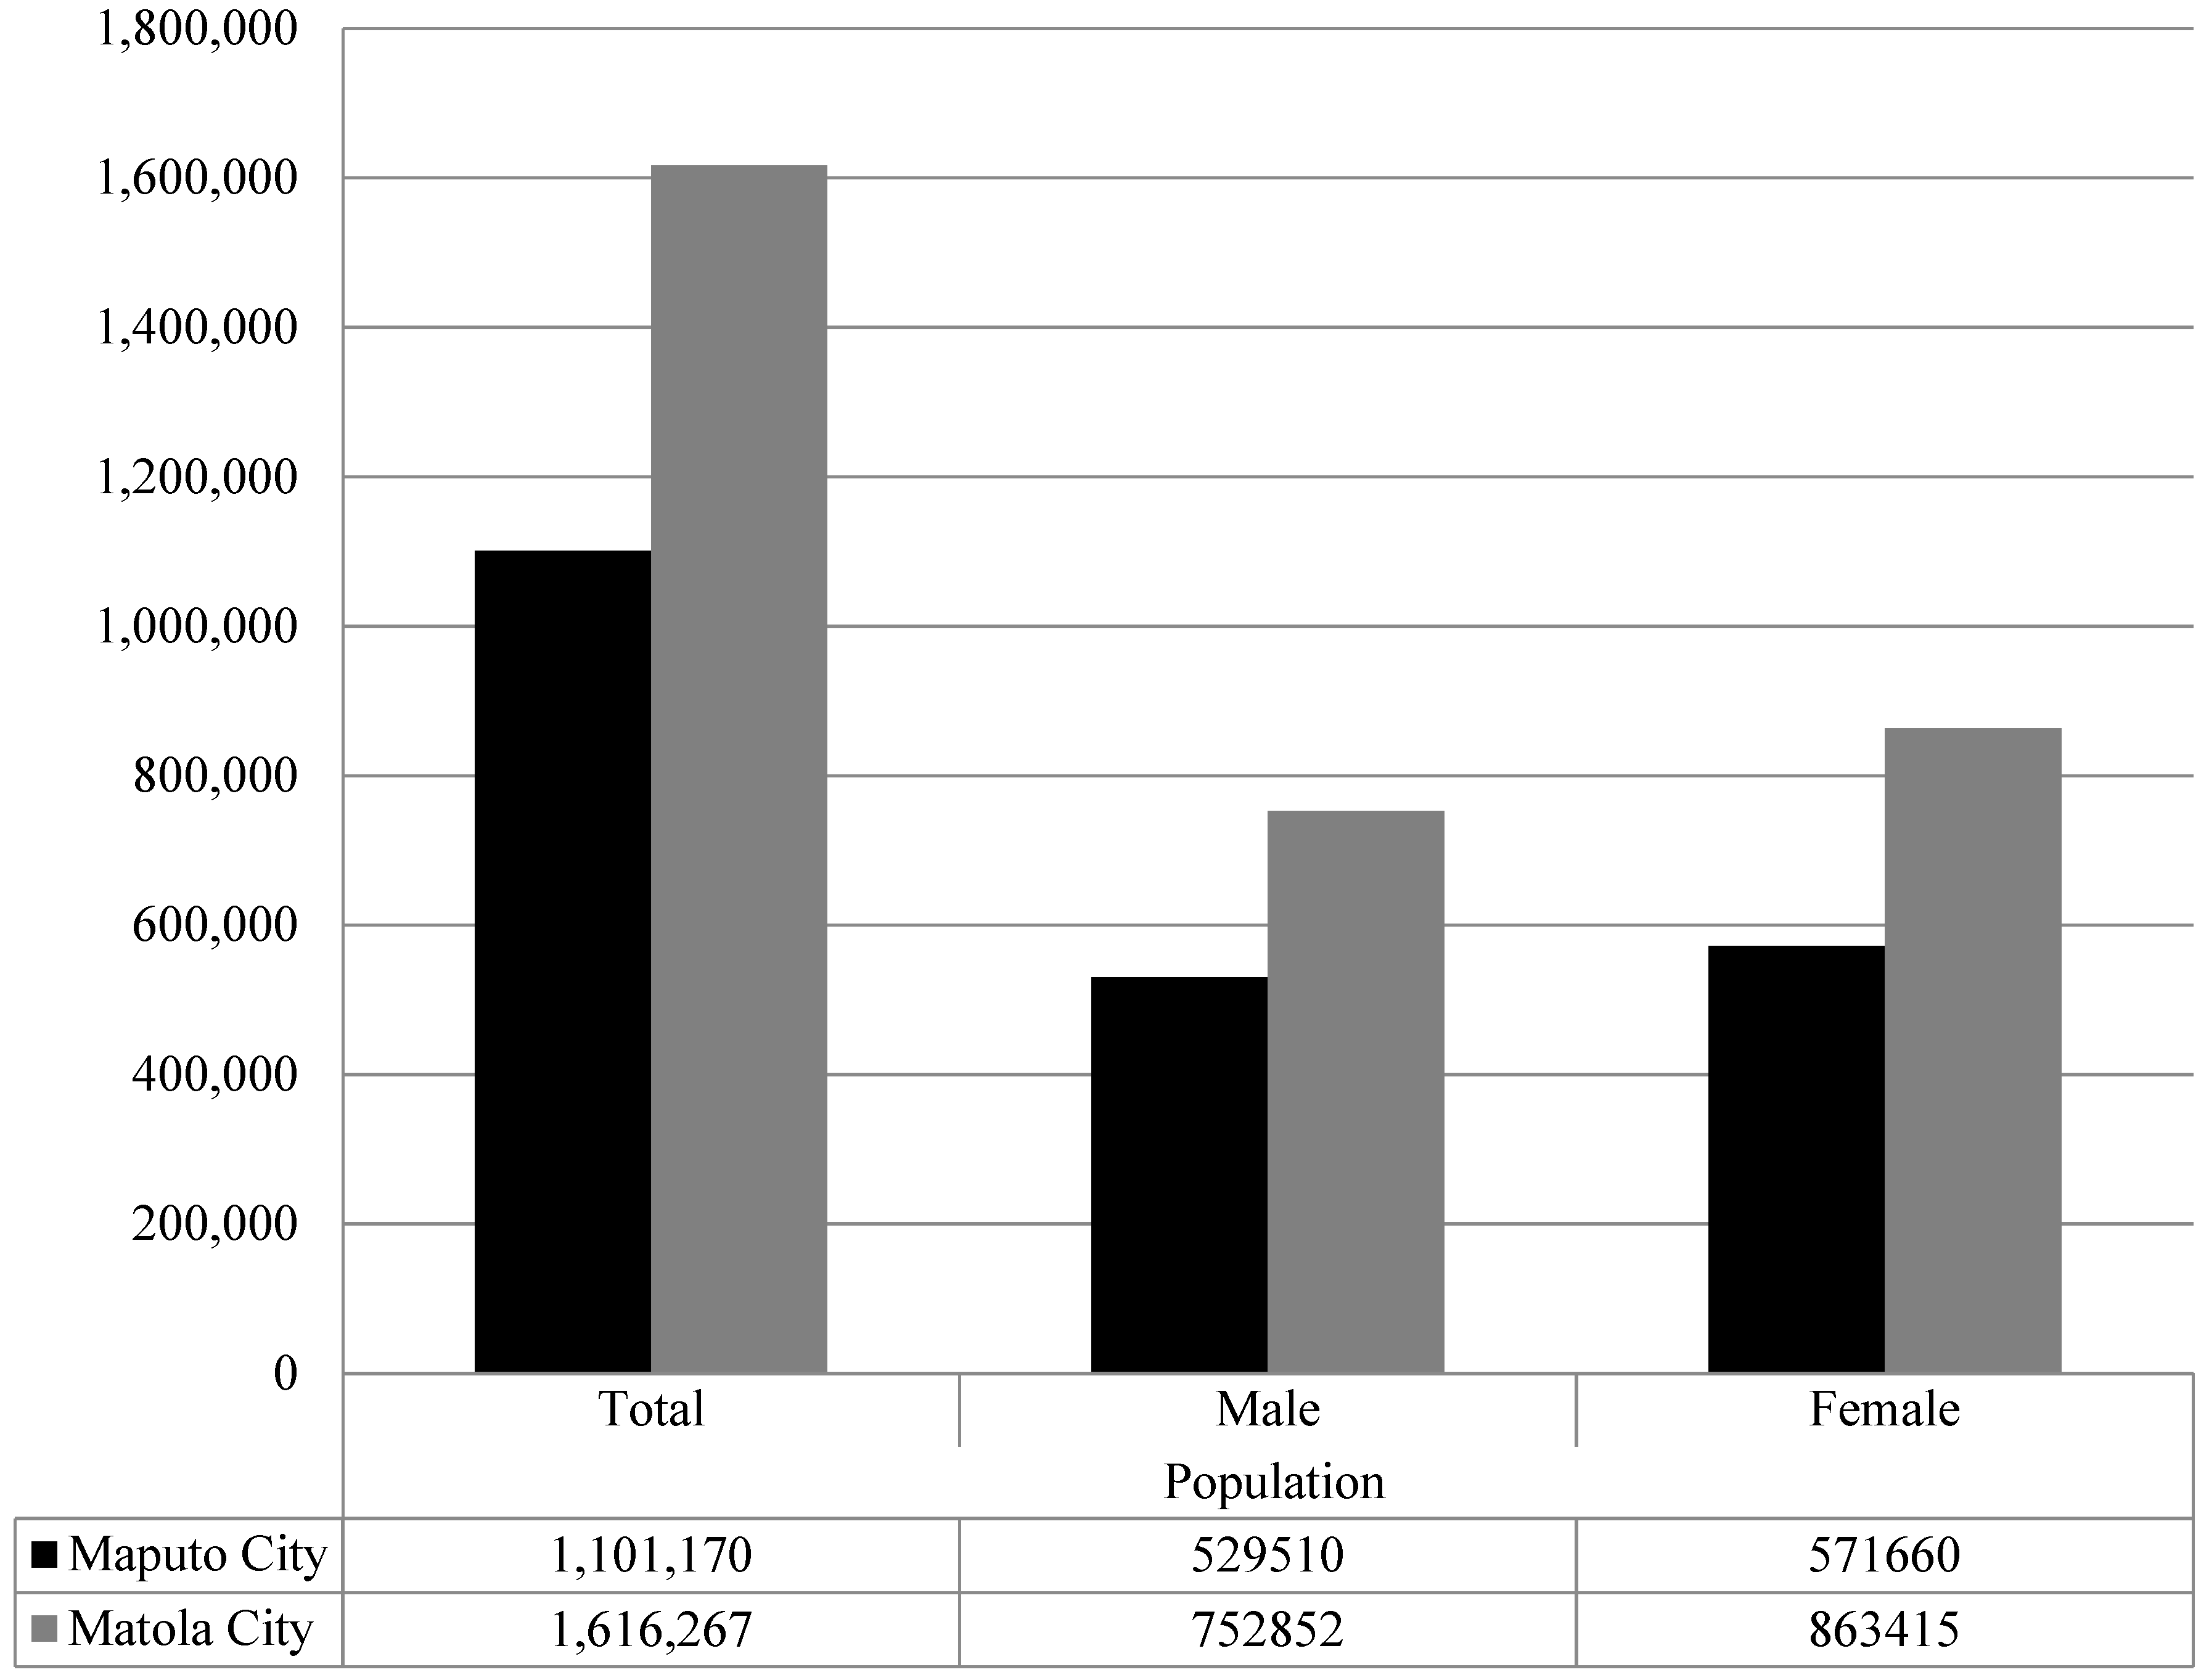
The City of Maputo is the capital of Mozambique and is in the south of the country on the western shore of Maputo Bay (
Figure 1). Administratively, the city is divided into seven municipal districts, namely KaMavota, KaMaxaqueni, Kampfumo, KaMubucuane, KaNyaka, KaTembe, and Lhamankulu, To the west is the City of Matola, the capital of the province of Maputo. Matola is divided into three administrative posts (corresponding to Maputo’s municipal districts)—Infulene, Machava and Matola Sede). According to the preliminary results of the population census of 2017 by the National Institute of Statistics, Maputo City has a total population of about 1,101,170 persons (48% male and 52% female). The City of Matola has a total population of 1,616,267 (47% male and 53% female) (
Figure 2). Maputo has 242,254 households and Matola has 374,546 households [
23].
According to surveys carried out by the Hungry Cities Partnership, both the city of Maputo and Matola experience severe, and similar, degrees of food insecurity. Only around 30% of the sampled households in both cities were categorized as food secure in these surveys (
Table 1). At the same time, almost 40% of the sampled households in both cities were categorized as severely food insecure. These frequency distributions indicate significant inequality in the household experience of food security in Maputo and Matola. About 70% of the surveyed households were categorized as either food secure or severely food insecure, while only 30% of the sampled households experienced mild to moderate forms of food insecurity. When household food security scores were calculated as scaled scores from 0 to 27 (where 0 represented complete food security and 27 represented complete food insecurity), the sampled households in these cities differed only marginally. The sampled households in Maputo received an average score of 6.48 while the sampled households in Matola received an average score of 6.11 on this scale.
The Hungry Cities Partnership surveys also indicate that, in the 24 h leading up to the survey, sampled households in Maputo consumed an average of 4.14 food groups and the sampled households in Matola consumed an average of 4.26 food groups. These statistics indicate very limited dietary diversity with marginal difference between the two cities. That said, there does appear to be a slight difference in the distribution of this dietary diversity between the two cities (
Figure 3). In the 24 h leading up to the survey, the sampled households in Maputo were more likely to consume 3 or fewer food groups while the sampled households in Matola were more likely to consume 4 or more food groups. These differences amounted to only a slight difference in the average dietary diversity of the sampled households in these two cities.
Much of the insecurity experienced by vulnerable households in Maputo and Matola is an outcome of Mozambique’s unique pathway towards urbanization. Urban development in Mozambique has historically been centralized in Maputo. However, recent trends indicate that urbanization has become more diffuse, with the rapid development of many secondary cities in the country [
24]. Over the previous few decades, there have been several piecemeal infrastructure development projects in both Maputo and Matola [
25]. These projects were historically hampered by the country’s civil war which redirected funding towards national security at the cost of urban planning [
26]. Following the end of colonial rule, urban infrastructure development continued to be obstructed by the limited availability of funding [
25]. The resulting distribution of infrastructure across Maputo tends to fall along broad lines of formality and informality [
27]. Access to these key infrastructure resources has been complicated by land tenure policies which have tended to regard rural–urban migrants in the city as temporary residents [
25,
28,
29].
The distribution of infrastructure in Maputo and Matola is pertinent to the existence of food deserts because of its predictive relationship with food security [
30]. Urban infrastructure provides access to the basic resources and services that are required for urban livelihoods. Interruptions in household access to those resources and services has significant and negative impacts on human security [
31,
32]. Within the context of Maputo, McCordic [
33] demonstrated that household access to cash, medical care, electricity, and water significantly predicted levels of household food security. McCordic and Frayne [
34] also found that household access to cooking fuel was a significant predictor of food security among poor urban households across Southern Africa.
There are theoretical explanations for the relationship between resource poverty and food insecurity. Household food access in cities is chiefly negotiated through retail rather than production. Secure food access is therefore predominantly a function of household assets and food prices. Limited household access to basic resources can indicate the availability of disposable household assets, since going without these goods and services demonstrates a limited capacity to purchase those resources. It is important to note, however, that households are not passive agents of their circumstances. Households secure access to key resources through adaptive coping strategies (including remittances, self-limiting food consumption, and resource trade-offs). In this context, household family structure can indicate a household’s ability to adapt to hazards via the extent and quality of supports available within that household.
There is also evidence that social support systems can mitigate the impact of food insecurity. Morton et al. [
35] found that food transfer arrangements in rural areas of Iowa were associated with greater resiliency in food deserts. Using survey data collected in the United States, Garasky et al. [
36] found that social support systems were a beneficial coping mechanism for dealing with food insecurity. Using large-scale survey data collected in the United States, Balistreri [
37] also found that children living in complex family structures were more vulnerable to food insecurity. The challenge is that many of these studies have been undertaken in a North American context. This investigation assesses whether these conclusions are relevant to urban food deserts in Maputo and Matola.
2. Materials and Methods
This investigation assesses the predictive relationship between household family structure, resource poverty and severe food insecurity in City of Maputo (with KaNyaca and Katembe districts excluded) and Matola, using household survey data collected in 2014. To achieve this aim, this investigation has the following objectives: (a) to determine the predictive relationship between household family structure and severe household food insecurity in Maputo and Matola, (b) to determine the predictive relationship between household resource poverty and severe household food insecurity in Maputo and Matola, and (c) to assess whether the predictive relationship between household family structure and severe household food insecurity changes when adjusted for household resource poverty in Maputo and Matola.
The data is drawn from a household food security survey of Maputo and Matola completed in 2014. The survey was administered by the HCP in collaboration with the Centre for Policy Analysis at Eduardo Mondlane University (EMU) in Maputo, Mozambique. All household respondents in this survey provided free and informed consent before participation in the study. This survey was completed according to the Tri-Council Policy Statement on Ethical Conduct for Research Involving Humans. The survey administration procedures were approved by the Wilfrid Laurier University Research Ethics Board. The HCP household survey instrument measured food security, food access, and household economic and social demographic characteristics. The household survey was administered using android tablets by researchers and students from EMU. In Maputo, 19 wards were randomly selected, and the total sample size was stratified across these wards using approximate proportionate allocation based on the most recent census records for the city. A systematic sampling strategy was used to select households within each ward. The same sampling strategy was used in Matola, where 10 wards were randomly selected. The total Maputo household sample size was 2071 households and the total Matola household sample size was 507 households.
This paper drew three sets of variables from the household survey: household food security, household family structure, and household resource poverty (
Table 2). Household food security was measured using the Household Food Insecurity Access Scale (HFIAS) [
38,
39]. This scale is based on 9 Likert style questions that assess the frequency with which households have experienced different food access challenges in the previous four weeks. The answers to these questions are then summed up using a scoring algorithm to categorize each household into one of the following four categories: food secure, mildly food insecure, moderately food insecure, and severely food insecure. For the purposes of this investigation, the HFIAS categories were binned into a binary variable representing whether a given household is severely food insecure.
To predict this HFIAS dependent variable, this investigation relied on two sets of independent variables: (a) household family structure and (b) household resource poverty. The household family structure variable reflects the internal social arrangement of the household and is divided into four categories: male-centred, female-centred, nuclear and extended. Male-centred households contain a single male head without a partner/spouse; female-centred households contain a single female head without a partner spouse; nuclear households contain a married or common law couple with or without children; and extended households contain a married or common law couple with immediate and extended relatives or non-relatives living in the household. This variable was binned into four dummy variables which indicate whether any given household is categorized in any one of these household family structures. The set of household resource poverty variables measure whether households have consistent or inconsistent (including no) access to water, medical care, electricity, cooking fuel, and cash in the year prior to the survey. These variables are drawn from the Afrobarometer Live Poverty Index and represent important and basic resources needed to support life and overall household food security [
33].
To assess whether these sets of independent variables have a predictive relationship with severe household food insecurity in Maputo and Matola, this investigation relied on odds ratios to assess whether a change in the value of any of the independent variables is associated with a change in the odds of the dependent variable (severe household food insecurity). These calculations were paired with Pearson’s chi-square tests and Fisher’s exact tests to assign a p-value to assess the statistical significance of the relationships. These odds ratios are calculated independent of the influence of any other variable. In other words, it is difficult to assess whether the relationship is mediated or moderated by other variables in the data set. In order to assess this aspect of the relationship, this investigation relied on binary logistic regression to control for the influence of the resource poverty variables while assessing the relationship between household family structure and severe food insecurity.
This research approach has inherent limitations. First, given the challenges in developing an accurate sampling frame (due to the limited availability of recent, accurate and relevant maps and census data), it is difficult to establish the generalizability of the household survey to all households in either Maputo or Matola. Second, the thresholds used to bin variables in this investigation may mask variations in the variable measurements and therefore may miss more important thresholds for predicting household food security. Third, given the observational nature of this data, the lack of a control group and the limited statistical ability to control all significant variables, it is not possible to use this research to make causal arguments. Instead, this research approach can highlight predictive relationships and changes in the quality of those relationships when other factors are controlled. Finally, as is the case in all survey research, the variables measured in this investigation are open to the subjectivity, interpretation, and recall of the survey respondents. As a result, deeper and more qualitative insights are not feasibly captured in this analytical approach. While this investigation can statistically control the influence of a few variables, further qualitative research will be needed to gain insight into the broader socio-cultural systems in which the findings from this investigation are embedded.
3. Results
The distribution of households across the independent and dependent variables reveal some interesting preliminary trends (
Table 3 and
Table 4). Within the sample, only about 28% of severely food insecure households in Maputo and Matola maintained consistent access to medical care in the previous year. Similarly, only about 25% of severely food insecure households in these cities maintained consistent access to cash or cooking fuel in the previous year. Among the different household family structures, over 40% of the sampled male-centred and extended households were severely food insecure in Maputo and Matola.
3.1. Odds Ratios
The odds ratio calculations for these relationships indicate the statistical significance of the trends observed in these descriptive statistics (
Table 5). All the resource poverty variables were associated with a statistically significant increase in the odds of severe household food insecurity. Sampled households with inconsistent access to medical care, cooking fuel or cash over the past year had at least 4 times the odds of being severely food insecure in Maputo and Matola when compared to households that maintained consistent access to these resources. Among the household family structures, only nuclear households shared a statistically significant relationship with severe food insecurity in both cities. In this case, the sampled nuclear households in Maputo had 30% lower odds of being severely food insecure while the sampled nuclear households in Matola had 50% lower odds of being severely food insecure when compared to other household family structures. In Maputo, female-centred households also had 26% higher odds of being severely food insecure when compared to other household family structures. That said, this relationship indicated limited statistical significance and the sampled households in Matola did not show the same relationship. This analysis indicates that, except for female-centred households, the same relationships are observed between severe food insecurity, household family structure, and resources access across both cities.
3.2. Adjusted Odds Ratios
All binary logistic regression models of severe household food insecurity in this analysis had insignificant Hosmer and Lemeshow tests with Nagelkerge R2 values over 0.25. In addition, multicollinearity was ruled out as a confound for any of these models via Pearson’s r correlation matrices of the independent variables in the models. Finally, all models indicated an increase in predictive accuracy by at least 7 percentage points over their null models.
These binary logistic regression models indicate some interesting characteristics. First, when other resource poverty and household structure variables are controlled, the consistency of household access to water and electricity no longer shares a statistically significant relationship with severe household food insecurity in Maputo. In Matola, however, inconsistent access to water remains a statistically significant predictor of severe food insecurity, while electricity access does not maintain such a relationship when these same variables are controlled. Second, controlling for the resource poverty variables, male-centred households demonstrate a statistically significant increase in the odds of severe food insecurity in both Maputo and Matola when compared to other household family structures. Under the same conditions, nuclear households in both cities demonstrate a statistically significant reduction in the odds of severe household food insecurity when compared to other household family structures (
Table 6).
4. Discussion
4.1. Resource Poverty and Severe Food Insecurity
While the importance of resource access for household food security in Maputo has been demonstrated elsewhere [
33], this investigation demonstrates the importance of impoverished resource access in the prediction of severe food insecurity in both Maputo and Matola. The analysis also found that, compared to other household family structures, male-centred households had significantly increased odds, and nuclear households significantly reduced odds, of severe food insecurity when access to water, electricity, medical care, cooking fuel and cash are controlled in both Maputo and Matola. Maputo and Matola, therefore, appear to share similar predictive relationships between household family structure, impoverished resource access, and severe household food insecurity. Given the unique histories and current challenges faced by Maputo and Matola, this case study should be assessed in other cities to determine whether the observations made in this study are truly the result of the unique socio-cultural environment of these cities.
The mounting evidence of a predictive relationship between resource access and food insecurity (in addition to [
30,
33]), suggests the importance of physical infrastructure and social institutions to human security in cities of the Global South. This finding also reiterates the importance of research into the network relationships among the SDGs [
10]. By better understanding how these network relationships occur in cities, it may be possible to inform more targeted policy interventions into poverty and food insecurity.
4.2. Household Family Structure and Severe Food Insecurity
These findings also indicate the importance of social networks, as exemplified in household family structure, in predicting the severity of household food insecurity in Maputo and Matola. These findings support the conclusions of Balistreri [
37], who found that children living in complex family structures in the United States were more vulnerable to food insecurity. The family structure of households may indicate the kind of social support available within a given household, which may in turn influence the severity of food insecurity experienced by the household. Given that only nuclear households were found to decrease the odds of severe food insecurity, this household family structure may represent a balance between the negative food impacts on large household size and improved social support than would be available to male-headed households. That said, Miller et al. [
40] found in a longitudinal study that the risk of child food insecurity in the United States did not vary by household structure when other social vulnerability indicators (such as income, education and family size) were controlled. As a result, further research is necessary to understand the exact causes of this relationship.
These findings also contribute to ongoing research into urban food deserts in the Global South. Based on this investigation, it appears that the vulnerabilities highlighted by Battersby and Crush [
17] in African urban food deserts may be differentiated by household family structures. This research indicates that, in addition to the spatial accessibility of food retailers and food items [
14], social support networks (like family structure) may influence the vulnerabilities associated with urban food deserts. Further research will be needed to determine the extent to which these findings may be applicable in other cities in the Global South. If this is the case, then the entire concept of the urban food desert may need to evolve beyond the Battersby and Crush definition to incorporate unique contributions of social support systems in the understanding of urban food insecurity. As a result, the urban food desert may need to evolve into a more conceptual rather than spatial framework for understanding urban food insecurity.
5. Conclusions
This investigation found very similar rates of food insecurity across both Maputo and Matola, suggesting that these two cities may in fact share a similar vulnerability profile regarding food insecurity. This finding indicates that, while Maputo is the national capital, the city may share similar food insecurity challenges to Matola. Given the widespread food insecurity observed in Maputo over the course of this investigation, future food security and social welfare programs in Mozambique should consider the inclusion of Maputo in their programming.
The predictive relationship between resource poverty, household family structure, and severe food insecurity in Maputo and Matola supports more targeted vulnerability assessments. In other words, the characteristics of households that experience severe food insecurity can be used to identify households in danger of falling into this form of insecurity. If these findings are validated by future research, future food security policies in programs should aim to bolster support networks for vulnerable family structures. By bolstering programs targeting remittances of food and goods among families, there may be additional support provided to households that are vulnerable to food insecurity. Community support programs may also be able to provide support networks that limit the shocks experienced by households experiencing resource deprivation.
There is mounting evidence for the importance of public resources (like water, electricity, and medical care) for household vulnerability to food insecurity. This observation provides an additional explanation for the network relationships between SDGs 1, 2, and 11. Beyond representing a potential compounded vulnerability, the interaction of these factors may also identify policy efficiencies. Planning and subsidizing infrastructure access may have knock-on implications for household poverty and insecurity. As a result, social welfare programs in Maputo and Matola may benefit from subsidizing household infrastructure access.
That said, given the observational nature of this study, the lack of a control group, the reliance on self-report, and the dichotomizing of investigation variables, further research will be needed to assess any causal interpretations and to test the replicability of these findings. The policy implications of this relationship highlight a potential role for urban planning in mitigating urban poverty and insecurity while also highlighting the nuance that social networks can bring to these contributions.
Author Contributions
Conceptualization, C.M. and E.A.; Methodology, C.M.; Validation, C.M.; Formal Analysis, C.M.; Investigation, C.M. and E.A.; Data Curation, C.M.; Writing—Original Draft Preparation, C.M. and E.A.; Writing—Review and Editing, C.M. and E.A.; Supervision, C.M.; Project Administration, C.M. and E.A.
Funding
This research was funded by the Social Sciences and Humanities Research Council under Grant No. 895-2013-3005 and the International Development Research Centre under Grant No. 107775-001.
Acknowledgments
We wish to acknowledge the support of the following: the International Development Research Centre (IDRC) and the Social Sciences and Humanities Research Council of Canada (SSHRC) for the Hungry Cities Partnership. We wish to thank our colleagues in the Hungry Cities Partnership (HCP) and the African Food Security Urban Network (AFSUN) for their assistance, and the following for their assistance with research planning and implementation: Ines Raimundo, Jonathan Crush, Bruce Frayne, Maria Salomone, Gareth Haysom, and Mary Caesar.
Conflicts of Interest
The authors declare no conflict of interest.
References
- Montgomery, M.R. The urban transformation of the developing world. Science 2008, 319, 761–764. [Google Scholar] [CrossRef] [PubMed]
- Montgomery, M.R. The demography of the urban transition: What we know and don’t know. In The New Global Frontier; Martine, G., McGranahan, G., Montgomery, M., Fernandez-Castilla, R., Eds.; Routledge: London, UK, 2012; pp. 31–50. [Google Scholar]
- United Nations. World Urbanization Prospects, the 2014 Revision; United Nations: New York, NY, USA, 2014. [Google Scholar]
- Kessides, C. The Urban Transition in Sub-Saharan Africa: Implications for Economic Growth and Poverty Reduction; Africa Region Working Paper No. 97; Cities Alliance: Washington, DC, USA, 2006. [Google Scholar]
- Fox, S. Understanding the Origins and Pace of Africa’s Urban Transition; Crisis States Research Centre Working Paper Series 2 No. 98; Crisis States Research Centre: London, UK, 2011. [Google Scholar]
- Drewnowski, A.; Popkin, B.M. The nutrition transition: New trends in the global diet. Nutr. Rev. 1997, 55, 31–43. [Google Scholar] [CrossRef] [PubMed]
- Doak, C.M.; Adair, L.S.; Bentley, M.; Monteiro, C.; Popkin, B.M. The dual burden household and the nutrition transition paradox. Int. J. Obes. 2005, 29, 129–136. [Google Scholar] [CrossRef] [PubMed]
- Popkin, B.M.; Adair, L.S.; Ng, S.W. Global nutrition transition and the pandemic of obesity in developing countries. Nutr. Rev. 2012, 70, 3–21. [Google Scholar] [CrossRef] [PubMed]
- United Nations General Assembly. Transforming Our World: The 2030 Agenda for Sustainable Development; A/RES/70/1; United Nations: New York, NY, USA, 2015. [Google Scholar]
- Le Blanc, D. Towards Integration at Last? The Sustainable Development Goals as a Network of Targets; DESA Working Paper No. 141; United Nations Department of Economic and Social Affairs: New York, NY, USA, 2015. [Google Scholar]
- Wrigley, N.; Warm, D.; Margetts, B. Deprivation, diet, and food-retail access: Findings from the Leeds ‘food deserts’ study. Environ. Plan. A 2003, 35, 151–188. [Google Scholar] [CrossRef]
- Wrigley, N.; Warm, D.; Margetts, B.; Whelan, A. Assessing the impact of improved retail access on diet in a ‘food desert’: A preliminary report”. Urban Stud. 2002, 39, 2061–2082. [Google Scholar] [CrossRef]
- D’Rozario, D.; Williams, J.D. Retail redlining: Definition, theory, typology, and measurement. J. Macromarketing 2005, 25, 175–186. [Google Scholar] [CrossRef]
- Bridle-Fitzpatrick, S. Food deserts or food swamps? A mixed-methods study of local food environments in a Mexican city. Soc. Sci. Med. 2015, 142, 202–213. [Google Scholar]
- Sadler, R.C. Strengthening the core, improving access: Bringing healthy food downtown via a farmers’ market move. Appl. Geogr. 2016, 67, 119–128. [Google Scholar] [CrossRef]
- Shannon, J. Beyond the supermarket solution: Linking food deserts, neighborhood context, and everyday mobility. Ann. Am. Assoc. Geogr. 2016, 106, 186–202. [Google Scholar] [CrossRef]
- Battersby, J.; Crush, J. Africa’s urban food deserts. Urban Forum 2014, 25, 143–151. [Google Scholar] [CrossRef]
- Crush, J.S.; Frayne, G.B. Urban food insecurity and the new international food security agenda. Dev. S. Afr. 2011, 28, 527–544. [Google Scholar] [CrossRef]
- Haysom, G. Alternative Food Networks and Food Insecurity in South Africa; Working Paper 33; PLAAS: Cape Town, South Africa, 2016. [Google Scholar]
- Raimundo, I.; Crush, J.; Pendleton, W. The State of Food Insecurity in Maputo, Mozambique; Urban Food Security Series No. 20; AFSUN: Cape Town, South Africa, 2014. [Google Scholar]
- McCordic, C. Household Food Security and Access to Medical Care in Maputo, Mozambique; Hungry Cities Discussion Paper No. 7; Hungry Cities Partnership: Waterloo, ON, Canada, 2017. [Google Scholar]
- Frayne, B.; Crush, J.; McCordic, C. (Eds.) Food and Nutrition Security in Southern African Cities; Routledge: London, UK, 2017. [Google Scholar]
- INE. Preliminary Data from the 4th Census, 2017; National Institute of Statistics: Maputo, Mozambique, 2017.
- World Bank. World Development Indicators; World Bank: Washington, DC, USA, 2014. [Google Scholar]
- Jenkins, P. City profile: Maputo. Cities 2000, 17, 207–218. [Google Scholar] [CrossRef]
- Barros, C.P.; Chivangue, A.; Samagaio, A. Urban dynamics in Maputo, Mozambique. Cities 2014, 36, 74–82. [Google Scholar] [CrossRef]
- Jenkins, P. Beyond the formal/informal dichotomy: Access to land in Maputo, Mozambique. In Reconsidering Informality: Perspectives from Urban Africa; Hansen, K.T., Vaa, M., Eds.; The Nordic Africa Institute: Upsala, Sweden, 2004; pp. 210–226. [Google Scholar]
- Newitt, M.D.D. A history of Mozambique; Indiana University Press: Bloomington, IN, USA, 1995. [Google Scholar]
- Raimundo, I.; McCordic, C.; Chikanda, A. The State of Household Food Security in Maputo, Mozambique; HCP Report No. 10; Hungry Cities Partnership: Waterloo, ON, Canada, 2018. [Google Scholar]
- McCordic, C. Compounding Vulnerability: A Model of Urban Household Food Security; Hungry Cities Discussion Paper No. 12; Hungry Cities Partnership: Waterloo, ON, Canada, 2017. [Google Scholar]
- Wisner, B.; Blaikie, P.; Cannon, T.; Davis, I. At Risk: Natural Hazards, People’s Vulnerability and Disasters, 2nd ed.; Routledge: London, UK, 2004. [Google Scholar]
- Scoones, I. Sustainable Rural Livelihoods: A Framework for Analysis; IDS Working Paper 72; Institute for Development Studies: Brighton, UK, 1998. [Google Scholar]
- McCordic, C. Urban Infrastructure and Household Vulnerability to Food Insecurity in Maputo, Mozambique. Ph.D. Thesis, University of Waterloo, Waterloo, ON, Canada, 2016. [Google Scholar]
- McCordic, C.; Frayne, B. Household vulnerability to food price increases: The 2008 crisis in urban Southern Africa. Geogr. Res. 2017, 55, 166–179. [Google Scholar] [CrossRef]
- Morton, L.W.; Bitto, E.A.; Oakland, M.J.; Sand, M. Solving the problems of Iowa food deserts: Food insecurity and civic structure. Rural Sociol. 2005, 70, 94–112. [Google Scholar] [CrossRef]
- Garasky, S.; Morton, L.W.; Greder, K.A. The effects of the local food environment and social support on rural food insecurity. J. Hunger Environ. Nutr. 2006, 1, 83–103. [Google Scholar] [CrossRef]
- Balistreri, K.S. Family Structure and Child Food Insecurity: Evidence from the Current Population Survey. Soc. Indic. Res. 2018, 138, 1171–1185. [Google Scholar] [CrossRef] [PubMed]
- Bickel, G.; Nord, M.; Price, C.; Hamilton, W.; Cook, J. Guide to Measuring Household Food Security; Office of Analysis, Nutrition and Evaluation, Food and Nutrition Service, USDA: Alexandria, VA, USA, 2000.
- Coates, J.; Swindale, A.; Bilinsky, P. Household Food Insecurity Access Scale (HFIAS) for Measurement of Food Access: Indicator Guide; Version 3; Food and Nutrition Technical Assistance Project: Washington, DC, USA, 2007. [Google Scholar]
- Miller, D.P.; Nepomnyaschy, L.; Ibarra, G.L.; Garasky, S. Family structure and child food insecurity. Am. J. Public Health 2014, 104, e70–e76. [Google Scholar] [CrossRef] [PubMed]
© 2019 by the authors. Licensee MDPI, Basel, Switzerland. This article is an open access article distributed under the terms and conditions of the Creative Commons Attribution (CC BY) license (http://creativecommons.org/licenses/by/4.0/).


