Comparative Analysis of the Impact of the Business Incubator Center on the Economic Sustainable Development of Regions in USA and Poland


Abstract
1. Introduction
- What are social, organizational, scientific and financial aspect of functioning academic business incubator centers in USA and Poland?
- What are differences in functioning business incubator centers in USA and Poland?
- What best practices we can distinguish on the bases of our analysis?
2. Literature Review
- new products,
- new production methods,
- new markets,
- new form of organization.
3. Materials and Methods
- to reflect every aspect of economic growth, including social, organizational, technical/scientific and financial,
- to be objective and directly measurable by either using quantitative or qualitative method of assessment,
- to be independent from each other, so that each one of them measures a different aspect of economic growth,
- to allow for direct comparison between the two selected business incubator centers located in two different countries.
- social indicators,
- organizational/procedural indicators,
- scientific/technical indicators,
- financial indicators.
4. Results
Approximately 90 entrepreneurs annually receive assistance from a business incubator center in the form of an evaluation of their inventions or business ideas. In addition, 50 entrepreneurs receive help in the development of a business plan. At the present time, there are 12 companies in the incubation stage and eight companies in the post-incubation stage. The success rate during the incubation stage is 66% (Table 3). The office of CAN-BE is open 40 h per week with two full-time employees.(Director, Administrative Assistant)
5. Discussion
- social indicators,
- organizational/procedural indicators,
- scientific/technical indicators,
- financial indicators.
- Diversity enhances innovativeness and allows for an approach from a different perspective (thinking outside of the box).
- Diversity is viewed as a very positive factor during the review of an application for public funding.
6. Conclusions
Author Contributions
Funding
Conflicts of Interest
References
- Chiara, C. A service incubator business model: External networking orientation. IMP J. 2014, 3, 237–285. [Google Scholar]
- Blanco, O. How Latinos Are Saving This Former Pennsylvania Mining Town. Available online: https://money.cnn.com/2016/09/02/news/economy/hazleton-pa-latino-immigrant/index.html (accessed on 2 December 2018).
- Northeastern Pennsylvania Alliance (NEPA). Comprehensive Economic Development Strategy Five Year Plan for Northeastern Pennsylvania: 2013–2018. December 2013. Available online: https://www.google.com/url?sa=t&rct=j&q=&esrc=s&source=web&cd=4&cad=rja&uact=8&ved=2ahUKEwiN_s7ZqcXfAhWDlosKHdYYAb8QFjADegQIBxAC&url=http%3A%2F%2Fwww.northwestpa.org%2Fwp-content%2Fuploads%2F2016%2F12%2FCEDS-Final-2016-12.27.16.pdf&usg=AOvVaw29i6hHn-wvUv0ZkMa76ok3 (accessed on 2 December 2018).
- Dublin, T.; Licht, W. The Face of Decline: The Pennsylvania Anthracite Region in the Twentieth Century; Cornell Press: Ithaca, NY, USA, 2005. [Google Scholar]
- Joint Urban Studies Center. Ethnic Changes in Northeastern Pennsylvania (with Special Emphasis on Recent History within the City of Hazleton). July 2006. Available online: https://www.google.com/url?sa=t&rct=j&q=&esrc=s&source=web&cd=1&ved=2ahUKEwjYzvuCqsXfAhUup4sKHQDcCOgQFjAAegQIARAC&url=http%3A%2F%2Fwww.institutepa.org%2Fpdf%2Fresearch%2Fdiversity0906.pdf&usg=AOvVaw28yNBMTSnc3Z_PZ3CCsEer (accessed on 2 December 2018).
- Polish American Chamber of Commerce. Year in Review—2012. Available online: https://www.paccpnw.org/2013/04/year-in-review-2012/ (accessed on 2 December 2018).
- Enhancing Poland-United States Collaboration in Small Business Initiatives: Challenges and Perspectives for the Future. Available online: https://www.paccpnw.org/event/enhancing-poland-us-collaboration-in-small-business-initiatives-challenges-and-perspectives-for-the-future/ (accessed on 2 December 2018).
- Poland Start-up Accelerator Program Underway. MIT Technology Review (MIT Enterprise Forum, February 15, 2016). Available online: http://www.mitef.org/s/1314/interior-3-col.aspx?sid=1314&gid=5&pgid=252&cid=50014&ecid=50014&crid=0&calpgid=61&calcid=971 (accessed on 2 December 2018).
- The Heritage Foundation. Poland: Country Rankings (Index/Rankings). Available online: https://www.heritage.org/index/country/poland (accessed on 2 December 2018).
- Olkiewicz, M.; Bober, B.; Wolniak, R. Innowacje w przemyśle farmaceutycznym jako determinanta procesu kształtowania jakości życia. Przem. Chem. 2017, 11, 2199–2201. [Google Scholar] [CrossRef]
- Wolniak, R.; Grebski, M.E. Functioning of the business incubator center in Gliwice. Zeszyty Naukowe Politechniki Śląskiej. Seria Organizacja i Zarządzanie 2017, 105, 569–580. [Google Scholar] [CrossRef]
- Apa, R. The social and business dimensions of a networked business incubator: The case of H-Farm. J. Small Bus. Enterp. Dev. 2017, 2, 198–221. [Google Scholar] [CrossRef]
- Dvoultey, O. Are publicly funded Czech incubators effective? The comparison of performance of supported and non-supported firms. Eur. J. Innov. Manag. 2018, 4, 543–563. [Google Scholar] [CrossRef]
- Ingram, P.; Luo, J.; Eshun, J.P. Institutional rivalry and the entrepreneurial strategy of economic development: Business incubator foundings in three states. In Institutions and Entrepreneurship; Sine, W.D., David, R.J., Eds.; Research in the Sociology of Work; Emerald Group Publishing Limited: Bingley, UK, 2010; Volume 21, pp. 127–155. [Google Scholar]
- Natário, M.M.; Couto, J.P.A.; de Almeida, C.F.R. The triple helix model and dynamics of innovation: A case study. J. Knowl.-Based Innov. China 2012, 4, 36–54. [Google Scholar] [CrossRef]
- Olkiewicz, M. Quality improvement through foresight methodology as a direction to increase the effectiveness of an organization. Contemp. Econ. 2018, 12, 69–90. [Google Scholar] [CrossRef]
- Olkiewicz, M.; Wolniak, R. The repationship between the economic developmeny of the country and food security. Rocznik Ochrona Środowiska 2018, 20, 804–818. [Google Scholar]
- Allahar, H.; Brathwaite, C. Business incubation as an instrument of innovation: The experience of South America and the Caribbean. Int. J. Innov. 2016, 2, 71–85. [Google Scholar] [CrossRef]
- Davies, M. Mixed-Use Incubator Handbook: A Start-up Guide for Incubator Developers; Information for Development Program: Washington, DC, USA, August 2009; Available online: https://www.google.com/url?sa=t&rct=j&q=&esrc=s&source=web&cd=1&cad=rja&uact=8&ved=2ahUKEwizrZ7irMXfAhUBx4sKHXblC30QFjAAegQICRAC&url=https%3A%2F%2Fwww.infodev.org%2Finfodev-files%2Fresource%2FInfodevDocuments_733.pdf&usg=AOvVaw3q9_cmt8HaqrWfcMYI3pEC (accessed on 2 December 2018).
- Gębczyńska, A.; Wolniak, R. Process Management Level in Local Government; CreateSpace: Philadelphia, PA, USA, 2018; Available online: https://www.amazon.com/Process-Management-Level-Local-Government/dp/1985649950/ref=sr_1_10?ie=UTF8&qid=1546096182&sr=8-10&keywords=wolniak (accessed on 2 December 2018).
- Hys, K.; Wolniak, R. Praktyki przedsiębiorstw przemysłu chemicznego w Polsce w zakresie CSR. Przem. Chem. 2018, 9, 1000–1002. [Google Scholar]
- Monsson, C.K.; Jørgensen, S.B. How do entrepreneurs’ characteristics influence the benefits from the various elements of a business incubator? J. Small Bus. Enterp. Dev. 2016, 1, 224–239. [Google Scholar] [CrossRef]
- Jankiewicz, S. Pre-inkubator Studencki Jako Instrument Rozwoju Przedsiębiorczości Oraz Wzrostu Konkurencyjności Gospodarki Polskiej. Prace I Materiały Wydziału Zarzadzania Uniwersytetu Gdańskiego 2006, 2, 199–208. [Google Scholar]
- Jonek-Kowalska, I. Method for assessing the development of underground hard coal mines on a regional basis: The concept of measurement and research results. Energies 2018, 6, 1370. [Google Scholar] [CrossRef]
- Knop, L.; Brzóska, J. Rola innowacji w tworzeniu wartości przez modele biznesu. Zeszyty Naukowe Politechniki Śląskiej. Seria Organizacja i Zarządzanie 2016, 99, 213–232. [Google Scholar]
- Lose, T.; Tengeh, R.K. The Sustainability and Challenges of Business Incubators in the Western Cape Province, South Africa. Sustainability 2015, 7, 14344–14357. [Google Scholar] [CrossRef]
- Osika, G. Innowacje społeczne jako wsparcie dla inteligentnych specjalizacji—Uwarunkowania komunikacyjne. Zeszyty Naukowe Politechniki Śląskiej. Seria Organizacja i Zarządzanie 2016, 95, 369–381. [Google Scholar]
- Pacana, A.; Malindžák, D.; Pačaiová, H. Effective Model of Environmental and Logistics System Quality Improvements for Cement Factory Vessels. Przem. Chem. 2017, 9, 1958–1962. [Google Scholar]
- Klonowska-Matynia, M.; Radlińska, K. Przestrzenne zróżnicowanie zrównoważonego rozwoju wybranych krajów europejskich. Hierarchia i klasyfikacja krajów. Rocznik Ochrony Środowiska 2018, 20, 1372–1385. [Google Scholar]
- Xavier, W.S.; Martins, G.S.; Lima, A.A. Empowering It entrepreneurship: What’s the contribution of business incubators? J. Inf. Syst. Technol. Manag. 2008, 5, 433–452. [Google Scholar] [CrossRef]
- Markley, D.M.; McNamara, K.T. A Business Incubator: Operating Environment and Measurement of Economic and Fiscal Impacts; Working Paper; Purdue University: West Lafayette, IN, USA, 1994. [Google Scholar]
- Siemieniuk, L. Academic Business Incubators as an Institutional Form of Academic Entrepreneurship Development in Poland; Institute of Economic Working Papers: Torun, Poland, 2015. [Google Scholar]
- Szwajca, D. Macierz aspiracji innowacyjnych jako narzędzie zarządzania portfelem innowacji w przedsiębiorstwie. Zeszyty Naukowe Politechniki Śląskiej Seria Organizacja i Zarządzanie 2016, 95, 322–333. [Google Scholar]
- Razak, A.A.; White, G.R.T. The Triple Helix model for innovation: A holistic exploration of barriers and enablers. Int. J. Bus. Perform. Supply Chain Model. 2015, 7, 278–291. [Google Scholar] [CrossRef]
- Etzkowitz, H.; Leydesdorff, L. The Triple Helix: University-industry-government relations. A laboratory for knowledge based economic development. EASST Rev. Eur. Soc. Study Sci. Technol. 1995, 14, 18–36. [Google Scholar]
- Etzkowitz, H. Innovation: Industry; University and Government in Action; Routledge: London, UK; New York, NY, USA, 2008. [Google Scholar]
- Saad, M. Issues and challenges arising from the application of innovation strategies based on the Triple Helix culture: Experience of the incubation system in Algeria. Int. J. Technol. Manag. Sustain. Dev. 2004, 3, 17–35. [Google Scholar] [CrossRef]
- Saad, M.; Zawdie, G. From technology transfer to the emergence of Triple Helix culture: The experience of Algeria in innovation and technological capability development. Technol. Anal. Strateg. Manag. 2005, 17, 1–15. [Google Scholar] [CrossRef]
- Ranga, M.; Etzkowic, H. Creative reconstruction: A Triple Helix-based Innovation strategy in central and eastern rurope countries. In Theory and Practice of Triple Helix Model in Developing Countries: Issue and Challenges; Saad, M., Zawdie, G., Eds.; Routledge: London, UK, 2010. [Google Scholar]
- Rivera, M. Innovation systems interactions and technology transfer and assimilation for industrial development: The cases of South Korea and Mexico. In Theory and Practice of Triple Helix Model in Developing Countries: Issue and Challenges; Saad, M., Zawdie, G., Eds.; Routledge: London, UK, 2010. [Google Scholar]
- Dzisah, J. Mobilizing for Development Putting the Triple Helix into Action in Ghana. In Theory and Practice of Triple Helix Model in Developing Countries: Issue and Challenges; Saad, M., Zawdie, G., Eds.; Routledge: London, UK, 2010. [Google Scholar]
- Yang, Y.; Holgaard, J.E. The important role of civil society groups in eco-innovation: A triple helix perspective. J. Knowl.-Based Innov. China 2012, 4, 132–148. [Google Scholar] [CrossRef]
- Coussi, O.; Faccin, K.; Balestrin, A. Foreign direct investment in an emerging country: A Brazilian case of a triple helix as practice. Int. J. Emerg. Mark. 2018, 13, 1751–1775. [Google Scholar] [CrossRef]
- Savignon, A.B.; Corvo, L. Government–Third Sector Relations and the Triple Helix. Approach: Patterns in the Italian Social Innovation Ecosystem. In Cross-Sectoral Relations in the Delivery of Public Services; Bonomi, A., Gnan, S.L., Hinna, A., Monteduro, F., Eds.; Studies in Public and Non-Profit Governance; Emerald Publishing Limited: Bingley, UK, 2018; Volume 6, pp. 95–109. [Google Scholar]
- Rao, K.; Meng, X.; Piccaluga, A. From the triple felix of university-industry-academy to the triple helix of university-industry-government in China. J. Knowl.-Based Innov. China 2012, 4, 152–162. [Google Scholar]
- Etzkowitz, H.; Klofsten, M. The innovating region: Toward a theory of knowledge based regional development. R&D Manag. 2005, 35, 243–255. [Google Scholar]
- Etzkowitz, H.; Dzisah, J. Bottom-up Triple Helix: Science policy in the states of the USA. J. Knowl.-Based Innov. China 2013, 5, 80–96. [Google Scholar] [CrossRef]
- Lundberg, H. Triple Helix in practice: The key role of boundary spanners. Eur. J. Innov. Manag. 2013, 16, 211–226. [Google Scholar] [CrossRef]
- Sørensen, O.J.; Hu, Y. Triple helix going abroad? The case of Danish experiences in China. Eur. J. Innov. Manag. 2014, 17, 254–271. [Google Scholar] [CrossRef]
- Danell, R.; Persson, O. Regional R&D activities and interactions in the Swedish triple helix. Scientometrics 2003, 58, 205–218. [Google Scholar]
- Chesbrough, H.W.; Vanhaverbeke, W.; West, J. Open Innovation Researching a New Paradigm; Oxford University Press: Oxford, UK, 2006. [Google Scholar]
- Al-Mubaraki, H.M.; Muhammad, A.H.; Busler, M. Innovation and Entrepreneurship: Powerful Tools for a Modern Knowledge-Based Economy; Tait, A., Translator; Springer International Publishing: New York, NY, USA, 2015. [Google Scholar]
- Anderson, B.B.; Al-Mubaraki, H. The Gateway Innovation Center: Exploring key elements of developing a business incubator. World J. Entrep. Manag. Sustain. Dev. 2012, 4, 208–216. [Google Scholar] [CrossRef]
- Wolniak, R.; Grebski, M. Promoting Creativity and Innovativeness in Education; CreateSpace: New York, NY, USA, 2018. [Google Scholar]
- Caiazza, R. Benchmarking of business incubators. Benchmarking Int. J. 2014, 6, 1062–1069. [Google Scholar] [CrossRef]
- Calza, F.; Dezi, L.; Sciavone, F.; Simoni, M. The intellectual capital of business incubators. J. Intellect. Capital 2014, 4, 597–610. [Google Scholar] [CrossRef]
- Coleman, A. Poland on Track to Becoming a Major European Tech Start-up Hub. 2017. Available online: https://www.google.com/url?sa=t&rct=j&q=&esrc=s&source=web&cd=2&cad=rja&uact=8&ved=2ahUKEwjBt6WercXfAhXxposKHS8dD5kQFjABegQICRAC&url=https%3A%2F%2Fwww.trade.gov.pl%2Fen%2Fnews%2F195411%2Cpoland-on-track-to-becoming-a-major-european-tech-startup-hub-according-to-forbes.html.pdf&usg=AOvVaw0DBp62wODMczdw8YdYDnsi (accessed on 2 December 2018).
- Internal materials of TECHNOPARK GLIWICE. Gliwice, Poland, 2016.
- Nadzeja, K.; Mohammad, S.K.; Gustafsson, V. Born globals and business incubators: A case analysis. Int. J. Organ. Anal. 2018, 3, 490–517. [Google Scholar] [CrossRef]
- Ochwat, T. Model wsparcia i koordynacji współpracy pomiędzy biznesem a sektorem nauki, realizowany przez Śląski Park Przemysłowo-Technologiczny i Rudzki Inkubator Przedsiębiorczości. Prace Naukowe/Uniwersytet Ekonomiczny w Katowicach 2013, 4, 85–98. [Google Scholar]
- Wolniak, R.; Skotnicka-Zasadzień, B. The use of value stream mapping to introduction of organizational innovation in industry. Metalurgija 2014, 53, 709–712. [Google Scholar]


| Set of Indicators | Indicators |
|---|---|
| Social Indicators |
|
| Organizational/Technical Indicators |
|
| Scientific/Technical Indicators |
|
| Financial Indicators |
|
| Indicators | Method of Assessment of the Indicators’ Assessment | Assessment Number |
|---|---|---|
| The number of new jobs created by start-up companies during the incubation period (1–3 years). | This indicator was assessed by administering the survey and conducting interviews with companies in the incubation stage. | 30 jobs over 3-year incubation period 10 jobs/year(average) |
| The number of jobs created by new companies during the post-incubation period (3–6 years). | This indicator was assessed by administering the survey and conducting interviews with companies in the post incubation stage. | 18 jobs over 3-year post-incubation period. 6 jobs/year(average) |
| The number of students finding part-time employment or paid internship in start-up companies. | This indicator was assessed by administering the survey and conducting interviews with companies in the incubation stage. | 20 students over 3-year incubation period. 6.66 students/year (average) |
| The number of graduates finding full-time employment in start-up companies during the incubation period (1–3 years). | This indicator was assessed by administering the survey and conducting interviews with companies in the incubation stage. | 0 (none) |
| The number of graduates finding full-time employment in new companies in the post-incubation period (3–6 years). | This indicator was assessed by administering the survey and conducting interviews with companies in the post incubation stage. | 2 jobs over 3-year post-incubation period. 0.66 jobs/year(average) |
| The percentage of start-up companies owned by women. | This indicator was assessed by conducting interviews with the personnel of the business incubator center. Business Incubator Center in Hazleton is in possession of the statistical data. That statistical data is collected by CAN-BE to be included in the proposals for public funding. | 8% |
| The percentage of start-up companies owned by underrepresented minorities. | This indicator was assessed by conducting interviews with the personnel of the business incubator center. Business Incubator Center in Hazleton is in possession of the statistical data. That statistical data is collected by CAN-BE to be included in the proposals for public funding. | 8% |
| The percentage of start-up companies owned by immigrants. | This indicator was assessed by conducting interviews with the personnel of the business incubator center. Business Incubator Center in Hazleton is in possession of the statistical data. That statistical data is collected by CAN-BE to be included in the proposals for public funding. | 8% |
| Indicators | Method of Assessment of the Indicators’ Assessment | Assessment Number |
|---|---|---|
| Annual number of clients receiving help from the business incubator center related to the evaluation of an invention/business idea during the beginning stage. | This indicator was determined by interview with personnel of the business incubator center. Business incubator center is keeping record of this data and using them when applying for public funding. | 90 (average) |
| Annual number of clients receiving help from the business incubator center related to the development of a business plan or business model (before the incubation stage). | This indicator was determined by interview with personnel of the business incubator center. Business incubator center is keeping record of this data and using them when applying for public funding. | 50 (average) |
| Number of start-up companies during the incubation period (1–3 years) and their success rate, that is, the percentage of companies who have graduated from the business incubator center. | This indicator was determined by interview with personnel of the business incubator center. Business incubator center is keeping record of this data and using them when applying for public funding. | 12 companies 66% success rate |
| Number of companies receiving assistance from the business incubator center during the post-incubation stage (3–6 years). | This indicator was determined by interview with personnel of the business incubator center. Business incubator center is keeping record of this data and using them when applying for public funding. | 8 companies |
| Number of full-time staff employed by the business incubator center. | Taken from the directory of the business incubator center. | 2 full-time staff |
| Number of weekly hours that the staff of the business incubator center is available. | As posted in the business incubator center. | 40 h weekly |
| Indicators | Method of Assessment of the Indicators’ Assessment | Assessment Number |
|---|---|---|
| Number of faculty from the local university cooperating with the volunteers at the business incubator center. | This indicator was determined by administering the survey and interview with faculty, students, volunteers, and the personnel of the business incubator center. | 4 faculty |
| Annual number of students doing projects which benefit start-up companies in the business incubator center. | This indicator was determined by administering the survey and interview with faculty, students, volunteers, and the personnel of the business incubator center. | 35–40 students |
| Number of providing services to the business incubator center, engineers, lawyers, accountants, business leaders, etc. | This indicator was determined by administering the survey and interview with faculty, students, volunteers, and the personnel of the business incubator center. | 10–15 volunteers |
| Annual number of innovative projects/technologies implemented by start-up companies. | Determined by administering the survey and interview with tenant companies of the business incubator center. | 8 innovative projects Annually |
| Annual number of training workshops for new entrepreneurs sponsored by the business incubator center (or annual number of participants attending those workshops). | This data is available in statistics of the business incubator center. | 120 participants annually |
| Indicators | Method of Assessment of the Indicators’ Assessment | Assessment Number |
|---|---|---|
| Average cost of creating a new job by a start-up company during the incubation stage. | Cost of operating the business incubator divided by the number of jobs created (annually). | $21,000/job |
| Annual budget of the business incubator center and level of subsidy from public and private sources. | Budget of CAN-BE incubator center is available to the public. | $210,000 Annually |
| Cost of services provided by the business incubator center. | Provided by business incubator center | Up to 1000 $/month per firm |
| Tax incentives for start-up companies during the incubation stage and post-incubation stage. | Companies in CAN-BE business incubator center are released from paying taxes over a period of 10 years. | Released from paying any corporate income taxes for 10 years |
| Annual level of subsidy for start-up companies from regional workforce development funds or economic development funds. | Determined by interview with tenant companies in CAN-BE business incubator center. | $4000/new created job |
| Indicators | Method of Assessment of the Indicators’ Assessment | Assessment Number |
|---|---|---|
| The number of new jobs created by start-up companies during the incubation period (1–3 years). | This indicator was assessed by administering the survey and conducting interviews with companies in the incubation stage. | 36 jobs over 3-year incubation period 12 jobs/year (average) |
| The number of jobs created by new companies during the post-incubation period (3–6 years). | This indicator was assessed by administering the survey and conducting interviews with companies in the post incubation stage. | 16 jobs over 3-year post-incubation period. 5.3 jobs/year (average) |
| The number of students finding part-time employment or paid internship in start-up companies. | This indicator was assessed by administering the survey and conducting interviews with companies in the incubation stage. | 15 students over 3-year incubation period. 5 students/year (average) |
| The number of graduates finding full-time employment in start-up companies during the incubation period (1–3 years). | This indicator was assessed by administering the survey and conducting interviews with companies in the incubation stage. | 8 graduates over 3-year incubation period. 2.7 graduates/year |
| The number of graduates finding full-time employment in new companies in the post-incubation period (3–6 years). | This indicator was assessed by administering the survey and conducting interviews with companies in the post incubation stage. | 4 jobs over 3-year post-incubation period. 1.33 jobs/year (average) |
| The percentage of start-up companies owned by women. | This indicator was assessed by administering the survey and conducting interviews with the personnel at the business incubator center. | 5% |
| The percentage of start-up companies owned by underrepresented minorities. | N/A | N/A |
| The percentage of start-up companies owned by immigrants. | N/A | N/A |
| Indicators | Method of Assessment of the Indicators’ Assessment | Assessment Number |
|---|---|---|
| Annual number of clients receiving help from the business incubator center related to the evaluation of an invention/business idea during the beginning stage. | This indicator was determined by interview with personnel of the business incubator center. Business incubator center is keeping record of this data and using them when applying for public funding. | 100 clients |
| Annual number of clients receiving help from the business incubator center related to the development of a business plan or business model (before the incubation stage). | This indicator was determined by interview with personnel of the business incubator center. Business incubator center is keeping record of this data and using them when applying for public funding. | 35 clients |
| Number of start-up companies during the incubation period (1–3 years) and their success rate, that is, the percentage of companies who have graduated from the business incubator center. | This indicator was determined by interview with personnel of the business incubator center. Business incubator center is keeping record of this data and using them when applying for public funding. | 12 companies 91.7% success rate |
| Number of companies receiving assistance from the business incubator center during the post-incubation stage (3–6 years). | This indicator was determined by interview with personnel of the business incubator center. Business incubator center keeps a record of this data and uses them when applying for funding. | 11 companies |
| Number of full-time staff employed by the business incubator center. | Taken from the directory of the business incubator center. | 8 |
| Number of weekly hours that the staff of the business incubator center is available. | As posted in the business incubator center. | 80 |
| Indicators | Method of Assessment of the Indicators’ Assessment | Assessment Number |
|---|---|---|
| Number of faculty from the local university cooperating with the business incubator center. | This indicator was determined by administering the survey and interview with faculty, students, volunteers, and the personnel of the business incubator center. | 0—Politechnika Śląska does not have any full-time faculty maintaining a presence at the incubator. |
| Annual number of students doing projects which benefit start-up companies in the business incubator center. | This indicator was determined by administering the survey and interview with faculty, students, volunteers, and the personnel of the business incubator center. | 3–4 students |
| Number of volunteers providing services to the business incubator center, engineers, lawyers, accountants, business leaders, etc. | This indicator was determined by administering the survey and interview with faculty, students, volunteers, and the personnel of the business incubator center. | 6 volunteers |
| Annual number of innovative projects/technologies implemented by start-up companies. | Determined by administering the survey and interview with tenet companies of the business incubator center. | 20 projects/technologies |
| Annual number of training workshops for new entrepreneurs sponsored by the business incubator center (or annual number of participants attending those workshops). | This data is available in statistics of the business incubator center. | 100 participants annually |
| Indicators | Method of Assessment of the Indicators’ Assessment | Assessment Number |
|---|---|---|
| Average cost of creating a new job by a start-up company during the incubation stage. | Cost of operating the business incubator divided by the number of jobs created (annually). | $4200/job (17,000 zl/job) |
| Annual budget of the business incubator center and level of subsidy from public and private sources. | Budget of Technopark incubator center. | $50,000 Annually (200,000 zl Annually) |
| Cost of services provided by the business incubator center. | Provided by business incubator center | Up to 350 $/month per firm |
| Tax incentives for start-up companies during the incubation stage and post-incubation stage. | No tax incentives. | None |
| Annual level of subsidy for start-up companies from regional workforce development funds or economic development funds. | Determined by interview with tenant companies in Technopark business incubator center. | None |
| Indicators | CAN-BE Hazleton | Technopark Gliwice | Comparison |
|---|---|---|---|
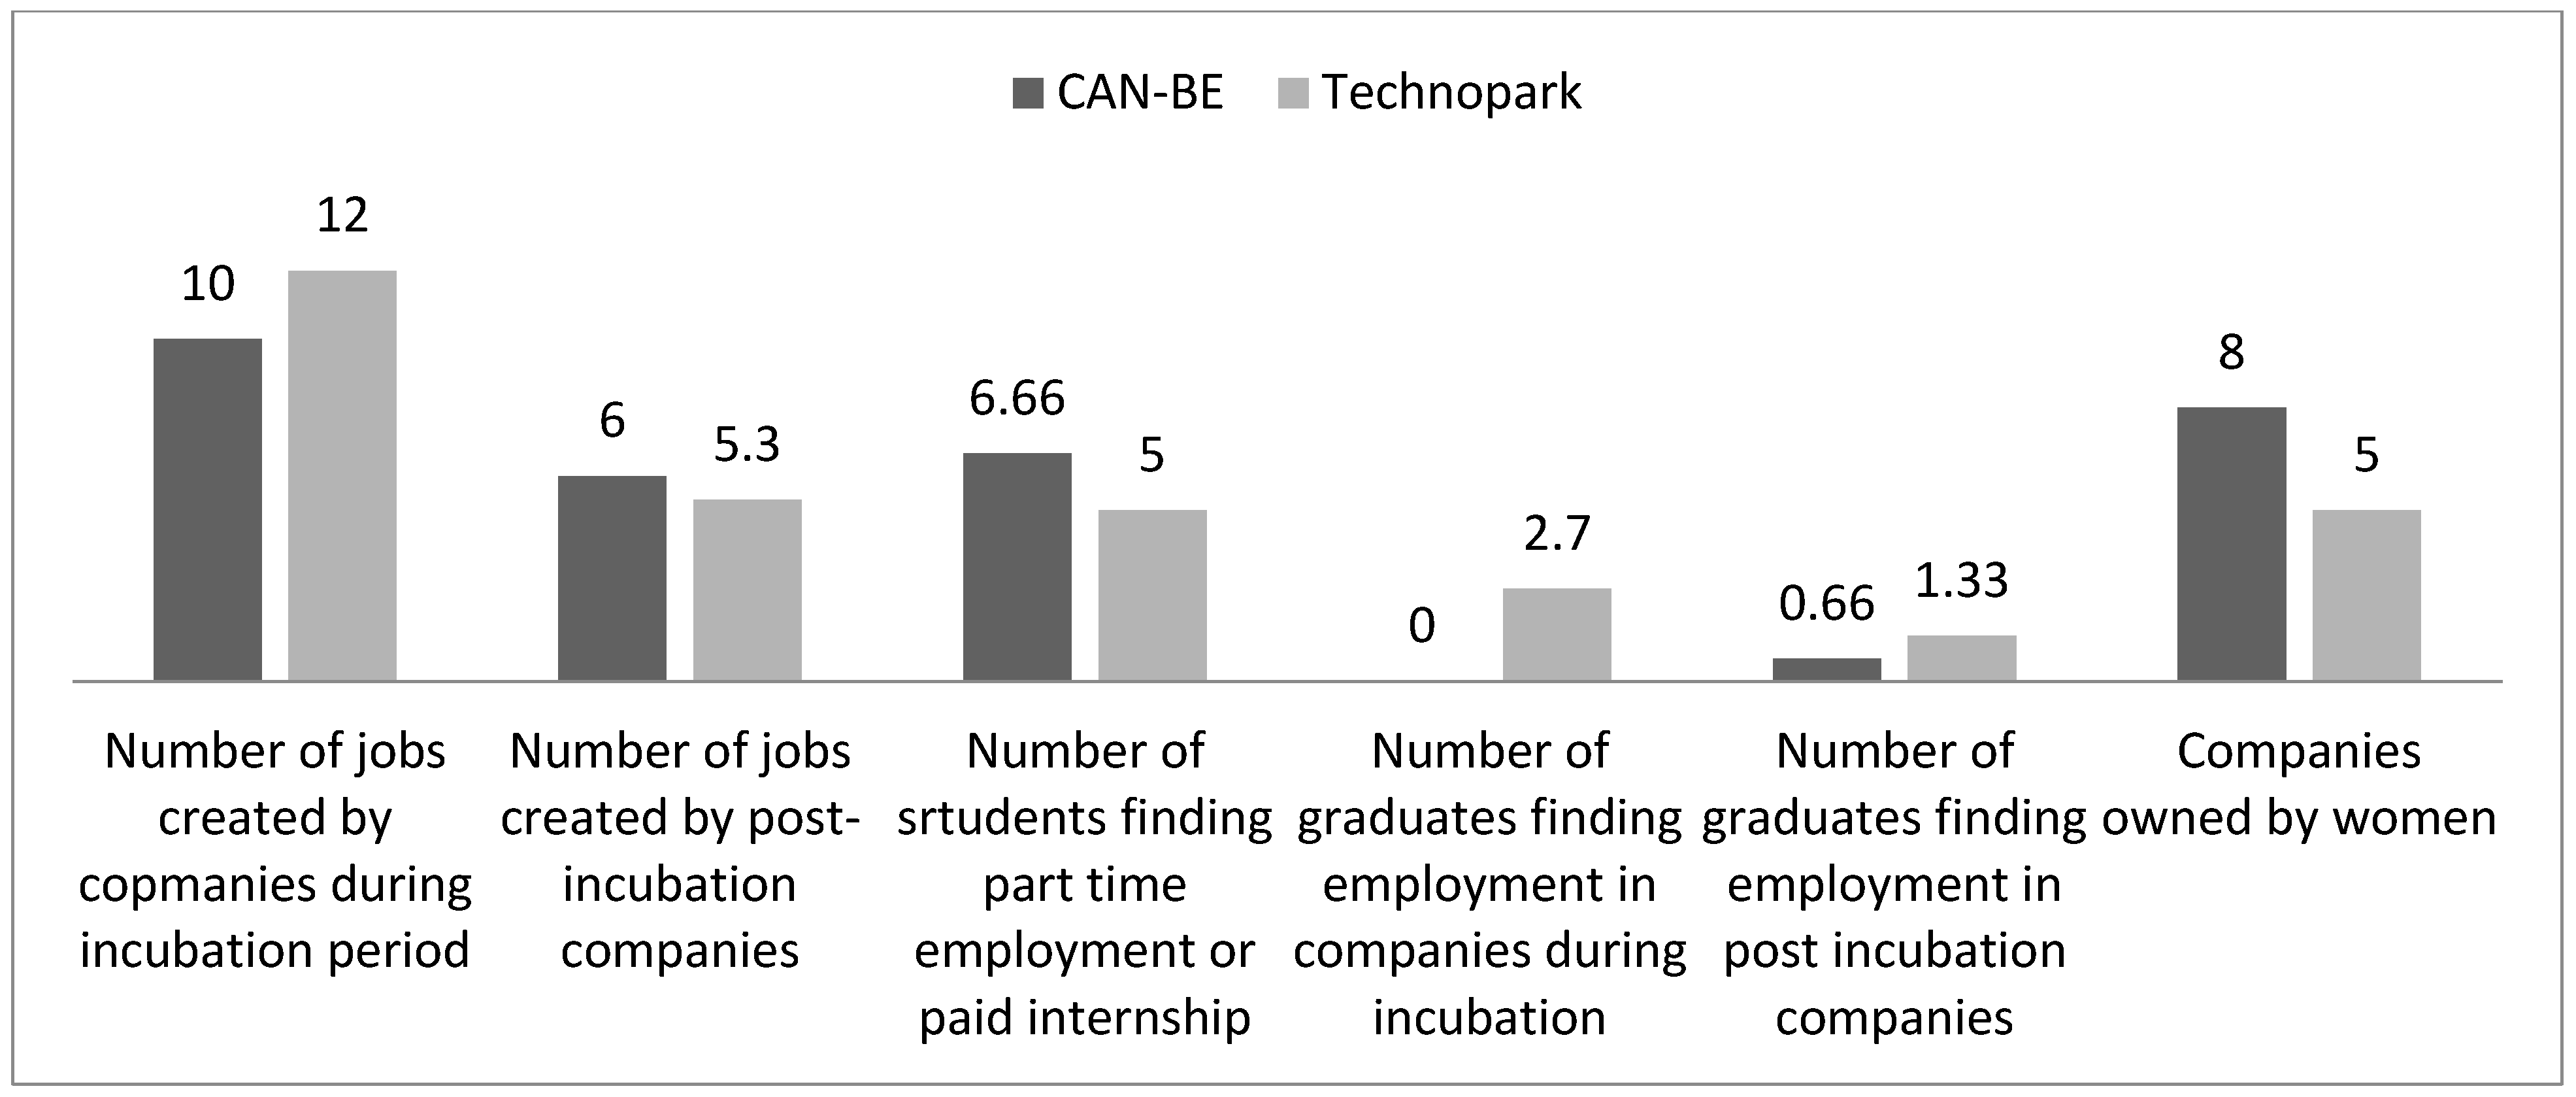
| The number of new jobs created by start-up companies during the incubation period (1–3 years). | 10 jobs/year (average) | 12 jobs/year (average) | Technopark 2 more |
| The number of jobs created by new companies during the post-incubation period (3–6 years). | 6 jobs/year (average) | 5.3 jobs/year (average) | CAN-BE 0.7 more |
| The number of students finding part-time employment or paid internship in start-up companies. | 6.66 students/year | 5 students/year | CAN-BE 1.33 more |
| The number of graduates finding full-time employment in start-up companies during the incubation period (1–3 years). | 0 graduates | 2.7 graduates | Technopark 2.7 more |
| The number of graduates finding full-time employment in new companies in the post-incubation period (3–6 years). | 0.66 graduates | 1.33 graduates | Technopark 0.66 more |
| The percentage of start-up companies owned by women. | 8% | 5% | CAN-BE 3% more |
| The percentage of start-up companies owned by underrepresented minorities. | 8% | N/A | N/A |
| The percentage of start-up companies owned by immigrants. | 8% | N/A | N/A |
| Indicators | CAN-BE Hazleton | Technopark Gliwice | Comparison |
|---|---|---|---|
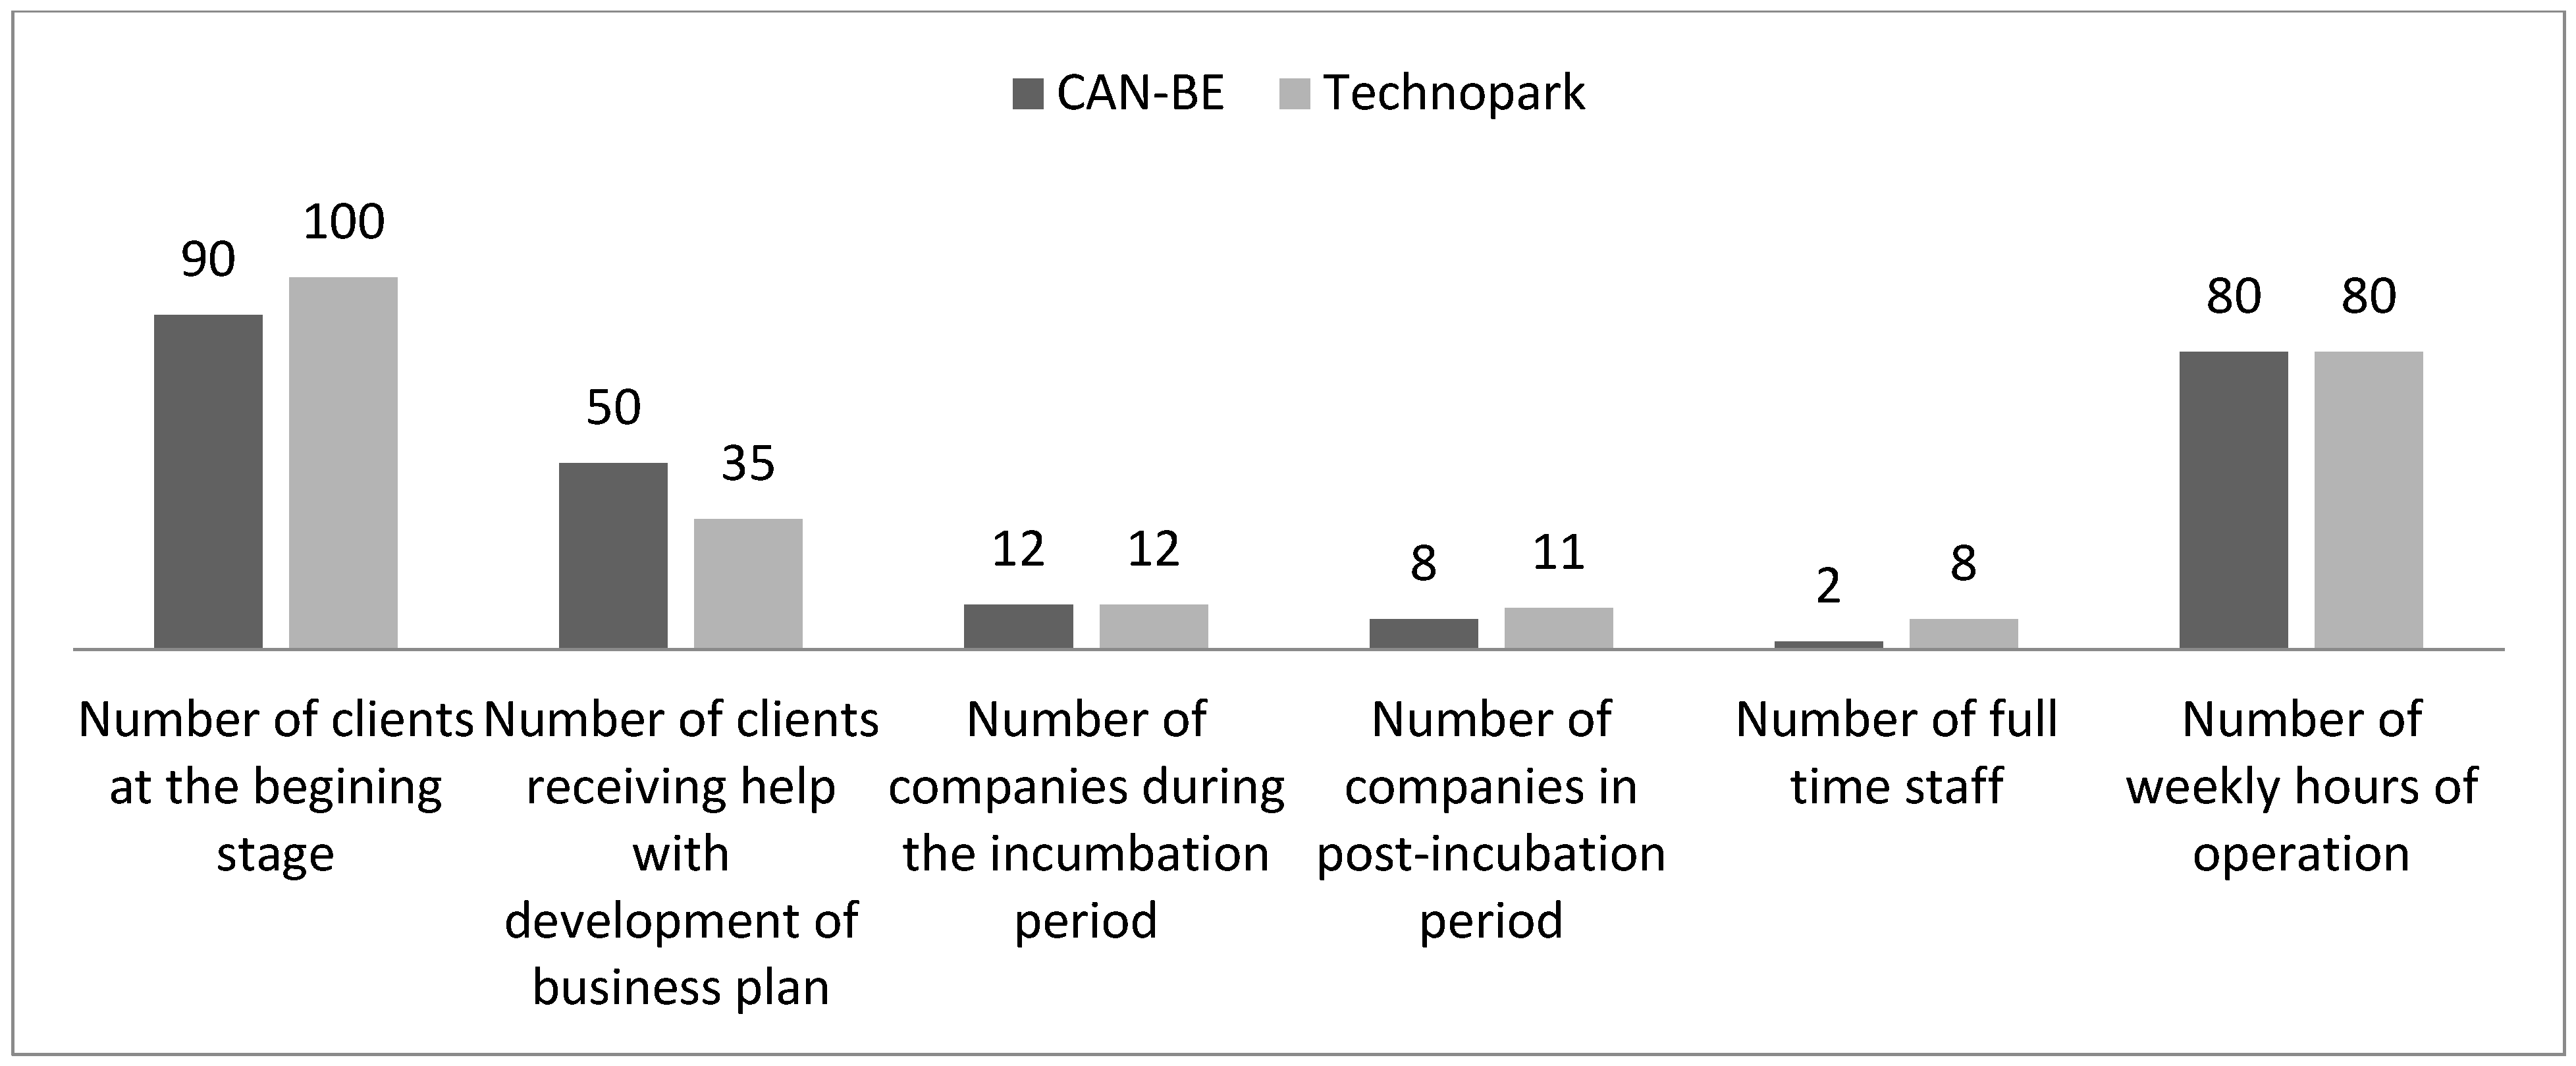
| Annual number of clients receiving help from the business incubator center related to the evaluation of an invention/business idea during the beginning stage. | 90 clients | 100 clients | Technopark 10 more |
| Annual number of clients receiving help from the business incubator center related to the development of a business plan or business model (before the incubation stage). | 50 clients | 35 clients | CAN-BE 15 more |
| Number of start-up companies during the incubation period (1–3 years) and their success rate, that is, the percentage of companies who have graduated from the business incubator center. | 12 companies 66% success rate | 12 companies 91.7% success rate | Technopark 25.7% more |
| Number of companies receiving assistance from the business incubator center during the post-incubation stage (3–6 years). | 8 companies | 11 companies | Technopark 3 more |
| Number of full-time staff employed by the business incubator center. | 2 full-time | 8 full-time | Technopark 6 more |
| Number of weekly hours that the staff of the business incubator center is available. | 40 h/week | 80 h/week | Technopark 40 h/week more |
| Indicators | CAN-BE Hazleton | Technopark Gliwice | Comparison |
|---|---|---|---|
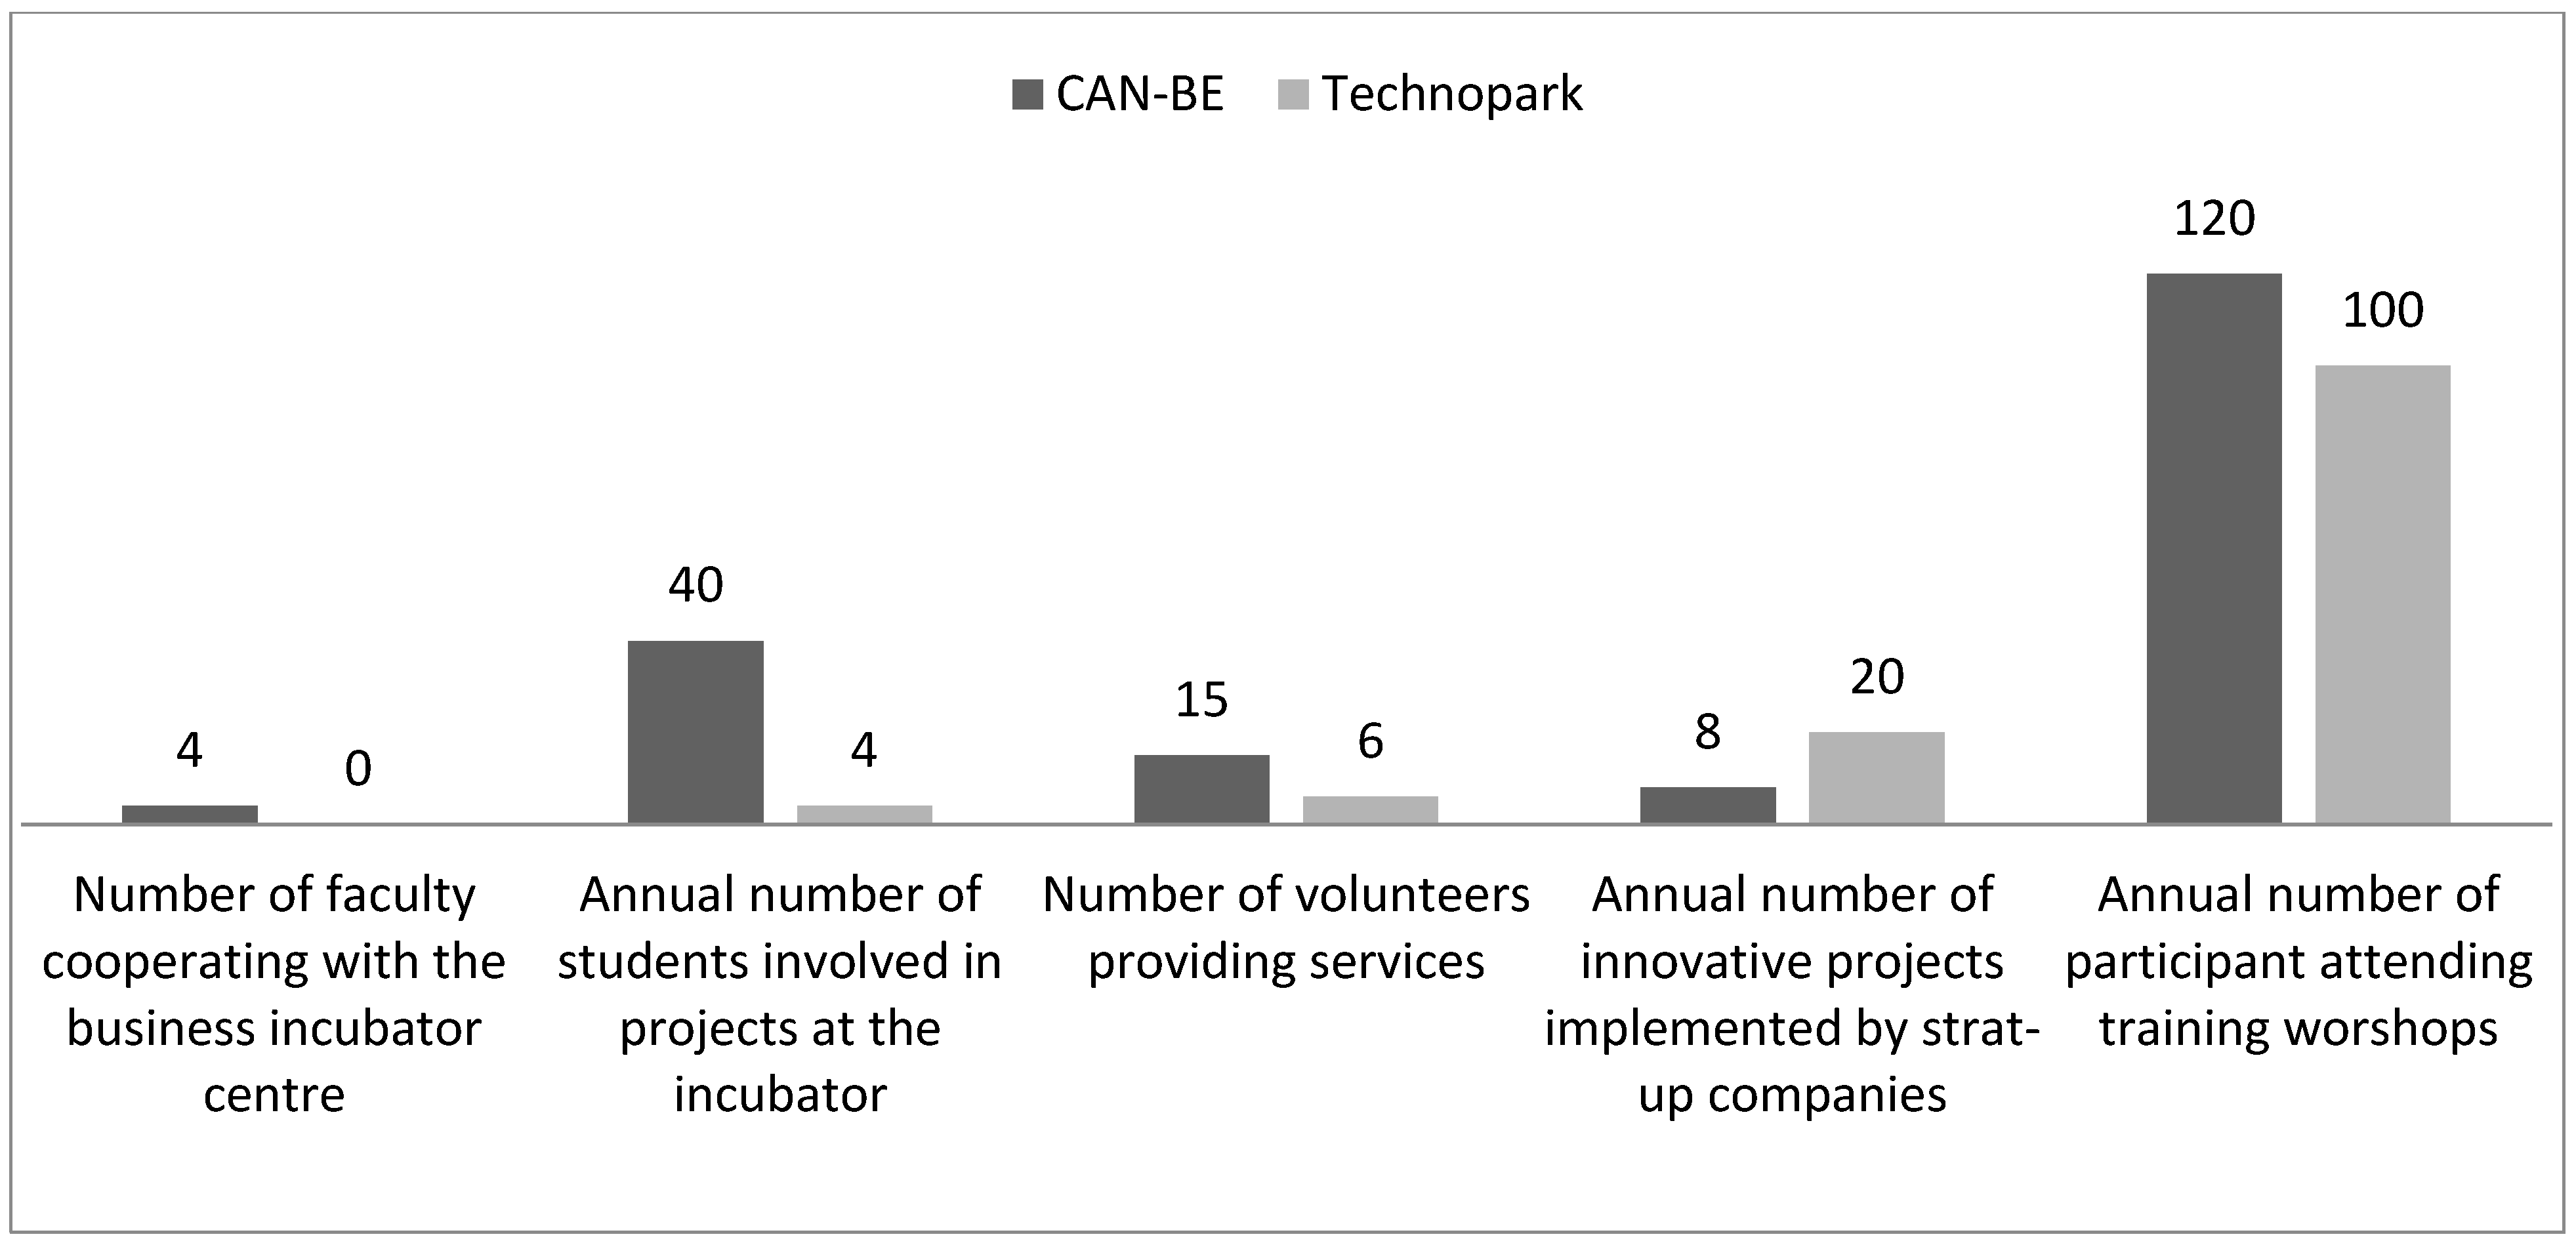
| Number of faculty from the local university cooperating with the business incubator center. | 4 faculty | 0 faculty | CAN-BE 4 more |
| Annual number of students doing projects which benefit start-up companies in the business incubator center. | 35–40 students | 3–4 students | CAN-BE 31–37 more |
| Number of volunteers providing services to the business incubator center, engineers, lawyers, accountants, business leaders, etc. | 10–15 volunteers | 6 volunteers | CAN-BE 4–9 more |
| Annual number of innovative projects/technologies implemented by start-up companies. | 8 projects | 20 projects | Technopark 12 more |
| Annual number of training workshops for new entrepreneurs sponsored by the business incubator center (or annual number of participants attending those workshops). | 120 participants | 100 participants | CAN-BE 20 more |
| Indicators | CAN-BE Hazleton | Technopark Gliwice | Comparison |
|---|---|---|---|
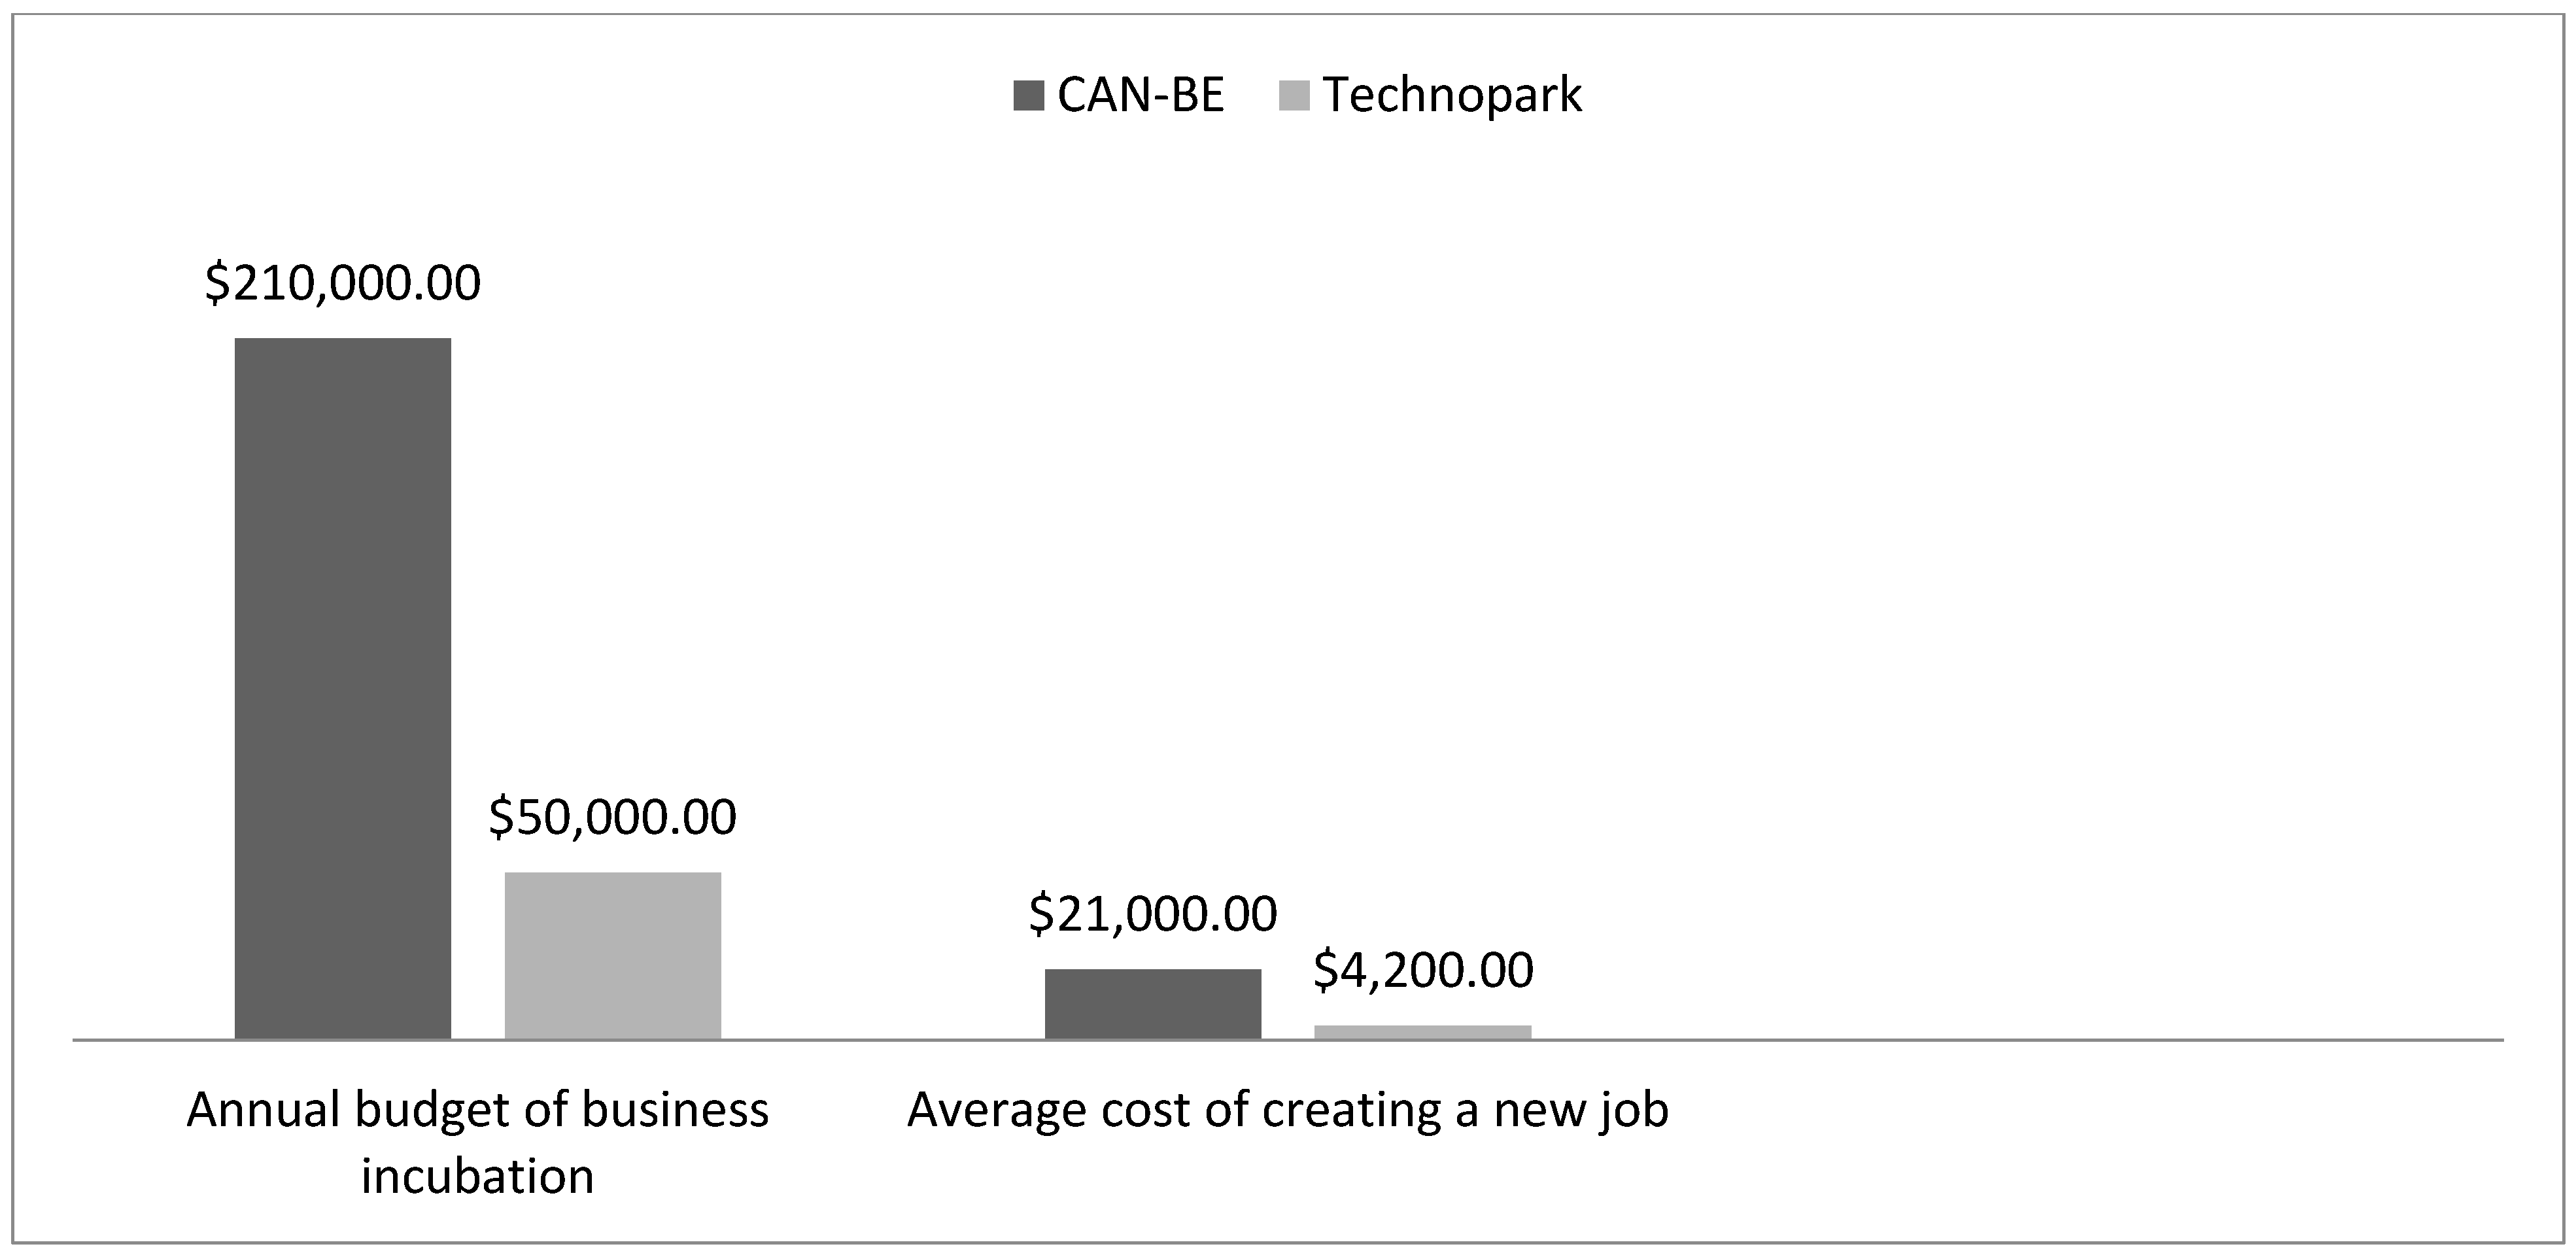
| Average cost of creating a new job by a start-up company during the incubation stage. | $21,000/year | $4200/year (17,000 zl/year) | CAN-BE $16,800 more |
| Annual budget of the business incubator center and level of subsidy from public and private sources. | $210,000/year | $50,000/year 200,000 zl/year | CAN-BE $160,000 more |
| Cost of services provided by the business incubator center. | very similar | ||
| Tax incentives for start-up companies during the incubation stage and post-incubation stage. | Released from paying any corporate income taxes for 10 years | None | N/A |
| Annual level of subsidy for start-up companies from regional workforce development funds or economic development funds. | $4000/new created job | None | N/A |
© 2018 by the authors. Licensee MDPI, Basel, Switzerland. This article is an open access article distributed under the terms and conditions of the Creative Commons Attribution (CC BY) license (http://creativecommons.org/licenses/by/4.0/).
Share and Cite
Olkiewicz, M.; Wolniak, R.; Eva-Grebski, M.; Olkiewicz, A. Comparative Analysis of the Impact of the Business Incubator Center on the Economic Sustainable Development of Regions in USA and Poland. Sustainability 2019, 11, 173. https://doi.org/10.3390/su11010173
Olkiewicz M, Wolniak R, Eva-Grebski M, Olkiewicz A. Comparative Analysis of the Impact of the Business Incubator Center on the Economic Sustainable Development of Regions in USA and Poland. Sustainability. 2019; 11(1):173. https://doi.org/10.3390/su11010173
Chicago/Turabian StyleOlkiewicz, Marcin, Radosław Wolniak, Michaline Eva-Grebski, and Anna Olkiewicz. 2019. "Comparative Analysis of the Impact of the Business Incubator Center on the Economic Sustainable Development of Regions in USA and Poland" Sustainability 11, no. 1: 173. https://doi.org/10.3390/su11010173
APA StyleOlkiewicz, M., Wolniak, R., Eva-Grebski, M., & Olkiewicz, A. (2019). Comparative Analysis of the Impact of the Business Incubator Center on the Economic Sustainable Development of Regions in USA and Poland. Sustainability, 11(1), 173. https://doi.org/10.3390/su11010173