Article

Solubility, Diffusion and Crop Uptake of Phosphorus in Three Different Struvites

1
College of Agriculture Luiz de Queiroz, ESALQ-USP, Av. Padua Dias, Piracicaba-SP 11. 13418-900, Brazil
2
Lancaster Environment Centre, Lancaster LA1 4YQ, UK
3
Environment Center Wales, Bangor University, Bangor, Gwynedd LL57 2UW, UK
4
UWA School of Agriculture and Environment, University of Western Australia, Crawley, WA 6009, Australia
*
Author to whom correspondence should be addressed.
Sustainability 2019, 11(1), 134; https://doi.org/10.3390/su11010134
Submission received: 13 October 2018 / Revised: 11 December 2018 / Accepted: 20 December 2018 / Published: 27 December 2018
(This article belongs to the Section Sustainable Agriculture)

Abstract

:
Phosphate (P) fertilisers produced from waste recycling (e.g., struvite) are considered to be more sustainable than those conventionally produced from the processing of rock P (e.g., highly soluble triple superphosphate, TSP). In this study, we used 33P to monitor struvite dissolution and P diffusion into the soil in comparison to TSP. We evaluated three distinct chemical formulations of struvite, namely: (1) Crystal Green® (CG) produced in an industrial process from sewage sludge; (2) natural struvite (NS) precipitated in swine manure pipelines; and (3) laboratory precipitated struvite (PS) from chicken manure by a new process of P recovery. P diffusion was evaluated in soil columns over a 21-day period. This was complimented with a pot experiment in which wheat and soybean were cultivated in a Eutric Cambisol for 38 days in the presence of either struvite or TSP. P fertilisers were applied at a dose equivalent to 17.5 kg P ha−1 and fertiliser solubility determined by recovering soil solution. All three types of struvite tested showed reduced P solubility and mobility relative to TSP, but a comparison of the three struvites has shown that their P solubilities differed by a factor of two, with the greatest P release (up to 85% of total P) obtained from a struvite recovered from poultry manure and containing other useful nutrients (K, S and Ca). All struvites enhanced crop growth and P uptake of wheat and soybean relative to a nil P control, with up to 80% P recovery compared to TSP. These results further support the more widespread use of struvite as a sustainable source of P to plants despite its low water solubility.

1. Introduction

Phosphorus (P) is a major nutrient limiting crop production in many regions of the world [1]. Although this limitation can be alleviated through the addition of mineral P fertilisers, this process is relatively inefficient in the season of application with only small amounts of the fertiliser P (usually 10 to 30%) recovered in the crop [2]. This inefficiency arises due to the strong sorption of P to the surfaces of Fe and Al oxyhydroxides, or due to the precipitation of the added P with Fe, Al and Ca, leading to the production of insoluble minerals [3]. These P immobilization processes greatly reduce the rate of P diffusion through the soil matrix to the root surface [4], with the amount reaching the root dependent on soil mineralogy, clay content, P concentration, as well as soil moisture and soil density [5].
According to general predictions, rock P is considered a strategic resource whose supply could become severely limited in the future due to geopolitical concerns (rock P reserves are held in only a few countries), and volatile pricing affecting the vulnerability of P supply [6,7]. One option to reduce this P vulnerability and improve the sustainability of P use in agriculture is to recover and recycle P from waste streams as a fertiliser substitute. The number of studies evaluating new fertilisers derived from recycled animal and human waste has risen considerably in recent years [8,9,10]. For example, struvite has been used to recover P from human-derived wastewater [11], and more recently from animal waste and other bioresources [10,12]. Struvite is a white crystalline substance consisting of Mg, NH4+ and P [13,14], and is commonly referred to as magnesium ammonium phosphate. However, the NH4+ component of its structure can be readily replaced by K when this ion is present in high concentrations in solution. In this way, potassium struvite can be formed (MgKPO4 · 6H2O) [15,16]. Besides P, the solubilisation of struvite is also an important source of Mg and K/NH4 for crop plants.
In general, struvite has very low solubility in water, especially in high pH soils, as shown by a gradual decrease in its solubility from pH 7.0 to 8.5 [17]. However, less is known about the general solubility and release of P from different sources of this recovered mineral under more acidic soil pH conditions and in the presence of organic acids, or whether P release rates are sufficient to meet the P demands of a growing crop, especially in the early stages of crop growth [18]. Due to its lower solubility compared to fertilisers such as triple superphosphate (TSP) or monoammonium phosphate (MAP), commercial struvite is frequently marketed as a slow release fertiliser, although its P concentration (7–18% by weight) is very similar to single superphosphate (SSP) or TSP [9,19]. Previous studies with ryegrass and wheat have shown that the slow release of P in struvite may not be capable of meeting plant P demand, especially in the early stages of crop development when the establishment of a healthy root system is important for optimising yield and uptake of other nutrients and water [10,20]. A better understanding of its solubility characteristics is also important for optimizing its potential blending with conventional fast-release P fertilisers [20].
Plants have evolved a range of mechanisms to improve the acquisition of P from soil/fertiliser including (i) the exudation of organic acids, phosphatases and H+ into the soil; (ii) the formation of mycorrhizal symbioses; (iii) inducing shifts in the rhizosphere microbiome to promote the activity of P solubilizing bacteria; (iv) upregulating P transport systems; and (v) increasing root hair density and changing root architecture [21]. The pH change in the rhizosphere, reported to be as much as one unit, may have far reaching implications for a host of rhizosphere processes [22]. In particular, the role of different low molecular weight organic acids (LMWOAs) in mineral solubilisation (e.g., citrate) and chemical precipitation reactions (e.g., Ca-oxalate) has been intensively studied [23]. These organic acids are generally found in low concentrations in soil solution (<50 μM), but may have much higher concentrations in the vicinity of the rhizosphere (1–10 mM) [24]. They may assist in the solubilisation of phosphate minerals via ligand exchange on the mineral surface or by precipitating cations in solution which increases the diffusion gradient in solution at the mineral surface [25]. In this way, LMWOAs such as citric and malic acid can help in the solubilisation of minerals such as struvite, since they can form complexes with Mg2+, and to a much lesser extent NH4+ [26]. The complexes between the conjugated bases of the organic acids and the solution ions, usually formed by weak bonds, result in the subsequent release of NH4+ and Mg2+ from the mineral surface [23].
Our hypothesis was that struvite precipitated from manure by a new recovery process including burning and acid dissolution is more soluble and more efficient at supplying P synchronized to crop cycle demand compared to precipitated struvites from sludge or natural precipitation, thereby minimizing environmental contamination risks. To better understand the behaviour of struvite in the plant-soil system, the aims of this study were: (i) to compare the speed of P diffusion through the soil following the addition of either struvite or triple superphosphate (TSP) based fertilisers; (ii) evaluate the solubilisation of three contrasting struvite forms in soil, namely: 1) Crystal Green® struvite produced from commercial sewage sludge processing; 2) struvite naturally precipitated in swine manure pipelines; and 3) a novel laboratory-precipitated struvite produced from chicken manure; and (iii) evaluate the agronomic performance of the three struvites in comparison to TSP in wheat and soybean growth trials.

2. Materials and Methods

2.1. Soil Characterization

Soil used for pot and lab trials was collected in one specific spot from the superficial A horizon (0–20 cm) of a lowland (15 m altitude), freely-draining, sheep-grazed grassland soil (US Soil Taxonomy, Typic Dystrochrept; FAO, Eutric Cambisol) which receives regular fertilization (120 kg N, 60 kg K and 10 kg P y−1) and is located at Abergwyngregyn, North Wales (53°14’N, 4°01’W; temperate climate regime). The sandy loam textured soil supports an established sward (>20 years-old) consisting predominantly of perennial ryegrass (Lolium perenne L.) and clover (Trifolium repens L.). Prior to use, the soil was air-dried, sieved to pass 2 mm and homogenized by hand. To remove any acidity constraint on plant growth, the pH of the soil was raised to pH 6.3 by the addition of agricultural lime following standard agronomic guidelines [27]. After lime application and homogenization, the soil was watered with distilled water and the moisture maintained at a minimum of 60% of water holding capacity at 0 kPa for all experiments.
The main properties of the soil are shown in Table 1. Soil chemical analysis was performed according to Raij et al. [28] while texture was determined by the densimeter method of Embrapa [29] and soil’s water holding capacity at 0 kPa determined according to Rowell [30]. The maximum P sorption capacity of the soil was determined with 33P (111 TBq mmol−1; American Radiolabelled Chemicals, St Louis, MO) using the method described in Oburger et al. [31].

2.2. Struvite Sources and Characterisation

For the plant growth and struvite dissolution experiments, we used three types of struvite, namely: (i) PS - struvite derived from chicken manure in which the struvite was precipitated after nutrient solubilisation by H2SO4 and later neutralised with KOH; (ii) NS—struvite recovered from pipelines used in swine manure wastewater processing (Embrapa Poultry and Swines, Concórdia, SC, Brazil); and (iii) CG—struvite recovered from a large municipal wastewater treatment plant (Crystal Green®; Ostara Nutrient Recovery Technologies, Vancouver, BC, Canada). The elemental composition of the three struvite materials was determined using an AXIOS X-ray fluorescence spectrometer (Malvern Panalytical Ltd., Malvern, UK).
The total P content of the three struvites, the chemical P fractions, as well as pH and salt index, were determined according to Brazilian national guidelines [32]. The P fractions included measurements of (i) citric acid soluble P, (ii) neutral ammonium citrate and water (NAC + H2O) soluble P, and (iii) water soluble P. Their N content was determined using a FlashEA 1112 Elemental Analyzer (Thermo Scientific Inc., Waltham, MA, United States). The chemical properties of the three struvites are summarized in Table 2. Also, in Supplementary Figure S1 more details are provided on the mineralogical composition of each struvite tested here.

2.3. Agronomic Performance of Struvites in Comparison to Triple Superphosphate

To assess the solubilisation and plant acquisition of struvite-derived P, a replicated plant growth trial was set up in a climate-controlled glasshouse (22.5 ± 2.5 °C) over a 6-week period with wheat (Triticum aestivum L. cv. Siskin) and soybean (Glycine max L. cv. Pripyat). Soil (1.4 kg) was placed in polypropylene pots and packed to a bulk density of 1 g cm−3 to reflect natural soil conditions. P fertiliser was then added 3 cm beneath the soil surface at a rate equivalent to 25 mg P pot−1 (~17.5 kg P ha−1) following standard agronomic guidelines [33]. Individual pots (n = 3) received either: (i) triple superphosphate; (ii) PS struvite; (iii) NS struvite; or (iv) CG struvite. All fertilisers were applied in granular form, either as spherical granules (TSP, CG), crystals (NS) or pellets (PS), all of similar size. In addition, a control set of pots (n = 3) was set up to which no P fertiliser was added. All pots were maintained at a minimum of 60% of the maximum water holding capacity at 0 kPa through the duration of the trial by the regular addition of distilled water.
To prevent macronutrient limitation, the wheat pots were fertilised at a rate of 16 kg K ha−1 (in the form of KCl), 30 kg N ha−1 (as NH4NO3) and 10 kg S ha−1 (as CaSO4.2H2O) [28] according to the soil surface of each pot (143 cm2). In comparison, the soybean pots received no additional N but received 40 kg K ha−1 and 45 kg S ha−1. The only exception to this was the PS treatment which received no additional S in the wheat pots and only 30 kg S ha−1 in the soybean pots, as this form of struvite is already rich in soluble S (Table 2).
Following fertiliser addition, the pots were sown with either wheat or soybean. The soybean was pre-inoculated with a commercial Rhizobia mix prior to planting (Soya UK Ltd, Southampton, UK). Germination of both crops began on the third day after planting and on the eighth day the seedlings were thinned, leaving only two plants per pot. The pots were placed in a randomized design with three replicates per treatment.
To recover soil solution from the pots, Rhizon MOM soil water samplers (probe length 5 cm; Rhizosphere Research Products, Wageningen, Netherlands) were inserted into the soil. The Rhizon samplers were placed next to a fertiliser granule (ca. 25 mg fertiliser Rhizon−1) to estimate the relative dissolution rates of the different fertilisers. One hour after adjustment of the soil moisture content to 60% of its water holding capacity, sterile vacuum tubes (9 cm3 volume; Vacutest SRL, Arzergrande, Italy) were coupled to the Rhizon devices and soil solution was recovered over a 24 h period. This procedure was repeated every 4 days for the duration of the 6-week experiment.
At the end of the experiment, the roots were recovered from the soil by washing and the dry matter (DM) of the shoots and roots determined by oven drying (60 °C, 72 h). The plant material was then ground and its P content determined according to Malavolta et al. [34].

2.4. Influence of pH and Organic Acids on Struvite Dissolution

To evaluate the impact of solution pH and organic acids on elemental release rates from the different struvite forms, we firstly ground each struvite to <100 µm with a MM200 ball mill (Retsch GmbH, Haan, Germany). To construct the dissolution apparatus, we firstly densely packed 1 g of glass wool into the bottom of polypropylene syringe barrels (5 cm3; Terumo Europe NV, Leuven, Belgium). Struvite (30 mg) was then placed on top of the glass wool. Solution was then passed over the struvite at a flow rate of 0.25 mL min−1 using an Ismatec® multi-channel peristaltic pump (Cole-Parmer GmbH, Wertheim, Germany) and the successive eluent fractions collected over an 8 h period. Controls contained no struvite.
The leaching solutions consisted of (i) 1 mM Mes-Tris buffer solutions adjusted to pH 4, 5, 6, 7, and 8 with either HCl or NaOH, or (ii) a range of individual organic acids (100 µM) including a monocarboxylic acid (acetate), two dicarboxylic acids (malate and oxalate) and a tricarboxylic acid (citrate). The concentration was chosen based on typical rhizosphere organic acid concentrations for cereal crops [35]. All the organic acids were adjusted to pH 6.0 prior to use to reflect the fact that they are released in the K-form from roots [36]. In addition, an extra treatment included the use of unbuffered citrate (pH 3.9), to simulate the combined effect of rhizosphere acidification and organic acid release. Each treatment was replicated 3 times.
After recovery of the eluents from the leaching columns, the solution P was analysed colorimetrically following the molybdate blue method of Murphy and Riley [37] and NH4+ was analysed according to the salicylate method of Mulvaney [38]. Mg in the eluents was analysed using a SpectrAA 230Z atomic absorption spectrometer (Agilent Inc, Santa Clara, CA, United States).

2.5. Dissolution and Diffusion of Struvite and TSP Derived P in Soil

A microtome approach was used to study the diffusion of P away from the fertilisers when added to the soil. Firstly, we prepared uniformly 33P-labelled struvite by mixing together solutions of NH4H2PO4 (5.75 g · L−1) and MgCl2 (6.66 g · L−1) in a proportion of 1.4:1 (v/v). Subsequently, 33P labelled H3PO4 (185 kBq) was added and the solution mixed at 20 °C for 10 min. To induce struvite precipitation, the pH of the solution was adjusted to 8.5 with 1 M NaOH and the solution stirred for 1 h at 20 °C and then left to stand for 4 h. The precipitate was recovered by filtering through a blue ribbon filter paper and the residue oven dried (40 °C, 24 h) prior to use. To prepare the 33P-labelled commercial TSP fertiliser (200/1000) it was dissolved in distilled water (1:20 w/v) and the solution stirred for 30 min. A quantity of 33P-labelled H3PO4 (185 kBq) was then added to the TSP solution and mixed for 10 min prior to oven drying (80 °C, 24 h) to induce crystallization.
The soil diffusion microcosms were set up by filling 28-mm inner diameter, 50-mm long polypropylene cylinders with air-dried soil (bulk density 1 g · cm−3). To retain the soil, one end of the cylinders was covered with gas-permeable polyvinylidene chloride (PVC) film. Treatments containing 33P-labelled from struvite or TSP (0.25 g column; 40 mg · cm−2) crystals were then spread uniformly over the soil surface at the open end of the soil column (12 replicates per source). The dose was chosen to simulate the conditions around fertiliser granules applied to the field, while the uniform distribution across the column provided a linear P diffusion front away from the added fertiliser. Soil columns (12 replicates) containing no fertiliser were used as a control. The soil columns for each treatment were then placed in a transparent acrylic box in which the base was lined with water-saturated paper towel to maintain a 100% relative humidity atmosphere to minimize the mass flow of water within the columns. The box was then sealed and incubated at 20 °C to reflect early summer field conditions when P fertilisers are often applied.
After either 1, 7, 14 or 21 days, 3 replicates of each treatment were removed from the box and the soil sectioned using a bench-mounted hand microtome (Brunel Microscopes Ltd., Chippenham, UK). The microtome was customised to allow the soil to be extruded from the cylinder in 1 mm slices with an accuracy of 20 µm. Starting at the fertiliser end of the core, soil slices were taken every 1 mm up to 10 mm and then at distances of 15, 20, 25 and 30 mm. Each soil sample (ca. 0.6 g dry weight) was then oven-dried (105 °C, 24 h), ground and sequentially extracted (250 rev · min−1, 30 min), firstly with 0.5 M NaHCO3 (pH 8.5) [39] and then with 1 M HCl [40]. The 33P content in the extracts was then determined using Optiphase HiSafe 3 scintillation fluid (Perkin Elmer Inc., Waltham, MA, USA) and a Wallac 1404 liquid scintillation counter (Perkin Elmer Inc.) equipped with automated quench correction.

2.6. Data and Statistical Analysis

The data from the struvite leaching trials were linearized by ln transformation prior to analysis. Overall treatment differences in all experiments were evaluated by t-tests, one-way ANOVA or by repeated measures ANOVA for time series data. Differences between individual treatments were evaluated with post-hoc Tukey testing. All statistical analysis was carried out using Minitab v18.0 (Minitab Inc., State College, PA, USA) or SISVAR 5.6 [41]. p ≤ 0.05 was used as the cut-off for statistical significance.

3. Results

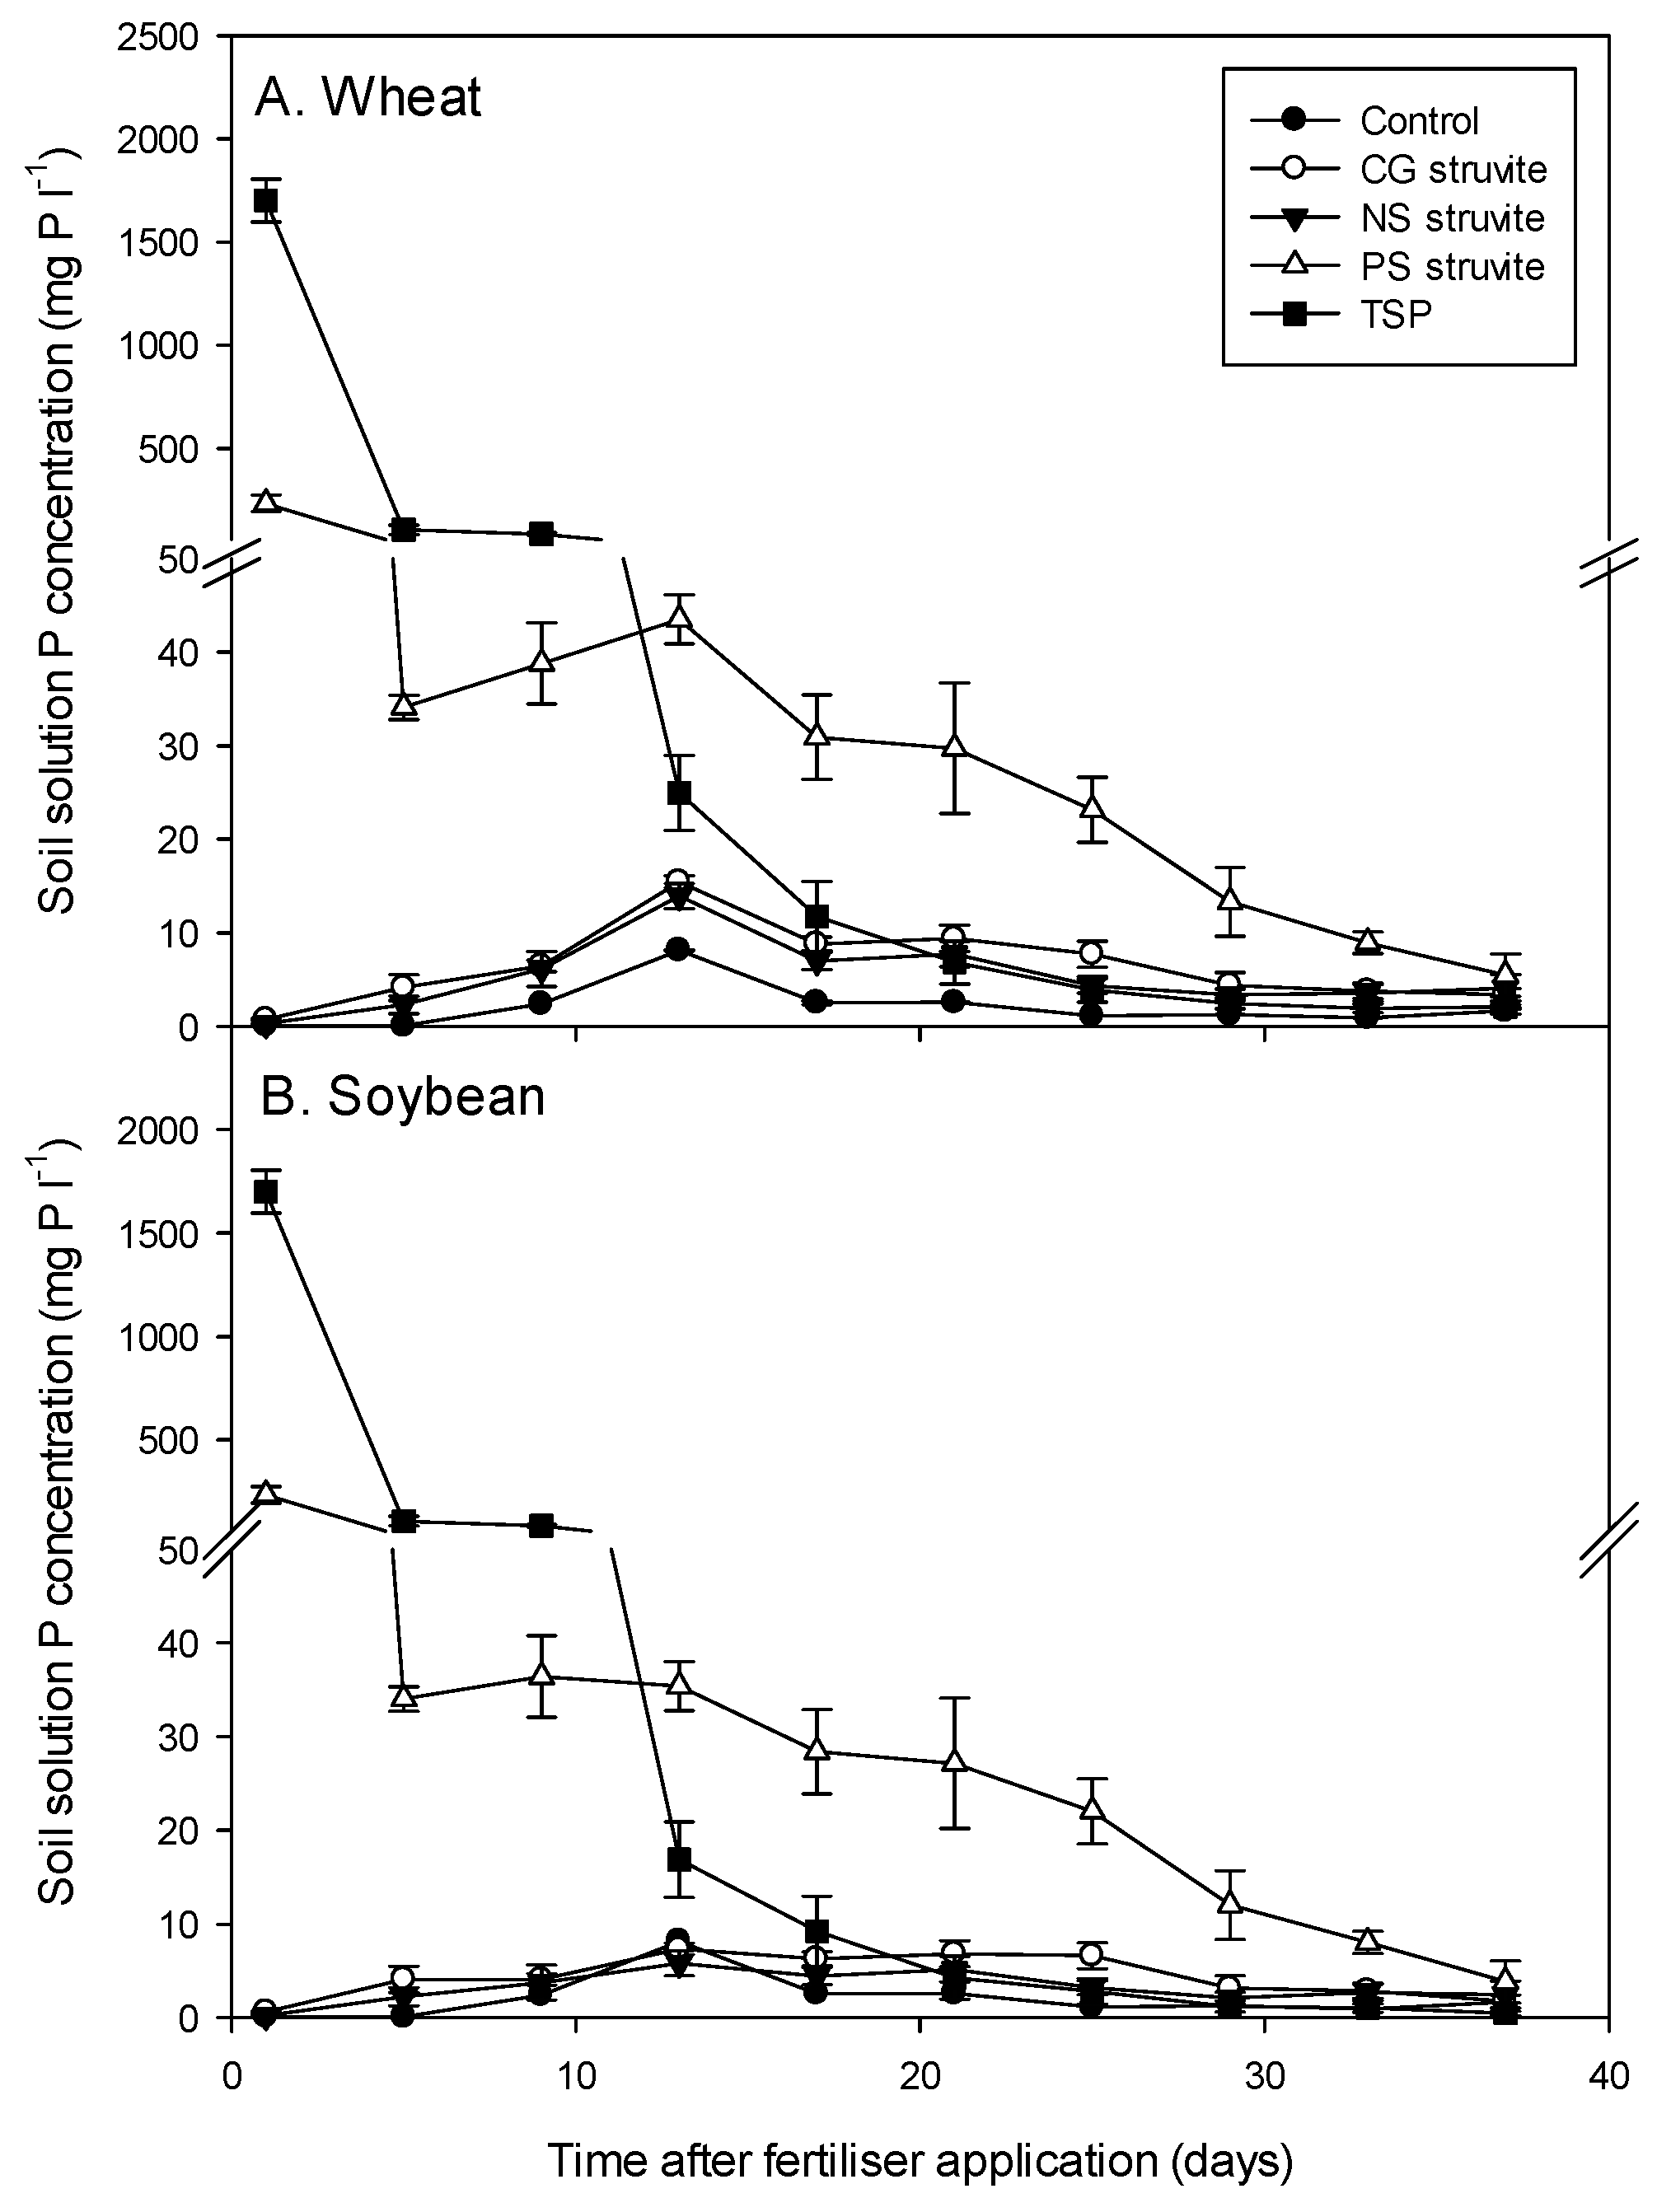
3.1. Solubilisation and Agronomic Performance of Struvites

The solubilisation of the different chemical forms of struvite in comparison to TSP under both wheat and soybean cultivation is shown in Figure 1. Overall, the soil solution P concentrations were very low in the CG and NS struvite treatments (mean 4.75 ± 0.68 mg P L−1), but overall these proved to be statistically higher than in the unfertilised control concentrations (mean 2.08 ± 0.73 mg P L−1; both p < 0.05). Neither of these types of struvite showed a major peak in P release and the granules (CG) or crystals (NS) remained largely intact at the end of the six-week experimental period. In contrast, the PS struvite showed much greater solubility than the CG and NS struvite treatments throughout the experiment (p < 0.001). At day 1, the P concentration in the PS treatment was (ca. 234 and 261 mg P L−1 for wheat and soybean respectively) ~650 times higher than in the CG and NS struvite treatments, however, this gradually fell over the experimental period but still remained 1.7 to 3.5 times higher at the end of the experiment (ca. 3.8 and 16.9 mg P L−1 for wheat and soybean respectively). The highest soil solution P concentrations were seen in the TSP treatment where concentrations peaked at day 1 (1700 and 1518 mg P L−1, respectively) and then progressively declined to near background levels after three weeks (mean 5.5 ± 0.9 mg P L−1). From this time point onwards, the PS struvite treatment maintained the most stable and highest P levels in solution. Overall, the soil solution concentration patterns showed a similar response in both the wheat and soybean treatments (p > 0.05).
The wheat shoot and root DM yield and total P concentration was greatest in the TSP compared to other treatments with no statistical differences apparent between the three different struvite treatments (PS, CG and NS) (Table 3). In general, all treatments accumulated more P from the soil than in the unfertilised control treatment (p < 0.05). For soybean, shoot DM yield, shoot P content and total plant P were found to be similar between TSP and all the struvites tested, being much greater than in the control treatment (p < 0.01). In contrast, root DM and root P concentrations were similar between all treatments and the control. The relative P fertiliser use efficiency (PUE) of the different struvite treatments in relation to TSP (set at 100%), was higher in soybean than in wheat for all sources (Table 3). In general, the struvite sources proved very effective at supplying P for soybean (74–84%), but were less effective for wheat (53–74%), with no significant difference observed between the three struvite sources. Total plant P uptake in the TSP treatment after six weeks was not significantly greater than in the struvite treatments, except in wheat where TSP performed better than CG.

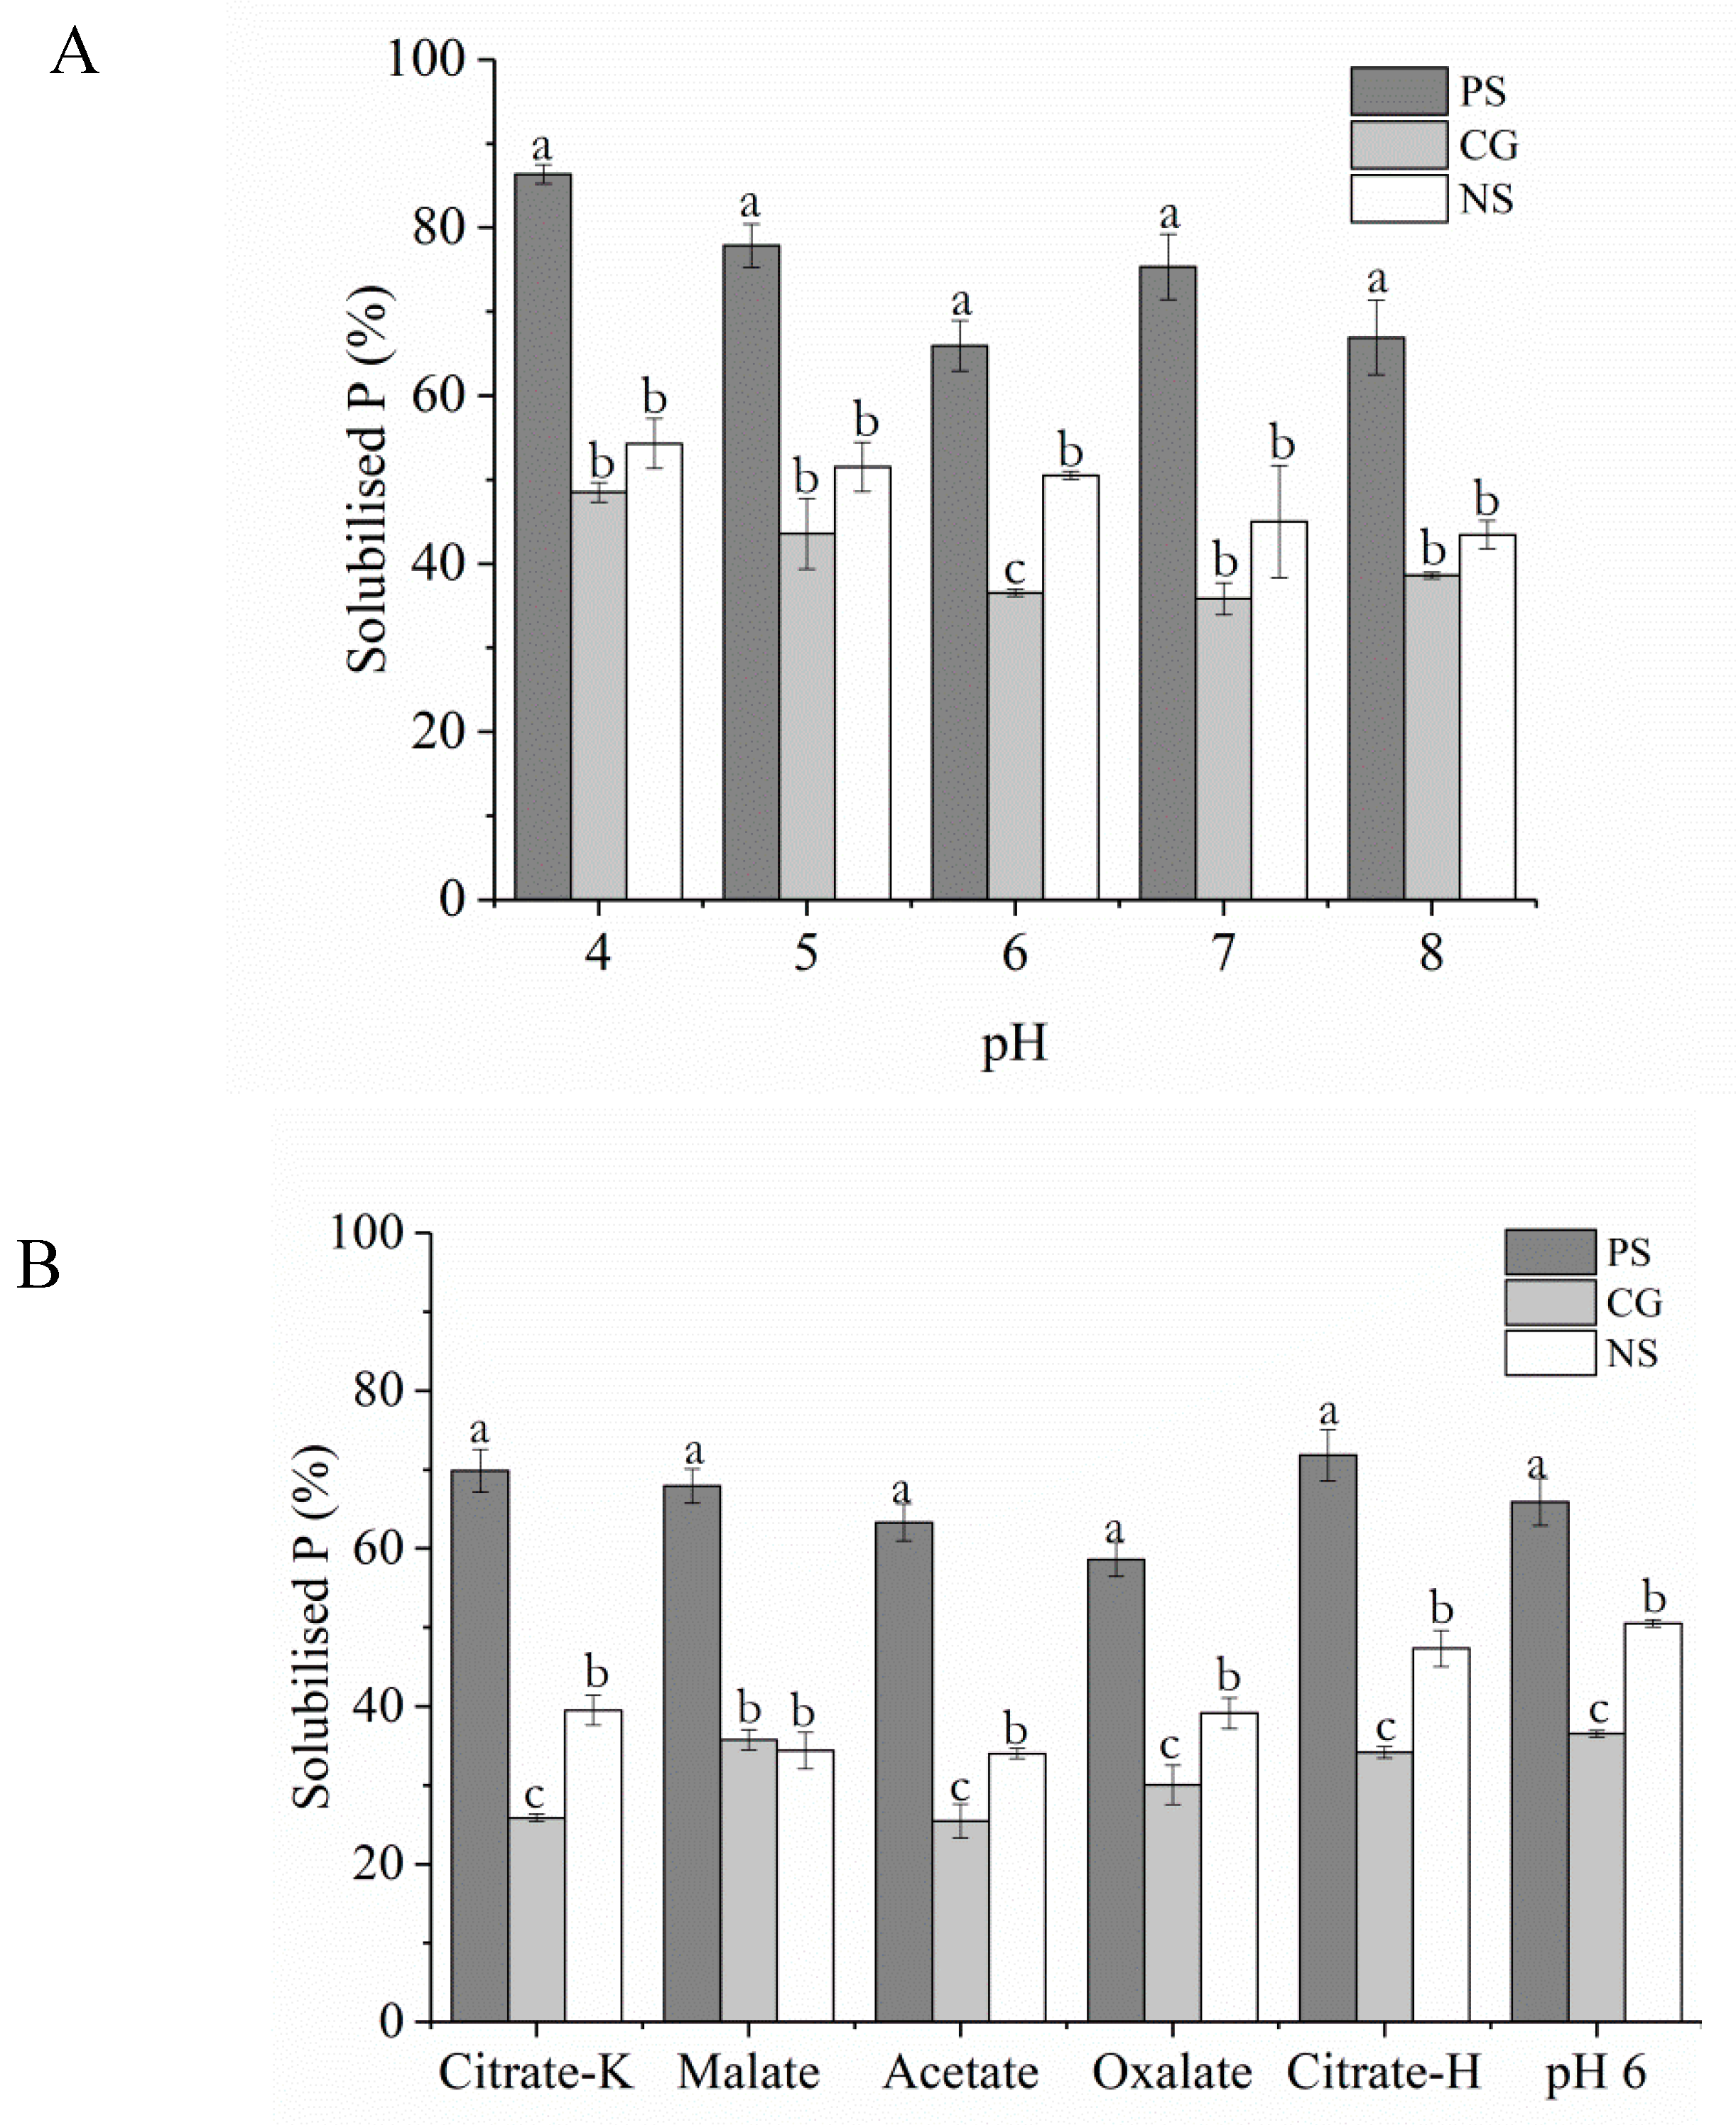
3.2. Influence of pH and Organic Acids on Struvite Dissolution

Overall, the kinetics of P-release from the three forms of struvite (PS, CG and NS) were not significantly affected by solution pH (Figure 2), however, the initial amount of P released from PS was greater than NS and CG at all pH values (p < 0.001). The maximum amount of P released was seen in the PS treatment at pH 4.0, in which 85 ± 1% of the total was solubilised. In contrast, the amount of P released from the CG and NS treatments was ca. 40% lower than seen in the PS treatment. The kinetics of P dissolution conformed well to an exponential decay model (r2 = 0.987 ± 0.004; Supplementary Figure S2).
Similar to the effect of pH, the presence of LMWOAs had no major impact on the rate of P dissolution from any of the three struvites tested (PS, CG or NS) (Figure 2B). However, again, the percentage of P solubilised followed the trend PS > NS > CG. The solubilisation kinetics of NH4+ and Mg from each form of struvites in response to pH and organic acid addition were very similar to the P-release kinetics and are presented in Supplementary Figure S2.

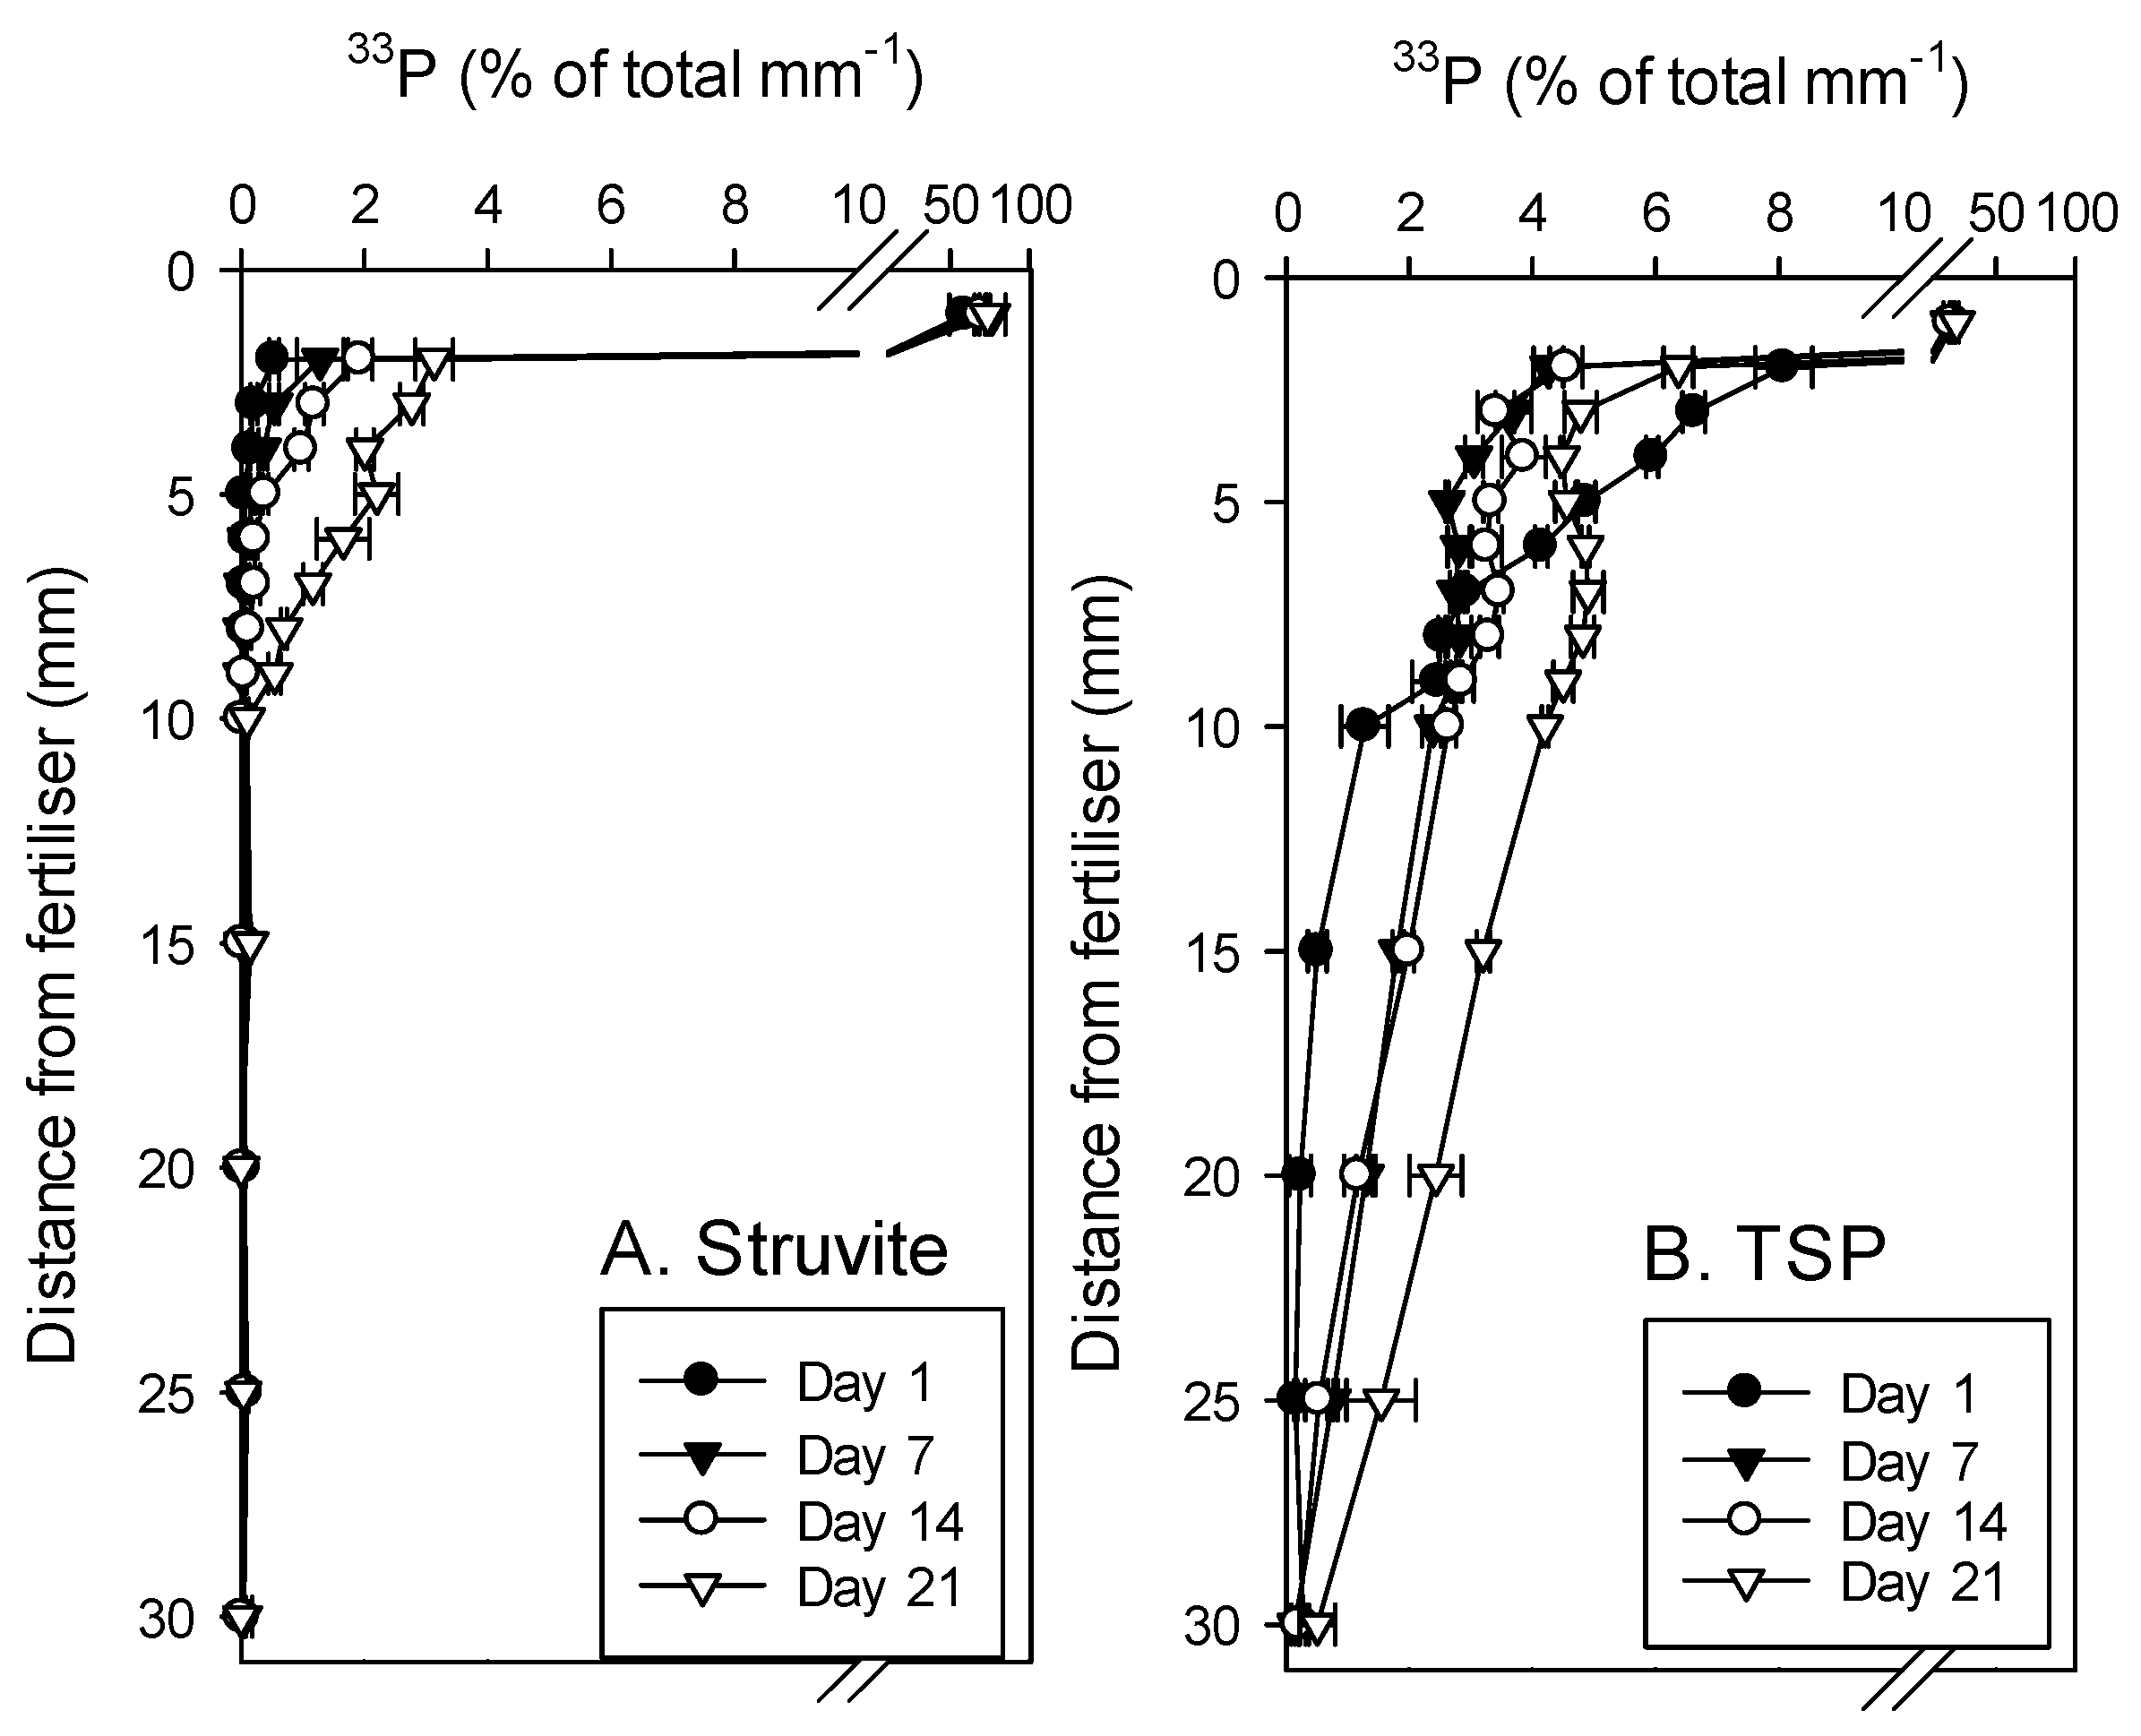
3.3. Phosphorus Diffusion from 33P-Labelled Struvite and TSP in Soil

The temporal and spatial dynamics of P movement away from the two contrasting 33P-labelled fertilisers is shown in Figure 3. On average, 76 ± 5% of the 33P was recovered from the soil across all harvest times with no significant difference in recovery observed between the TSP and struvite treatments (p = 0.81). We hypothesize that the unrecovered 33P could either be in an acid insoluble fraction of the fertilizer/soil or immobilised in the microbial biomass.
As expected, soil P concentration decreased in an exponential pattern away from the fertilisers. In the case of struvite, 69 ± 4% of the P released into the soil was retained in the first 1 mm of soil at all sampling times. It should be noted that this first soil fraction also contained the struvite fertiliser as it was impossible to separate the fertiliser from the soil particles. In contrast, however, only 22 ± 2% of the P released from TSP was found in this 0–1 mm layer of soil. In the TSP treatment, elevated concentrations of 33P, relative to the background, were seen up to 15 mm on day 1 and up to 25 mm thereafter. Although the P diffusion gradients were much steeper for struvite in comparison to TSP, significantly elevated concentrations of P (relative to the background; p < 0.05) were apparent at a distance of 2 mm on day 1, at a distance of 4 mm at day 7, at a distance of 6 mm by day 14, and 10 mm after 21 days. The amount of struvite-derived 33P which had diffused beyond 1 mm by day 1 represented ca. 2.6% of the total P, while at day 7, 14 and 21 this had increased to 2.8, 4.8 and 14.2% of the total P added, respectively. In contrast, the majority (>75%) of the 33P derived from TSP could be recovered outside of the immediate 0–1 mm soil layer at all sampling times.
The amount of struvite-P recovered by 0.5 M NaHCO3 (Olsen P) was on average 19.3 ± 2.1% of the total P recovered in the 0–1 mm zone, however, this significantly increased in the adjacent soil (1–3 mm; 36.3 ± 2.5% of the total recovered; p < 0.01). The fraction of Olsen P also slightly decreased with incubation time from 48.5 ± 2.5% at the start to 32.7 ± 2.7% at the end of the experiment (p = 0.002). In contrast, the amount of TSP-derived P recovered by 0.5 M NaHCO3 was lower than for struvite accounting for 9.5 ± 0.5% of the total P recovered in the 0–1 mm zone (p < 0.001). This value, however, significantly increased in the adjacent soil (14.8 ± 1.9%; p < 0.05) although this amount progressively fell from 23.0 ± 1.1% at day 1 to 11.5 ± 0.9% at day 28.

4. Discussion

4.1. Solubility of the Struvites in Relation to TSP

The dissolution and diffusion rates of the three different struvites tested here were quantified in three separate experiments. In the laboratory assay, the solubility of the finely ground struvites was quite similar at all solution pHs, although highest values were always obtained at pH 4. Compared to TSP which can be assumed to be 100% water-soluble, maximum P solubility was ca. 50% for CG and NS, and 85% for PS over the 8-h experimental period. This time period was found adequate to assess the kinetics of dissolution (Supplementary Figure S2) as also suggested by Massey et al. [42]. Previous work has suggested that struvite solubility is more dependent on soil pH when applied in granular form. For example, Talboys et al. [20] reported greater initial solubility of CG at pH 4 compared to pH 8, and Degryse et al. [18] reported a dissolution rate of ca. 0.43 mg P day−1 for both commercial and synthesized struvite in acid soils, but only 0.05 mg P day−1 in alkaline soils. Massey et al. [42] found that 40% of struvite P recovered from dairy waste was solubilised under solution pHs of 5.9 and 7, but that only 15% became soluble at pH 8. However, Achat et al. [43] found that struvite from pig manure and a reference struvite dissolved at similar rates across a range of soil P levels when the materials were finely ground, and it is likely that the lack of any significant effect of soil pH in our study is because the solubility tests were conducted on finely ground material.
Similarly, struvite dissolution rates were very similar when different organic acids were eluted through the leaching columns, but with consistently greater P solubility from PS than CG or NS. Indeed, the inclusion of organic acids did not dissolve more P than water at pH 6 from any struvite (Figure 2B). Talboys et al. [20] reported up to 69% more CG solubility in the presence of oxalate, citrate, acetate and malate, but they used a much higher concentration (1 mol · L−1) than used in this experiment. These results suggest that the concentrations of organic acids present in the rhizosphere (<50–100 μM) [20] are not sufficient to greatly influence the dissolution of struvite granules. The mechanisms of nutrient release (P, Mg and NH4) through solubilisation of struvites can be explained directly by their crystalline structure. According to Yu et al. [44], PO43− tetrahedra and Mg · 6H2O octahedra are linked in layers in the struvite lattice and dissolution occurs by disruption of these bonds, releasing these ions concomitantly. NH4+ ions in struvite are surrounded by single H bonds [45], but they do not enter the struvite crystalline lattice, and are released prior to the disruption of Mg and P bonds [44].
In the pot experiment with rhizons, P dissolution from PS as measured by changes in soil solution concentrations was also found to be much greater from PS than from CG or NS applied in granular form, even when the presence of wheat and soybean plants provided a sink for the released P. The consistent differences in P solubility between the different struvites when tested in both finely ground and granular form suggests that chemical composition is more important than physical composition in determining P release. Solution concentrations from TSP were initially several orders of magnitude greater than those from PS, but quickly declined, whilst P concentrations from PS declined more slowly and were maintained at a higher level than TSP by the end of the experiment. These data confirm the lower solubility and slow release nature of struvite dissolution, especially CG and NS [11,12,13,15]. However, the data also suggest that P was being dissolved from TSP and PS at greater rates than required by the growing seedlings. The higher P solubility of the PS struvite compared to CG and NS probably reflects the presence of other ions (K, S and Ca) in its composition, which increase the ionic strength and solubility constant [46,47]. Similarly, Phan et al. [48] observed that the solubility of struvites precipitated from the recycling of wastewater varied according to their chemical composition.
The soil column experiment also showed that P diffusion from radiolabelled granular struvite precipitated in the laboratory (33ST) was slower and more gradual then from 33TSP (Figure 3). Over 75% of the TSP diffused very quickly beyond the 1-mm layer and migrated to a greater distance from the source (25 cm) compared to struvite, where only 2.6% of added P had migrated beyond 1 mm after 1 day and had migrated to only 10 cm after 21 days. Similar patterns of P diffusion were found by Degryse et al. [18] and Nascimento et al. [49], both comparing synthesized struvite with soluble phosphate fertilisers, but they evaluated a horizontal movement in Petri dishes with P fertiliser applied only in the dish centre. Both studies found that the majority (80–90%) of the P released from struvite remained within 8 mm of the source, whilst ca. 50% of the P from TSP had migrated beyond this distance. The greater mobility of highly soluble TSP probably reflects rapid saturation of the P adsorption sites close to the source followed by progressively active adsorption at further distances from the site of application [18].

4.2. Agronomic Performance of Struvites Relative to TSP

The results of the short-term pot trial suggest that the lower P solubility and diffusion rates of the different granular struvites applied may well compromise the early growth of crops relative to TSP as early growth of wheat was significantly greater when TSP was applied. Both shoot and root yields were slightly greater with TSP suggesting that the additional growth may be due to a larger root system afforded by the greater diffusion of TSP. Since P released from TSP migrated to a greater distance from the source, this may have encouraged roots to spread. Similar results were reported by Degryse et al. [18] and Talboys et al. [20] for short-term pot experiments with struvites, although Talboys et al. [20] found that poorer early plant growth did not manifest itself in lower wheat yields at harvest due to the continual release of P from the struvite granules. They found that while only 9% of struvite was dissolved at 36 days, 26% had dissolved at harvest. Other previous work in both pot and field trials has suggested struvites from a range of sources are as effective as soluble P fertilisers over an entire growing season and when finely ground and thoroughly incorporated into the soil [10,50,51].
Although struvite solubility was significantly lower than TSP, P uptake by wheat and soybean was significantly increased by all three struvites compared to the nil P control, especially for wheat with up to 85% recovery compared to TSP. Across all treatments, P uptake rates by both wheat and soybean were directly related to their apparent solubilities measured in the laboratory assays (r2 > 0.90), but these differences in plant P uptake rates were too small to be statistically significant. Similarly, the notable differences in apparent solubility between PS and CG and NS were not sufficient to significantly affect crop yield or P uptake. Hence, struvites would appear to be a significant but slow release source of P to crops with clearly larger residual value than TSP since not all the applied struvite P dissolved. The soil column experiment clearly confirmed the greater amounts of residual labile P left by the struvite compared to TSP, and similar reports of intact granules have been reported in other studies [20,49,51]. Given the lower risk of P loss in land runoff after application of struvites relative to soluble fertilisers combined with their slow release characteristics, recovered struvites may therefore represent a more sustainable source of P for agricultural crops [52]. However, our results and previous work also shows that different sources of struvite may show very different solubilities depending on their chemical and physical composition and soil characteristics, and further work is required to assess whether the greater P solubility found in the recovered PS in our study confers a distinct agronomic advantage over CG and NS in longer-term studies and in the field. The potential also exists to blend struvites with conventional water-soluble fertilisers to overcome any shortfalls in early crop response and provide a more even distribution of P release to the developing crop during later stages of growth, as suggested by Talboys et al. [20].

5. Conclusions

The recovery and recycling of secondary sources of P helps to close the P cycle, reduce P losses to the aquatic environment and preserve the primary and finite reserves of PR that would otherwise be exploited to produce highly reactive P fertilisers. Struvite is the most widespread mineral fertiliser recovered from municipal, food and livestock waste and its more widespread use would make food production systems more P sustainable. A comparison of three different types of struvite has shown that their P solubilities differed by a factor of two, with the greatest P release (up to 85% of total P) obtained from a struvite recovered from poultry manure and containing other useful nutrients (K, S and Ca). All three struvites showed lower P solubilities and diffused through a shorter distance of soil than TSP when applied at the same rate, confirming the slow release nature of struvite P. The amount of P provided by struvites was sufficient for the enhanced development of soybean and wheat crops relative to a nil P control, reaching around 80% of P recovery when compared to TSP in the first 38 days of cultivation. However, a slightly better root and shoot growth of wheat was obtained from TSP suggesting that diffusion distance of P sources is an important factor influencing early growth. These data from a short-term experiment support the use of struvite as a more sustainable source of P to crops with a high residual value and further research is needed to prove their effectiveness in long-term field experiments.

Supplementary Materials

The following are available online at https://www.mdpi.com/2071-1050/11/1/134/s1, Figure S1: Diffractograms with identification of the mineralogical composition of the samples: A: Struvite precipitated in laboratory from excreta of poultry (PS), B: struvite naturally formed in sewage treatment pipelines of a swine farm (NS) and C: commercial struvite® (CG).Figure S2: Cumulative release kinetics: A; phosphorus (P), B; magnesium (Mg), C; ammonium (NH4) and D; solubilized content of P, Mg and NH4, obtained by the solubilisation of precipitated struvite (PS) in distinct pH solution values during a period of 8 hours. *Coefficient of variation. Treatments with the same letters do not differ statistically by the Tukey test at 5%, ns: no statistically significant difference.

Author Contributions

Conceptualization, I.R.; P.J.A.W.; D.L.J. and P.S.P.; Methodology, I.R.; D.L.J. and P.S.P.; Formal Analysis and Investigation, I.R. and D.L.J.; Resources, D.L.J. and P.S.P.; Data Curation and Writing-Original Draft Preparation, I.R.; D.L.J. and P.S.P.; Writing-Review & Editing, D.L.J. and P.J.A.W.

Acknowledgments

This research was financed in part by the Coordenação de Aperfeiçoamento de Pessoal de Nível Superior—Brasil (CAPES)—Finance Code 001 and included contributions from the RePhoKUs project (The role of phosphorus in the sustainability and resilience of the UK food system) funded by BBSRC, ESRC, NERC, and the Scottish Government under the UK Global Food Security research programme (Grant No. BB/R005842/1).

Conflicts of Interest

The authors declare no conflict of interest.

References

  1. Elser, J.J.; Bracken, M.E.S.; Cleland, E.E.; Gruner, D.S.; Harpole, W.S.; Hillebrand, H.; Ngai, J.T.; Seabloom, E.W.; Shurin, J.B.; Smith, J.E. Global analysis of nitrogen and phosphorus limitation of primary producers in freshwater, marine and terrestrial ecosystems. Ecol. Lett. 2007, 10, 1135–1142. [Google Scholar] [CrossRef] [PubMed] [Green Version]
  2. Savini, I.; Kihara, J.; Koala, S.; Mukalama, J.; Waswa, B.; Bationo, A. Long-term effects of TSP and Minjingu phosphate rock applications on yield response of maize and soybean in a humid tropical maize–legume cropping system. Nutr. Cycl. Agroecosyst. 2016, 104, 79–91. [Google Scholar] [CrossRef] [Green Version]
  3. Khademi, Z.; Jones, D.L.; Malakouti, M.J.; Asadi, F. Organic acids differ in enhancing phosphorus uptake by Triticum aestivum L.—Effects of rhizosphere concentration and counterion. Plant Soil 2010, 334, 151–159. [Google Scholar] [CrossRef]
  4. Santner, J.; Mannel, M.; Burrell, L.D.; Hoefer, C.; Kreuzeder, A.; Wenzel, W.W. Phosphorus uptake by Zea mays L. is quantitatively predicted by infinite sink extraction of soil P. Plant Soil 2015, 386, 371–383. [Google Scholar] [CrossRef] [PubMed]
  5. Hinsinger, P.; Brauman, A.; Devau, N.; Gérard, F.; Jourdan, C.; Laclau, J.P.; Le Cadre, E.; Jaillard, B.; Plassard, C. Acquisition of phosphorus and other poorly mobile nutrients by roots. Where do plant nutrition models fail? Plant Soil 2011, 348, 29–61. [Google Scholar] [CrossRef]
  6. Cordell, D.; Neset, T.S.S. Phosphorus vulnerability: A qualitative framework for assessing the vulnerability of national and regional food systems to the multidimensional stressors of phosphorus scarcity. Glob. Environ. Chang. Human Policy Dimens. 2014, 24, 108–122. [Google Scholar] [CrossRef]
  7. Cordell, D.; Metson, G.S.; Iwaniec, D.M.; Bui, T.T.; Childers, D.L.; Dao, N.; Dang, H.T.T.; Davidson, J.; Jacobs, B.; Kumwenda, S.; et al. Transforming cities: Securing food and clean waterways through a transdisciplinary phosphorus approach. In Transdisciplinary Research and Practice for Sustainable Outcomes; Routledge: Harlow, UK, 2016. [Google Scholar]
  8. Cordell, D.; Drangert, J.O.; White, S. The story of phosphorus: Global food security and food for thought. Glob. Environ. Chang. Hum. Policy Dimens. 2009, 19, 292–305. [Google Scholar] [CrossRef]
  9. Cabeza, R.; Steingrobe, B.; Römer, W.; Claassen, N. Effectiveness of recycled P products as P fertilizers, as evaluated in pot experiments. Nutr. Cycl. Agroecosyst. 2011, 91, 173. [Google Scholar] [CrossRef]
  10. Achat, D.L.; Sperandio, M.; Daumer, M.L.; Santellani, A.C.; Prud’Homme, L.; Akhtar, M.; Morel, C. Plant-availability of phosphorus recycled from pig manures and dairy effluents as assessed by isotopic labeling techniques. Geoderma 2014, 232–234, 24–33. [Google Scholar] [CrossRef]
  11. Le Corre, K.S.; Valsami-Jones, E.; Hobbs, P.; Parsons, S.A. Phosphorus recovery from wastewater by struvite crystallization: A review. Crit. Rev. Environ. Sci. Technol. 2009, 39, 433–477. [Google Scholar] [CrossRef]
  12. Kaikake, K.; Sekito, T.; Dote, Y. Phosphate recovery from phosphorus-rich solution obtained from chicken manure incineration ash. Waste Manag. 2009, 29, 1084–1088. [Google Scholar] [CrossRef]
  13. Doyle, J.D.; Parsons, S. Struvite, control and recovery. Water Res. 2002, 36, 3925–3940. [Google Scholar] [CrossRef]
  14. Yilmazel, Y.D.; Demirer, G.N. Removal and recovery of nutrients as struvite from anaerobic digestion residues of poultry manure. Environ. Technol. 2011, 32, 783–794. [Google Scholar] [CrossRef] [PubMed]
  15. Chauhan, C.K.; Vyas, P.M.; Joshi, M.J. Growth and Characterization of Struvite-K Crystals. Cryst. Res. Technol. 2011, 46, 187–194. [Google Scholar] [CrossRef]
  16. Suryawanshi, V.B.; Chaudhari, R.T. Synthesis and Characterization of Struvite-K Crystals by Agar Gel. J. Cryst. Process Technol. 2014, 4, 212–224. [Google Scholar] [CrossRef]
  17. Bhuiyan, M.I.H.; Mavinic, D.S.; Beckie, R.D. A solubility and thermodynamic study of struvite. Environ. Technol. 2007, 28, 1015–1026. [Google Scholar] [CrossRef] [PubMed]
  18. Degryse, F.; Baird, R.; da Silva, R.C.; McLaughlin, M.J. Dissolution rate and agronomic effectiveness of struvite fertilizers—Effect of soil pH, granulation and base excess. Plant Soil 2016, 410, 139–152. [Google Scholar] [CrossRef]
  19. Antonini, S.; Arias, M.A.; Eichert, T.; Clemens, J. Greenhouse evaluation and environmental impact assessment of different urine-derived struvite fertilizers as phosphorus sources for plants. Chemosphere 2012, 89, 1202–1210. [Google Scholar] [CrossRef]
  20. Talboys, P.J.; Heppell, J.; Roose, T.; Healey, J.R.; Jones, D.L.; Withers, P.J.A. Struvite: A slow-release fertiliser for sustainable phosphorus management? Plant Soil 2016, 401, 109–123. [Google Scholar] [CrossRef]
  21. Gahoonia, T.S.; Nielsen, N.E. The effects of root-induced ph changes on the depletion of inorganic and organic phosphorus in the rhizosphere. Plant Soil 1992, 143, 185–191. [Google Scholar] [CrossRef]
  22. Nye, P.H. Changes of pH across the rhizosphere induced by roots. Plant Soil 1981, 61, 7–26. [Google Scholar] [CrossRef]
  23. Song, Y.W.; Wang, H.R.; Cao, Y.X.; Li, F.; Cui, C.H.; Zhou, L.X. Inhibition of low molecular organic acids on the activity of acidithiobacillus species and its effect on the removal of heavy metals from contaminated soil. Huanjing Kexue/Environ. Sci. 2016, 37, 1960–1967. [Google Scholar]
  24. Ryan, P.R.; James, R.A.; Weligama, C.; Delhaize, E.; Rattey, A.; Lewis, D.C.; Bovill, W.D.; McDonald, G.; Rathjen, T.M.; Wang, E.; et al. Can citrate efflux from roots improve phosphorus uptake by plants? Testing the hypothesis with near-isogenic lines of wheat. Physiol. Plant. 2014, 151, 230–242. [Google Scholar] [CrossRef] [PubMed]
  25. Taghipour, M.; Jalali, M. Effect of low-molecular-weight organic acids on kinetics release and fractionation of phosphorus in some calcareous soils of western Iran. Environ. Monit. Assess. 2013, 85, 5471–5482. [Google Scholar] [CrossRef] [PubMed]
  26. Weast, R. CRC Handbook of Chemistry and Physics; CRC Press: Cleveland, OH, USA, 1970. [Google Scholar]
  27. UK-ALA. Lime Calculator; Agricultural Lime Association: London, UK, 2015. [Google Scholar]
  28. Van Raij, B.; Cantarella, H.; Quaggio, J.A.; Furlani, A.M.C. Recomendações de Adubação e Calagem Para o Estado de São Paulo; Instituto Agronômico (IAC. Boletim Técnico, 100): Campinas, Brazil, 1997; Volume 2, 285p. [Google Scholar]
  29. EMBRAPA. Manual de Métodos de Análise Químicas de Solos, Plantas e Fertilizantes; Embrapa Informação Tecnológica: Rio de Janeiro, Brazil, 1997; Volume 2, 212p. [Google Scholar]
  30. Rowell, D.L. Soil Science: Methods and Applications; Routledge: Harlow, UK, 2015. [Google Scholar]
  31. Oburger, E.; Jones, D.L.; Wenzel, W.W. Phosphorus saturation and pH differentially regulate the efficiency of organic acid anion-mediated P solubilization mechanisms in soil. Plant Soil 2011, 341, 363–382. [Google Scholar] [CrossRef]
  32. Ministério da Agricultura, Pecuária e Abastecimento. Manual de Métodos Analíticos Oficiais Para Fertilizantes Minerais, Orgânicos, Organominerais e Corretivos. Coordenação-Geral de Apoio Laboratorial; Murilo Carlos Muniz Veras (Org.) MAPA—Ministério da Agricultura, Pecuária e Abastecimento: Brasília, Brasil, 2014; 220p. [Google Scholar]
  33. AHDB. Nutrient Management Guide (RB209); Agriculture and Horticulture Development Board: Kenilworth, UK, 2017. [Google Scholar]
  34. Malavolta, E.; Vitti, G.C.; Oliveira, S.A. Avaliação do Estado Nutricional das Plantas; POTAFOS: Piracicaba, Brazil, 1997. [Google Scholar]
  35. Jones, D.L. Organic acids in the rhizosphere—A critical review. Plant Soil 1998, 205, 25–44. [Google Scholar] [CrossRef]
  36. Ryan, P.; Delhaize, E.; Jones, D.L. Function and mechanism of organic anion exudation from plant roots. Ann. Rev. Plant Physiol. Plant Mol. Biol. 2001, 52, 527–560. [Google Scholar] [CrossRef]
  37. Murphy, J.; Riley, J.P. A modified single solution method for the determination of phosphate in natural waters. Anal. Chim. Acta 1962, 27, 31–36. [Google Scholar] [CrossRef]
  38. Mulvaney, R.L. Nitrogen—Inorganic forms. In Methods of Soil Analysis. Part 3. Chemical Methods; Sparks, D.L., Ed.; Soil Science Society of America: Madison, WI, USA, 1996; pp. 1123–1184. [Google Scholar]
  39. Olsen, S.R.; Cole, C.V.; Watanabe, F.S.; Dean, L.A. Estimation of Available Phosphorus in Soils by Extraction with Sodium Bicarbonate; US Department of Agriculture: Washington, DC, USA, 1954.
  40. Levy, E.T.; Schlesinger, W.H. A comparison of fractionation methods for forms of phosphorus in soils. Biogeochemistry 1999, 47, 25–38. [Google Scholar] [CrossRef]
  41. Ferreira, D.F. Sisvar: A computer statistical analysis system. Ciênc. Agrotecnol. (UFLA) 2011, 35, 1039–1042. [Google Scholar] [CrossRef]
  42. Massey, M.S.; Davis, J.G.; Ippolito, J.A.; Sheffield, R.E. Effectiveness of recovered magnesium phosphates as fertilizers in neutral and slightly alkaline soils. Agron. J. 2009, 101, 323–329. [Google Scholar] [CrossRef]
  43. Achat, D.L.; Daumer, M.L.; Sperandio, M.; Santellani, A.C.; Morel, C. Solubility and mobility of phosphorus recycled from dairy effluents and pig manures in incubated soils with different characteristics. Nutr. Cycl. Agroecosyst. 2014, 99, 1–15. [Google Scholar] [CrossRef]
  44. Yu, R.T.; Ren, H.Q.; Wang, Y.R.; Ding, L.L.; Geng, J.J.; Xu, K.; Zhang, Y. A kinetic study of struvite precipitation recycling technology with NaOH/Mg(OH)2 addition. Bioresour. Technol. 2013, 143, 519–524. [Google Scholar] [CrossRef] [PubMed]
  45. Ferraris, G.; Fuess, H.; Joswig, W. Neutron diffraction study of Mg(NH4)(PO4)·6H2O (struvite) and survey of water molecules donating short hydrogen bonds. Acta Crystallogr. B 1986, 42, 253–258. [Google Scholar] [CrossRef]
  46. Rahaman, M.S.; Mavinic, D.S.; Bhuiyan, M.I.H.; Koch, F.A. Exploring the determination of struvite solubility product from analytical results. Environ. Technol. 2006, 27, 951–961. [Google Scholar] [CrossRef] [PubMed]
  47. Schuiling, R.D.; Andrade, A. Recovery of struvite from calf manure. Environ. Technol. 1999, 20, 765–768. [Google Scholar] [CrossRef]
  48. Phan, L.; Weichgrebe, D.; Urban, I.; Rosenwinkel, K.; Gunther, L.; Dockhorn, T.; Dichtl, N.; Muller, J.; Bayerle, N. Empirical evaluation of nutrient recovery using seaborne technology at the wastewater treatment plant Gifhorn. In International Conference on Nutrient Recovery from Wastewater Streams; Ashley, K., Mavinic, D., Koch, F., Eds.; WA Publishing: London, UK, 2009. [Google Scholar]
  49. Nascimento, C.A.C.; Pagliari, P.H.; Faria, L.A.; Vitti, G.C. Phosphorus mobility and behaviour in soils treated with calcium, ammonium and magnesium phosphates. Soil Sci. Soc. Am. J. 2018, 82, 622–631. [Google Scholar] [CrossRef]
  50. Vogel, T.; Kruse, J.; Siebers, N.; Nelles, M.; Eichler-Lobermann, B. Recycled products from municipal wastewater: Composition and effects on phosphorus mobility in a sandy soil. J. Environ. Q. 2017, 46, 443–451. [Google Scholar] [CrossRef]
  51. Bonvin, C.; Etter, B.; Udert, K.M.; Frossard, E.; Nanzer, S.; Tamburini, F.; Oberson, A. Plant uptake of phosphorus and nitrogen recycled from synthetic source-separated urine. Ambio 2015, 44, 217–227. [Google Scholar] [CrossRef] [Green Version]
  52. Withers, P.J.A.; Sylvester-Bradley, R.; Jones, D.L.; Healey, J.R.; Talboys, P.J. Feed the crop not the soil: Rethinking phosphorus management in the food chain. Environ. Sci. Technol. 2014, 48, 6523–6530. [Google Scholar] [CrossRef]
Figure 1. Soil solution P concentration under wheat (A) and soybean cultivation (B) after the application of three different types of struvite (PS, CG and NS), TSP and a control treatment (no P fertiliser). The legend is the same for both panels. Values represent means ± SEM (n = 3).
Sustainability 11 00134 g001
Figure 2. Amount of P solubilised from three different types of struvite (PS, CG, NS) at different solution pH values (Panel A) or in the presence of different low molecular weight organic acids (Panel B). The organic acids included citrate-K, malate, acetate and oxalate all at pH 6 including water (pH 6 treatment) and citrate-H at pH 3.9. Values represent means ± SEM (n = 3). Struvite treatments with different letters indicate significant differences at the p < 0.05 level for individual pH values or organic acids.
Sustainability 11 00134 g002
Figure 3. Temporal dynamics of P diffusion from either 33P-labelled struvite (Panel A) or triple superphosphate (TSP; Panel B) into soil. The 33P-labelled fertilisers were placed on the soil surface (0 mm) and 33P recovered at different distances away from the fertiliser after incubation periods of 1, 7, 14 and 21 days. Values represent total of the HCl and Olsen extracts discounting the control (no fertilizer) and are means ± SEM (n = 3). The limit of detection is 0.03%.
Sustainability 11 00134 g003
Table 1. Chemical and particle size analysis of the soil prior to liming and use in the experiments *.
Soil ParameterValue
pHCaCl25.3
OM (g kg−1)34
P (mg kg−1)24
S (mg kg−1)7
Ca (mmolc kg−1)36
Mg (mmolc kg−1)3
K (mmolc kg−1)2.2
Al (mmolc kg−1)<1
CEC (mmolc kg−1)79.2
V (%)52
B (mg kg−1)0.25
Cu (mg kg−1)1.2
Fe (mg kg−1)110
Mn (mg kg−1)21.8
Zn (mg kg−1)1.2
Clay (g kg−1)178
Silt (g kg−1)235
Sand (g kg−1)587
* pH in CaCl2, with ratio soil:solution of 1 : 2.5; organic matter (OM) by oxidation of carbon with potassium dichromate, determined by colorimetry and conversion C X 1.72; Extraction with ion exchange resin for P, Ca, Mg, K; H + Al determined by correlation with pH SMP (Shoemaker, Mclean, Pratt). Extraction in hot water for B; extraction in DTPA (diethylenetriamine penta-acetic acid) for Cu, Fe, Mn, Zn; S extracted by 0.5 mol · L−1 ammonium acetate in 0.25 mol · L−1 acetic acid. CEC = cation-exchangeable capacity; V% = basis saturation of CEC.
Table 2. Characterization of PS, NS and CG struvite samples for pH, saline index and chemical composition.
StruvitepH CaCl2
0.01 M
Salt
Index
TotalCitric AcidNAC + H2OH2O
P2O5(%)
PS7.260.617.517.417.53.8
NS7.810.229.128.428.92.0
CG7.610.429.329.128.82.5
StruviteMgCaKSN
%
PS7.12.017.36.51.8
NS11.30.35<0.1<0.15.9
CG11.6<0.1<0.1<0.15.8
Table 3. Shoot and root dry matter (DM) yield, P content, total P uptake and relative fertiliser efficiency (PUE) for wheat and soybean grown for 38 days under struvites (PS, CG and NS) and TSP application.
Wheat
TreatmentShoot DM
(g plant−1)
Root DM
(g plant−1)
Shoot P
(mg plant−1)
Root P
(mg plant−1)
P uptake
(mg plant−1)
PUE%
TSP1.67 a1.07 a3.01 a2.06 a5.07 a
PS1.30 bc0.91 ab2.40 a2.00 a4.40 ab74 ns
CG1.32 b0.83 ab2.24 a1.63 a3.86 b53
NS1.24 bc0.83 ab2.20 a2.06 a4.26 ab69
Control0.97 c0.62 b1.83 b0.63 b2.46 c
* CV9.314.49.417.010.224.5
Soybean
TreatmentShoot DM
(g plant−1)
Root DM
(g plant−1)
Shoot P
(mg plant−1)
Root P
(mg plant−1)
P uptake
(mg plant−1)
PUE%
TSP2.42 a0.74ns3.85 a1.86ns5.72 a
PS2.11 ab0.713.18 ab1.804.98 a84 ns
CG2.03 ab0.613.11 ab1.414.52 ab77
NS2.23 a0.613.33 ab1.344.67 ab74
Control1.54 b0.482.20 b1.173.37 b
* CV11.921.814.619.810.56.6
* Coefficient of variation. Results followed by the same letters in the columns do not differ by Tukey’s test at 5%. ns Not significant (p > 0.05).

