Article

Optimization of Land-Use Structure Based on the Trade-Off Between Carbon Emission Targets and Economic Development in Shenzhen, China

1
School of Environment and Energy, Shenzhen Graduate School, Peking University, Shenzhen 518055, China
2
Key Laboratory for Environmental and Urban Sciences, School of Urban Planning & Design, Shenzhen Graduate School, Peking University, Shenzhen 518055, China
*
Author to whom correspondence should be addressed.
Sustainability 2019, 11(1), 11; https://doi.org/10.3390/su11010011
Submission received: 17 November 2018 / Revised: 7 December 2018 / Accepted: 18 December 2018 / Published: 20 December 2018

Abstract

:
The approach of choosing an effective low-carbon land-use structure by multi-objective methods is commonly used in land-use planning. A common methodology is to calculate carbon emissions and conduct scenario simulations for the future. However, most Chinese cities have not implemented the methods for monitoring carbon emissions proposed by the Intergovernmental Panel on Climate Change (IPCC), especially Shenzhen, which is one of the fastest-growing cities in China. This study first calculated the carbon emissions for a typical year in Shenzhen under the guidance of the IPCC. Second, nighttime light data were used to spatialize the gross domestic product to obtain the economic benefit coefficients of the various land types. Finally, a multi-objective linear programming model was used to optimize the land-use structure under different scenarios for 2020 and 2025. The results show that (i) energy consumption contributed the most to local carbon emissions in 2016, at 94.75%; (ii) carbon emissions from paddy fields, animals, and humans were the second most dominant source; (iii) the intensity of carbon emissions from different land types in 2016 was variable; and (iv) compared with the natural scenario, an optimized land-use structure could reduce carbon emissions by 5.97% by 2020 and 12.61% by 2025. Under ideal simulation conditions, the simulated land-use pattern could not only meet the requirements of economic and social development, but also could effectively reduce carbon emissions, which is of great value to land managers and decision-makers.

1. Introduction

Since the 20th century, the atmospheric concentrations of major greenhouse gases have increased dramatically due to human activities [1]. It is acknowledged that global economic activities have made a massive contribution to the rapid growth of global carbon emissions [2,3], which will lead to adverse climate changes in the long term [1]. To prevent dangerous human-induced climate change, countries around the world have conducted numerous negotiations under the framework of the United Nations Framework Convention on Climate Change, including the 2030 Agenda for Sustainable Development, the Sendai Framework for Disaster Risk Reduction 2015–2030, and the Paris Agreement [4]. China, as the largest developing country, joined the Paris Agreement in September 2016 [5]. Research on urban, low-carbon development is one of the essential research themes of sustainability science [6]. How to balance economic development and carbon emissions is one of China’s challenges in seeking sustainable development and a low-carbon economy [7].
Land-use patterns have a significant influence on the distribution and concentration of greenhouse gases [8]. Due to the distinct carbon emissions generated by various types of land use, land-use changes may lead to alterations in carbon sources and sinks, thereby influencing urban carbon emissions [9]. Recent studies have shown that land-use patterns play a vital role in the carbon cycle of terrestrial ecosystems [10,11,12], and the carbon absorption and emission effects of land-use patterns are gradually being quantitatively analyzed. Hutyra et al. used the Laspeyres decomposition method to estimate the total carbon emissions of Seattle city from 1986 to 2007. The intensities of carbon sources and sinks for various land-use types were revealed through correlations in the land-use transfer matrix [13]. Chuai et al. considered three cities in Zhejiang Province and used linear programming to simulate carbon emissions under two scenarios, which constituted a vital exploration of carbon emissions in urban areas [14]. Carbon emissions from human activities are a non-negligible source, in which land becomes a carrier of emissions. However, the relationship between anthropogenic carbon emissions and land carriers has not been quantitatively clarified. Most cities in China (including Shenzhen) have not implemented the methods for monitoring carbon emissions proposed by the Intergovernmental Panel on Climate Change (IPCC), and there has also been a lack of quantitative research on the concentrations of anthropogenic carbon associated with various land-use types.
Currently, various mathematical methods have been developed to optimize land-use patterns, including linear programming, multi-objective linear programming (MOLP), system dynamics, and others. Among these, the MOLP model has been widely developed and applied to resolve the limitations of the optimal allocation of land resources under multiple objectives [15,16,17]. For example, Wang et al. used the MOLP model to optimize the allocation of land resources in the Pidu district of Sichuan Province, thereby maximizing the overall benefits under the constraints of the natural resources and sustainable development [17]. Moreover, the goal of the optimal allocation of land resources includes the realization of the socio-economic and ecological value of carbon emission reduction [18], and the optimization of land-use patterns while targeting a low-carbon economy has become a hot issue [19]. This study uses the MOLP model to optimize land-use patterns based on low-carbon target trade-offs in different scenarios.
Accelerated urbanization has led to the erosion of a large amount of ecological land with carbon sink functions. This has not only aggravated carbon emissions by creating unreasonable urban land-use structures and directly threatened urban ecological security [20], but has also posed enormous challenges to the construction of low-carbon cities in China. As a typical city with rapid economic development in China, Shenzhen has undergone high-intensity land development in the past 40 years, consuming large amounts of land and energy resources, which in turn has led to an imbalance in its carbon revenues and expenditures [21]. Shenzhen represents a classic example of high-intensity urbanization. Therefore, accurate calculation of its carbon emissions and reasonable predictions of land-use patterns will not only help make Shenzhen City sustainable, but will also have positive implications for other similar urbanizing cities.
In this study, Shenzhen City was selected as the study area and 2016 as the base year for research considering multiple datasets in a unified manner. Specifically, the objectives of this study were as follows: (1) to disaggregate Shenzhen’s carbon emissions under the guidance of the IPCC and to quantify the concentration of anthropogenic carbon associated with various land-use types; and (2) to evaluate potential changes in various land-use structures by 2020 and 2025 based on three main scenarios from the vantage point of trade-offs between economic benefits and carbon emissions. Through optimization and adjustment of the urban land-use structure, it is intended to reveal the equilibrium model of a low-carbon economy and land-use structure. These findings will not only provide possible theoretical and methodological support for sustainable land use in Shenzhen, but will also offer effective decision-making support for a low-carbon city development model for carbon emissions reduction.

2. Materials and Methods

2.1. Study Area

Shenzhen is located in the southern coastal area of Guangdong Province, China. The land area is 113°46′–114°37′ East longitude, 22°27′–22°52′ North latitude, bordering Huizhou and Dongguan to the north and Hong Kong to the south (Figure 1). Since the implementation of the reform and opening-up policy in 1978, Shenzhen, as China’s first special economic zone, has rapidly developed from a coastal fishing village to an international city with a population of 11.91 million in 2016 and a gross domestic product of 1949.26 billion Yuan. With the high speed of urban construction and economic growth, carbon emissions are increasing rapidly. Xu et al. suggested that Shenzhen was one of the cities with the most significant carbon emissions in the Pearl River Delta region from 2000 to 2013 [21]. Because Shenzhen is the leading city of China’s urbanization, a reasonable balance between economic development and low carbon emissions is crucial to its sustainable urban development.

2.2. Data Sources

This study mainly includes data on land use and land cover, energy consumption, waste quantity, population, gross domestic product, principal crops, livestock, industrial products, and carbon sink values of various terrestrial ecosystems.
The land-use and land-cover datasets are from the Chinese Academy of Sciences Resource and Environment Data Cloud Platform [22]. This work classifies the land-use types in Shenzhen as farmland (2.03%), woodland (40.71%), grassland (1.23%), waters and shallows (9.72%), built-up areas (43.23%), and other land (3.08%), including bare and unused land. The Shenzhen Statistical Yearbook provided the energy consumption data [23]. China Emission Accounts and Datasets supplied the energy carbon emission factor [24]. The Shenzhen Municipal Bureau of Statistics provided the population, GDP, primary crop yield, animal husbandry, and industrial production data. Other empirical data came from studies published by the IPCC and other researchers [14,25,26,27,28,29].

2.3. Calculation Methods for Carbon Emissions

The IPCC attributes carbon emissions to the following four factors: (1) energy consumption; (2) industrial processes; (3) waste; and (4) forestry, agriculture, land use, and LUCC (Land use and land cover change) [25]. This work refers to and localizes the disaggregation method of Chuai et al. [14] and clarifies the carbon emissions of Shenzhen to obtain the carbon emission coefficients of various land-use types.

2.3.1. Carbon Emissions of Energy Consumption

The Statistical Yearbook of Shenzhen in 2017 provided the energy consumption of various industries, including agriculture, forestry, animal husbandry, fisheries, industry, construction, transportation, warehousing, post and telecommunications, wholesale and retail trade, catering, other tertiary industries, and urban residential consumption. The carbon emissions of energy consumption were calculated using Equation (1):
C EC i = Q E C i × N D V EC i × C C EC i
where C EC i is the standard coal consumption of industry i; N D V E C i refers to the net caloric value, which is the heat value produced by fossil fuel combustion (0.21 PJ/104 t); and C C E C i (carbon content) is the CO2 emissions per unit net caloric value generated by fossil-fuel consumption by industry i (26.32 tons C/TJ) [26].

2.3.2. Carbon Emissions of Industrial Processes

Carbon emissions from industrial processes ( C I P i ) can be determined by multiplying the number of industrial products by their corresponding carbon emission factors [25], as shown in Equation (2):
C I P i = Q I P i × V I P i
where Q I P i is the production level of industrial product i and V I P i is the emission factor of producing product i. In 2008, Shenzhen shifted its dominant industries to capital and technology-intensive industries such as computer and communication equipment manufacturing [30]. The industrial products involved in the calculation are metals, aluminum, and semiconductor integrated circuits.

2.3.3. Carbon Emissions of Waste

Waste is composed of wastewater and garbage. Wastewater releases carbon in the form of CH4, which depends on the chemical oxygen demand (COD) in the water. Waste disposal includes landfill and combustion, where carbon is emitted in the form of CH4 and CO2, respectively [14]. The carbon emissions of the three types of waste are calculated as follows.
Carbon emissions of wastewater ( C W W ):
C W W = Q W W × P C O D × V C O D × 0.75
where Q W W is the total amount of wastewater [31]; P C O D is the COD per unit of wastewater, which is available from the national secondary wastewater discharge standard [32]; and V C O D is the ability of wastewater to release CH4 (0.25) [33].
The carbon emissions of landfill waste ( C L W ) can be calculated as:
C L W = Q L W × 0.167 × ( 1 71.5 % ) × 0.75
where Q L W is the amount of landfill waste [33] and the emission factor of CH4 in landfill waste is 0.167 [25]. The water content of garbage is 71.5% [27].
The carbon emissions of burning garbage ( C W B ) can be calculated as:
C W B = Q W B × V W G × P W G × 3 / 11
where QWB is the amount of burning garbage [31], V W G is the carbon content in the garbage (50%), and P W G is the mineral carbon content in the garbage (40%) [14].

2.3.4. Carbon Emissions from Forestry, Agriculture, and Other Land-Use Types

Shenzhen plans to become a national forest city by 2025. In this study, garden areas are classified as forest lands, and their carbon emissions are calculated using Equation (6). C F , Q F , and V F are the carbon emissions, total area, and emissions factor of the forest areas, respectively:
C F = Q F × V F .
The carbon emissions of animals in agriculture ( C A B i ) are calculated by Equation (7), where N i is the number of animals of type i and V A B i is the respiratory carbon emission factor of animal i [27]. The animals involved in the calculation are milk cows, hogs, and poultry:
C A B i = N i × V A B i .
Equation (8) was used to calculate the carbon emissions in animal intestinal fermentation and feces ( C i f f i ), where N i is the number of animals of type i and V a i and V b i are the carbon emissions factors of intestinal fermentation and feces of animal i, respectively [27]:
C i f f i = N i × ( V a i + V b i ) .
Equation (9) shows the method of calculating carbon emissions from human respiration in the city ( C h u m a n ), where N is the total resident population in the study year and V h u m a n is the carbon emission factor of human respiration (0.079 t/a per capita) [28]:
C h u m a n = N × V h u m a n .
The carbon emissions from land use mainly refer to the carbon emissions of terrestrial ecosystems ( C T E i ) in the study year, including vegetation and soil (Equation (10)). Because only carbon emissions in the current year were considered, the carbon emissions caused by LUCC were not calculated. R i is the emission factors of vegetated soils in the various land-use types, which are available from Lai [29], and A r e a i is the area of land-use type i:
C T E i = R i × A r e a i .

2.4. Assignment of Carbon Emissions to Various Land-Use Types

Using local data and previous studies [14], we divided the various land-use types in Shenzhen according to the four factors that contribute to carbon emissions, as established by the IPCC (Table 1).
In the case of farmland, carbon emissions are mainly due to the energy consumption of mechanized agricultural production, fertilizer losses, and crop respiration. Farmland mainly relies on vegetation and soil to absorb carbon.
Energy consumption in mechanical operations and the biological respiration of forest ecosystems are considered to be the primary sources of carbon emissions from forest land. Woodland has a vital carbon sink capability, mainly from carbon sequestration by vegetation and soil.
The carbon absorption pathway of grassland is similar to that of forest land. Nevertheless, its emissions are mostly due to biological life activities, including respiration, intestinal fermentation, and feces, as well as energy consumption in animal husbandry production.
Water and shallows are important types of land use in coastal cities; they mainly rely on the soil in shallows to absorb carbon. Energy consumption from fisheries is a major source of carbon emissions.
In built-up land, energy consumption is mainly due to the various industries, industrial products, waste, and human respiration, as shown in Table 1, whereas urban green areas absorb carbon.
As for other land types, including idle land, sandy ground, and bare land, carbon emission and absorption are mainly determined by the ability to release and fix carbon in soil.

2.5. Economic Benefit Coefficients of the Various Land-Use Types

District-level GDP statistics were distributed to the respective pixels according to the NPP-VIIRS (NPOESS Preparatory Project-Visible Infrared Imaging Radiometer) nighttime light data distribution of 10 districts in Shenzhen, as shown in Equation (11) [34]. G D P i is the GDP simulated value of pixel i, G D P T o t a l is the total GDP of the district to which the pixel belongs, D N i is the gray value of pixel i, and T N L is the total DN (Digital Number) value of all the pixels in the district:
G D P i = G D P T o t a l × D N i T N L .
The vector data for land use and land cover in Shenzhen was converted into raster data with a resolution consistent with that of the nighttime light images, and then, the GDP of various land-use pixels was counted as the economic benefit coefficient of the various land-use types.

2.6. MOLP Model Development

This study used a MOLP model to optimize land-use structure, including the development of objective functions and constraints using the LINGO software (version 10.0). Because China’s national development plans are updated every five years, the MOLP model explored potential land-use structures to be developed by 2020 and 2025. The three future scenarios of the model were: (a) the natural scenario, which only considered land demand to promote urbanization and economic development and in which the change trends in the various land-use types were based on the rate of land-use change from 2012 to 2016; (b) the low-carbon scenario, which aimed at reducing carbon emissions (Equation (13)); and (c) the low-carbon economy scenario, which took the requirements of low-carbon targets into account to achieve maximum economic development (Equation (14)):
C = min i = 1 6 C i X i
F ( X ) 1 = max i = 1 6 G i X i
F ( X ) 2 = min [ 6000 × F ( X ) 1 C ] .
In Equation (12), i = 1, 2, …, 6, represents farmland, woodland, grassland, water and shallows, built-up land, and other land, respectively. C i (t/hm2·a) is the carbon emissions coefficient of land type i (Section 2.5), and X i (hm2) represents the area of land type i. In Equation (13), G i (hundred million/hm2·a) is the economic benefit coefficient of land type i (Section 2.5). According to the indicator system used in Shenzhen to tackle climate change, carbon dioxide emissions are required to be less than 0.6 t per 10,000 Yuan of GDP. In other words, F ( X ) 2 is used to explore the maximum economic benefit under the carbon emissions indicator.
Seven constraints were established depending on local land-use policies, the plans for economic and social development, and particular restrictive land-use conditions. According to the land-use plan for Shenzhen from 2005 to 2020, the total area in 2020 will reach 201,219 hm2. Based on the growth rate of the total area from 2016 to 2020, the total predicted area in 2025 will be 205,388.65 hm2. Therefore, the first constraint (total area constraint) of the optimization model in 2020 can be established as follows:
i = 1 6 X i = 201219   and   X i 0 .
Shenzhen has focused on economic development, and agricultural lands have decreased irreversibly. Therefore, government and scientific researchers have worked to achieve the maximum output of the limited farmland by developing new varieties such as Shenzhen’s original high-yield rice and sea rice. According to the latest governmental policy, the amount of farmland in the city should not fall below 2688 hm2 by 2020. Considering the rapid development of the modern technology industry in Shenzhen, an overwhelming downward trend in the area of farmland is to be expected. Hence, the area of farmland as it was in 2016 was set as the upper limit of the farmland constraint. Moreover, it was assumed that by the tenth year after 2020, farmland area should not be less than the primary protected areas (2000 hm2). Based on this rate of reduction, the lower limit of the farmland constraint for 2025 was determined (Table 2).
Woodland has the largest carbon sink capacity among the land-use types considered, and thus, it should be strictly protected. Therefore, the woodland areas as they were in 2016 were set as the lower limit for 2020, and there was no upper limit. According to the goal of establishing the forest city, referring to urban forestry plans, and considering the existing situation of ecological land and the total amount of forest resources in Shenzhen, it is assumed that Shenzhen City can complete 95% of the goal of establishing the forest city, which was set as the lower limit, by 2025 (Table 2).
The grassland in Shenzhen is mainly used for urban greening and pasture for animal husbandry. The total area of grassland decreased by 15.96% in 2012–2016. However, due to the requirements for urban green landscape construction, grassland will have an upward trend in the future. According to the urban forest plan, it was assumed that 80–85% of the target of 2500 hm2 as the lower limit would be achieved by 2020 and 2025, and the upper limit was adjusted to 100–105% of the goal (Table 2).
Shenzhen, located on the east bank of the Pearl River Estuary, has more than 160 rivers in the water system of the Dongjiang, Gulf, and Pearl River Estuary. Waters and shallows are a vital component of maintaining the health of wetland ecosystems, which decreased by 4.10% from 2012 to 2016. By 2020, the minimum protected areas should not be less than the 14,473.87 hm2 existing in 2016. According to the Wetland Protection Plan in Shenzhen and the protection targets for wetland parks, rivers, wetlands along the beach, wetlands in Shenzhen Bay, and urban water sources, 20,669 hm2 of water and shallows will be protected in Shenzhen by 2020. Considering the rapid development of the economy and land use, it was assumed that 75% of the target of 20,669 hm2 would be achieved by 2025, and the upper limit for this was increased according to the lower limit (Table 2).
With rapid economic development and urbanization, there has been a significant upward trend in built-up areas. According to the population, per-capita living space, and the demand of urban industries, at least 94,525.25 hm2 of built-up land will be required by 2020. The upper limit is 100,400.00 hm2, which was taken from the Shenzhen Land Use Plan 2005–2020. In the same way, the upper and lower limits for 2025 are shown in Table 2.
According to the land-use transfer matrix between 2012 and 2016 (Table 3), other areas were mainly converted from a small number of woodlands, waters, and shallows and were primarily changed into farmlands and built-up lands, which are difficult to transform into other ecological lands. According to a Shenzhen Municipal Government report, the relevant departments are actively transferring bare land to ecological lands, such as forest or grassland. Hence, it could be assumed that the utilization of other lands by 2020 and 2025 would reach 70% and 80%, respectively, compared with 2016, and there is no upper limit.

3. Results

3.1. Carbon Emissions Composition Characteristics of Shenzhen in 2016

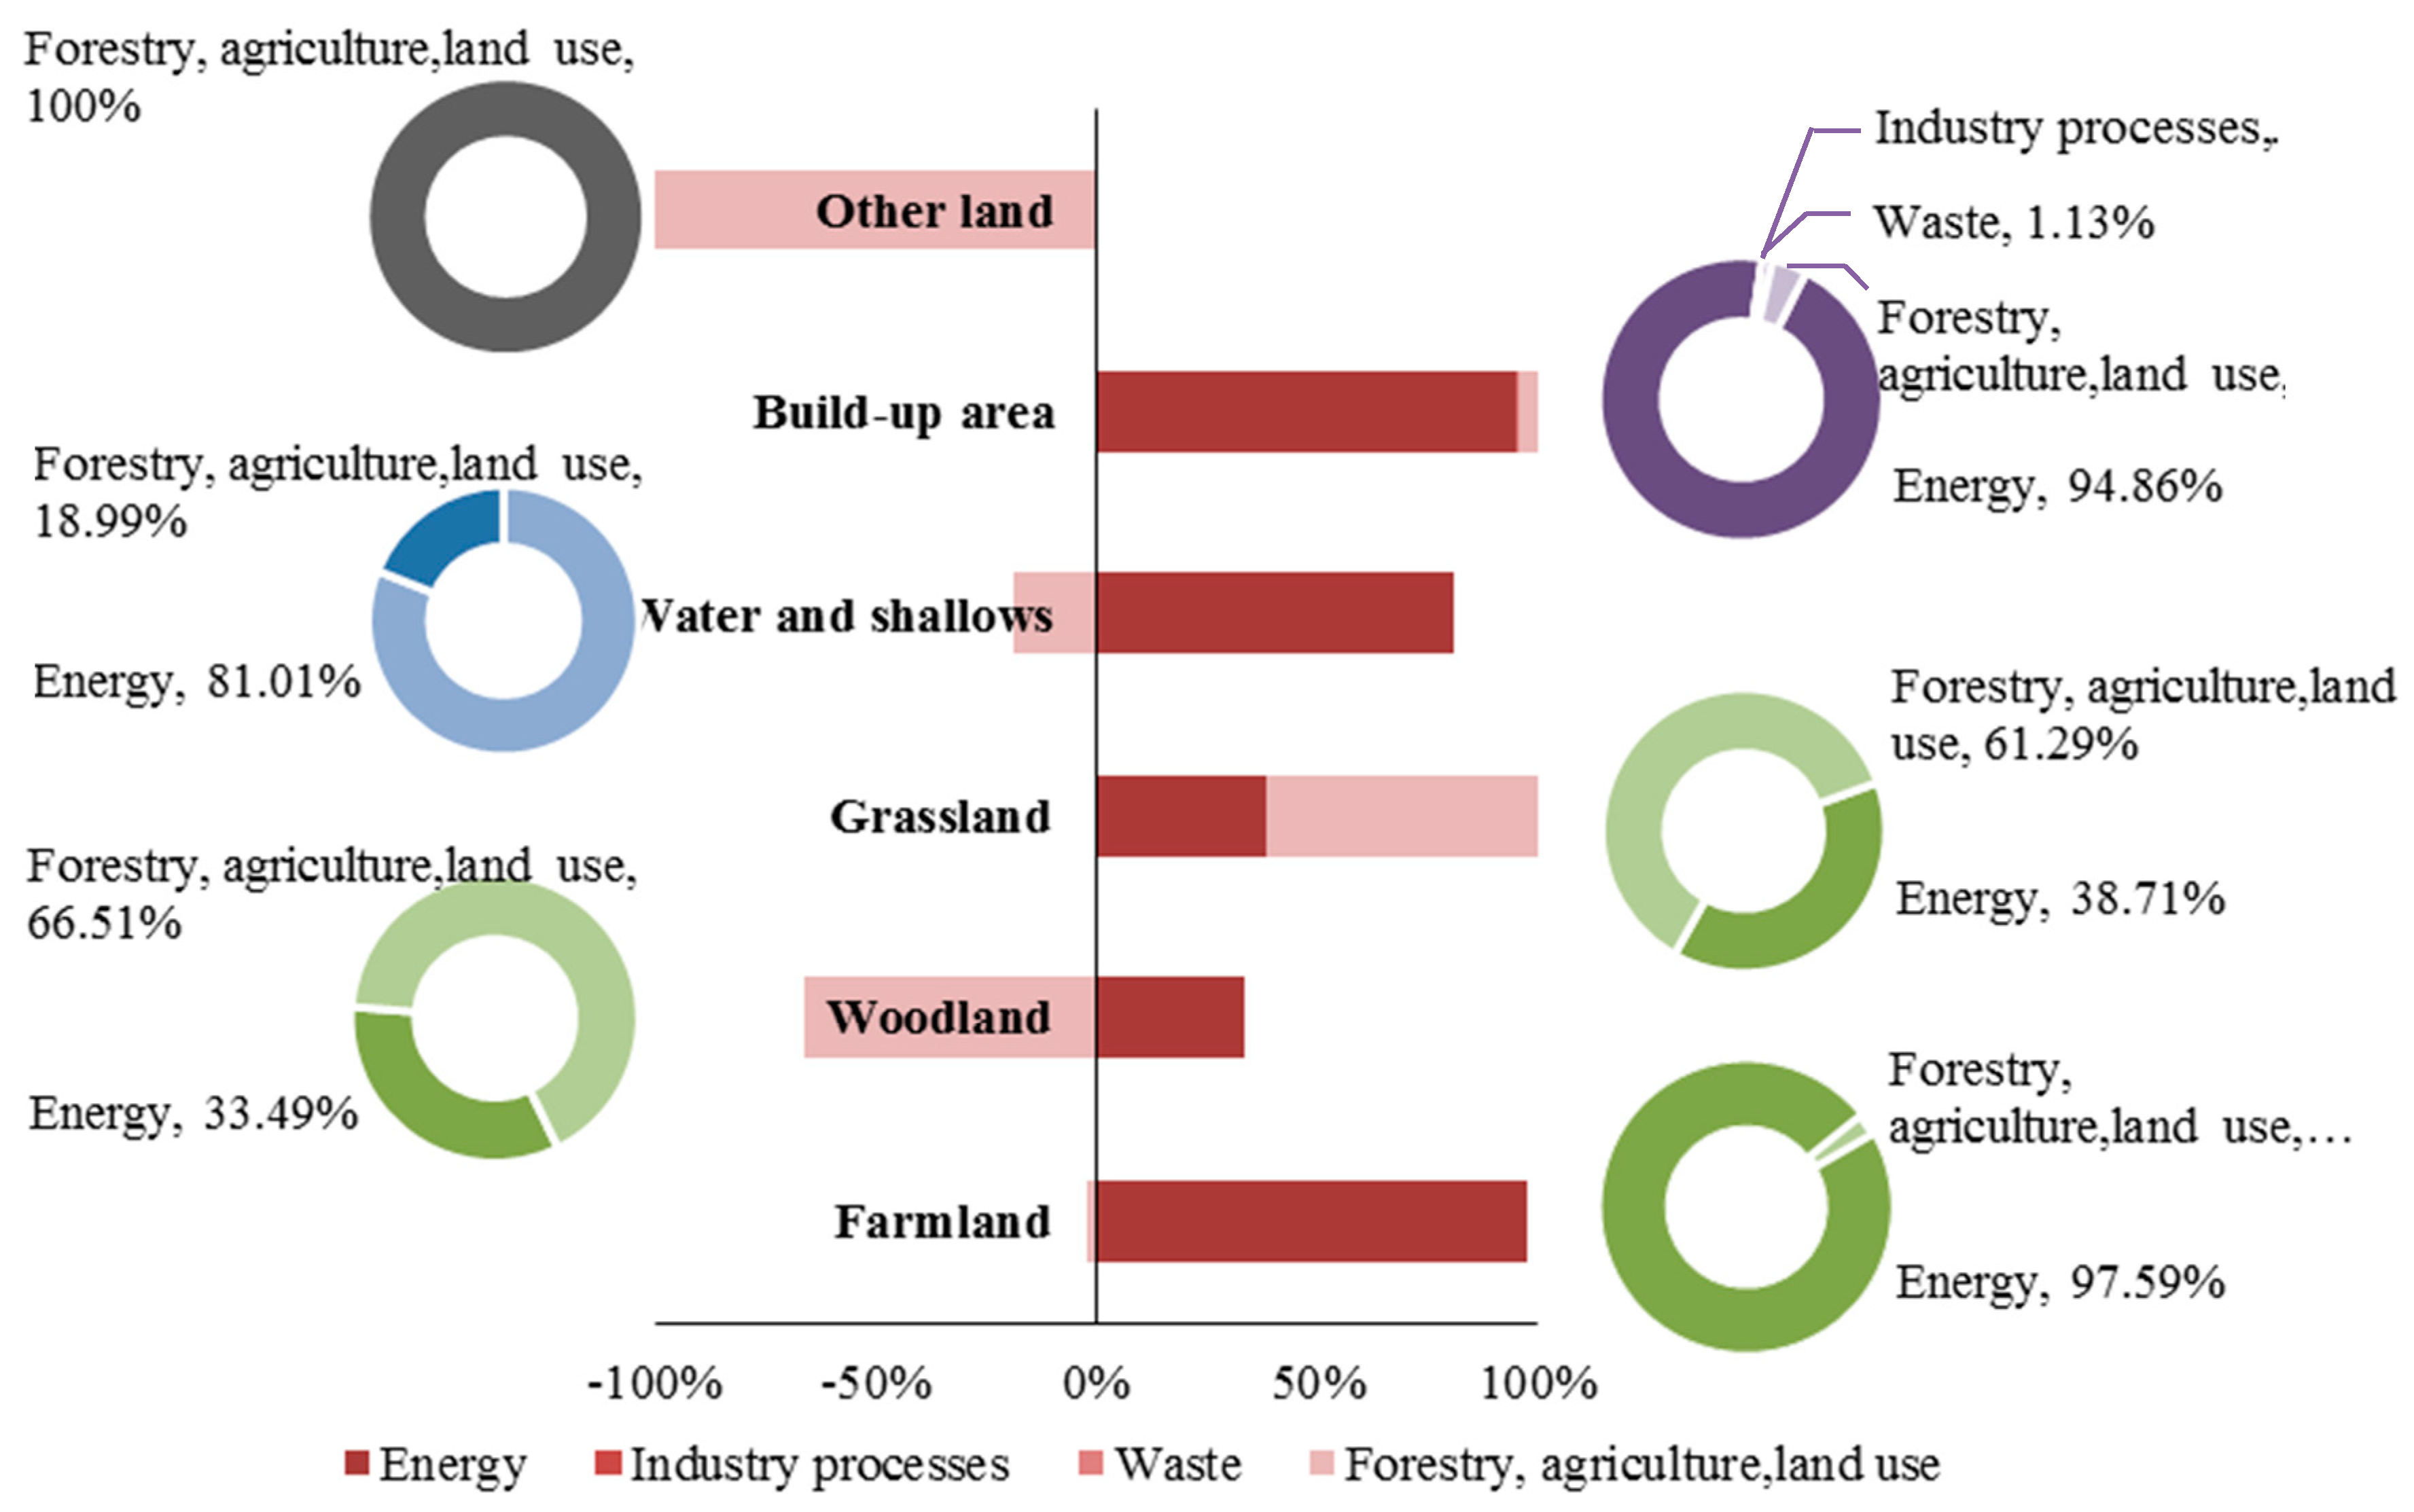
According to Section 2.3, the localized assignment method was used to disaggregate the carbon emissions of Shenzhen in 2016. Figure 2 indicates that energy consumption contributed the most to carbon emissions in 2016 at 94.94%. This consumption mainly includes the mechanical operations of agriculture, forestry, animal husbandry, fisheries, industrial processes, construction, wholesale and retail activities, residential consumption, and transportation. The second highest contributor was forestry and agriculture land uses, which accounted for 3.91% and include anaerobic respiration of rice, captive animal respiration, intestinal fermentation and feces, and human respiration. Carbon emissions from waste and industrial products were less important than the other two processes, accounting for 1.15% of total carbon emissions and mainly generated by industrial production, wastewater discharge, combustion, and landfill waste. Nevertheless, these carbon emissions will be reduced to some extent by the development of low-carbon industries and the optimization of waste treatment technologies and equipment.
The pie charts in Figure 2 illustrate the calculated results for the carbon emissions of different land-use types. Energy consumption emissions are dominant in farmland, water and shallows, and built-up land, with proportions of 97.59%, 81.01%, and 94.86%, respectively. The distribution of emissions indicates that grassland and woodland emissions are primarily from forestry and agriculture land use. Emissions from waste and industrial processes are mainly produced on built-up land.

3.2. Comparison of Carbon Emissions and Economic Benefit Coefficients of Various Land-Use Types

Based on Section 2.4, a set of carbon emission factors based on land-use types was estimated in accordance with the latest datasets for Shenzhen in 2016. As shown in Table 4, the carbon emission factor from farmland was calculated as 5.13 t C·hm−2·a−1, which is considered to be a weak carbon source, consistent with findings by Fang et al. on China’s farmland carbon emissions [35]. Next, with regard to the carbon emissions generated by mechanized forest management, the intensity of woodland carbon emissions was about −0.26 t C·hm−2·a−1, which was the only carbon sink among the six land-use types. Grassland, with 22.42 t C·hm−2·a−1 intensity of carbon emission, was a carbon source. Similarly, Fang et al. pointed out that the Chinese grassland ecosystem is a weak carbon source [36].
In Shenzhen, the reason for the high values for farmland may be due to the higher degree of mechanization of animal husbandry and the high density of animal husbandry development. Water and shallows had a carbon emission intensity of about 1.10 t C·hm−2·a−1, which makes this land-use type also a weak carbon source [37]. The findings of this study regarding the emission trend of water areas are consistent with these results. Furthermore, the intensity of carbon emissions on built-up land was about 240.42 t C·hm−2·a−1, making this land-use type the most reliable carbon source among all land-use types. Finally, emissions from other land-use types were about 0.76 × 10⁻³ t C, making this land also a weak carbon source.

3.3. Optimization of Land-Use Structure Based on the MOLP Model

Through the calculations described in Section 2.6, under the three scenarios, the land-use structures, carbon emissions, and gross domestic product were compared. Table 5 shows that by 2020, the total carbon emissions in the natural scenario will reach 2539.10 × 104 t. Under the low-carbon scenario, these total emissions are expected to reach 2278.15 × 104 t, which is 260.95 × 10⁴ t lower than before, but the GDP is expected to be 1535.52 × 104 Yuan less than before. However, under the low-carbon economy scenario, total emissions are expected to reach 2387.56 × 104 t, which is 151.54 × 10⁴ t C lower than the natural scenario but higher than the low-carbon scenario emissions of 109.41 × 10⁴ t. Compared with the natural scenario, the GDP is expected to decrease by 665.60 × 10⁴ Yuan but remains higher than the GDP under the low-carbon scenario (869.83 × 10⁴ Yuan). By 2025, the total emissions in the natural scenario will reach 2832.67 × 104 t, and the emissions in the low-carbon scenario are expected to reach 2475.22 × 104 t, which is 357.45 × 10⁴ t lower than in the natural scenario. However, GDP is expected to decrease by 2015.32 × 104 Yuan compared with the natural scenario.
Nevertheless, under the low-carbon economy scenario, total carbon emissions will reach 2475.37 × 104 t, which is 257.30 × 10⁴ t C lower than the natural scenario but higher than 1564.18 × 104 t in the low-carbon scenario. GDP is expected to decrease by 1943.36 × 104 Yuan compared with the natural scenario but is expected to be higher than the low carbon scenario of 71.96 × 10⁴ Yuan. At the same time, the low-carbon economy scenario also satisfies the carbon emissions target of responding to climate change in Shenzhen, or in other words, the carbon emissions per 10,000 Yuan of GDP are less than 0.6 t.
In summary, the simulated results of the low-carbon economy scenario could not only fulfill the emission reduction targets in Shenzhen but could also have relatively large economic benefits. Compared with the natural situation, the emission reductions are 151.54 × 10⁴ t C (estimated results for 2020) and 257.30 × 10⁴ t C (estimated results for 2025).
As shown in Figure 3, by 2020, compared with the natural scenario, the low-carbon and low-carbon economic scenarios are expected to reduce carbon emissions by 10.28% and 5.97%, respectively. With regard to GDP, the low-carbon economic scenario will bring an economic benefit of 869.83 × 10⁴ Yuan more than the natural scenario (Table 4). By 2025, the low-carbon and low-carbon economy scenarios, compared with the natural scenario, will achieve similar rates of carbon emissions reduction, differing only by 0.01%. However, the low-carbon economy scenario will bring an economic benefit of 719,600 Yuan, which is more than the low-carbon scenario. Note that the trade-off between built-up land and woodland is the most critical factor in the balance between carbon emissions and economic development.

4. Discussion

4.1. Suggestions for Reducing Carbon Emissions from the Optimal Scenario

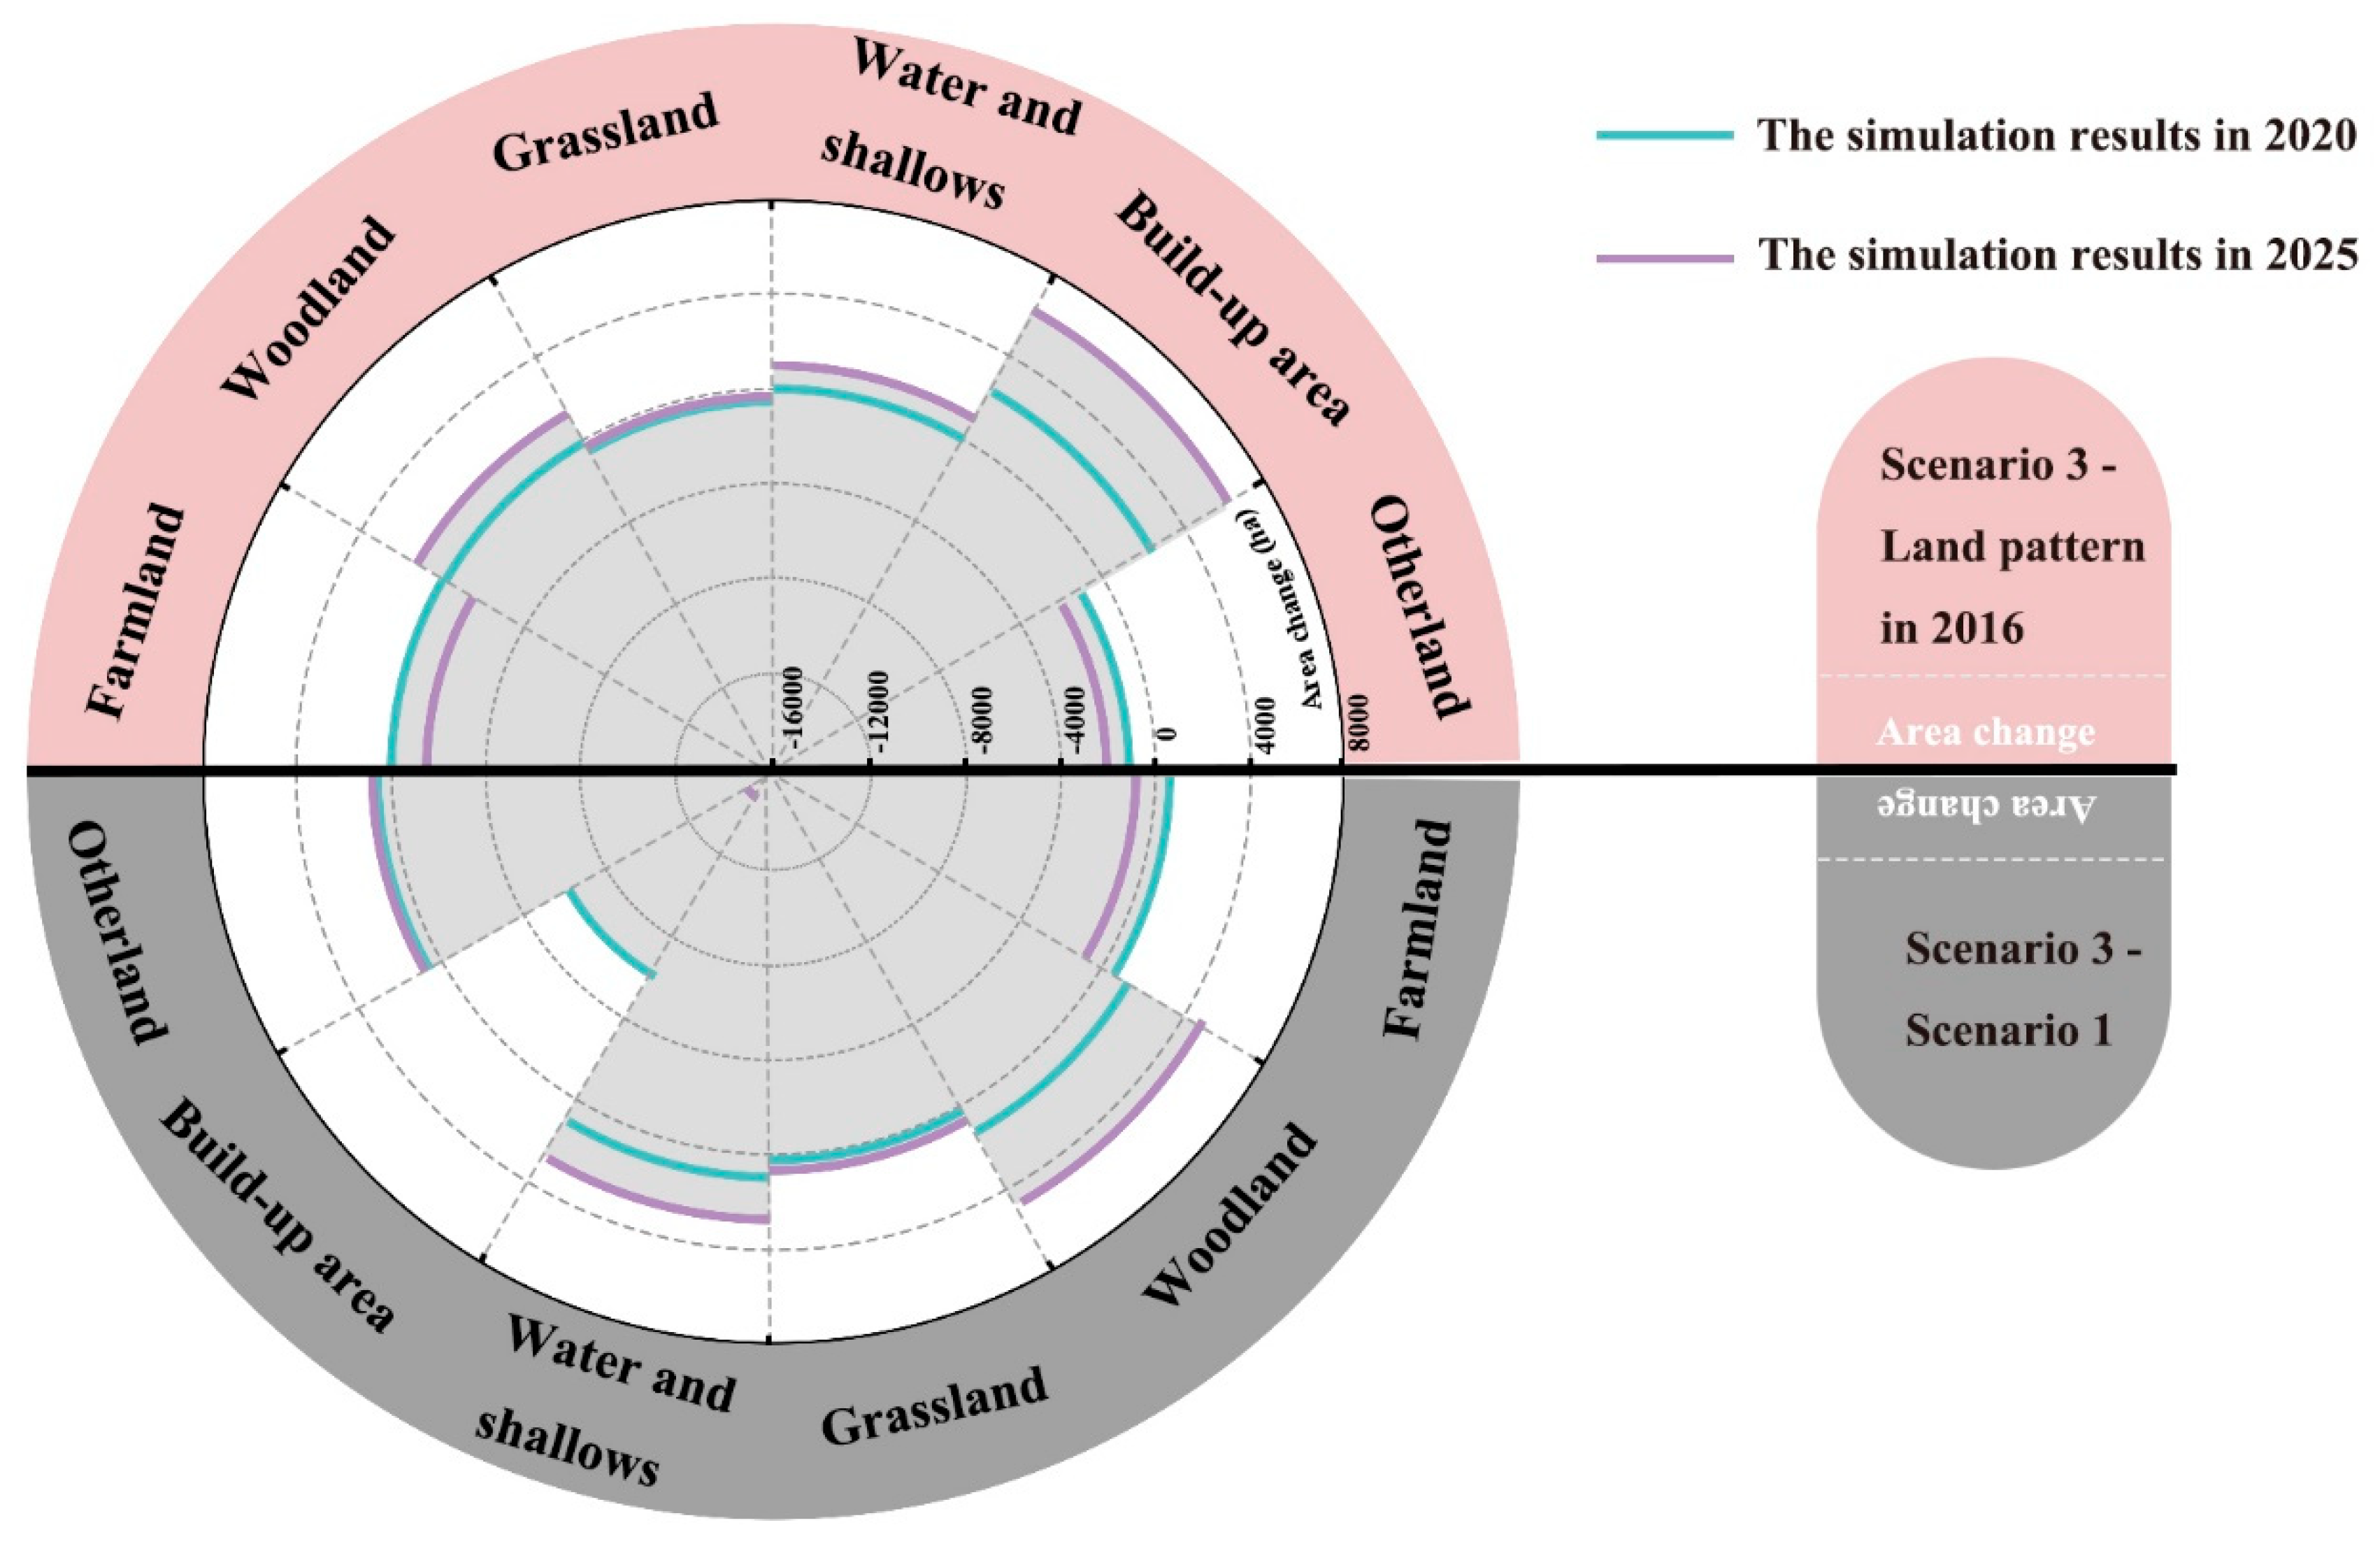
To evaluate the results of the model simulation, the results of the different scenarios were compared. The upper semi-circle in Figure 4 shows that, compared with 2016, by 2020, except for built-up land and other land uses, the remaining land-use types will remain almost unchanged. Built-up land will be allowed to increase by about 2554.48 hectares (Table 6). A limited amount of built-up land is expected to be used for urban construction to achieve the goals of land consolidation and functional concentration as much as possible. Approximately 792.00 hectares of other land can be converted into built-up land (Table 6). By 2025, built-up land will be allowed to increase by 6225.02 hectares compared with 2016. Farmland can proceed with “grain for green” projects to a certain degree to meet the requirements of basic farmland protection. In addition, woodland needs to increase by at least 1652.95 hectares and water and shallows by 1027.88 hectares to counterbalance carbon emissions and urban economic development (Table 6). Woodland provides an irreplaceable carbon sink function and should therefore be highly valued in policymaking.
The lower semicircle in Figure 4 is the difference in the simulated results between the low-carbon economy scenario and the natural scenario. It suggests the possible rapid changes in land use that the government needs to prevent. Built-up land has experienced rapid growth in the past four years. By 2020 and 2025, it is crucial to exercise strict control over the growth of built-up areas; otherwise, these areas may increase dramatically by 6,321.44 hectares (Table 6).
Most carbon emissions are concentrated in urban areas, which is due to the high carbon emissions from human activities. Under the guidance of the IPCC, Chuai et al. obtained the intensity of carbon emissions from various land types in Jiangsu Province from 1985 to 2010 [14]. The emissions intensity of urban land reached its highest value in 2010 (152.40 t C·hm2·a−1). After accounting for the carbon emission factors from various land-use types in 2016, it can be observed that the carbon emissions factor of built-up land is 240.42 t C·hm2·a−1 in Shenzhen, which is 46.86, 10.73, and 218.12 times the carbon emissions from farmland, grassland, and water, respectively. Therefore, restrictions on urban land, especially industrial land, will play a crucial role in reducing local carbon emissions.
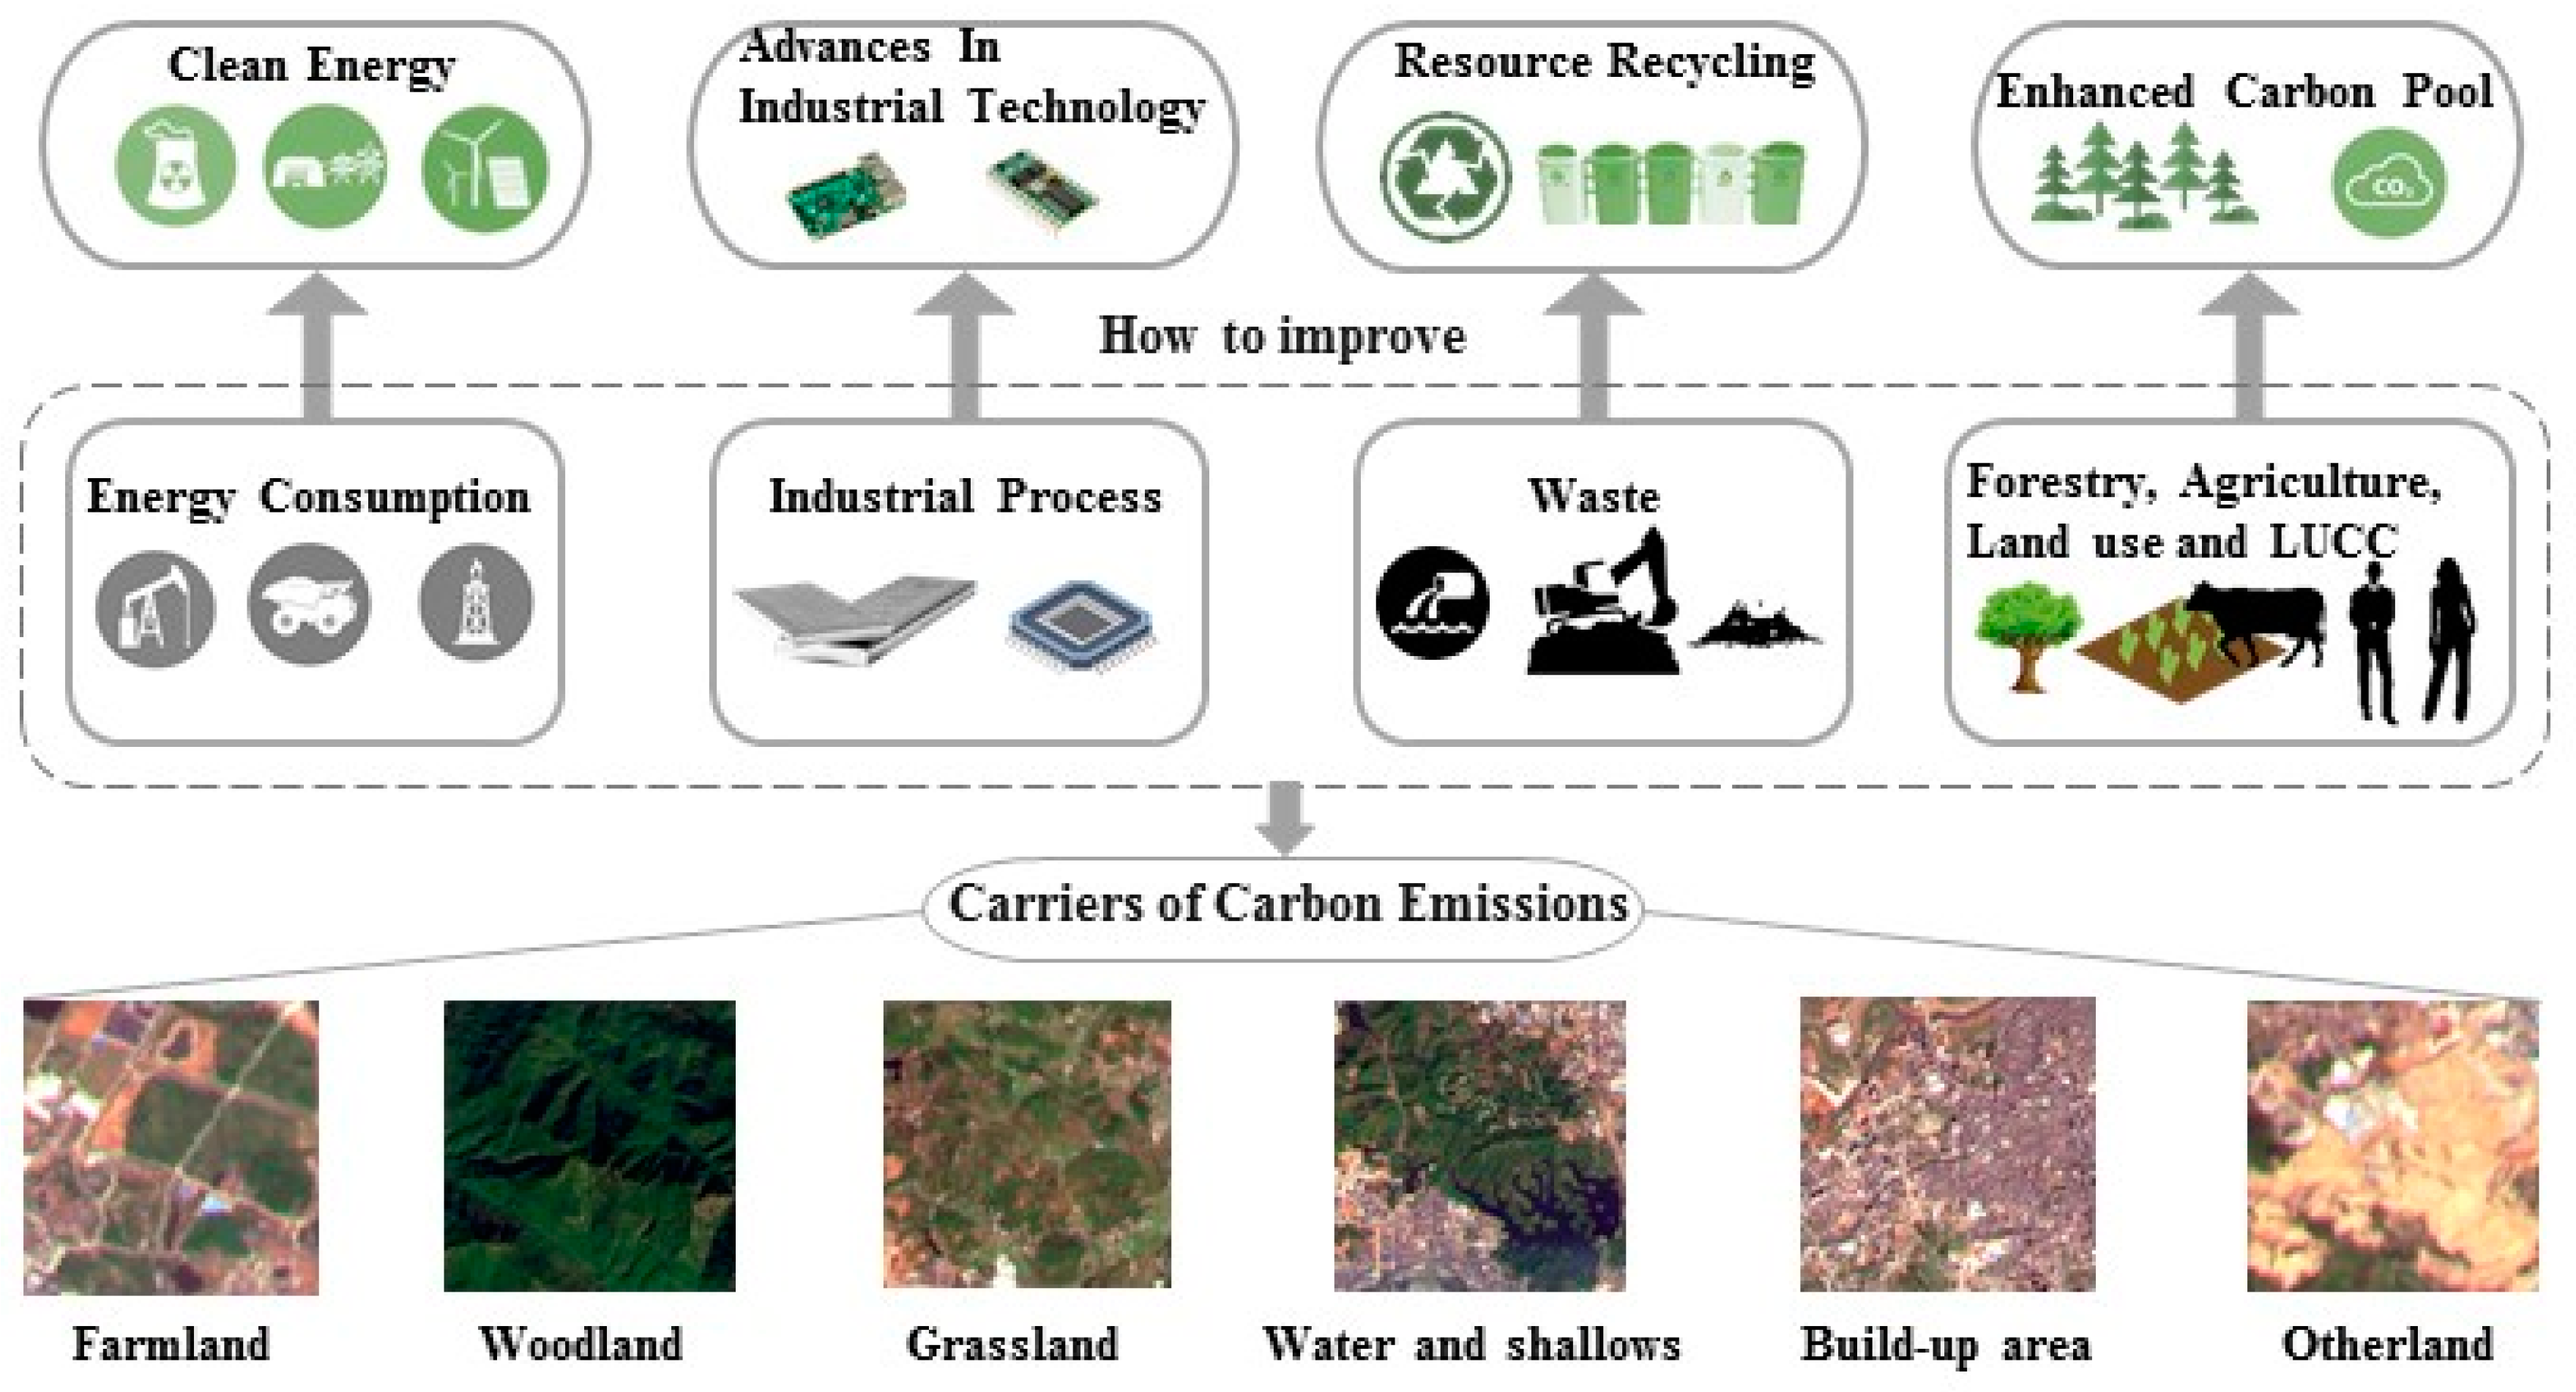
In view of the carbon emissions process proposed by the IPCC, the authors believe that low-carbon city construction can improve the four processes shown in Figure 5. In the case of energy consumption, the study area accounts for 0.21% of China’s total area, but China’s carbon emissions accounting database reveals that the study area accounted for 0.51% of China’s total carbon emissions in 2010, indicating that the carbon intensity of the energy consumption in Shenzhen is 2.44 times the overall level in China. Therefore, the urban energy structure needs to be transformed to a situation where clean energy, such as nuclear, hydro, tidal, and wind energy, is the dominant power source. Second, the reduction in carbon emissions from industrial processes depends on advances in industrial technology. Adjustments in industrial structure, especially the development of knowledge-oriented high-tech industries [38], may bring about a change in carbon emissions. Third, the treatment of wastewater and waste needs to be dramatically improved. Careful classification of garbage is required to achieve reuse of resources. Most cities in China, including Shenzhen, still lack evidence-based and meticulous waste sorting methods and strict legal constraints. Finally, for the fourth process, enhancing the carbon pool, the most important action is to maintain the stable health of vegetation and soil so that they can provide services and continually maximize the carbon sink function.

4.2. Limitations and Future Research Directions

Although the annual carbon intensity of various land uses may differ from those in 2016, the optimized structure can provide a practical solution for the 14th and 15th Five-Year Plans of China. Under the low-carbon economic scenario, the essence of the simulated land-use structure is to limit land areas with high-intensity carbon emissions and increase land areas with low-intensity carbon emissions while achieving economic development. Ecological land can not only provide the service of storing carbon but can also offer services, such as flood control, recreation, and maintaining biodiversity. Compared with the natural scenario, the optimized land-use structure could reduce carbon emissions by 5.97% by 2020 and 12.61% by 2025. The simulated structure could effectively control the sharp decline of ecological land and limit the expansion of built-up land.
The constraints in the MOLP model may result in uncertainty, which can be brought about by a variety of factors, including changes in government development policies, industrial restructuring, and technological improvements. In this case, the model can be realigned to adapt to the new plans, as well as to economic and social requirements, to maintain the function and value of the method. Due to the relatively low level of economic development in China’s vast inland regions, land-use models targeted by emission reductions may have higher potential.
Therefore, the proposed models in this study can be easily extended to other regions in China, providing valuable guidance on carbon emissions reduction for more cities. If the local government pays enough attention and takes effective action, carbon emissions are very likely to be reduced in the near future. The possible challenges for local government mainly include restricting urban expansion, adjusting the conditions for new industrial enterprises, developing intensive land use, strengthening the protection of ecological land, and implementing relevant administrative strategies. These measures also stipulate what is to be performed in specific departments, and local governments can take various actions depending on local conditions.

5. Conclusions

Carbon emissions reduction is a global goal that affects countries around the world [3]. Anthropogenic carbon emissions-related activities result in the land becoming a carrier of carbon emissions. Based on various scenarios, this study carried out a preliminary exploration of the relationship between anthropogenic carbon emissions and land carriers by quantifying the concentration of anthropogenic carbon associated with various land-use types. More importantly, the methods for monitoring carbon emissions proposed by the IPCC were also listed in this study.
The results showed that energy consumption was the dominant source of carbon emissions in Shenzhen, followed by rice, animal, and human physiological carbon emissions (2016). Moreover, most carbon emissions are concentrated in urban areas, and therefore, limiting the expansion of built-up land will play a significant role in reducing carbon emissions. The optimized land-use pattern can not only meet the requirements of economic and social development, but can also reduce carbon emissions significantly, thus providing a viable and practical approach for policymakers to reduce carbon emissions.

Author Contributions

D.H. and R.Q. conceived of and developed the original idea and research plan. D.H. and X.M. led the effort in the data collection/analysis and manuscript preparation. D.H., R.Q., and X.M. took part in the manuscript writing and revisions.

Funding

This research was supported by the National Natural Science Foundation of China (Grant No. 41671180), Application of Landscape Ecological Processes Analysis in urban comprehensive ecological risks assessment of typical cities between mainland China and Taiwan.

Acknowledgments

We express our sincere gratitude to all the participants of this study. We thank International Science Editing (http://www.internationalscienceediting.com) for editing this manuscript.

Conflicts of Interest

The authors declare no conflicts of interest.

References

  1. Solomon, S.; Plattner, G.K.; Knutti, R.; Friedlingstein, P. Irreversible climate change due to carbon dioxide emissions. Proc. Natl. Acad. Sci. USA 2009, 106, 1704–1709. [Google Scholar] [CrossRef] [PubMed] [Green Version]
  2. Canadell, J.G.; Le Quéré, C.; Raupach, M.R.; Field, C.B.; Buitenhuis, E.T.; Ciais, P.; Conway, T.J.; Gillett, N.P.; Houghton, R.A.; Marland, G. Contributions to accelerating atmospheric CO2 growth from economic activity, carbon intensity, and efficiency of natural sinks. Proc. Natl. Acad. Sci. USA 2007, 104, 18866–18870. [Google Scholar] [CrossRef] [PubMed]
  3. Le Quéré, C.; Raupach, M.R.; Canadell, J.G.; Marland, G.; Bopp, L.; Ciais, P.; Conway, T.J.; Doney, S.C.; Feely, R.A.; Foster, P.; et al. Trends in the sources and sinks of carbon dioxide. Nat. Geosci. 2009, 2, 831–836. [Google Scholar] [CrossRef] [Green Version]
  4. United Nations Climate Change Annual Report 2017. Available online: http://unfccc.int/resource/annualreport/index.html#0 (accessed on 6 August 2018).
  5. Green, F.; Stern, N. China’s changing economy: Implications for its carbon dioxide emissions. Clim. Policy 2017, 17, 423–442. [Google Scholar] [CrossRef]
  6. Fang, X.N.; Zhou, B.B.; Tu, X.Y.; Ma, Q.; Wu, J.G. “What kind of a science is sustainability science?” an evidence-based reexamination. Sustainability 2018, 10, 1478. [Google Scholar] [CrossRef]
  7. Feng, K.S.; Davis, S.J.; Sun, L.X.; Li, X.; Guan, D.B.; Liu, W.D.; Liu, Z.; Hubacek, K. Outsourcing CO2 within China. Proc. Natl. Acad. Sci. USA 2013, 110, 11654–11659. [Google Scholar] [CrossRef]
  8. Lund, H.G. Guide for classifying lands for greenhouse gas inventories. J. For. 2006, 104, 211–216. [Google Scholar]
  9. Rounsevell, M.D.A.; Reay, D.S. Land use and climate change in the UK. Land Use Policy 2009, 26, S160–S169. [Google Scholar] [CrossRef]
  10. Piao, S.; Huang, M.; Liu, Z.; Wang, X.; Ciais, P.; Canadell, J.G.; Wang, K.; Bastos, A.; Friedlingstein, P.; Houghton, R.A.; et al. Lower land-use emissions responsible for increased net land carbon sink during the slow warming period. Nat. Geosci. 2018, 11, 739–743. [Google Scholar] [CrossRef]
  11. Le Quéré, C.R.; Moriarty, R.M.; Andrew, G.P.; Peters, P.; Ciais, P.; Friedlingstein, P.; Jones, S.D.; Sitch, S.; Tans, P.; Arneth, A.; et al. Global Carbon Budget 2014. Earth Syst. Sci. Data 2015, 7, 47–85. [Google Scholar] [CrossRef]
  12. Melton, J.R.; Arora, V.K. Sub-grid scale representation of vegetation in global land surface schemes: Implications for estimation of the terrestrial carbon sink. Biogeosciences 2014, 11, 1021–1036. [Google Scholar] [CrossRef]
  13. Hutyra, L.R.; Yoon, B.; Hepinstall-Cymerman, J.; Alberti, M. Carbon consequences of land cover change and expansion of urban lands: A case study in the Seattle metropolitan region. Landsc. Urban Plan. 2011, 103, 83–93. [Google Scholar] [CrossRef]
  14. Chuai, X.W.; Huang, X.J.; Wang, W.J.; Zhao, R.Q.; Zhang, M.; Wu, C.Y. Land use, total carbon emissions change and low carbon land management in coastal Jiangsu, China. J. Clean. Prod. 2015, 103, 77–86. [Google Scholar] [CrossRef]
  15. Mainuddin, M.; Gupta, A.D.; Onta, P.R. Optimal crop planning model for an existing groundwater irrigation project in Thailand. Agric. Water Manag. 1997, 33, 43–62. [Google Scholar] [CrossRef]
  16. Sadeghi, S.H.R.; Jalili, K.; Nikkami, D. Land use optimization in watershed scale. Land Use Policy 2009, 26, 186–193. [Google Scholar] [CrossRef]
  17. Wang, H.R.; Gao, Y.Y.; Liu, Q.; Song, J.X. Land use allocation based on interval multi-objective linear programming model: A case study of Pi county in Sichuan province. Chin. Geogr. Sci. 2010, 20, 176–183. [Google Scholar] [CrossRef]
  18. Rao, Y.X.; Zhou, M.; Ou, G.L.; Dai, D.Y.; Zhang, L.; Zhang, Z.; Nie, X.; Yang, C. Integrating ecosystem services value for sustainable land-use management in Semi-arid region. J. Clean. Prod. 2018, 186, 662–672. [Google Scholar] [CrossRef]
  19. Bourgoin, J.; Castella, J.C.; Hett, C.; Lestrelin, G.; Heinimann, A. Engaging local communities in low emissions land-use planning: A case study from Laos. Ecol. Soc. 2013, 18, 9. [Google Scholar] [CrossRef]
  20. Xu, Q.; Dong, Y.X.; Yang, R. Influence of land urbanization on carbon sequestration of urban vegetation: A temporal cooperativity analysis in Guangzhou as an example. Sci. Total Environ. 2018, 635, 26–34. [Google Scholar] [CrossRef]
  21. Xu, Q.; Dong, Y.X.; Yang, R. Urbanization impact on carbon emissions in the Pearl River Delta region: Kuznets curve relationships. J. Clean. Prod. 2018, 180, 514–523. [Google Scholar] [CrossRef]
  22. Resource and Environment Data Cloud Platform. Available online: http://www.resdc.cn/ (accessed on 26 October 2018).
  23. Shenzhen Statistics. Available online: http://www.sztj.gov.cn/ (accessed on 26 October 2018).
  24. China Emission Accounts and Datasets. Available online: http://www.ceads.net/ (accessed on 26 October 2018).
  25. 2006 IPCC Guidelines for National Greenhouse Gas Inventories. Available online: https://www.ipcc-nggip.iges.or.jp/public/2006gl/ (accessed on 26 October 2018).
  26. Shan, Y.L.; Guan, D.B.; Zheng, H.R.; Ou, J.M.; Li, Y.; Meng, J.; Mi, Z.F.; Liu, Z.; Zhang, Q. Data Descriptor: China CO2 emission accounts 1997–2015. Sci. Data 2018, 5, 170201. [Google Scholar] [CrossRef] [PubMed]
  27. Zhao, R.Q. Carbon Cycle of Urban Eco-Economic System and Its Regulation through Land Use Control: A Case Study of Nanjing City. Ph.D. Dissertation, Nanjing University, Nanjing, China, 2011. [Google Scholar]
  28. Tao, Z.P. Ecological Burden and Ecological Footprint: The Concept of Weight and Area for Sustainable Development; Economic Science Press: Beijing, China, 2003. [Google Scholar]
  29. Lai, L. Carbon Emission Effect of Land Use in China. Ph.D. Dissertation, Nanjing University, Nanjing, China, 2010. [Google Scholar]
  30. Chen, J.F.; Chang, K.T.; Karacsonyi, D.; Zhang, X.L. Comparing urban land expansion and its driving factors in Shenzhen and Dongguan, China. Habitat Int. 2014, 43, 61–71. [Google Scholar] [CrossRef]
  31. Shenzhen Wastewater Treatment Plant Situation Table in 2016. Available online: http://swj.sz.gov.cn/zwfw/bmxx/pshjs/psgltj/201705/t20170517_6708459.htm (accessed on 2 August 2018).
  32. Announcement of the National Environmental Protection Agency on Issuing the “Discharge Standard of Pollutants for Municipal Wastewater Treatment Plant”. Available online: http://kjs.mee.gov.cn/hjbhbz/bzwb/shjbh/swrwpfbz/200307/t20030701_66529.shtml (accessed on 2 August 2018).
  33. Municipal Environmental Status Bulletin of Shenzhen in 2016. Available online: http://www.szhec.gov.cn/xxgk/tjsj/ndhjzkgb/201703/t20170331_6109219.htm (accessed on 2 August 2018).
  34. Han, X.D.; Zhou, Y.; Wang, S.X.; Liu, R.; Yao, Y. GDP specialization in China based on nighttime imagery. J. Geo-Inf. Sci. 2012, 14, 128–136. (In Chinese) [Google Scholar]
  35. Fang, J.Y.; Guo, Z.D.; Piao, S.L.; Chen, A.P. Terrestrial vegetation carbon sinks in China, 1981–2000. Sci. China Ser. D Earth Sci. 2007, 50, 1341–1350. [Google Scholar] [CrossRef]
  36. Fang, J.Y.; Yu, G.R.; Liu, L.L.; Hu, S.J.; Chapin, F.S. Climate change, human impacts, and carbon sequestration in China. Proc. Natl. Acad. Sci. USA 2018, 115, 4015–4020. [Google Scholar] [CrossRef] [Green Version]
  37. Raymond, P.A.; Hartmann, J.; Lauerwald, R.; Sobek, S.; McDonald, C.; Hoover, M.; Butman, D.; Striegl, R.; Mayorga, E.; Humborg, S.; et al. Global carbon dioxide emissions from inland waters. Nature 2013, 503, 355–359. [Google Scholar] [CrossRef] [Green Version]
  38. Zacharias, J.; Tang, Y.Z. Restructuring and repositioning Shenzhen, China’s new mega city. Prog. Plan. 2010, 73, 209–249. [Google Scholar] [CrossRef]
Figure 1. The location of the study area and the distribution of land-use types in 2016.
Sustainability 11 00011 g001
Figure 2. Carbon emissions inventory of Shenzhen in 2016.
Sustainability 11 00011 g002
Figure 3. Changes in low-carbon scenarios compared with the natural scenario for 2020 and 2025.
Sustainability 11 00011 g003
Figure 4. Area changes represented by the simulation results for 2020 and 2025.
Sustainability 11 00011 g004
Figure 5. Low-carbon city construction in relation to the four factors that contribute to carbon emissions.
Sustainability 11 00011 g005
Table 1. Assignment of the four factors that contribute to carbon emissions across various land-use types.
Land Use TypesEnergy ConsumptionIndustrial ProcessWasteForestry, Agriculture, Land Use, and LUCC
Land Use and LUCCAnimals
FarmlandAgricultureVegetation and Soil
WoodlandForestryVegetation and Soil
GrasslandAnimal husbandryVegetation and SoilAnimals
Water and shallowsFisherySoil
Built-up areaIndustry, construction, wholesale and retail trade and catering, residential consumption, transport, storage, postal and telecommunication services, other servicesIndustrial productionWaste water and solid garbage from industry and householdVegetation and SoilPopulation
Other landSoil
Table 2. Constraints of the optimization scenario based on the multi-objective linear programming (MOLP) model in Shenzhen.
Constraints20202025
Lower Limit (hm2)Upper Limit (hm2)Lower Limit (hm2)Upper Limit (hm2)
Total area constraints-201,219.00-205,388.65
Farmland constraints2688.003961.062318.623961.06
Wood land constraints78,448.61-80,101.57-
Grass land constraints2125.002500.002250.002625.00
Water and shallows constraints14,473.8720,669.0015,501.7522,519.80
Built-up area constraints94,525.25100,400.00102,709.04111,380.60
Other land constraints3168.00-2217.60-
Table 3. Land transfer matrix from 2012 to 2016 in Shenzhen.
Transfer in
GrasslandFarmlandBuilt-up AreaWoodlandOther LandWater and Shallows
Grassland 49.26390.5712.311.90 × 10−35.90
Farmland6.70 × 10−3 383.3322.572.00 × 10−54.85
Built-up area1.61132.63 689.012.9718.66
Woodland6.50 × 10−3878.232147.96 6.40 × 10−321.41
Other land4.80 × 10−357.911296.2920.83 1.42
Water and shallows6.50 × 10−3117.21536.5625.436.30 × 10−3
Transfer out
GrasslandFarmlandBuilt-up AreaWoodlandOther LandWater and Shallows
Grassland −6.70 × 10⁻³−1.61−6.50 × 10⁻³−4.80 × 10⁻³−6.50 × 10⁻³
Farmland−49.26 −132.63−878.23−57.91−117.21
Built-up area−390.57−383.33 −2147.96−1296.29−536.56
Woodland−12.31−22.57−689.01 −20.83−25.43
Other land−1.90 × 10−30.00−2.97−6.40 × 10⁻³ −6.30 × 10⁻³
Water and shallows−5.90−4.85−18.66−21.41−1.42
Table 4. Carbon emission and economic benefit coefficients of various land-use types in Shenzhen in 2016.
Land typeArea in 2016/hm2Total Carbon Emissions/tIntensity of Carbon Emissions/t C·hm−2·a−1
Farmland3961.0620,322.615.13
Woodland78,448.62−20,540.40−0.26
Grassland2401.5753,832.7322.42
Water and shallows14,473.8715,953.981.10
Built-up area96,483.9823,197,153.91240.42
Other land3960.00−30.10−0.76 × 10⁻³
Table 5. Simulated results for land-use structure under the three scenarios.
Items20202025
Natural ScenarioLow Carbon ScenarioLow Carbon Economic ScenariosNatural ScenarioLow Carbon ScenarioLow Carbon Economic Scenarios
Farmland/ha3561.932688.003961.063119.092318.622608.69
Woodland/ha77,084.2684,238.8878,448.6175,412.1280,391.6480,101.57
Grassland/ha2053.722125.0021251688.882250.002250.00
Water and shallows/ha13,392.3314,473.8714,473.8712,153.3415,501.7515,501.75
Built-up area/ha105,363.9094,525.2599,042.46117,621.74102,709.00102,709.00
Other land area/ha2658.323168.003168.001615.282217.602217.60
Total area/ha201,603.40201,219.00201,219.00203,971.03205,388.65205,388.65
Total carbon emissions/t25,390,976.2122,781,523.5723,875,621.0828,326,696.3624,752,155.4024,753,719.58
GDP/104 Yuan20,271.2018,735.6819,605.5121,712.3219,696.9919,768.95
Table 6. Area changes represented by the simulation results for 2020 and 2025 (illustrated in Figure 4).
Scenario 3—Land Pattern in 2016Scenario 3—Scenario 1
2020202520202025
Farmland0.00−1352.37399.13−510.4
Woodland−0.011652.951364.354689.45
Grassland−276.57−151.5771.28561.12
Water and shallows0.001027.881081.543348.41
Built-up land2558.486225.02−6321.44−14912.7
Other land−792.00−1742.40509.68602.32