Rescaled Statistics and Wavelet Analysis on Agricultural Drought Disaster Periodic Fluctuations in China from 1950 to 2016


Abstract
:1. Introduction
2. Materials and Methods
2.1. Study Area Description
2.2. Data
2.3. Methods
2.3.1. R/S Method
2.3.2. The Wavelet Transform
3. Results and Analysis
3.1. Analysis of the Hurst Index Change Trend of the Agricultural Drought Disaster
3.2. Analysis of the Agricultural Drought Disaster Area Variation Characteristics
3.3. Analysis of the Inundated Area of the Agricultural Drought Disaster Variation Characteristics
3.4. Analysis of the Grain Loss Variation Characteristics
4. Conclusions
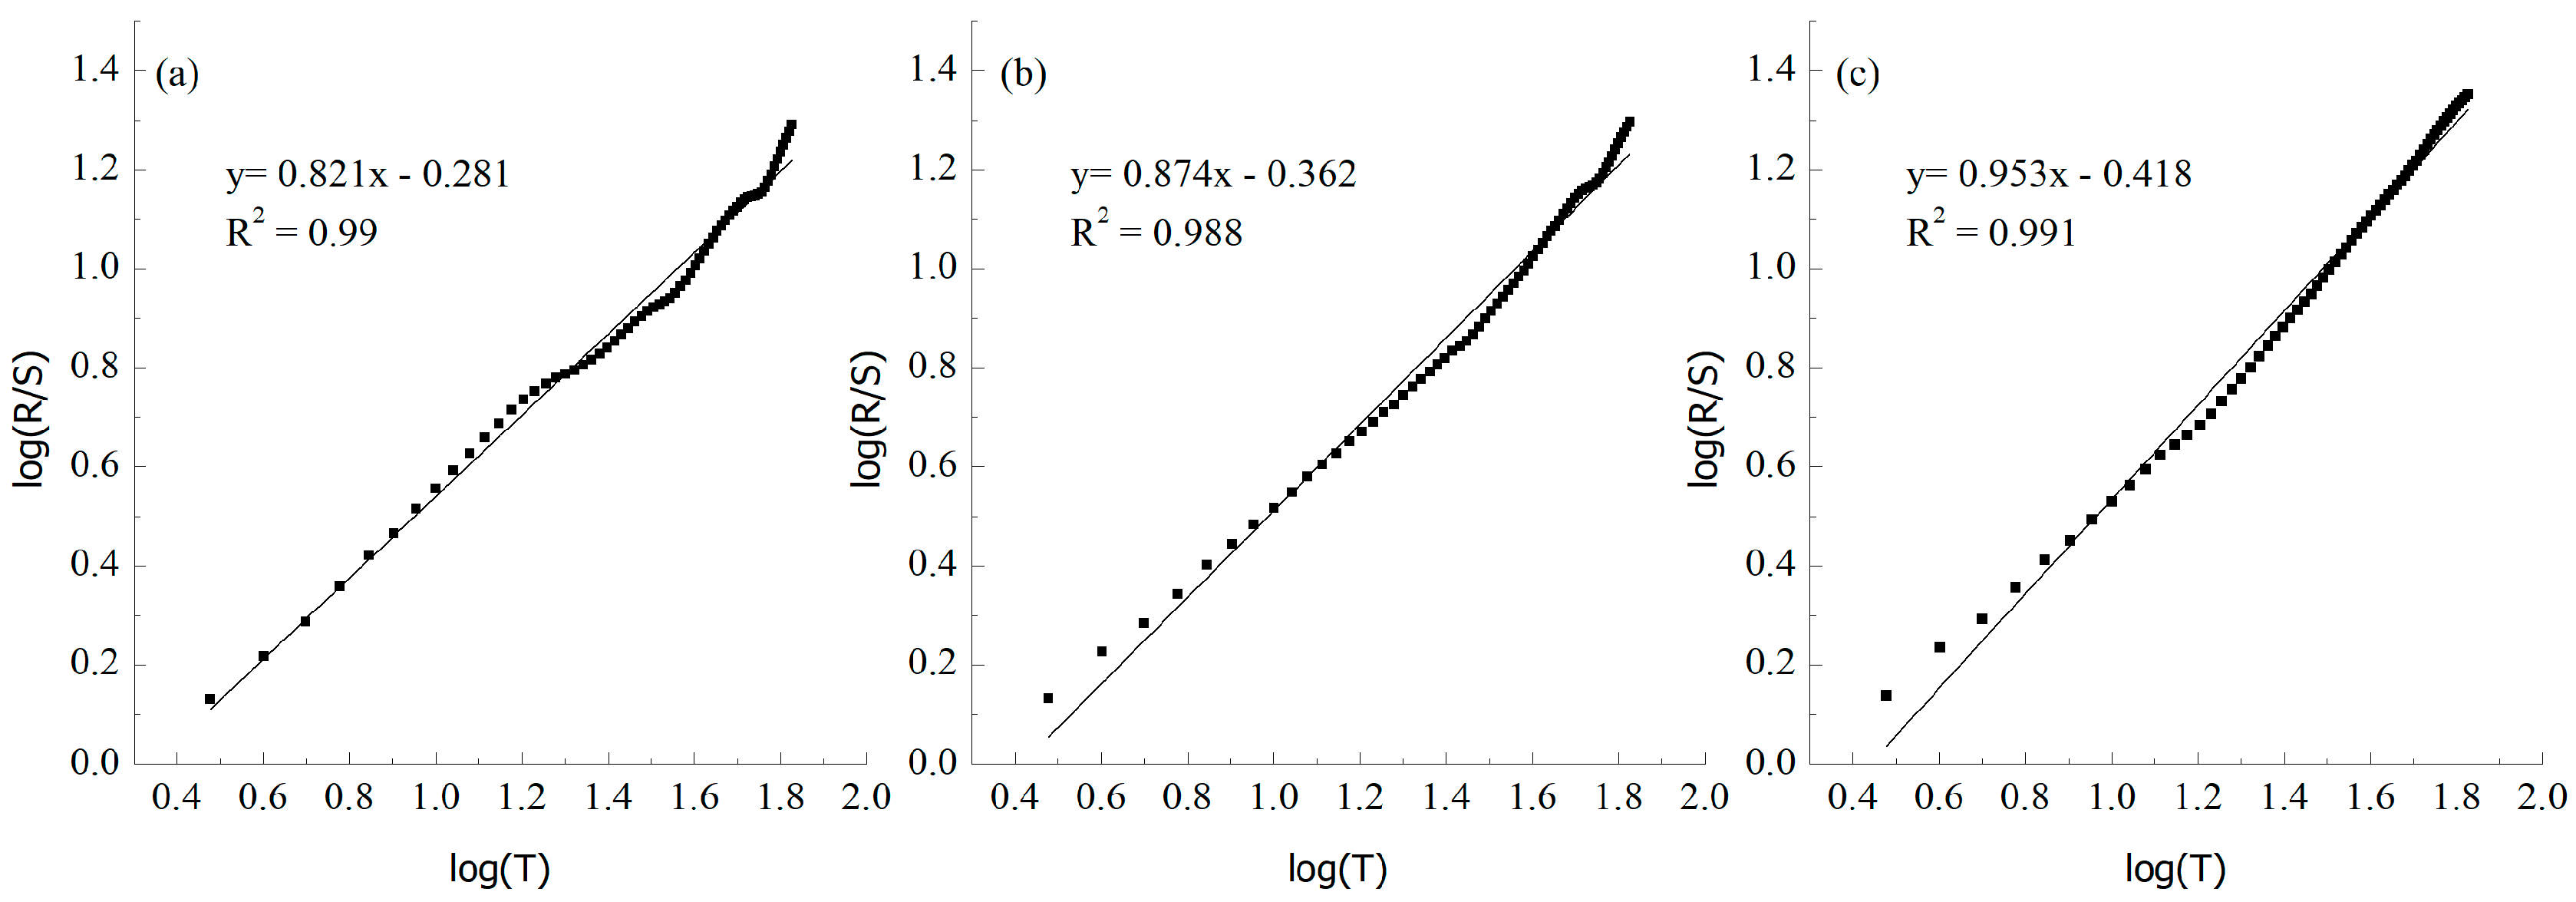
- (1)
- During the study period (1950–2016), the Hurst index of the agricultural disaster area, the inundated area of agricultural drought disaster and the grain loss was 0.821, 0.874, and 0.953, respectively, indicating the agricultural drought disaster had a long-enduring characteristic in China. Since the overall trend of the agricultural drought increased in the past, it will still increase in the future.
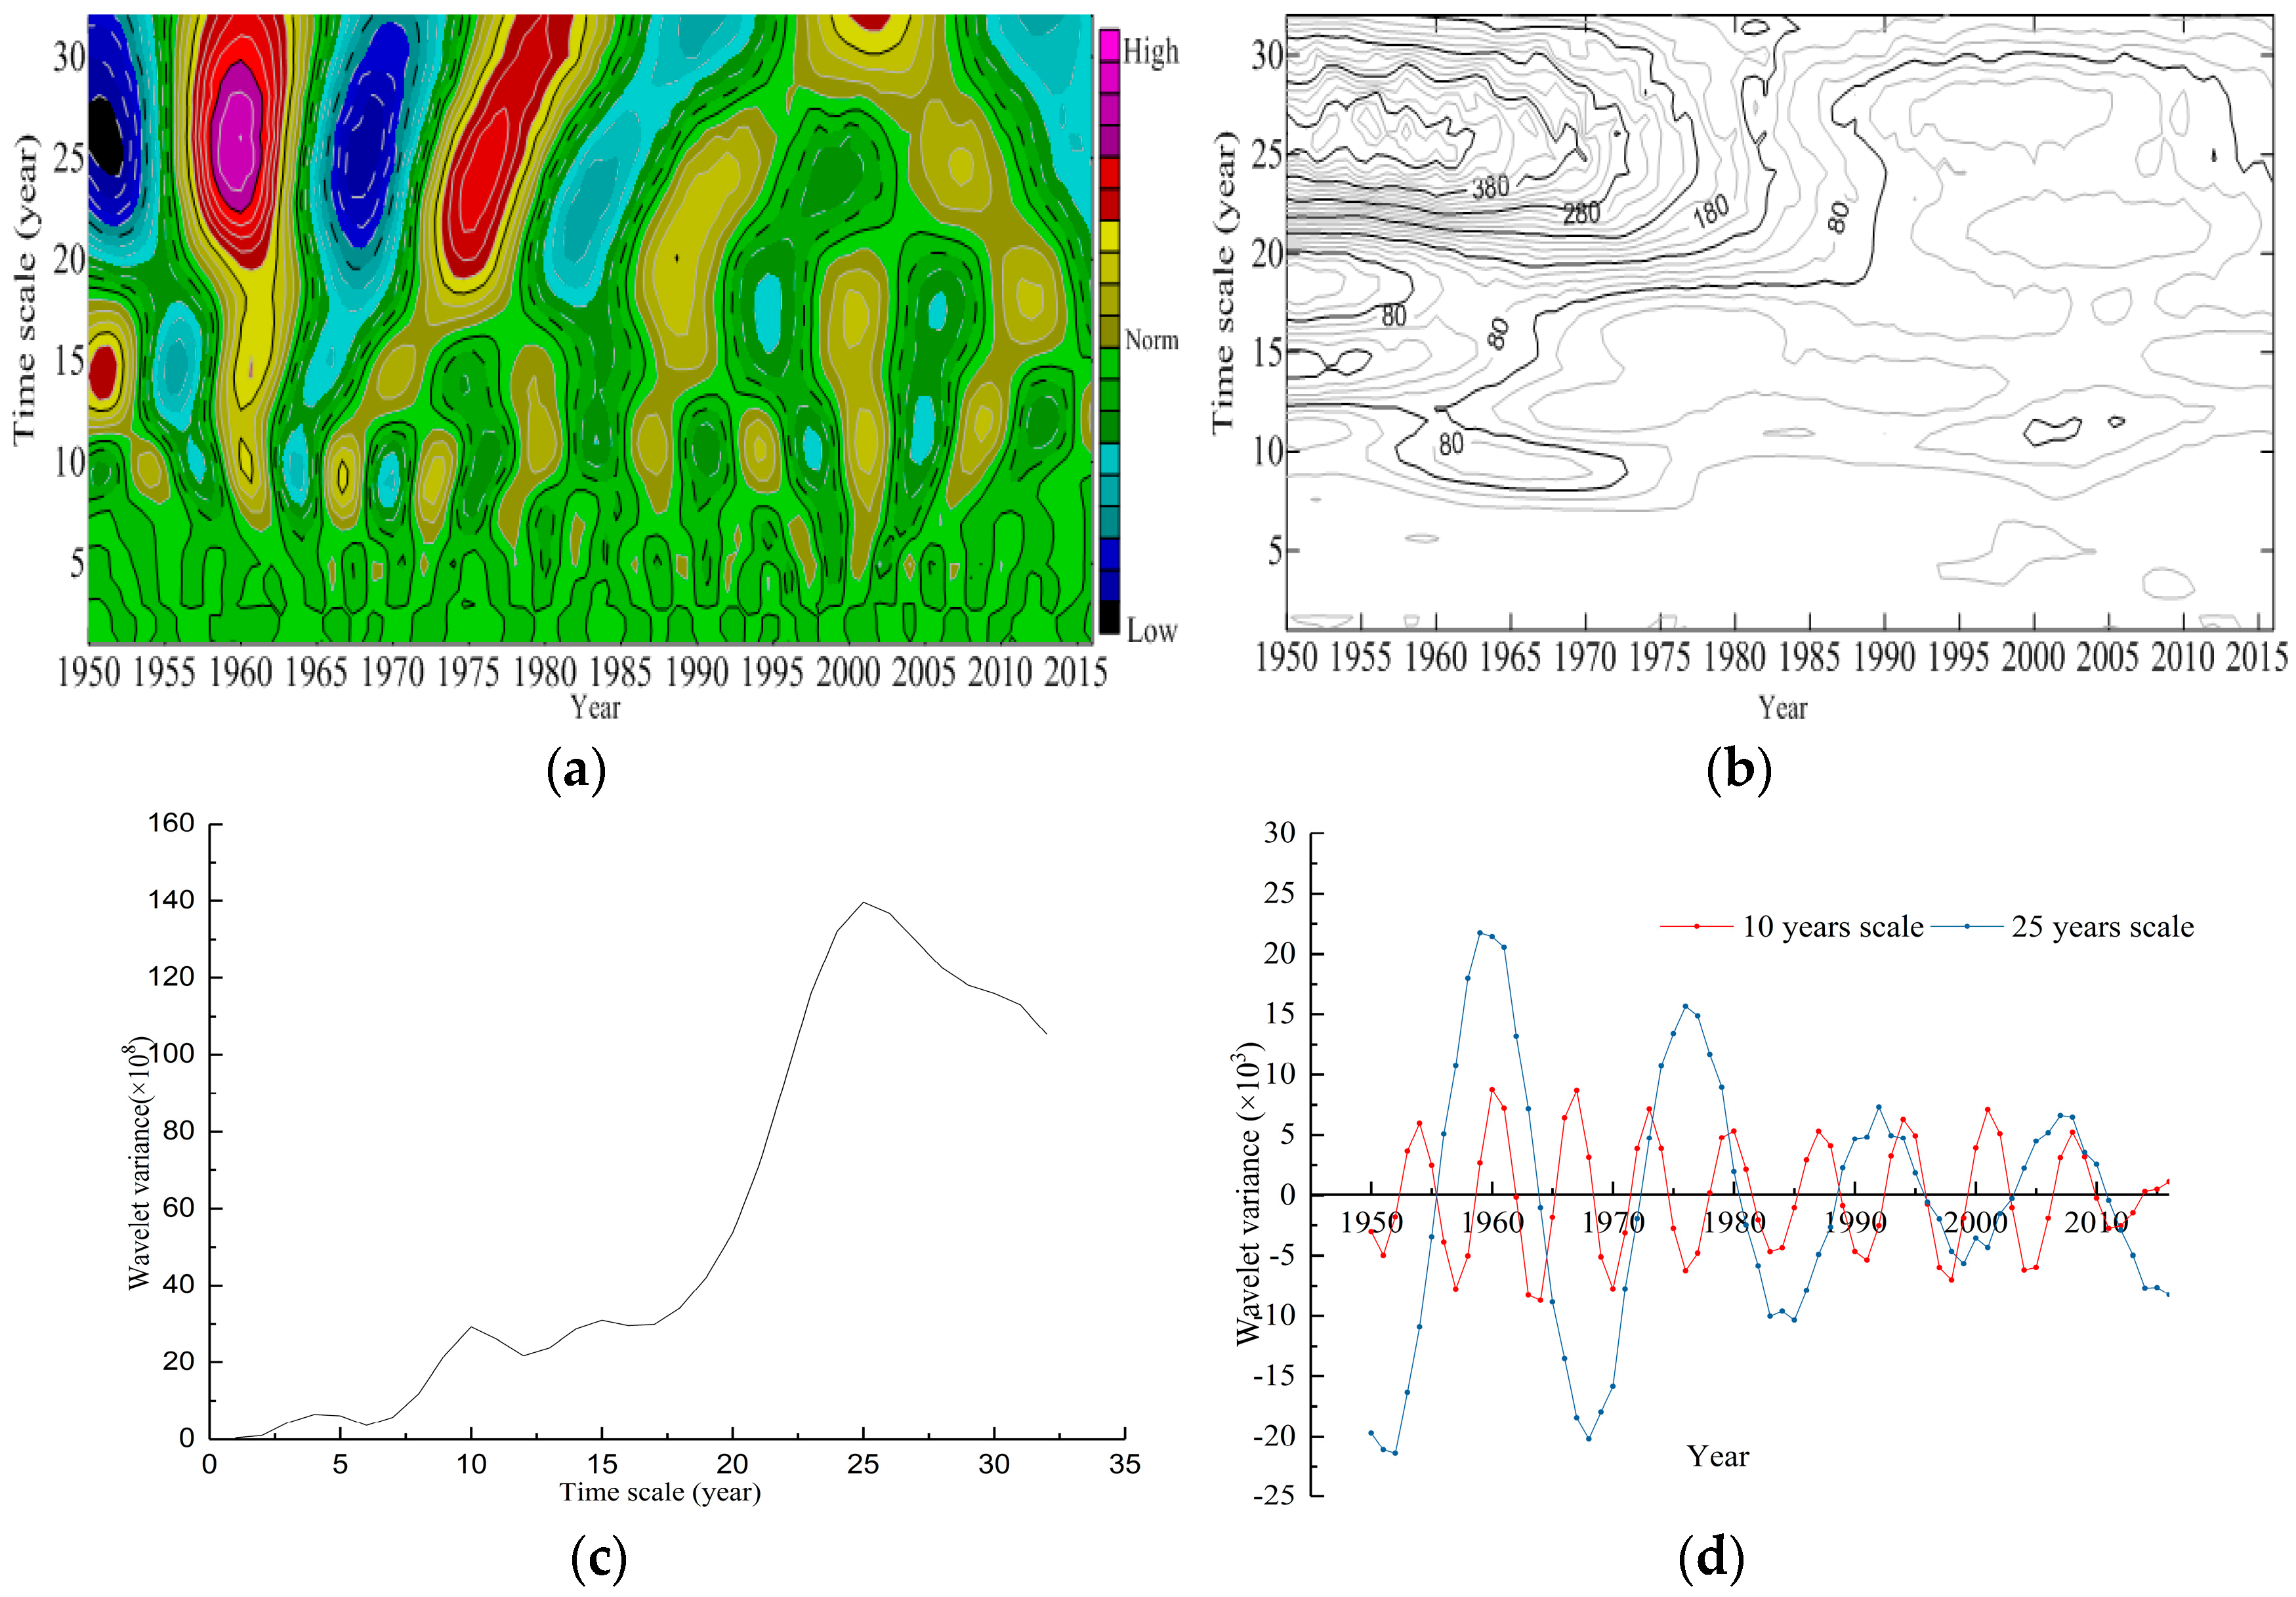
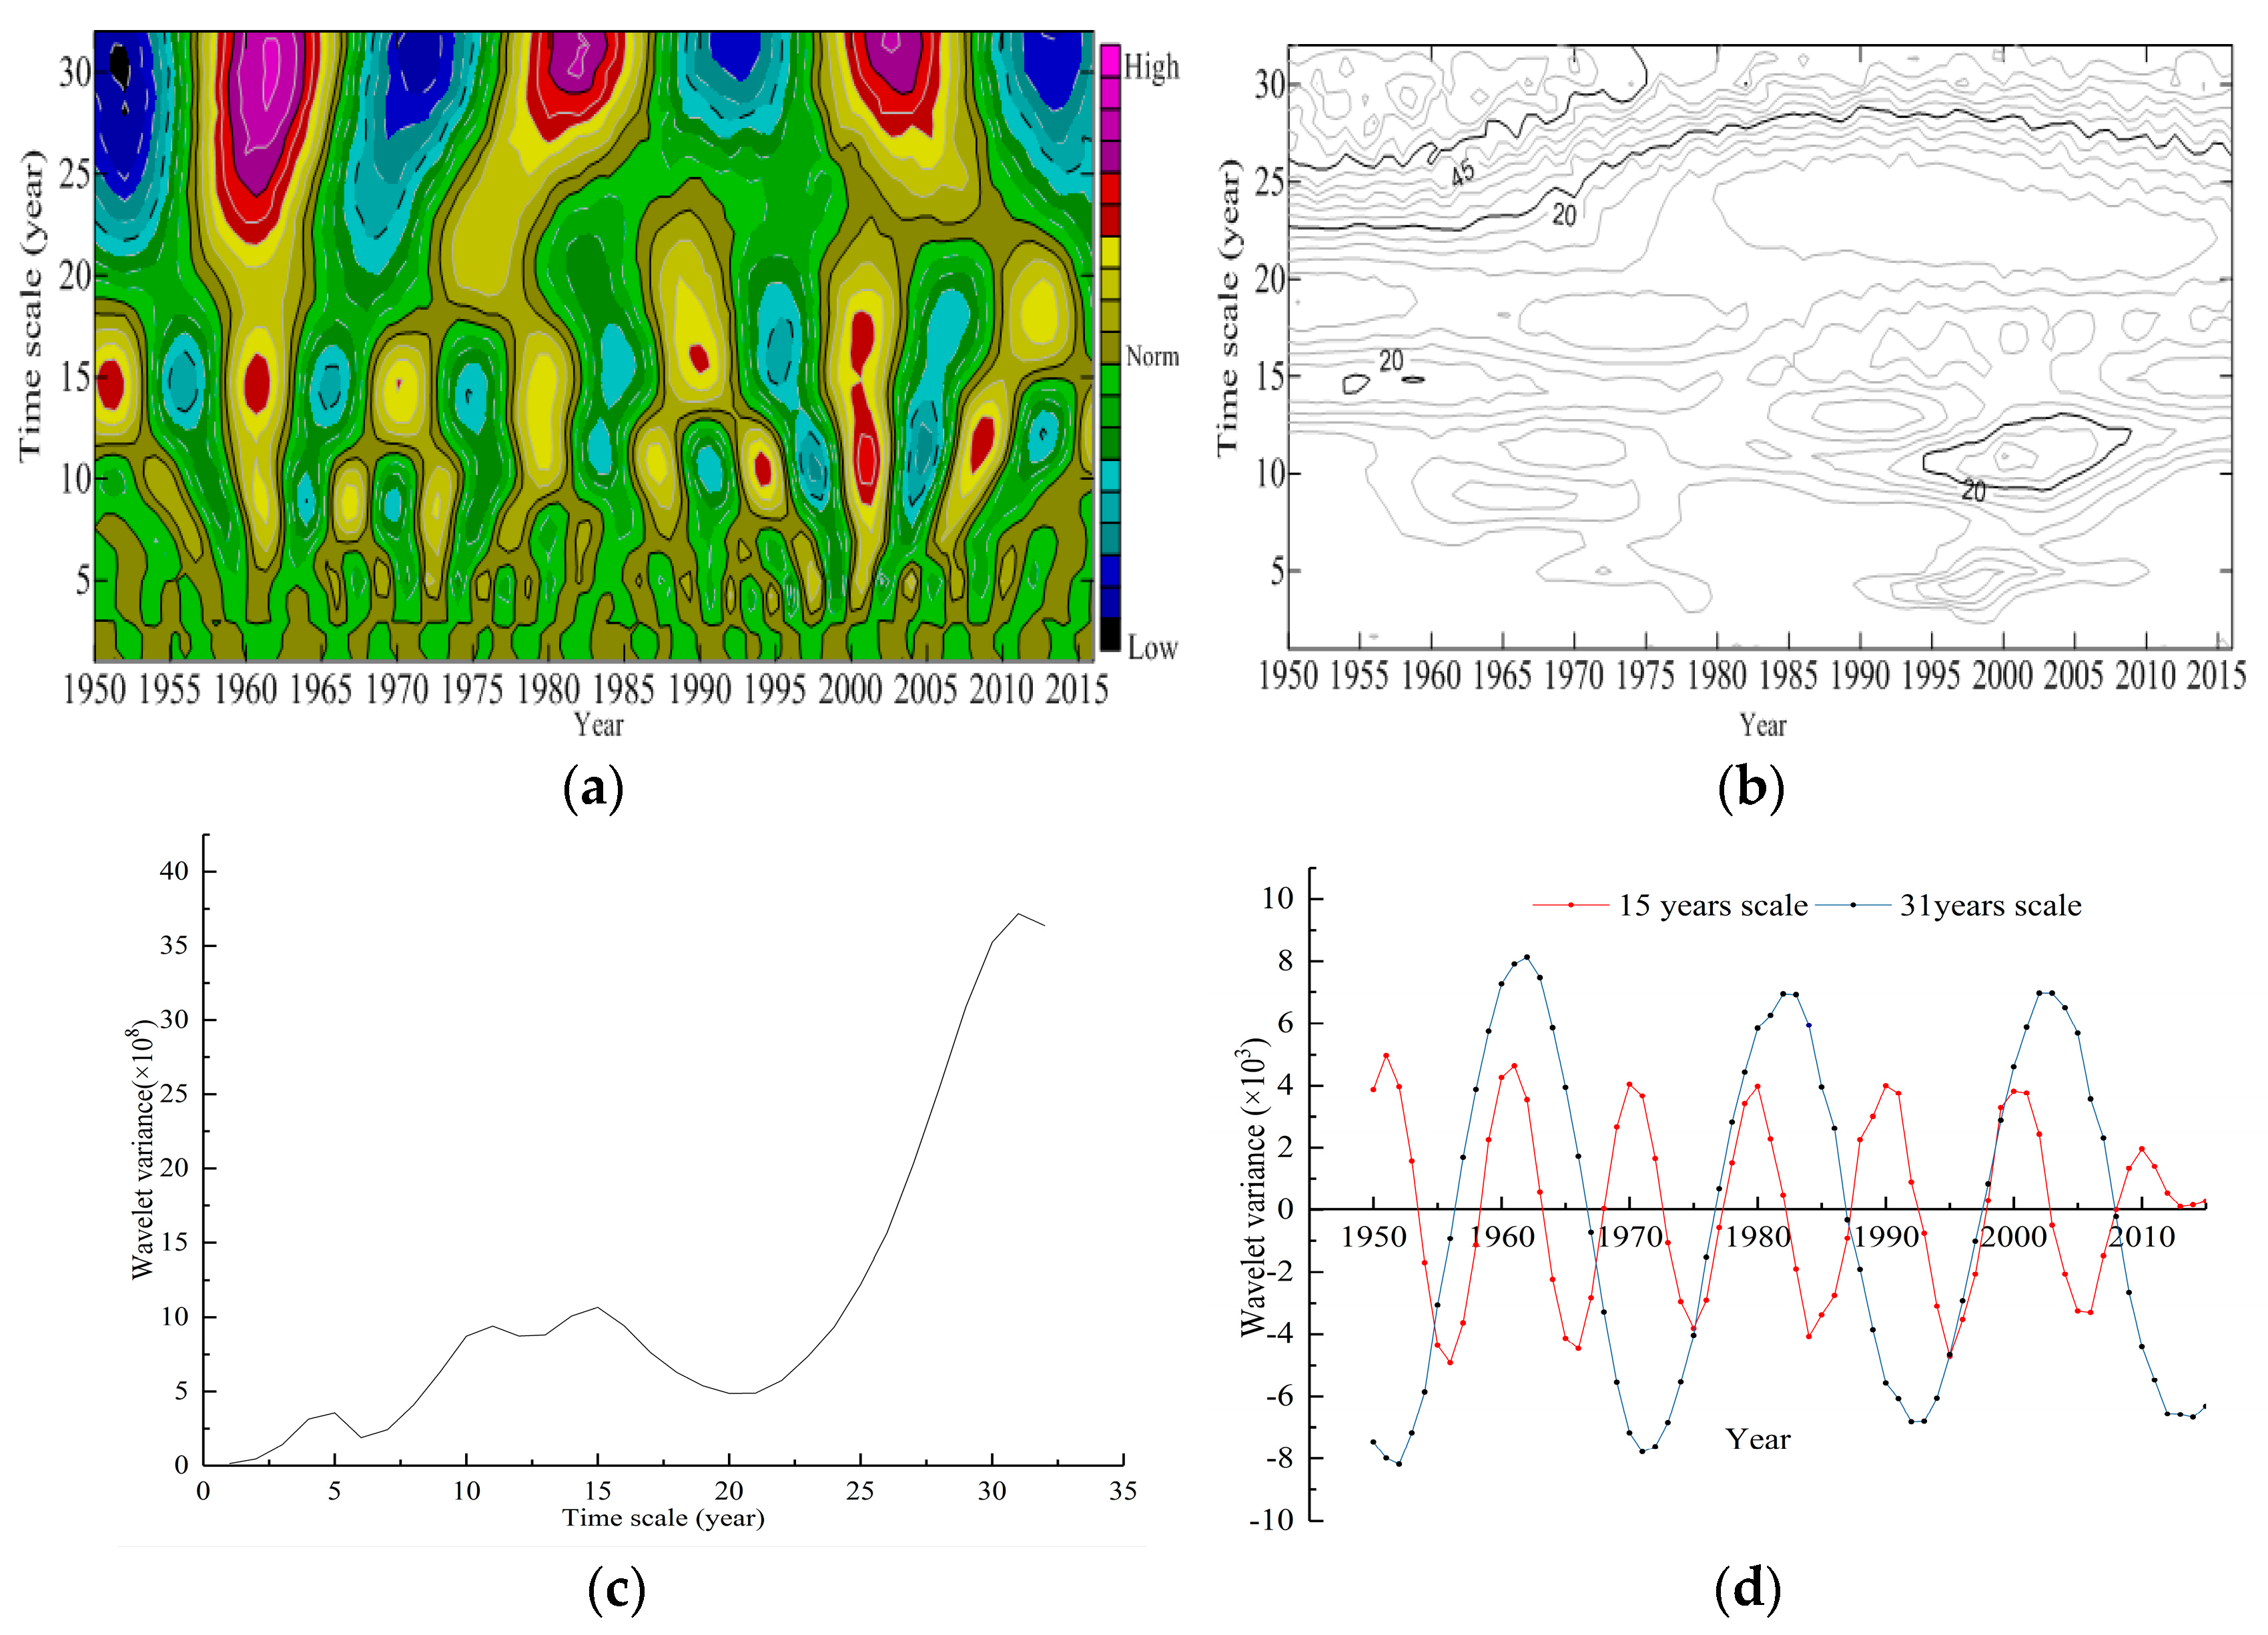
- (2)
- According to the results of the Morlet analysis of the agricultural disaster area and the inundated area of agricultural drought disaster, we noticed that the time series of the agricultural drought had multiple time scale features. That is to say, the periodic variation on a large scale contained periodic variation on a small scale.
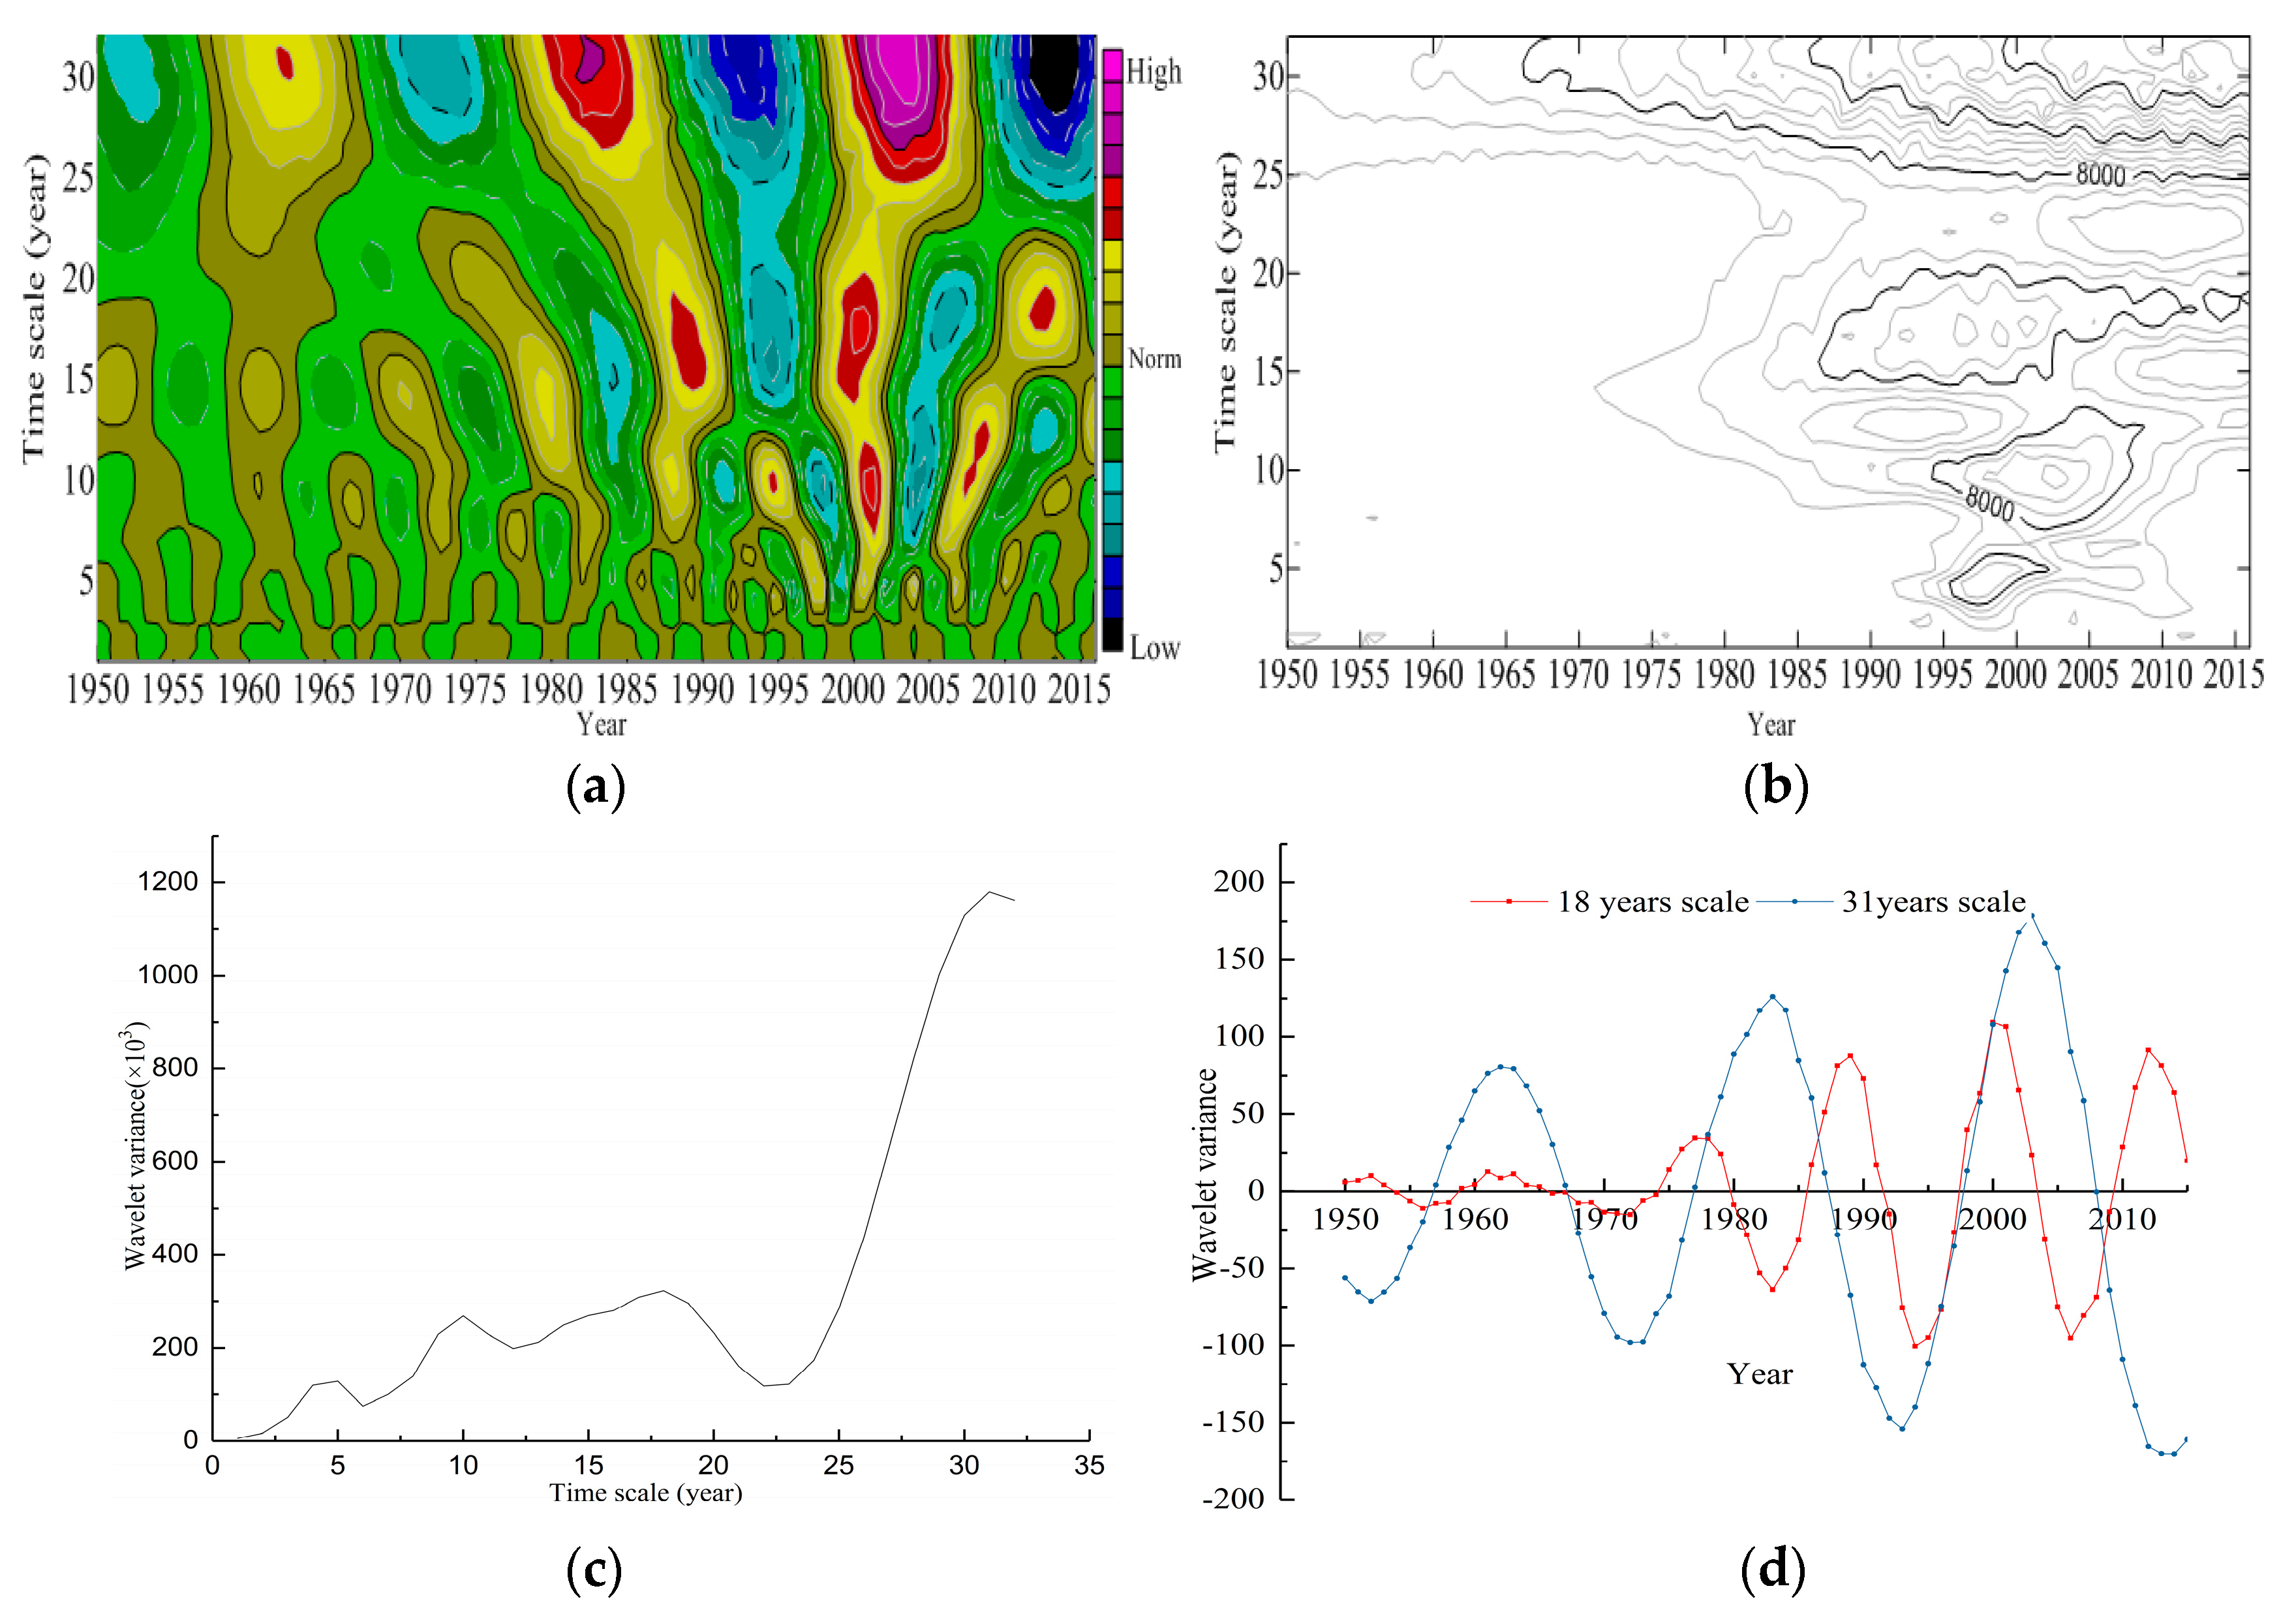
- (3)
- In the last 67 years, the strong wavelet energy spectrum of the agricultural disaster area, the inundated area of agricultural drought disaster, and the grain loss had an average period of approximately 16 years, 16 years, and 18 years, respectively. Furthermore, the cycle changes of the agricultural drought disaster area and the inundated area of the agricultural drought disaster had a localization characteristic before 1980, while the cycle changes of the grain loss had a localization characteristic after 1975.
- (4)
- According to the results, it was concluded that wavelet analysis can be a useful method to analyze detailed temporal patterns of agricultural drought disaster over different temporal scales. Furthermore, in our study, we only forecasted the trend of the agricultural drought disaster, and as a future work, we will use the model for forecasting the level of drought disaster in subsequent years. In addition, in this study we took the whole of China as an example; however, China has a complex climate and different plants, and as such, in a future study we will study the agricultural drought disaster at the provincial scale.
Author Contributions
Funding
Acknowledgments
Conflicts of Interest
References
- Homdee, T.; Pongput, K.; Kanae, S. A comparative performance analysis of three standardized climatic drought indices in the chi river basin, Thailand. Agric. Nat. Resour. 2016, 50, 211–219. [Google Scholar] [CrossRef]
- Glantz, M.H. Understanding: The drought phenomenon: The role of definitions. Water Int. 1985, 10, 111–120. [Google Scholar]
- Heim, R.R.J. A review of twentieth-century drought indices used in the United States. Bull. Am. Meteorol. Soc. 2002, 83, 1149–1165. [Google Scholar] [CrossRef]
- Wang, J.S. Progress and prospect on drought indices research. Arid Land Geogr. 2007, 1, 12. [Google Scholar]
- Wu, Z.; Mao, Y.; Li, X.; Lu, G.; Lin, Q.; Xu, H. Exploring spatiotemporal relationships among meteorological, agricultural, and hydrological droughts in southwest china. Stoch. Environ. Res. Risk Assess. 2015, 30, 1–12. [Google Scholar] [CrossRef]
- Bao, G.; Liu, Y.; Liu, N.; Linderholm, H.W. Drought variability in eastern Mongolian plateau and its linkages to the large-scale climate forcing. Clim. Dyn. 2015, 44, 717–733. [Google Scholar] [CrossRef]
- Wang, Q.; Wu, J.; Lei, T.; He, B.; Wu, Z.; Liu, M.; Mo, X.; Geng, G.; Li, X.; Zhou, H. Temporal-spatial characteristics of severe drought events and their impact on agriculture on a global scale. Quat. Int. 2014, 349, 10–21. [Google Scholar] [CrossRef]
- Guo, H. Spatial and temporal characteristics of droughts in central Asia during 1966–2015. Sci. Total Environ. 2018, 624, 1523–1538. [Google Scholar] [CrossRef] [PubMed]
- Zhao, G.; Zhou, G.; Wang, J. Application of r/s method for dynamic analysis of additional strain and fracture warning in shaft lining. J. Sens. 2015, 2015, 1–7. [Google Scholar]
- Mandelbrot, B.B. The Fractal Geometry of Nature; Birkhauser Verlag: Basel, Switzerland, 1983; p. 468. [Google Scholar]
- Polikar, R. The Story of Wavelets. Available online: https://pdfs.semanticscholar.org/6ec3/e93c0f3bb0a0c653ab4091edc68a8780d037.pdf (accessed on 18 May 2018).
- July, F. Drought risk assessment in Yunnan province of china based on wavelet analysis. Adv. Meteorol. 2015, 2016, 1–10. [Google Scholar]
- Peng, J.; Liu, Z.; Liu, Y.; Wu, J.; Han, Y. Trend analysis of vegetation dynamics in Qinghai–Tibet plateau using hurst exponent. Ecol. Indic. 2012, 14, 28–39. [Google Scholar] [CrossRef]
- Serban, C.; Maftei, C. Evaluation of hurst exponent for precipitation time series. In Proceedings of the Wseas International Conference on Computers, Corfu Island, Greece, 23–25 July 2010; Volume 2, pp. 590–595. [Google Scholar]
- Huang, R.; Yong, L.; Lin, W. Analyses of the causes of severe drought occurring in southwest china from the fall of 2009 to the spring of 2010. Chin. J. Atmos. Sci. 2012, 36, 443–457. [Google Scholar]
- Li, S.K.; Huo, Z.G.; Wang, S.Y.; Liu, R.H.; Sheng, S.X.; Liu, J.L.; Ma, S.Q.; Xue, C.Y. Risk evaluation system and models of agrometeorological disasters. J. Nat. Disasters 2004, 13, 77–87. [Google Scholar]
- Zhang, J. Risk assessment of drought disaster in the maize-growing region of Song Liao plain, China. Agric. Ecosyst. Environ. 2004, 102, 133–153. [Google Scholar] [CrossRef]
- Liu, Y.B.; Liu, L.M.; Xu, D.; Zhang, S.H. Risk assessment of flood and drought in major grain-producing areas based on information diffusion theory. Trans. Chin. Soc. Agric. Eng. 2010, 26, 1–7. [Google Scholar]
- Liu, Z.; Zhou, P.; Zhang, F.; Liu, X.; Chen, G. Spatiotemporal characteristics of dryness/wetness conditions across Qinghai province, northwest China. Agric. For. Meteorol. 2013, 182–183, 101–108. [Google Scholar] [CrossRef]
- Liu, Z.; Zhang, X.; Fang, R. Multi-scale linkages of winter drought variability to enso and the arctic oscillation: A case study in Shaanxi, north China. Atmos. Res. 2017, 200, 117–125. [Google Scholar] [CrossRef]
- Granero, M.A.S.; Segovia, J.E.T.; Pérez, J.G. Some comments on hurst exponent and the long memory processes on capital markets. Phys. A Stat. Mech. Appl. 2012, 387, 5543–5551. [Google Scholar] [CrossRef]
- Hurst, H.E. Long term storage capacity of reservoirs. Trans. Am. Soc. Civ. Eng. 1951, 116, 776–808. [Google Scholar]
- Wang, X.L.; Hu, B.Q.; Xia, J. R/s analysis method of trend and aberrance point on hydrological time series. J. Wuhan Univ. Hydraul. Electr. Eng. 2002, 35, 10–12. [Google Scholar]
- Yu, Y.; Chen, X.W. Analysis of future trend characteristics of hydrological time series based on r/s and mann-kendall methods. J. Water Resour. Water Eng. 2008, 9, 41–44. [Google Scholar]
- Shi, P.; Wu, M.; Qu, S.; Jiang, P.; Qiao, X.; Chen, X.; Zhou, M.; Zhang, Z. Spatial distribution and temporal trends in precipitation concentration indices for the southwest china. Water Resour. Manag. 2015, 29, 3941–3955. [Google Scholar] [CrossRef]
- Zhao, G.S.; Zhou, G.Q.; Zhao, X.D.; Wei, Y.Z.; Li, L.J. R/s analysis for stress evolution in shaft lining and fracture prediction method. Adv. Mater. Res. 2012, 374–377, 2271–2274. [Google Scholar] [CrossRef]
- Piotrkowski, R.; Gallego, A.; Castro, E.; García-Hernandez, M.T.; Ruzzante, J.E. Ti and cr nitride coating/steel adherence assessed by acoustic emission wavelet analysis. NDT E Int. J. 2005, 38, 260–267. [Google Scholar] [CrossRef]
- D’Attellis, C.E.; Fernández-Berdaguer, E.M. Wavelet Theory and Harmonic Analysis in Applied Sciences; Birkhauser: Basel, Switzerland, 1997; pp. 3–13. [Google Scholar]
- Daubechies, I. Ten lectures on wavelets. CBMS-NSF Ser. Appl. Math. SIAM 1995, 6, 1671. [Google Scholar]
- RonnieSircar. An introduction to wavelets and other filtering methods in finance and economics. Waves Random Med. 2001, 12, 399. [Google Scholar]
- Nakken, M. Wavelet analysis of rainfall–runoff variability isolating climatic from anthropogenic patterns. Environ. Model. Softw. 1999, 14, 283–295. [Google Scholar] [CrossRef]
- Issartel, J.; Marin, L.; Gaillot, P.; Bardainne, T.; Cadopi, M. A practical guide to time-frequency analysis in the study of human motor behavior: The contribution of wavelet transform. J. Mot. Behav. 2006, 38, 139–159. [Google Scholar] [CrossRef] [PubMed]
- Zhang, Q.; Lu, W.; Chen, S.; Liang, X. Using multifractal and wavelet analyses to determine drought characteristics: A case study of Jilin province, China. Theor. Appl. Climatol. 2016, 125, 829–840. [Google Scholar] [CrossRef]
- Liu, D.; Liu, X.; Li, B.; Zhao, S.; Li, X. Multiple time scale analysis of river runoff using wavelet transform for Dagujia river basin, Yantai, China. Chin. Geogr. Sci. 2009, 19, 158–167. [Google Scholar] [CrossRef]
- Yang, C.; Yu, Z.; Hao, Z.; Zhang, J.; Zhu, J. Impact of climate change on flood and drought events in huaihe river basin, china. Hydrol. Res. 2012, 43, 14–22. [Google Scholar] [CrossRef]

© 2018 by the authors. Licensee MDPI, Basel, Switzerland. This article is an open access article distributed under the terms and conditions of the Creative Commons Attribution (CC BY) license (http://creativecommons.org/licenses/by/4.0/).
Share and Cite
Wang, Q.; Liu, Y.; Tong, L.; Zhou, W.; Li, X.; Li, J. Rescaled Statistics and Wavelet Analysis on Agricultural Drought Disaster Periodic Fluctuations in China from 1950 to 2016. Sustainability 2018, 10, 3257. https://doi.org/10.3390/su10093257
Wang Q, Liu Y, Tong L, Zhou W, Li X, Li J. Rescaled Statistics and Wavelet Analysis on Agricultural Drought Disaster Periodic Fluctuations in China from 1950 to 2016. Sustainability. 2018; 10(9):3257. https://doi.org/10.3390/su10093257
Chicago/Turabian StyleWang, Qian, Yangyang Liu, Linjing Tong, Weihong Zhou, Xiaoyu Li, and Jianlong Li. 2018. "Rescaled Statistics and Wavelet Analysis on Agricultural Drought Disaster Periodic Fluctuations in China from 1950 to 2016" Sustainability 10, no. 9: 3257. https://doi.org/10.3390/su10093257
APA StyleWang, Q., Liu, Y., Tong, L., Zhou, W., Li, X., & Li, J. (2018). Rescaled Statistics and Wavelet Analysis on Agricultural Drought Disaster Periodic Fluctuations in China from 1950 to 2016. Sustainability, 10(9), 3257. https://doi.org/10.3390/su10093257