Article

Optimization Design of Underground Space Overburden Thickness in a Residential Area Concerning Outdoor Thermal Environment Evaluation

1
Underground Space Research Center, Army Engineering University of PLA, Nanjing 210007, China
2
State Key Laboratory of Explosion & Impact and Disaster Prevention & Mitigation, Army Engineering University of PLA, Nanjing 210007, China
3
Engineering Design and Research Institute of PLA Army Research Institute, Beijing 100000, China
*
Authors to whom correspondence should be addressed.
Sustainability 2018, 10(9), 3205; https://doi.org/10.3390/su10093205
Submission received: 16 June 2018 / Revised: 23 August 2018 / Accepted: 27 August 2018 / Published: 7 September 2018

Abstract

:
Reasonable design of the overburden thickness of underground space (OTUS) can influence the outdoor thermal environment by affecting the ground plant communities. To optimize the design of the OTUS for improving the outdoor thermal environment, this study summarized the influence mechanism of the OTUS on the outdoor thermal environment and proposed a framework of the optimization design of underground space overburden thickness. A typical row layout residential area in Nanjing, China, was taken as the research object on which to perform a numerical study of the influence of plant communities formed by two types of plant collocations (a middle- and low-level plant collocation and a middle- and high-level plant collocation) on the outdoor thermal environment (airflow field, air temperature, relative humidity and thermal comfort) under three different ratios of trees to shrubs (2:3, 1:2, and 1:3), and to provide suggestions regarding the design of the OTUS according to the designer’s requirements. The conclusions were summarized as follows: (1) If a designer wants to enhance outdoor ventilation, the OTUS should be designed to satisfy the requirements for the middle- and low-level plant collocations and the overburden thickness of the 2/5 underground space development area should be set to 80~100 cm, the overburden thickness of the other 2/5 area should be set to 45~60 cm and the overburden thickness of the remaining 1/5 area should be set to 30~45 cm. (2) If a designer wants to reduce air temperature, increase relative humidity, and improve outdoor thermal comfort, the OTUS should be designed to satisfy the requirements for middle- and high-level plant collocations and the overburden thickness of the 1/4 underground space development area should be set to 80~100 cm, and the overburden thickness of the remaining 3/4 area should be set to 45~60 cm.

1. Introduction

In recent years, the urban thermal environment has been deteriorating due to China’s urbanization, and the urban heat island effect is the most pronounced in summer, especially in residential areas [1,2,3]. The heat island effect causes many problems, which can decrease outdoor thermal comfort, influence the outdoor activities of urban residents [4,5], increase the energy consumption of buildings [2], and even increase the risk of heat-related death due to heat waves [6,7,8,9]. It has been reported that the heat waves that swept across Europe in 2003 caused approximately 20,000 deaths in Britain, France, Italy, and Portugal [9,10].
To address these problems, various easing measures have been proposed [2], and landscape greening is accepted as the most effective way to ease the heat island effect [2,11], which can provide shade and contribute to reducing the surface temperature of buildings and the ground [1,4]. In this respect, Ooka used the multi-objective genetic algorithm and coupled simulation to optimize the tree design for a comfortable outdoor environment [12]. Bo Hong used numerical simulation to optimize the tree design for sunshine and ventilation [11]. Li Zhang used the ENVI-met model to investigate the effects of tree distribution and species on outdoor environments [13]. These studies had a positive effect on easing the urban heat island effect, however, which neglected the influence of underground space development on ground greening and the outdoor thermal environment.
At present, residential areas have developed underground space on a large scale to free up more land for landscape greening, especially in China [14,15]. The growth environment of plants above the underground space is different from that under natural conditions. In areas with underground space development, the overburden thickness of underground space (OTUS) is a vital part of the landscape design above underground buildings [14]. The OTUS refers to the soil thickness used for plant growth between the underground building and the ground. If the OTUS is too thin to satisfy the requirements of growth for trees or shrubs, this will affect the formation of plant communities, resulting in a single landscape design, which will affect not only the landscape’s diversity but also the survival of plants. However, few studies have concerned with how to properly design the OTUS to pursue a comfortable outdoor environment. In our previous studies, we chose a residential area in Nanjing, China as the research subject and quantified the effects of three kinds of vegetation, lawn, large shrubs, and small trees, on the outdoor thermal environment and suggested, according to the simulation results, that the OTUS was best designed to satisfy the survival requirements of small trees would contribute to creating a comfortable outdoor environment [14]. The study provided preliminary data support for the design of the OTUS. However, the greening configurations considered in this study were relatively few and idealized. The effects of plant communities formed by different plant collocations under different ratios of trees to shrubs on the outdoor thermal environment were not taken into account.
Landscape design above underground buildings, reasonable plant collocation, and an appropriate ratio of trees to shrubs can not only make full use of the space resources, form a layered landscape, and increase the visual beauty of the landscape, but can also form a multilayered plant community, improve biodiversity, and benefit the ecology [16,17]. Therefore, it is necessary and more meaningful to further quantify the effects of plant communities with different ratios of trees to shrubs on the outdoor thermal environment under different OTUS values.
The purpose of this article was to investigate the optimization of the design of the OTUS to improve the quality of the outdoor thermal environment according to the designer’s different requirements. The influence mechanism of the OTUS on the outdoor thermal environment and a framework for the optimization design of the underground space overburden thickness were proposed in this study. We chose a residential area in Nanjing, China with a typical row layout as the research object. Considering different ratios of trees to shrubs, we used the computational fluid dynamics (CFD) simulation software ENVI-met to quantify the influence of plant communities formed by middle- and high-level plant collocations and middle- and low-level plant collocations on the outdoor thermal environment from four aspects: airflow field, air temperature, relative humidity and thermal comfort. In addition, we developed some reasonable suggestions for designing the OTUS according to the designer’s different requirements.

2. Methodology

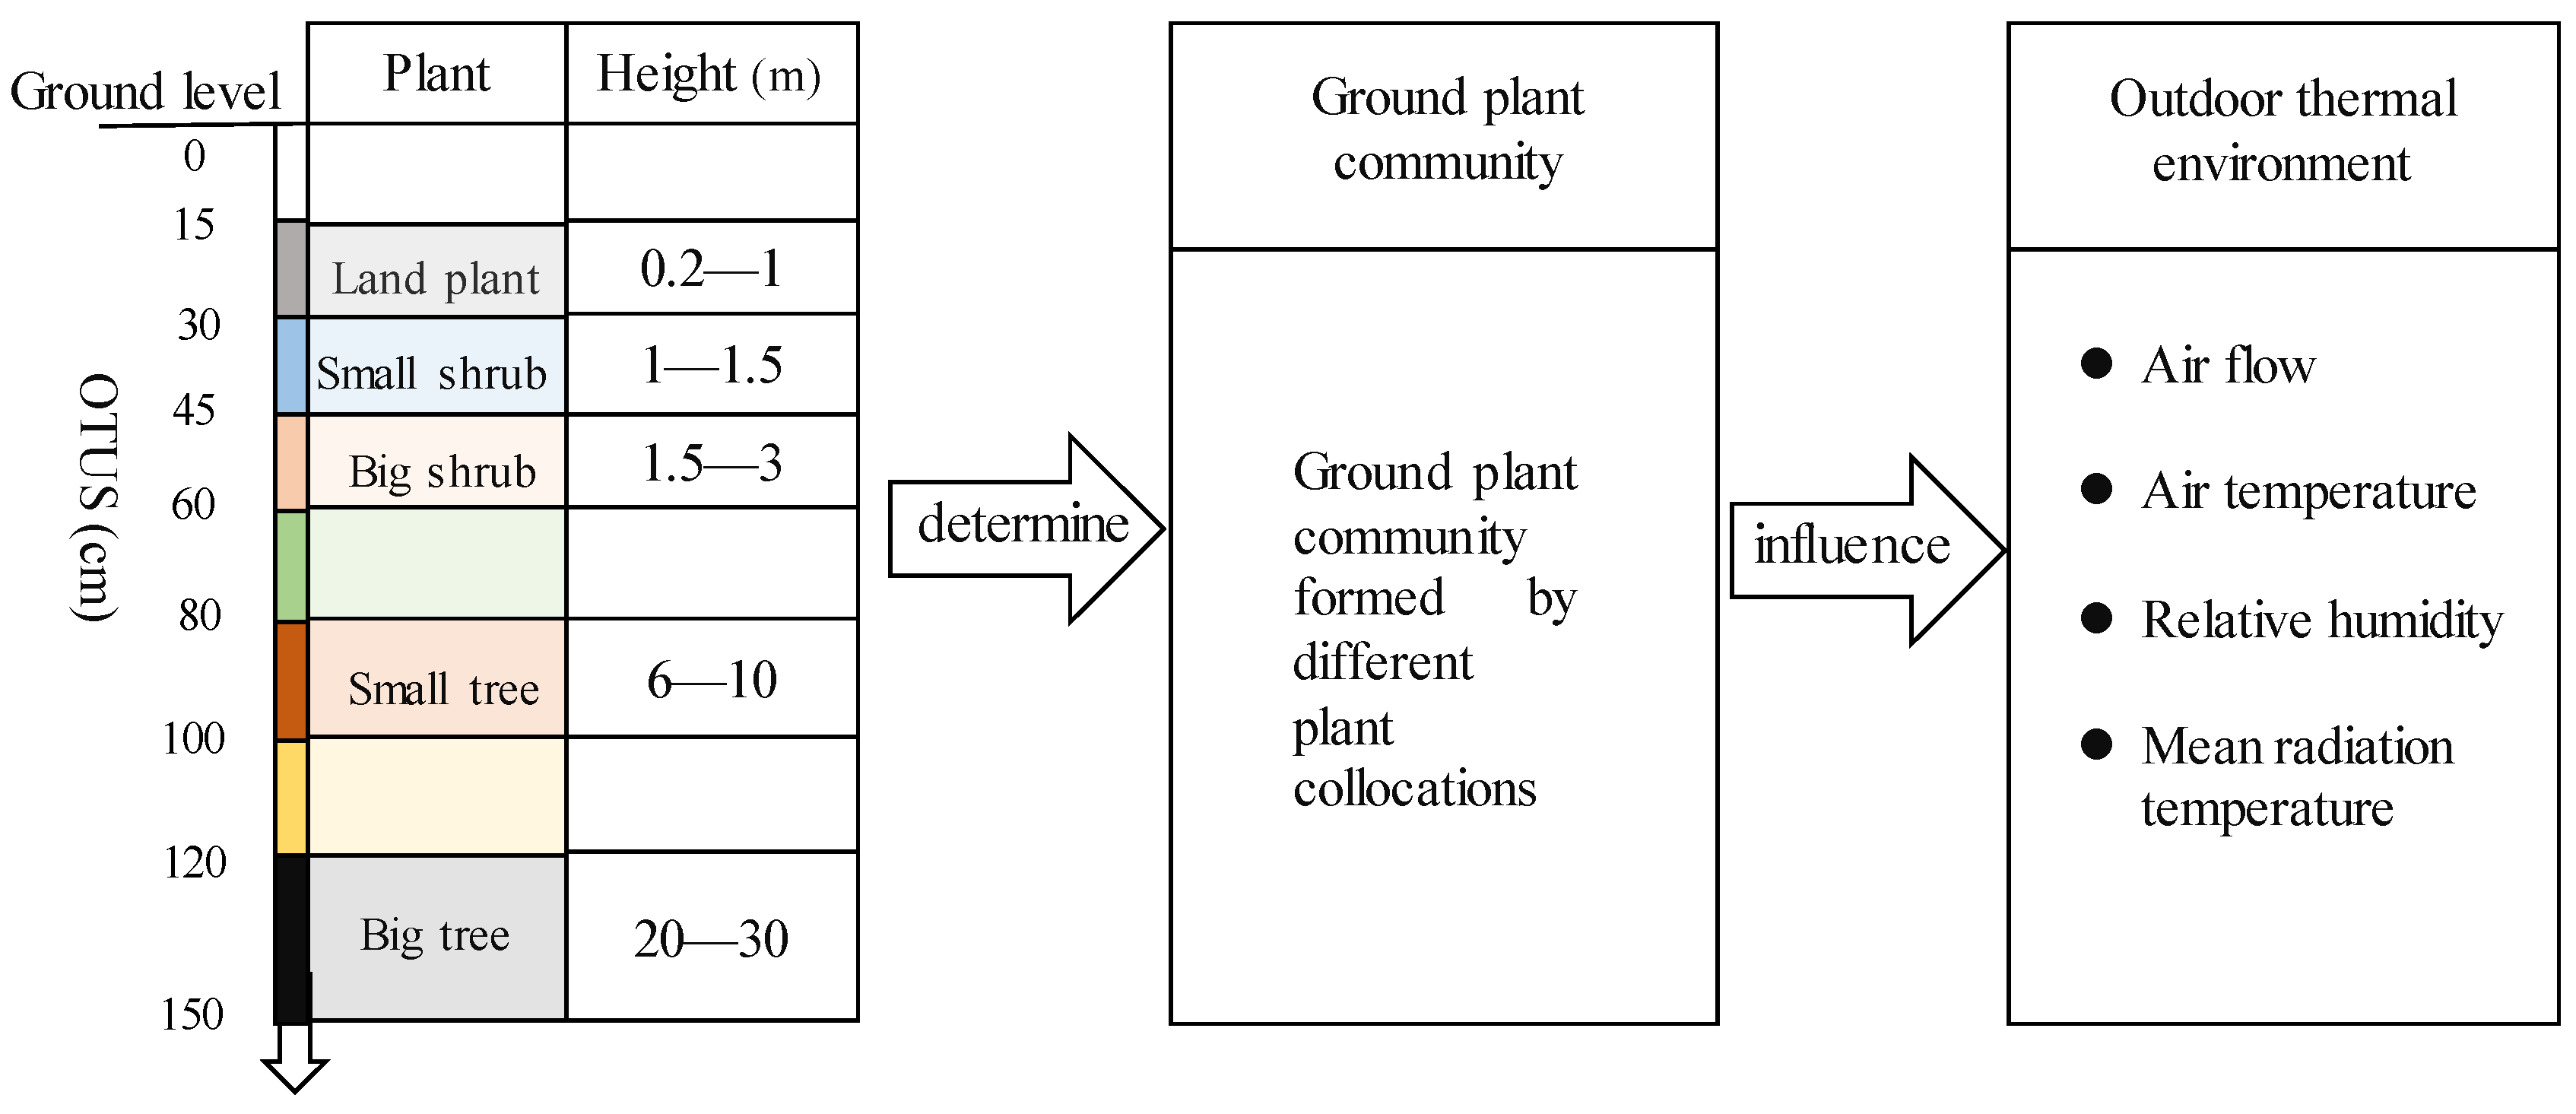
2.1. Influence Mechanism of the OTUS on Outdoor Thermal Environment

The OTUS influences the outdoor thermal environment by affecting the ground plant communities, as shown in Figure 1. First, the ground plant communities, formed by a variety of plants through different plant collocations, will depend on the design of the OTUS. In landscape design above underground buildings, the requirements of the OTUS ascend in the order of grasses, shrubs, and trees [14]. For example, when the OTUS is in the range of 10~30 cm, land plants can only be planted in the underground space development area, and only when the OTUS is in the range of 120 ~150 cm can big trees be planted. If the OTUS can satisfy the survival requirements of trees, the local plant communities can be created with more diversity. On the other hand, if the OTUS can only satisfy the survival of shrubs or lawn, the biodiversity will be relatively low.
Second, the ground plant community controlled by the OTUS will directly influence the outdoor thermal environment. First, high trees and large shrubs can block solar radiation, reducing the radiative heating of the external surfaces of buildings, in turn reducing the heat transfer from the buildings to the surrounding environment [18]; Additionally, the plant canopy can reduce wind velocity [2,14]. Second, as the height of the shrubs is close to the height of pedestrians, the evapotranspiration of shrubs can consume radiant heat and affect the energy distribution at pedestrian height [14,19]. In addition, terrestrial plants, through photosynthesis and transpiration, can reduce the amount of solar radiation absorbed by the ground and enhance soil heat dissipation, thus reducing the heat transfer from the land to the surrounding environment [14,20,21,22].

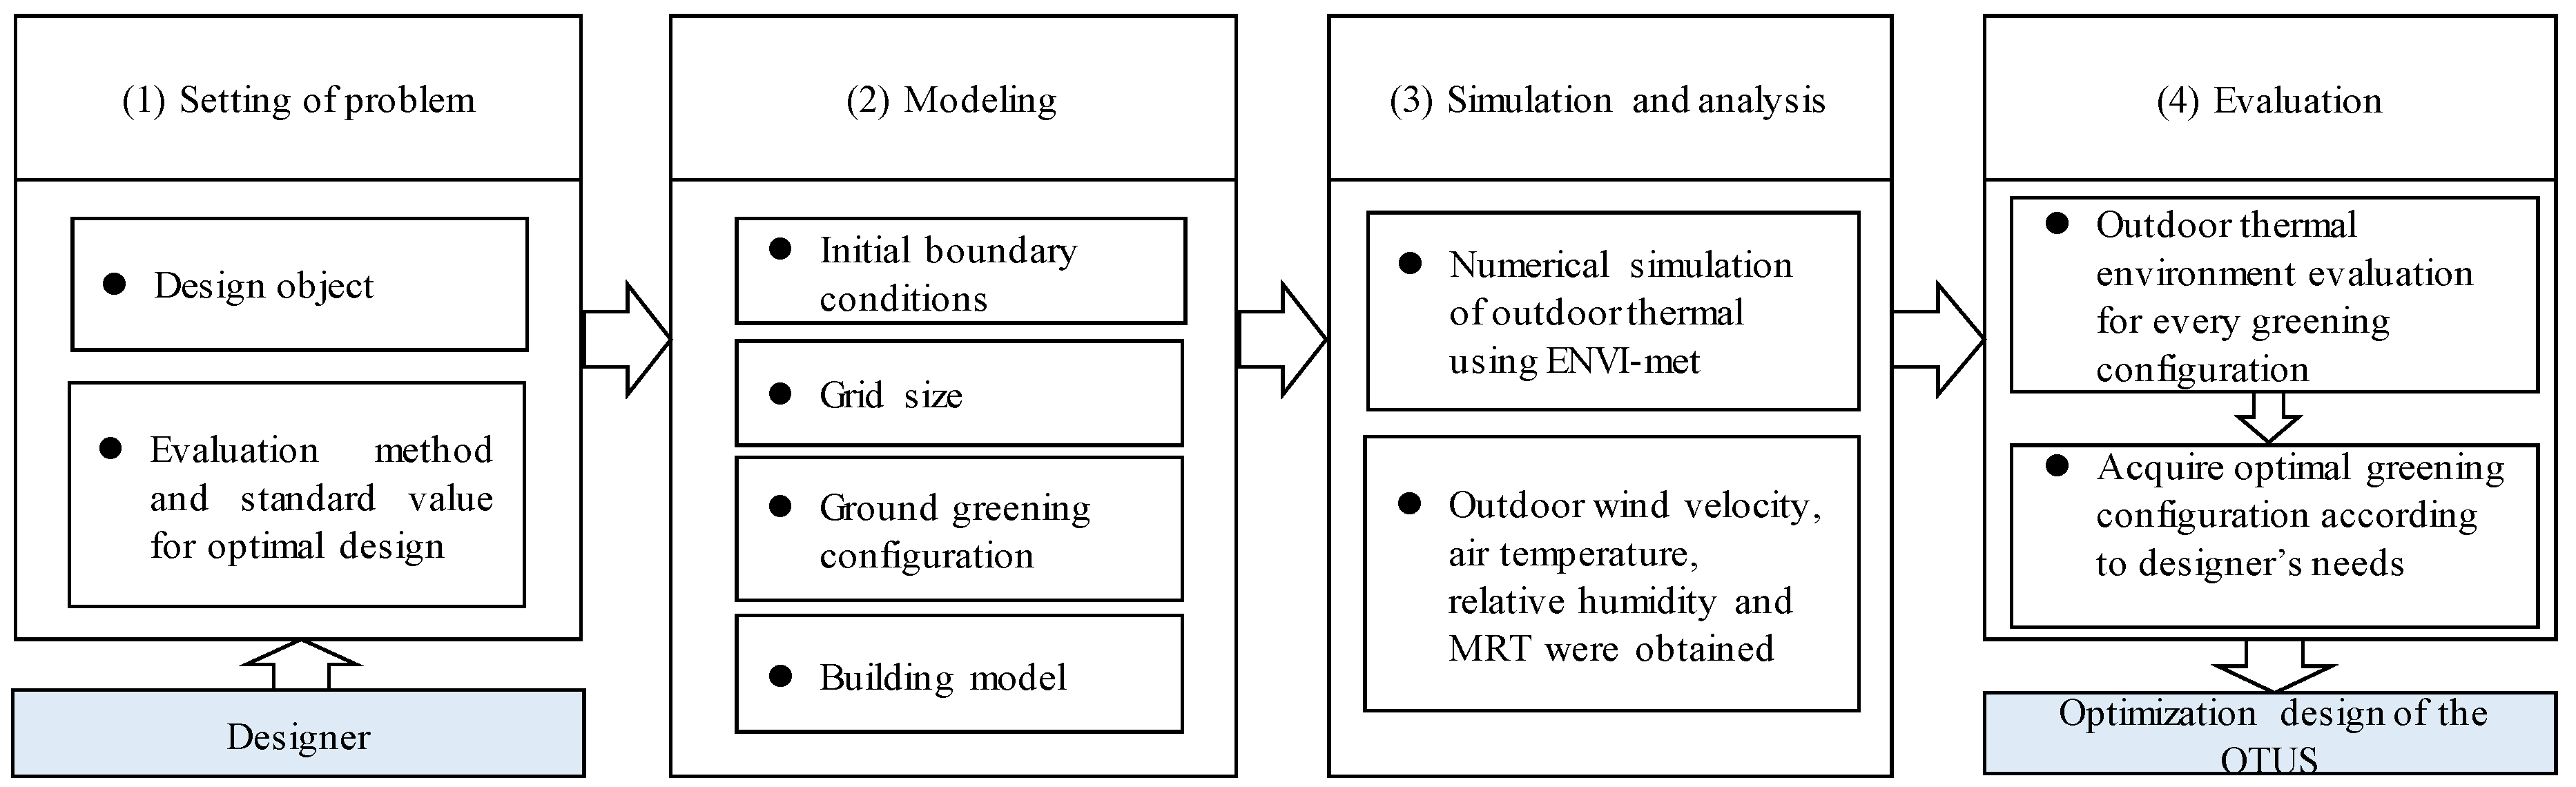
2.2. Optimization Design Framework

Currently, in the field of urban microclimate research, the application of numerical simulation methods has become increasingly widespread [2,11,12,23]. In this study, we used numerical simulation methods to optimize the design of the OTUS to improve the quality of the outdoor thermal environment. According to the above theoretical analysis, we summarized a framework of the optimization design of the OTUS for the outdoor thermal environment based on the designer’s different requirements, as shown in Figure 2. The framework is composed of four parts.
(1) Setting of the problem. In this stage, the optimal design objective was to optimize the design of the OTUS to enhance the ventilation or improve outdoor thermal comfort, and the evaluation method and standard value for choosing the optimal plans candidates were determined.
(2) Modeling. This part mainly served as the case design and was composed of four main elements: the initial boundary conditions, grid size, ground greening configuration, and building model. The initial boundary conditions mainly included the wind velocity, wind direction, initial atmospheric temperature, outdoor atmospheric pressure, and relative humidity. The grid size included the grid number and grid step. The grid number determined the range of the simulation area, and the grid step determines the spatial grid resolution. The building model included the building materials, building height, building orientation, etc. The ground greening configuration has a direct influence on the outdoor thermal environment and is determined by the OTUS. It should be noted that in the modeling process, the OTUS was the only variable used in the optimization study of this paper and it is impossible to be shown during the modeling process, thus, we used different ground greening configurations to represent the different OTUS.
(3) Simulation and analysis. Here, ENVI-met was adopted for the numerical study. This program mainly consisted of an atmospheric model, a soil model, a vegetation model, and a ground surface model [24], and its applicability was validated by field measurements in our previous study [14]. We obtained the indexes of wind velocity, air temperature, relative humidity, and mean radiation temperature (MRT) through ENVI-met, and calculated the average and time-averaged values of these indexes to analyze the changes in the outdoor thermal environment.
(4) Evaluation. The effects of plant communities formed by middle- and high-level plant collocations and middle- and low-level plant collocations with different ratios of trees to shrubs on the outdoor thermal environment were studied. The optimal greening configuration could be acquired according to the designer’s different requirements. According to the corresponding relationship between the OTUS and plants mentioned in Section 2.1, the OTUS corresponding to the optimal greening configuration was the optimal one. So far, the optimization design of the OTUS for the outdoor thermal environment has been carried out.

3. Case Study

3.1. Optimization Design Object

The purpose of this research was to optimize the design of the OTUS for the outdoor thermal environment. In the summer, people prefer to enhance outdoor ventilation, reduce air temperature, as well as improve outdoor relative humidity and outdoor thermal comfort. The optimal design of the OTUS was investigated according to designer’s different requirements.

3.2. Case Setup

For landscape design above underground buildings, designers usually choose a method that combines trees, shrubs, and grasses to build a rich plant community, therefore creating a beautiful landscape with positive ecological effects. In this study, the ground greening configurations formed by middle- and high-level plant collocations and middle- and low-level plant collocations were mainly considered, as shown in Figure 3. According to engineering experience, designers usually choose shallow-rooted small trees, and the best planting locations correspond to the structural columns of the underground building.
The most commonly used size of an underground building column grid in Nanjing is 8.1 m × 8.1 m [25]. In this study, to facilitate the simulation, the size of the underground building column grid was set to 8 m × 8 m, and a residential area with a row layout and underground parking in Nanjing, China was used as the research object. The reason for choosing a residential area in Nanjing, China as the research object is that the heat island effect in Nanjing has become increasingly serious in recent years, and the outdoor air temperature can exceed 40 °C [22]; in addition, the scale of underground space development is growing along with the development of the economy and is anticipated to reach 52,000,000 m2 by 2020 according to the urban plan of Nanjing [15].
This research aimed to optimize the design of the OTUS by investigating the relationship between the OTUS, ground plant collocations, and outdoor thermal environment; therefore, six configurations were analyzed. In the modeling stage, the grid number (X × Y × Z) was set to 80 m × 80 m × 30 m, and the grid step (X × Y × Z) was set to 1 m × 1 m × 7.5 m. Each greening configuration formed by different plants corresponded to a kind of underground space overburden thickness that could meet the requirements of growth for plants. We set six plant collocations (Figure 4). The plant collocations of Figure 4a–c were middle- and low-level plant collocations corresponding to tree to shrub ratios of 2:3, 1:2, and 1:3. The plant collocations of Figure 4d–f were middle- and high-level plant collocations, corresponding to tree to shrub ratios of 2:3, 1:2, and 1:3. The relevant parameters of the vegetation, building model, and the initial boundary conditions are shown in Table 1. It should be noted that each plant in each greening configuration occupied an area of 1 square meter. Thus, the proportion of the number of different types of plants was equivalent to the proportion of the underground space development area occupied by plants.

3.3. Evaluation Index

Usually, the indexes of wind velocity, air temperature, and relative humidity can directly reflect the changes in the outdoor thermal environment. However, these indexes cannot accurately evaluate outdoor thermal comfort. For the evaluation of outdoor thermal comfort, the index of mean radiation temperature (MRT) was used in this study.
The MRT refers to the surface temperature of an imaginary isothermal enclosed surface where the radiant heat exchange capacity from the human body is equal to the actual amount of radiant heat exchange between the human body and the actual non-isothermal surface [26]. In addition, the MRT is a key factor in evaluating human outdoor thermal comfort and it considers both the shortwave and long-wave radiation flux that the human body absorbs. On a sunny day, regardless of the comfort indices used, the MRT is considered as the key variable in evaluating outdoor thermal sensation [27].
Studies have shown that human discomfort caused by strong sunlight is much greater than that caused by an increase in the average air temperature [28], and the change in comfort caused by an increase of 1 °C in air temperature can be offset by a radiance decrease of approximately 70 W/m2 [29]. In the summer, the solar radiance in the outdoor environment of Nanjing is approximately l000 W/m2, equivalent to an increase of 14 °C in air temperature; therefore, when compared to air temperature, which may exhibit little variance, the MRT can better reflect the actual human thermal sensation in an outdoor thermal environment. In addition, the index of MRT was used because it has been widely used in evaluating outdoor thermal environments and could satisfy the requirements of our research [14]. For more details on the MRT see References [30,31].

4. Results and Discussion
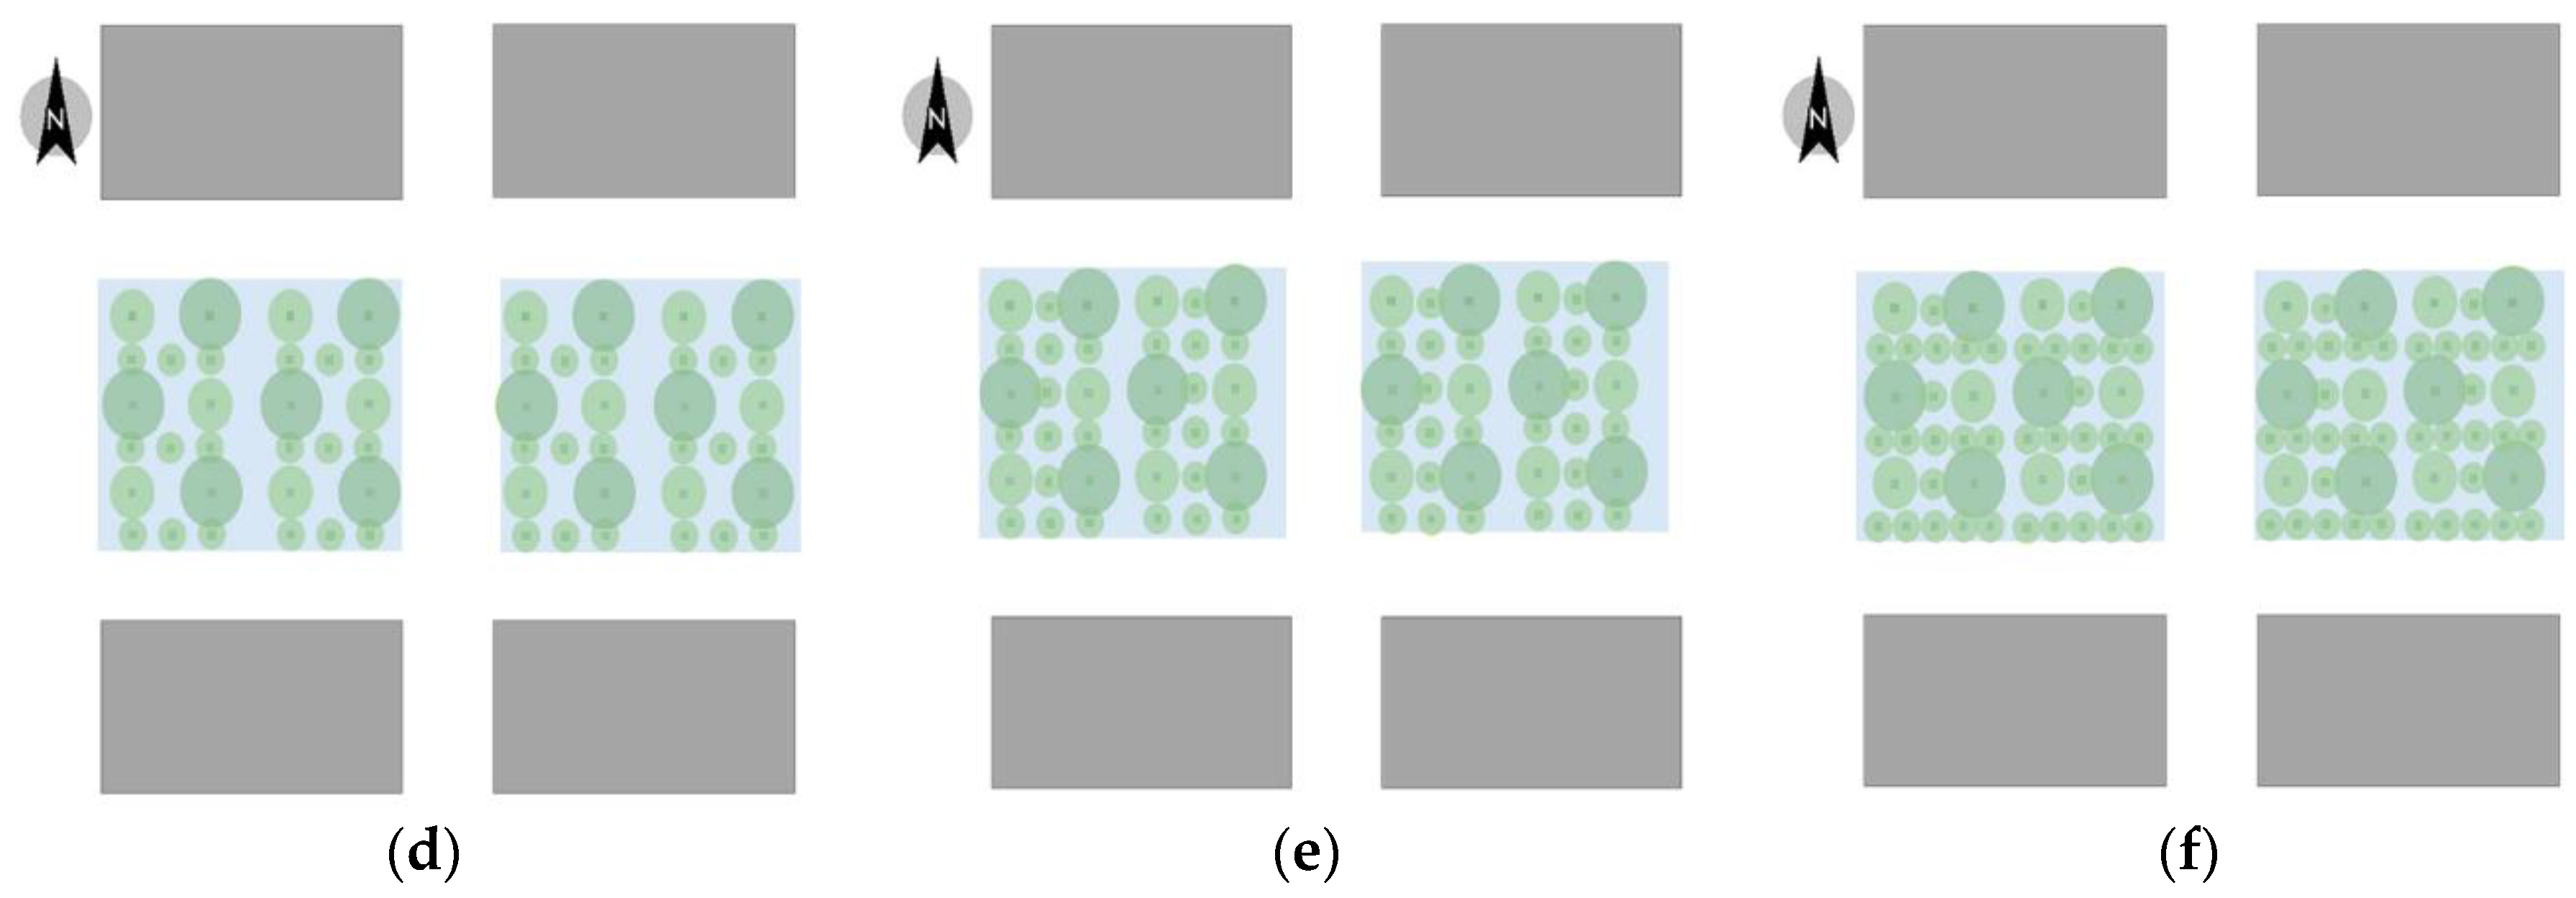
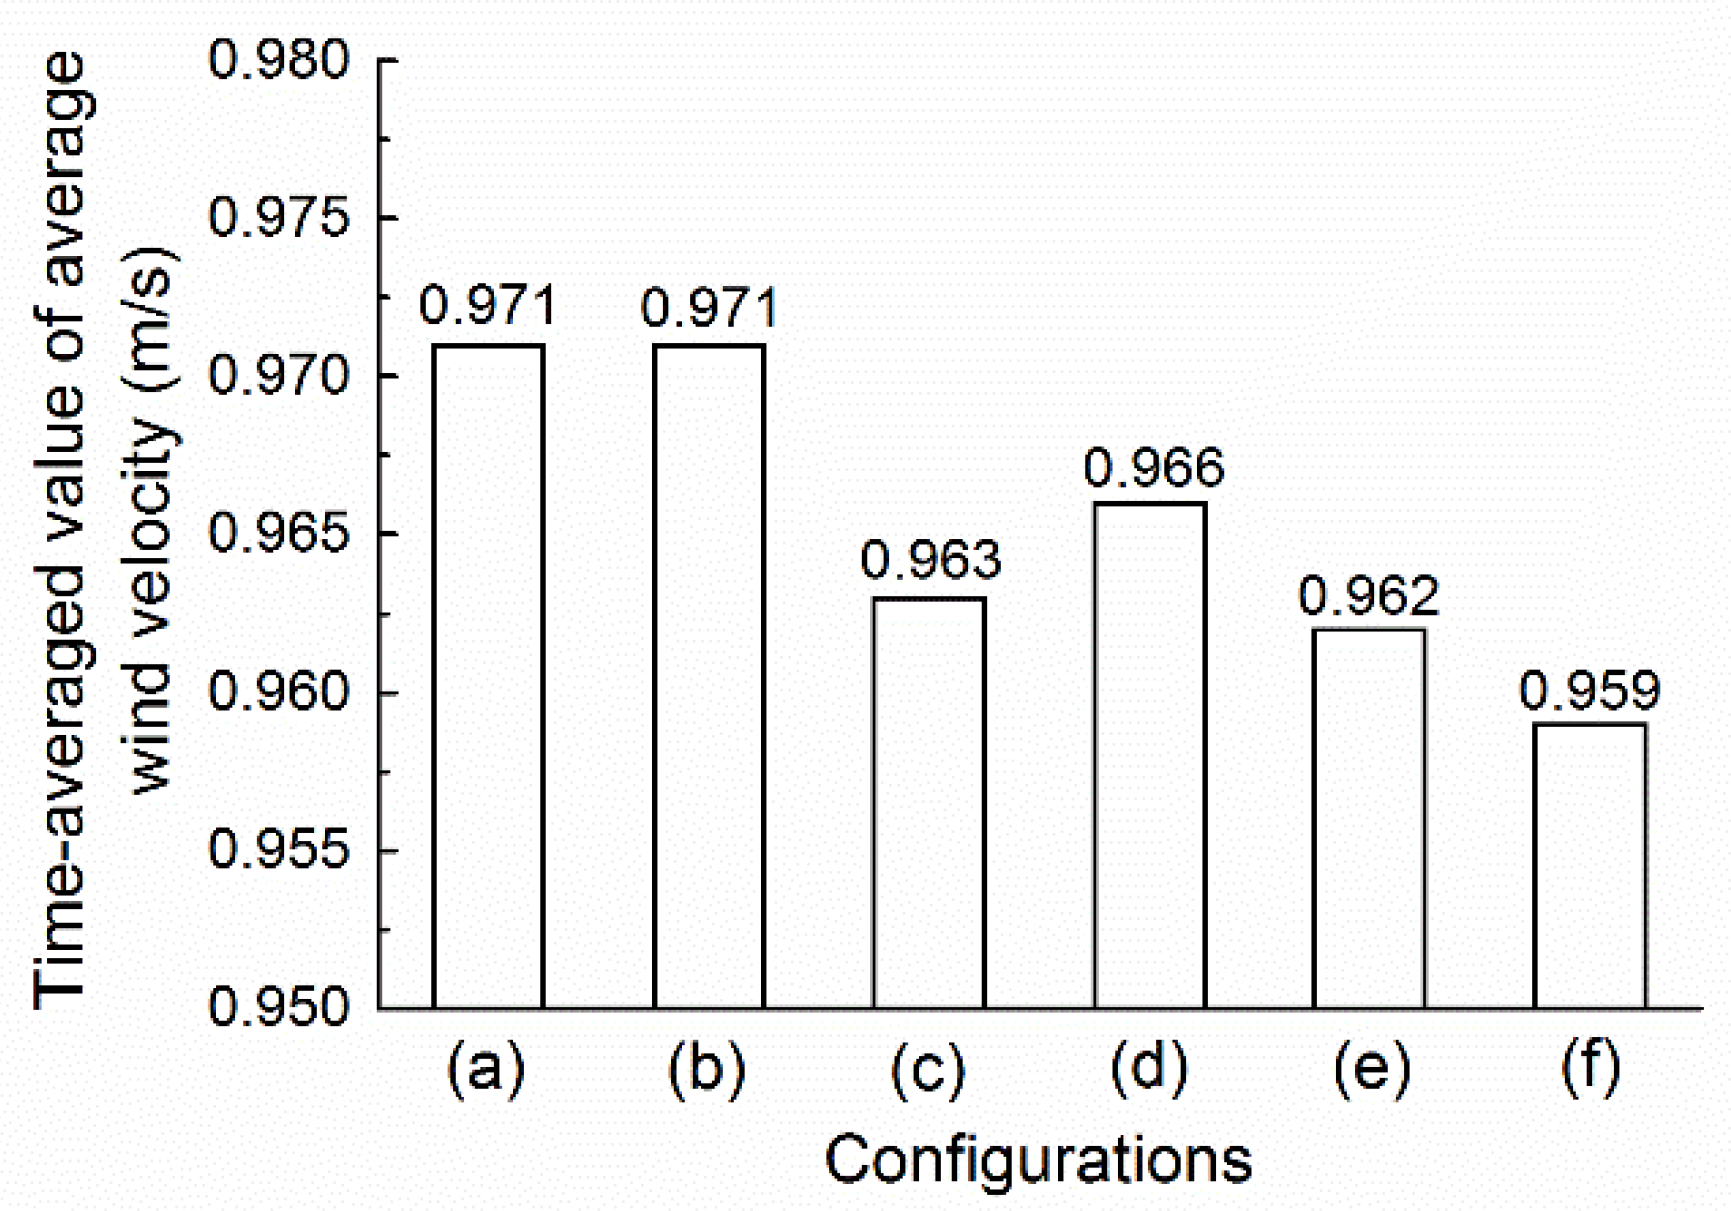
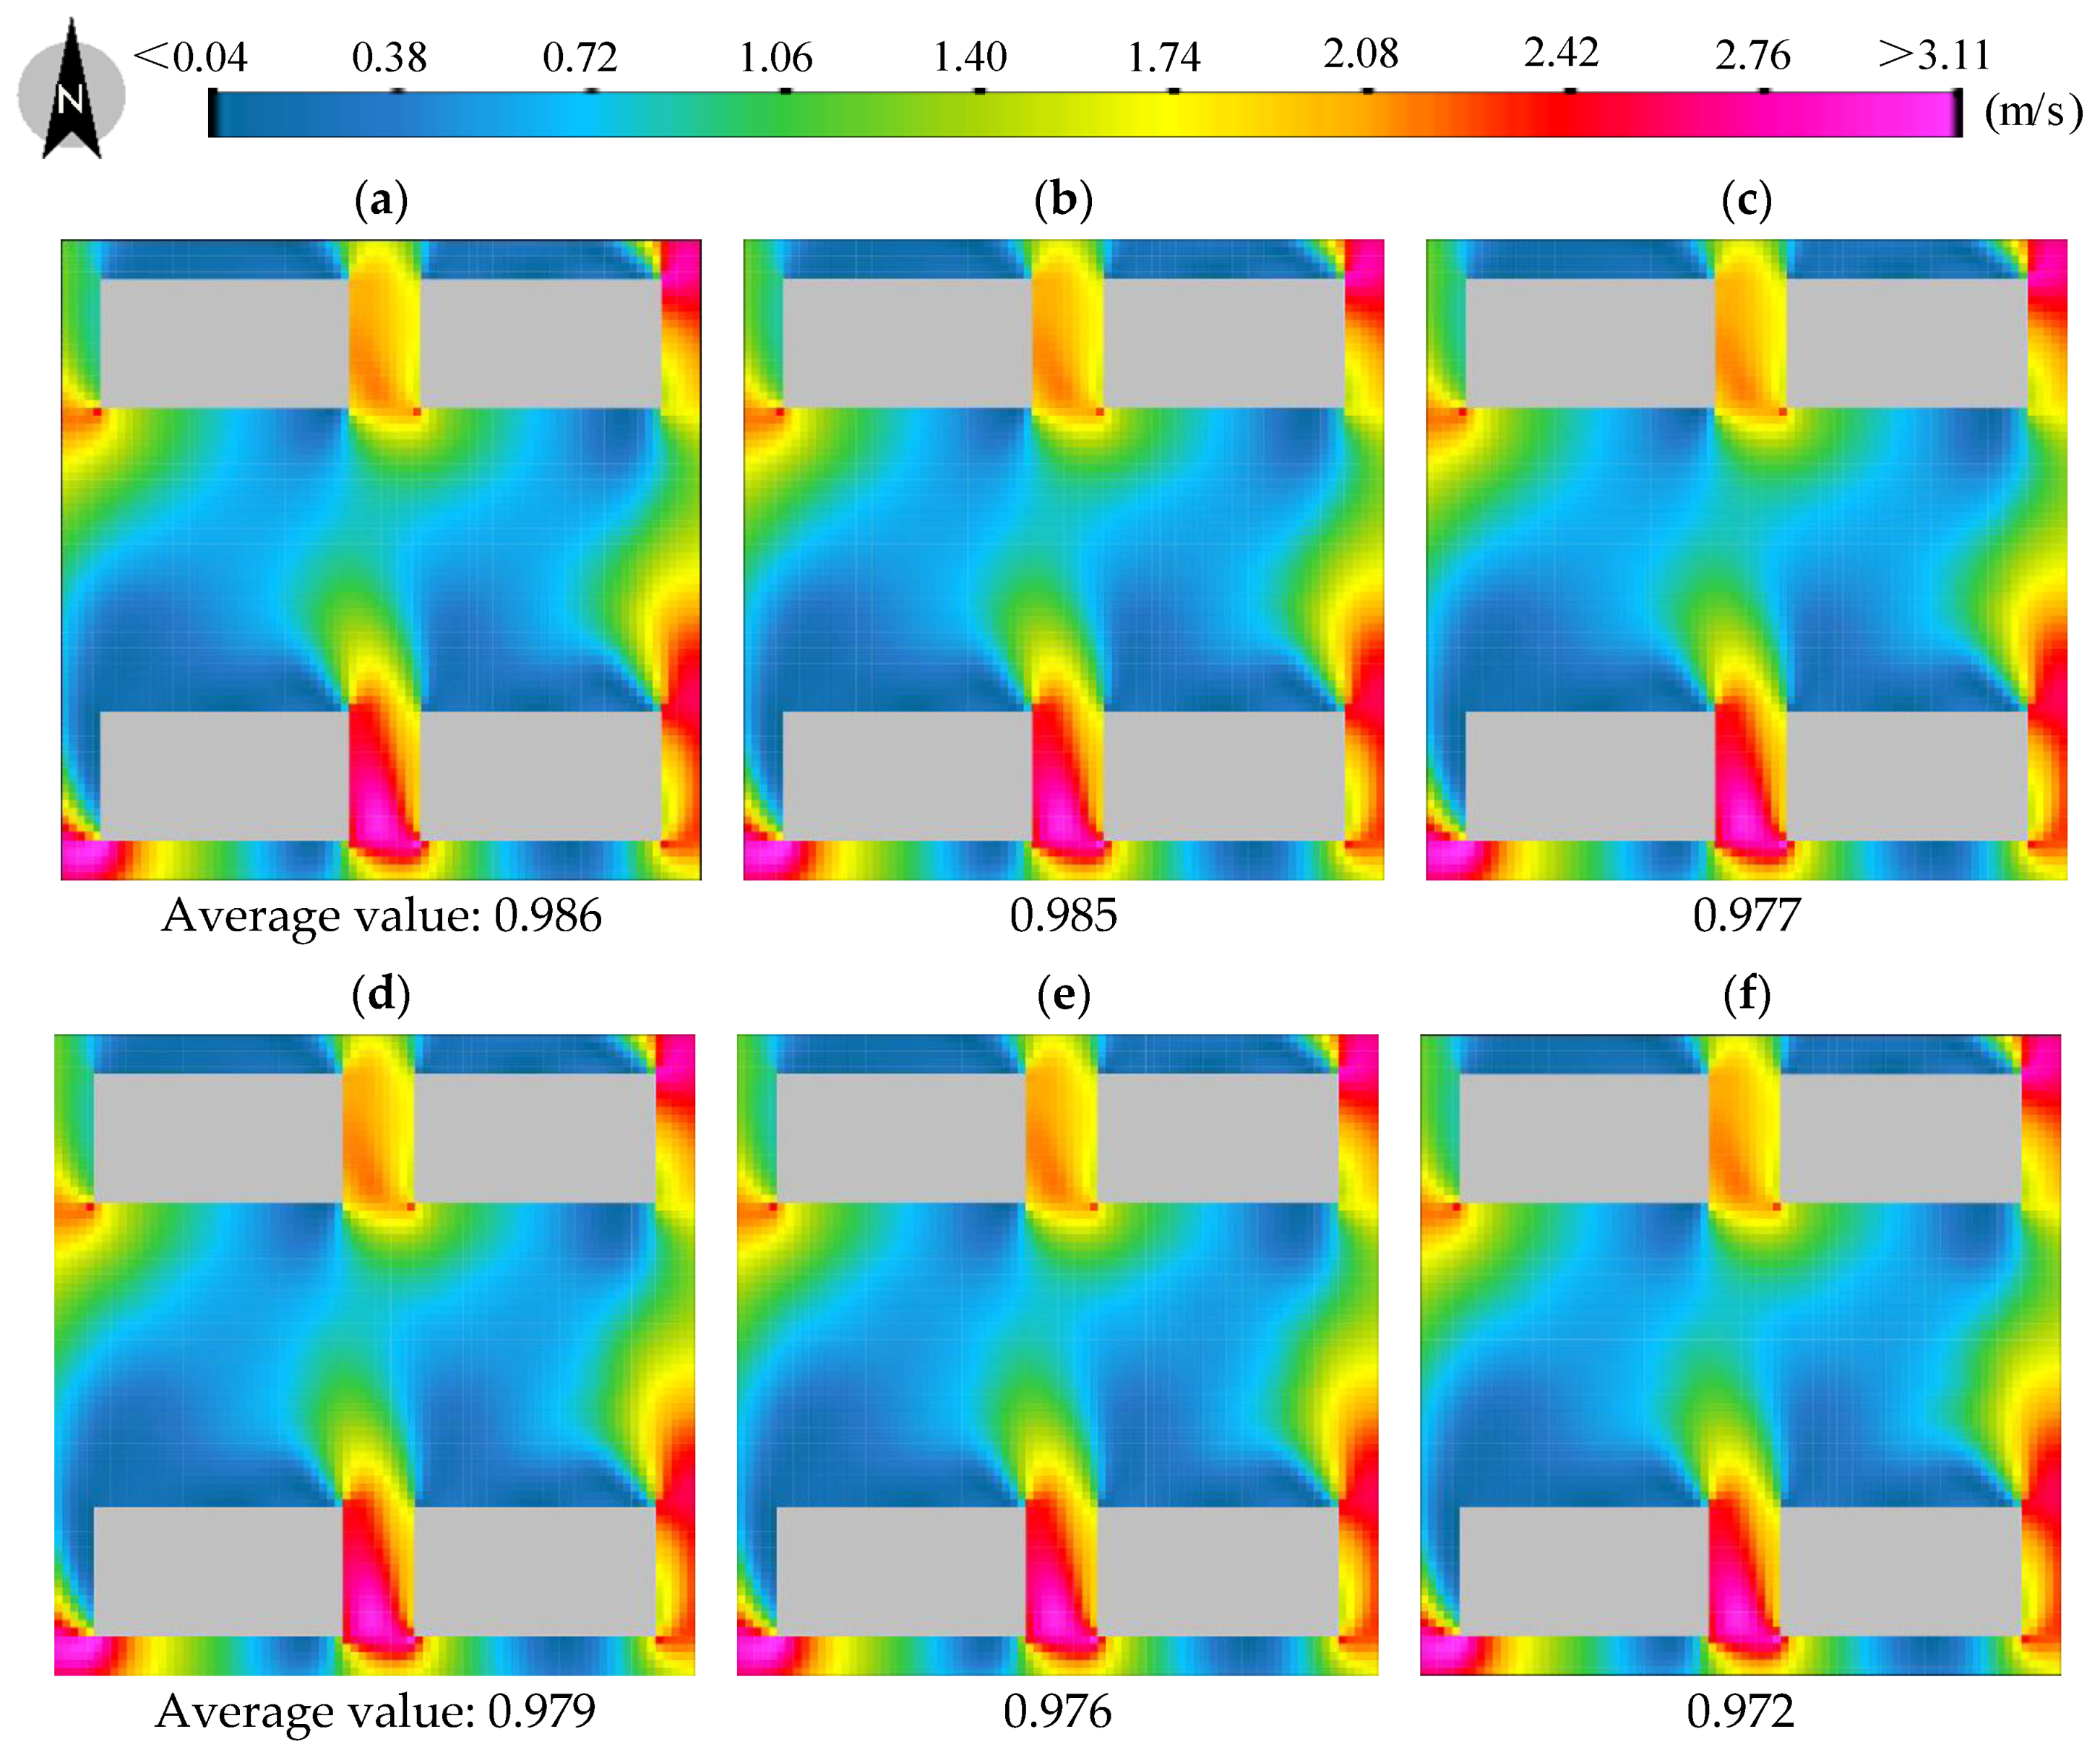
4.1. Airflow Field

Figure 5 shows the changes in wind velocity for the two plant collocations under different ratios of trees to shrubs (1.5 m above ground, 15:00). In all configurations, the outdoor pedestrian wind fields were similar. The change in wind velocity from the average wind velocity was in the range of 0.005~0.014 m/s. In contrast, the spatial distribution of the outdoor pedestrian wind field was significantly affected by the building layout. Buildings block the spread of airflow, and a wind shadow forms at the back of buildings, weakening the airflow from the southeast. In addition, a narrow pipe effect was created in the north–south direction due to adjacent buildings; this effect increased the wind velocity, promoting air flow circulation.
The time-averaged values of the average wind velocity for each configuration were obtained by averaging the wind velocity values at nine time points from 8:00 to 16:00 (see Figure 6). When the ratio of trees to shrubs was 1:3, the pedestrian wind velocity was the lowest among the six configurations, indicating that as the number of shrubs increased, the space environment became crowded, which was not conducive to introducing air flow to the pedestrian level or to the spread of air flow. Moreover, the weakening effects of large shrubs at a height of 2 m on pedestrian airflow may be more pronounced than those of smaller shrubs. In addition, the time-averaged value of the average wind velocities for middle- and high-level plant collocations were lower than those for middle- and low-level plant collocations under the same ratio of trees to shrubs. The results showed that if a designer wanted to enhance outdoor ventilation, the OTUS should be designed to satisfy the requirements for middle- and low-level plant collocations, and the improvement effects were most obvious when the ratio of trees to shrubs was 2:3. Thus, the overburden thickness of the 2/5 underground space development area should be set to 80~100 cm, the overburden thickness of the other 2/5 area should be set to 45~60 cm, and the overburden thickness of the remaining 1/5 area should be set to 30~45 cm.

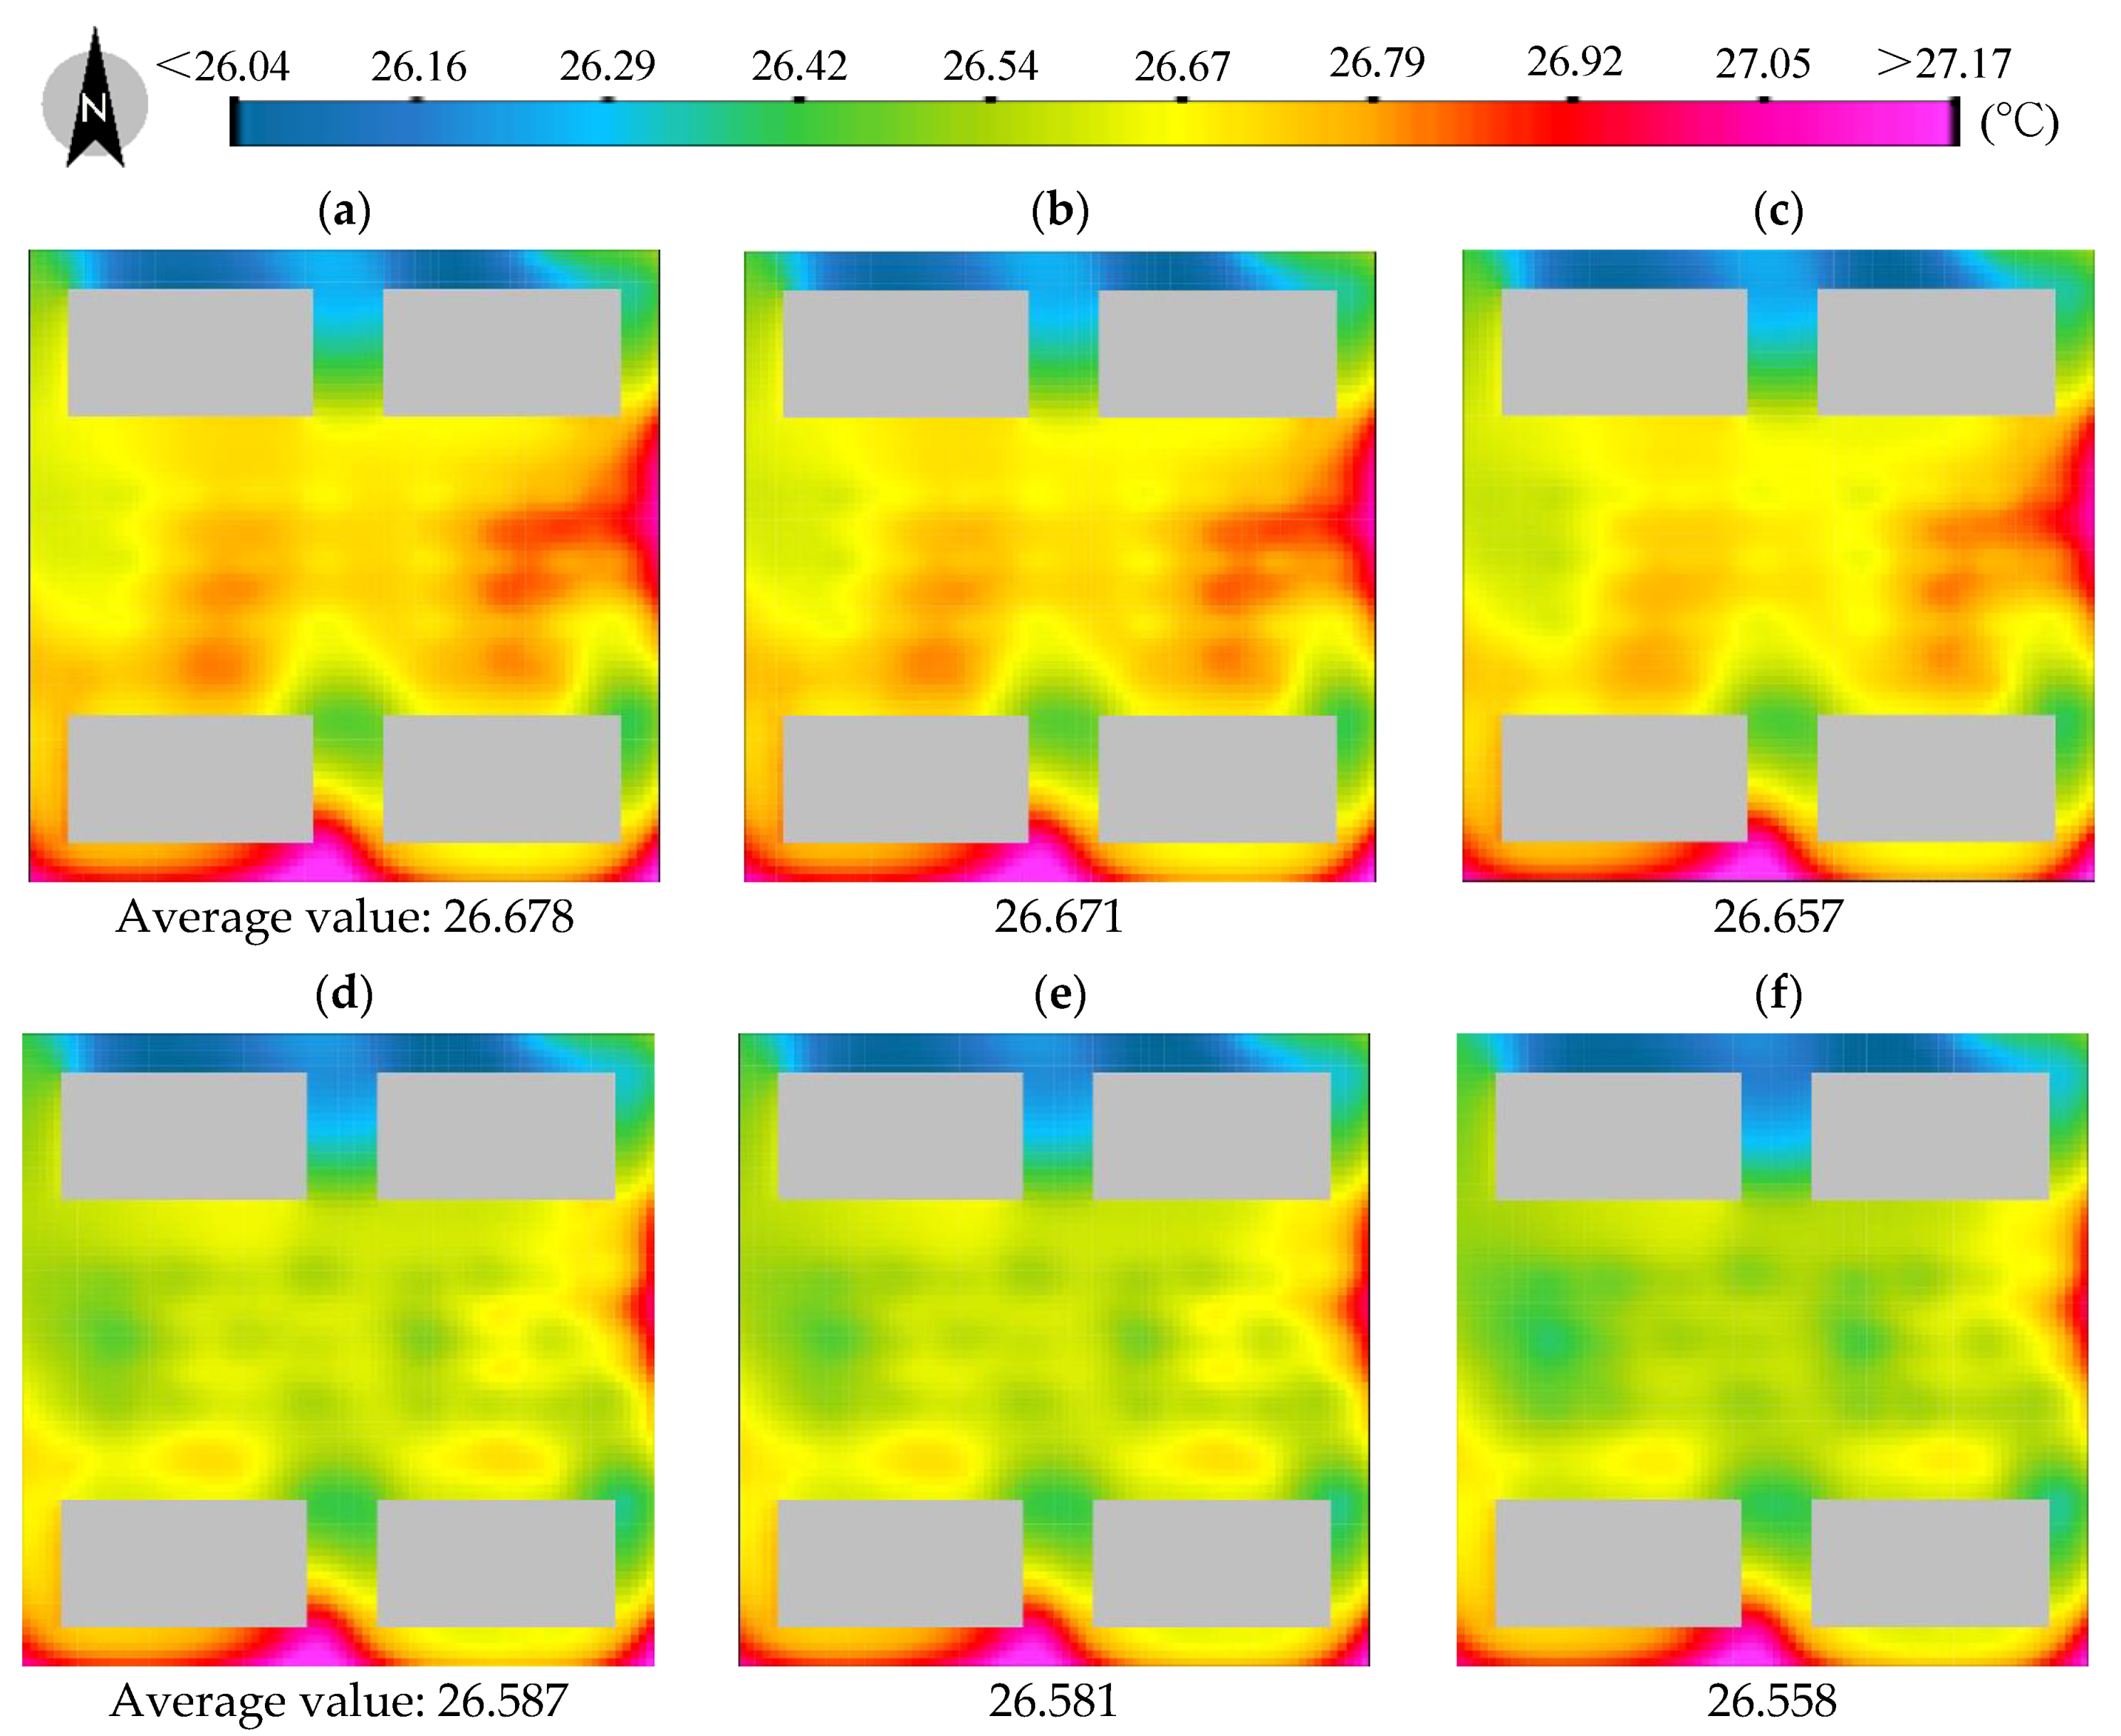
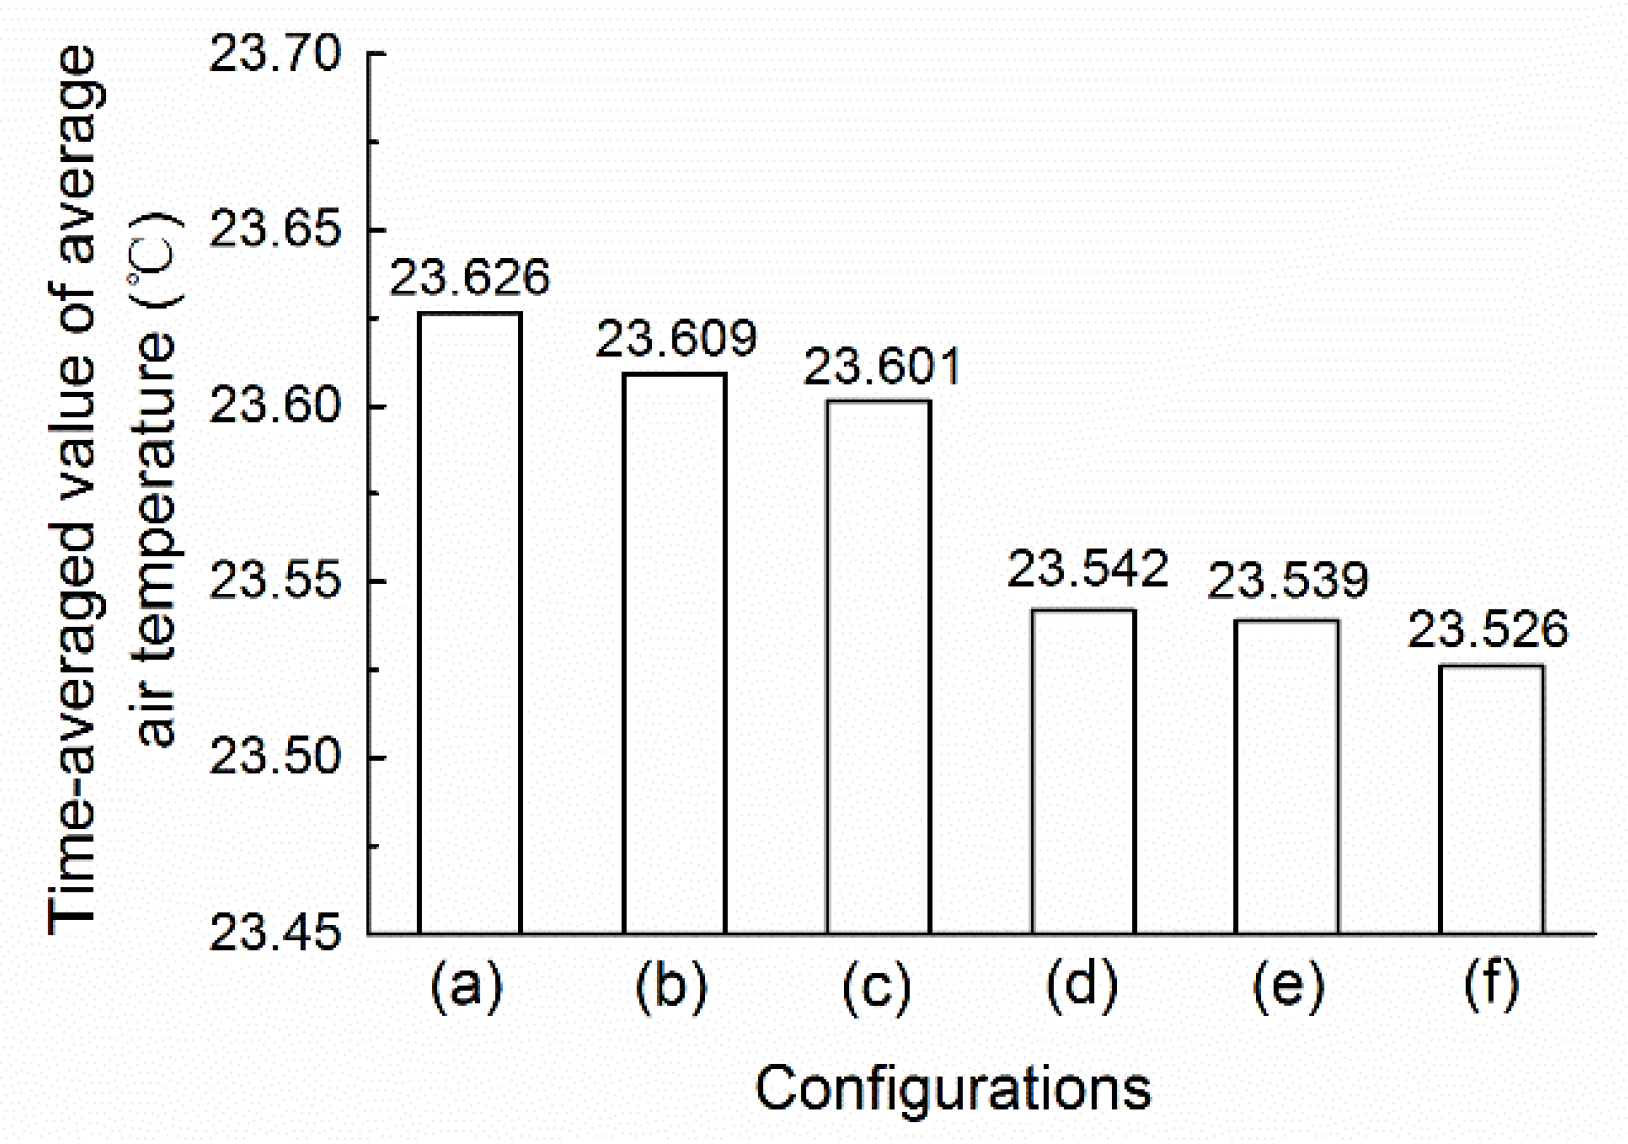
4.2. Air Temperature

Figure 7 shows the changes in air temperature for the two plant collocations under different ratios of trees to shrubs (1.5 m above ground, 15:00). In the underground space development area, the values of air temperature in Figure 7a–c were clearly higher than those in Figure 7d–f. The change in air temperature from the average air temperature was in the range of 0.005~0.014 °C and 0.023~0.029 °C for the middle- and low-level plant collocations and middle- and high-level plant collocations, respectively. With the increase in the ratio of trees to shrubs, the air temperature at the pedestrian level tended to decrease, which means that an increased number of shrubs is conducive to reducing the air temperature, thus mitigating the heat island effect.
In addition, the pedestrian air temperature for the middle- and high-level plant collocations was lower than that for the middle- and low-level plant collocations under the same ratio of trees to shrubs. The reason for this difference may be that the middle- and high-level plant collocations can provide more shade, which can effectively block solar radiation and is conducive to reducing the pedestrian-level air temperature.
The time-averaged average air temperatures for each configuration were obtained by averaging the average air temperature values at nine time points from 08:00 to 16:00 (see Figure 8). For the middle- and low-level plant collocations, the value in Figure 8c was the lowest, and was 0.025 °C and 0.008 °C lower than those in Figure 8a,b, respectively. For the middle- and high-level plant collocations, the time-averaged average air temperature in Figure 8f was the lowest, and was 0.016 °C and 0.013 °C lower than those in Figure 8d,e, respectively.
In addition, the values from Figure 8d–f were all lower than those from Figure 8a–c. This result indicates that if a designer wants to reduce air temperature, the OTUS should be designed to satisfy the requirements for the middle- and high-level plant collocations, as the improvement effects were most obvious when the ratio of trees to shrubs was 1:3. Thus, the overburden thickness of the 1/4 underground space development area should be set to 80~100 cm, and the overburden thickness of the remaining 3/4 area should be set to 45~60 cm.

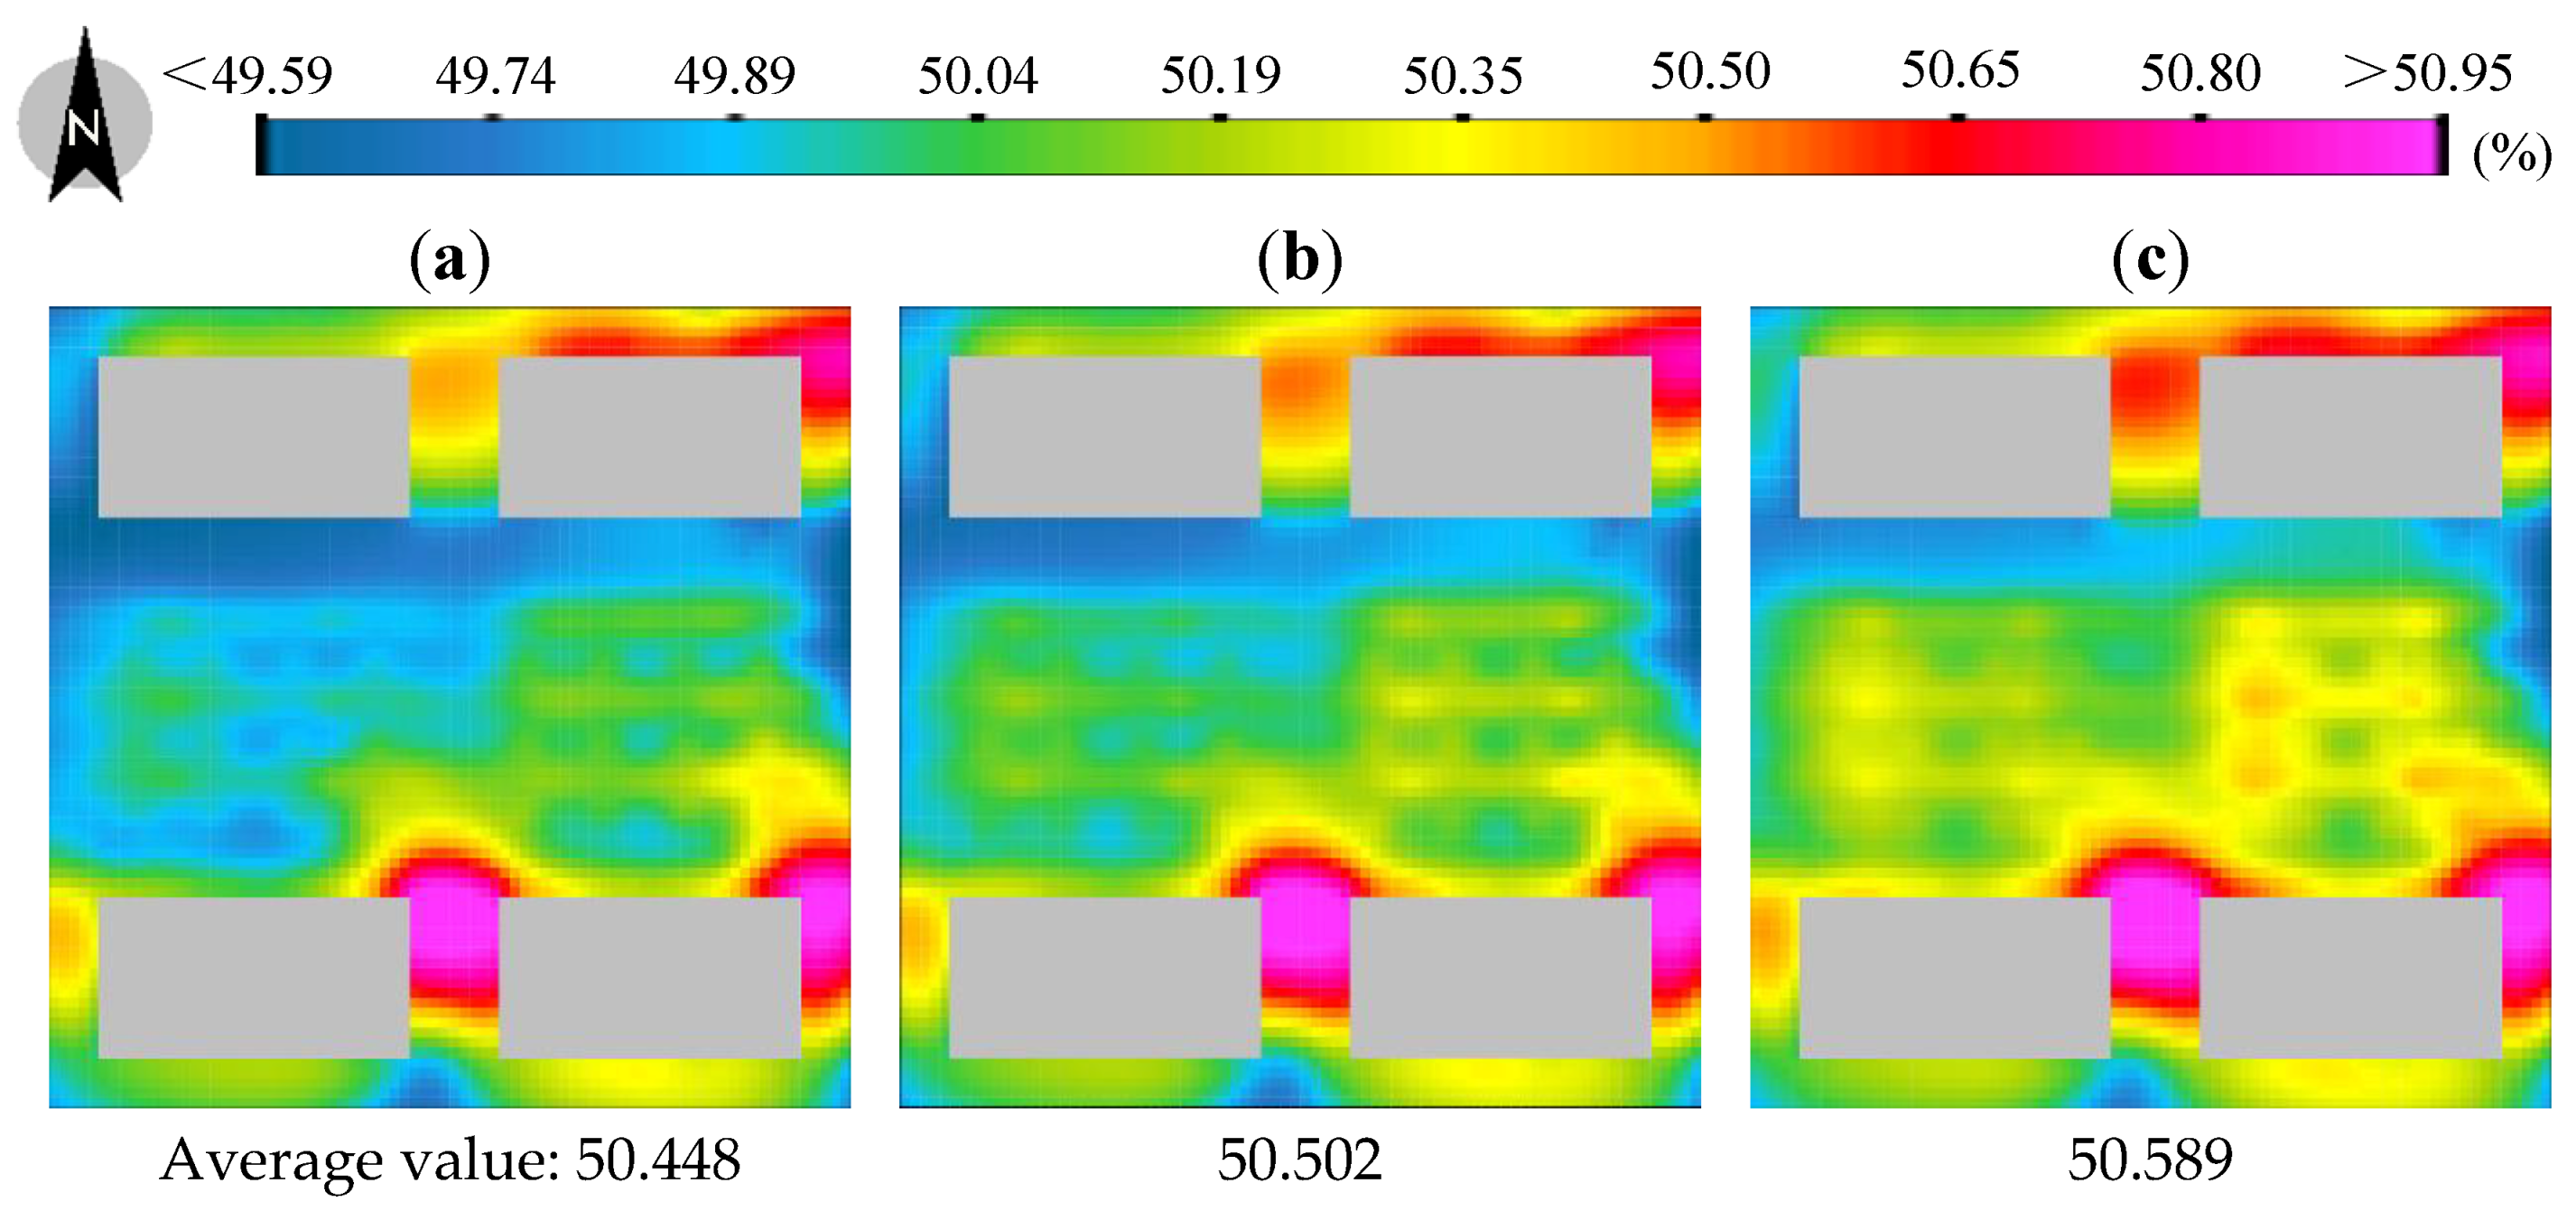
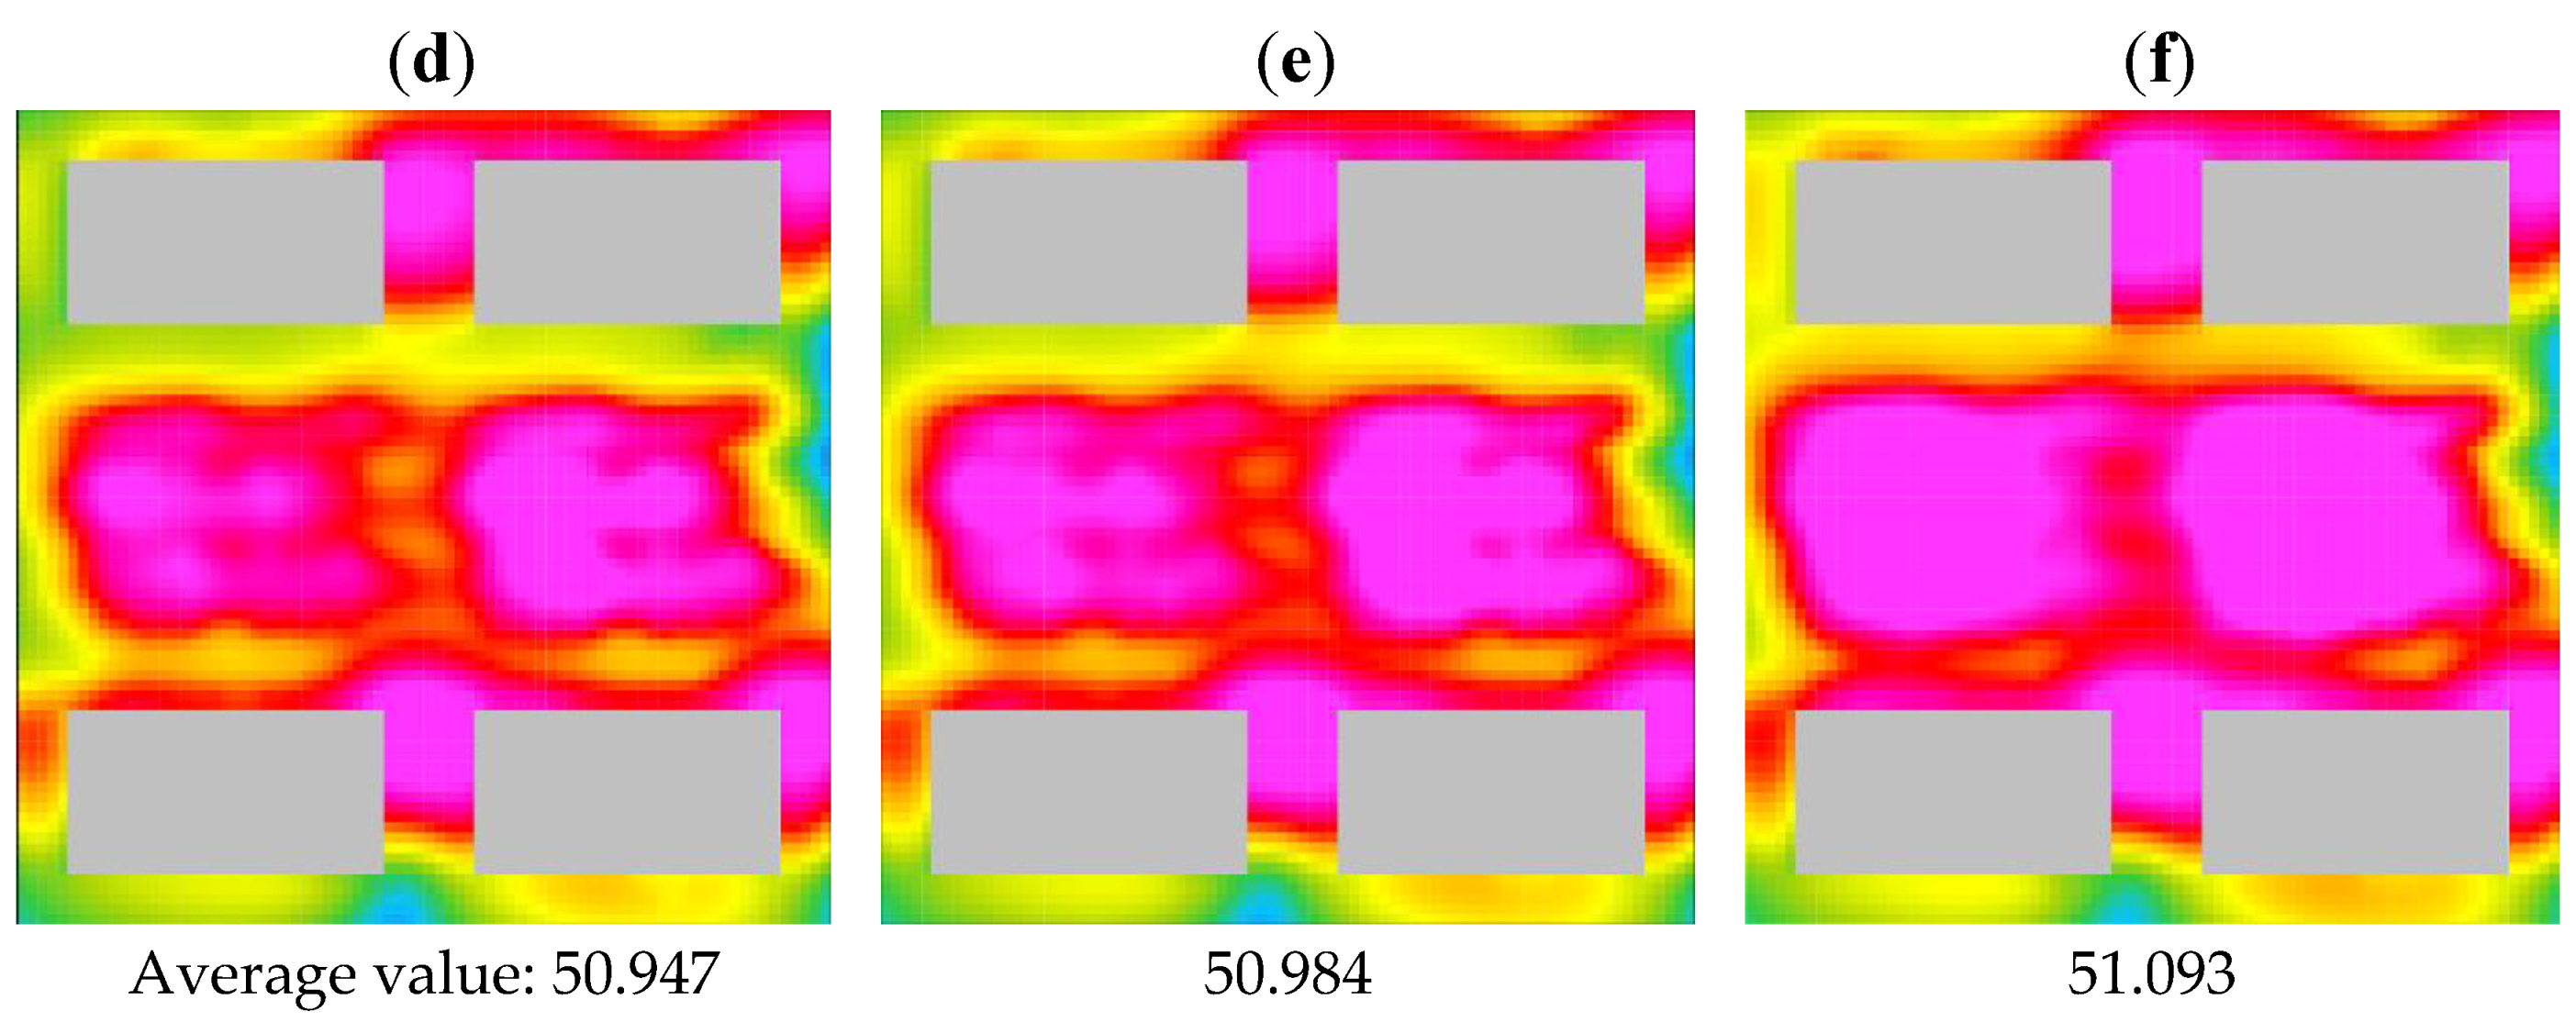
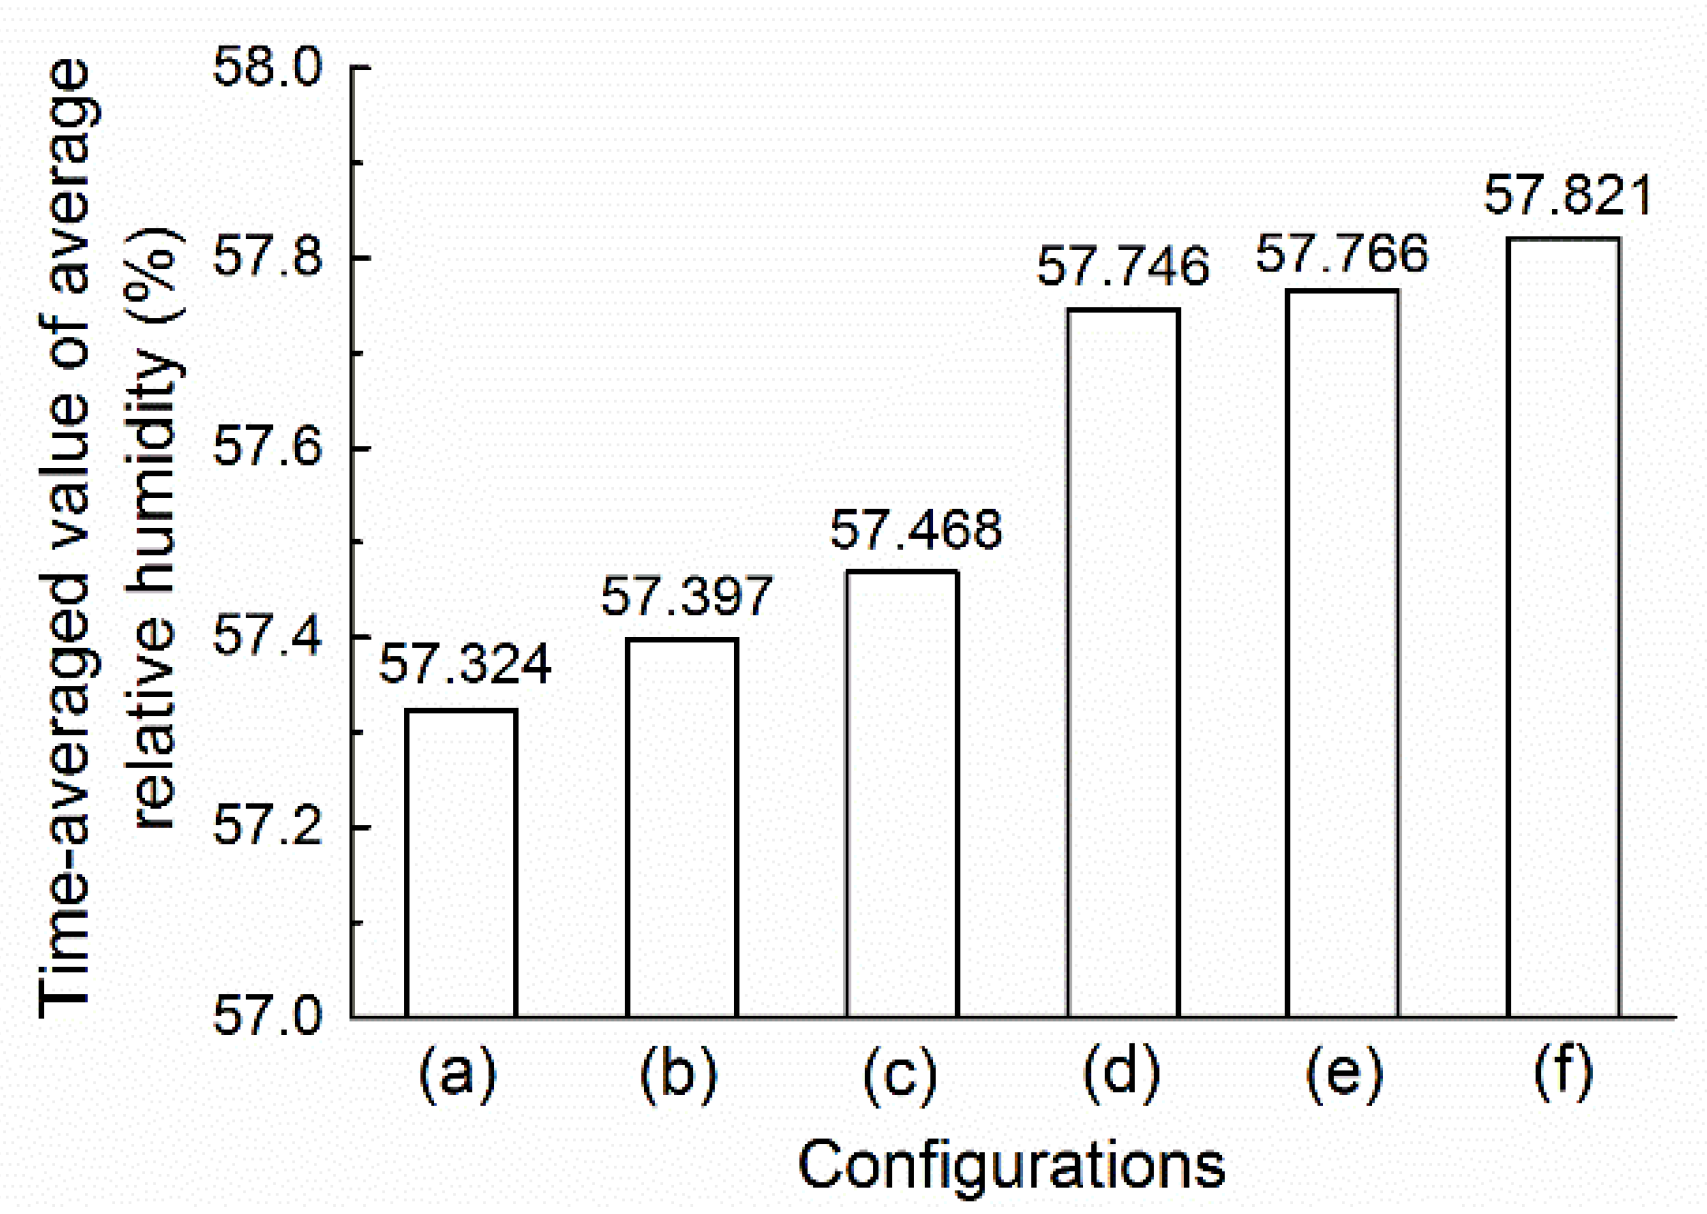
4.3. Relative Humidity

Figure 9 shows the changes in relative humidity for the two plant collocations under different ratios of trees to shrubs (1.5 m above ground, 15:00). In the underground space development area, the values of relative humidity in Figure 9a–c were clearly lower than those in Figure 9d–f. The change in relative humidity from the average relative humidity was in the range of 0.428~0.504% for the two plant collocations under the same ratio of trees to shrubs.
In addition, the relative humidity was always at the highest level for the ratio of trees to shrubs of 1:3, indicating that an increase in the number of shrubs increased plant transpiration, thus increasing the relative humidity level.
The time-averaged values of the average relative humidity for each configuration were obtained by averaging the average relative humidity values at nine time points from 08:00 to 16:00 (see Figure 10). For the middle- and low-level plant collocations, the value in Figure 10c was the highest, at least 0.144% and 0.071% higher than those in Figure 10a,b, respectively. For the middle- and high-level plant collocations, the value in Figure 10f was the highest, with values that were 0.055% and 0.075% higher than those in Figure 10d,e, respectively. In addition, the values from Figure 10d–f were all higher than those from Figure 10a–c. This result indicates that if the OTUS satisfies the requirements for the design of the middle- and high-level plant collocations, the pedestrian relative humidity could be increased effectively, and the improvement effects were most obvious when the ratio of trees to shrubs was 1:3. Thus, the overburden thickness of the 1/4 underground space development area should be set to 80~100 cm, and the overburden thickness of the remaining 3/4 area should be set to 45~60 cm.

4.4. Outdoor Thermal Comfort

Figure 11 shows the changes in the MRT for the two plant collocations under different ratios of trees to shrubs (1.5 m above ground, 15:00 p.m.). The MRT was significantly reduced where trees and shrubs were grown due to the cooling effect of greening. However, due to the lack of shade, the improvement effect of shrubs on the MRT was weaker than that of trees. With an increase in the ratio of trees to shrubs, the average MRT tended to decrease, which means that an increased number of shrubs is conducive to improving outdoor MRT. In addition, the design of the middle- and high-level plant collocations was more conducive to lowering the outdoor MRT than that of the middle- and low-level plant collocations.
The time-averaged values of the average MRT for each configuration were obtained by averaging the average MRT values at nine time points from 08:00 to 16:00 (see Figure 12). The time-averaged values of the average MRT from Figure 12d–f were clearly lower than those from Figure 12a–c. When the ratio of trees to shrubs was 2:3, the difference in the time-averaged values of the average MRT for the two types of plant collocations was 1.501 °C, and the corresponding differences were 1.583 °C and 1.923 °C when the ratios were 1:2 and 1:3, respectively. For the same plant collocations, the time-averaged values of the average MRT tended to decrease as the ratio of trees to shrubs increased.
For the middle- and low-level plant collocations, the time-averaged value of the average MRT in Figure 12c was the lowest, at least 0.431 °C and 0.391 °C lower than those in Figure 12a,b, respectively. For the middle- and high-level plant collocations, the value in Figure 12f was the lowest, a total of 0.462 °C and 0.340 °C lower than those in Figure 12d,e, respectively. Therefore, the OTUS should be designed to satisfy the requirements for the middle- and high-level plant collocations, which will help to effectively improve the pedestrian-level thermal comfort, and the improvement effects were most obvious when the ratio of trees to shrubs was 1:3. Thus, the overburden thickness of the 1/4 underground space development area should be set to 80~100 cm, and the overburden thickness of the remaining 3/4 area should be set to 45~60 cm.

5. Conclusions

In this study, we investigated the optimization of the design of the OTUS for improving the quality of the outdoor thermal environment according to the designer’s different requirements. The influence mechanism of the OTUS on the outdoor thermal environment and a framework of the optimization design of the underground space overburden thickness were proposed.
We chose a residential area with a row layout in Nanjing, China, as the research object and used the CFD software ENVI-met to quantitatively analyze the influence of plant communities formed by two types of plant collocations (a middle- and low-level plant collocation and a middle- and high-level plant collocation) on the outdoor thermal environment (airflow field, air temperature, relative humidity and thermal comfort) under three different ratios of trees to shrubs (2:3, 1:2, and 1:3) and to provide suggestions regarding the design of the OTUS. The results of this study led to the following conclusions.
The building layout exerted a greater influence than that of the plant collocations on the outdoor airflow field. Under the same ratio of trees to shrubs, the middle- and low-level plant collocation was more conducive to the spread of outdoor airflow than the middle- and high-level plant collocation. However, it was not conducive to reducing air temperature, increasing relative humidity, and improving outdoor thermal comfort. For the same plant collocation, an increase in the ratio of trees to shrubs was not conducive to the spread of outdoor airflow, however, it was conducive to reducing air temperature, increasing relative humidity, and improving the outdoor thermal comfort.
If a designer wants to enhance outdoor ventilation, the OTUS should be designed to satisfy the requirements for the middle- and low-level plant collocations, and the improvement effects are most obvious when the ratio of trees to shrubs is 2:3. Thus, the overburden thickness of the 2/5 underground space development area should be set to 80~100 cm, the overburden thickness of the other 2/5 area should be set to 45~60 cm, and the overburden thickness of the remaining 1/5 area should be set to 30~45 cm.
If a designer wants to reduce air temperature, increase relative humidity, and improve outdoor thermal comfort, the OTUS should be designed to satisfy the requirements for middle- and high-level plant collocations, and the effects are most obvious when the ratio of trees to shrubs is 1:3. Thus, the overburden thickness of the 1/4 underground space development area should be set to 80~100 cm, and the overburden thickness of the remaining 3/4 area should be set to 45~60 cm.

Author Contributions

X.S., Z.C. and X.Z. conceived and designed the study. X.S., X.Y. and H.T. performed the numerical simulations and result analyses. X.S. wrote the paper. Z.C., X.Z. and Q.F. reviewed and edited the manuscript. All authors read and approved the manuscript.

Funding

This study was supported by the National Natural Science Foundation of China (Grant No. 51478463).

Conflicts of Interest

The authors declare no conflict of interest.

References

  1. Yang, F.; Lau, S.S.Y.; Qian, F. Thermal comfort effects of urban design strategies in high-rise urban environments in a sub-tropical climate. Archit. Sci. Rev. 2011, 54, 285–304. [Google Scholar] [CrossRef]
  2. Hong, B.; Lin, B.R. Numerical studies of the outdoor wind environment and thermal comfort at pedestrian level in housing blocks with different building layout patterns and trees arrangement. Renew. Energy 2015, 73, 18–27. [Google Scholar] [CrossRef]
  3. Hong, B.; Lin, B.R.; Wang, B.; Li, S.H. Optimal design of vegetation in residential district with numerical simulation and field experiment. J. Cent. South Univ. Technol. 2012, 19, 688–695. [Google Scholar] [CrossRef]
  4. Lin, T.P.; Matzarakis, A.; Hwang, R.L. Shading effect on long-term outdoor thermal comfort. Build. Environ. 2010, 45, 213–221. [Google Scholar] [CrossRef]
  5. Lai, D.Y.; Guo, D.H.; Hou, Y.F.; Lin, C.Y.; Chen, Q.Y. Studies of outdoor thermal comfort in northern china. Build. Environ. 2014, 77, 110–118. [Google Scholar] [CrossRef]
  6. Wong, K.V.; Paddon, A.; Jimenez, A. Review of world urban heat islands: Many linked to increased mortality. J. Energy Resour. Technol.-Trans. ASME 2013, 135, 11. [Google Scholar] [CrossRef]
  7. Robine, J.M.; Cheung, S.L.K.; Le Roy, S.; Van Oyen, H.; Griffiths, C.; Michel, J.P.; Herrmann, F.R. Death toll exceeded 70,000 in europe during the summer of 2003. C. R. Biol. 2008, 331, 171–178. [Google Scholar] [CrossRef] [PubMed]
  8. Conti, S.; Meli, P.; Minelli, G.; Solimini, R.; Toccaceli, V.; Vichi, M.; Beltrano, C.; Perini, L. Epidemiologic study of mortality during the summer 2003 heat wave in Italy. Environ. Res. 2005, 98, 390–399. [Google Scholar] [CrossRef] [PubMed]
  9. Vandentorren, S.; Suzan, F.; Medina, S.; Pascal, M.; Maulpoix, A.; Cohen, J.C.; Ledrans, M. Mortality in 13 French Cities During the August 2003 Heat Wave. Am. J. Public Health 2004, 94, 1518. [Google Scholar] [CrossRef] [PubMed]
  10. Kovats, S.; Wolf, T.; Menne, B. Heatwave of August 2003 in Europe: Provisional Estimates of the Impact on Mortality. Available online: https://www.eurosurveillance.org/content/10.2807/esw.08.11.02409-en (accessed on 23 August 2018).
  11. Hong, B.; Lin, B.R.; Hu, L.H.; Li, S.H. Optimal tree design for sunshine and ventilation in residential district using geometrical models and numerical simulation. Build. Simul. 2011, 4, 351–363. [Google Scholar] [CrossRef]
  12. Ooka, R.; Chen, H.; Kato, S. Study on optimum arrangement of trees for design of pleasant outdoor environment using multi-objective genetic algorithm and coupled simulation of convection, radiation and conduction. J. Wind Eng. Ind. Aerodyn. 2008, 96, 1733–1748. [Google Scholar] [CrossRef]
  13. Zhang, L.; Zhan, Q.; Lan, Y. Effects of the tree distribution and species on outdoor environment conditions in a hot summer and cold winter zone: A case study in Wuhan residential quarters. Build. Environ. 2018, 130, 27–39. [Google Scholar] [CrossRef]
  14. Su, X.; Cai, H.; Chen, Z.; Feng, Q.; Su, X.; Cai, H.; Chen, Z.; Feng, Q. Influence of the Ground Greening Configuration on the Outdoor Thermal Environment in Residential Areas under Different Underground Space Overburden Thicknesses. Sustainability 2017, 9, 1656. [Google Scholar] [CrossRef]
  15. Yang, X.B.; Chen, Z.L.; Cai, H.; Ma, L.J. A framework for assessment of the influence of china’s urban underground space developments on the urban microclimate. Sustainability 2014, 6, 8536–8566. [Google Scholar] [CrossRef]
  16. Wu, F.; Li, S.; Zhang, L.; Liu, J. Study on the Difference of Eco-efficiency of Different Ratios of Tree and Shrub-grassed Greenland. In Seizing the Opportunities for the 2008 Olympic Games to Further Promote the Urban Greening Level in Beijing; Beijing Institute of Landscape Architecture: Beijing, China, 2005; Available online: http://cpfd.cnki.com.cn/Article/CPFDTOTAL-YLXH200510001070.htm (accessed on 23 August 2018). (In Chinese)
  17. Zhang, X.; Li, Z.; Wang, J.; Zhao, C.; Liu, T. Analysis of the ratio of arbor to shrub of several types of green space in Beijing. J. Beijing For. Univ. 2010, S1, 183–188. (In Chinese) [Google Scholar]
  18. Dimoudi, A.; Nikolopoulou, M. Vegetation in the urban environment: Microclimatic analysis and benefits. Energy Build. 2003, 35, 69–76. [Google Scholar] [CrossRef]
  19. Lin, B.R.; Li, X.F.; Zhu, Y.X.; Qin, Y.G. Numerical simulation studies of the different vegetation patterns’ effects on outdoor pedestrian thermal comfort. J. Wind Eng. Ind. Aerodyn. 2008, 96, 1707–1718. [Google Scholar] [CrossRef]
  20. Wong, N.H.; Jusuf, S.K.; La Win, A.A.; Thu, H.K.; Negara, T.S.; Wu, X.C. Environmental study of the impact of greenery in an institutional campus in the tropics. Build. Environ. 2007, 42, 2949–2970. [Google Scholar] [CrossRef]
  21. Yang, X.S.; Zhao, L.H.; Bruse, M.; Meng, Q.L. Evaluation of a microclimate model for predicting the thermal behavior of different ground surfaces. Build. Environ. 2013, 60, 93–104. [Google Scholar] [CrossRef]
  22. Huang, L.M.; Li, H.T.; Zha, D.H.; Zhu, J.Y. A fieldwork study on the diurnal changes of urban microclimate in four types of ground cover and urban heat island of nanjing, china. Build. Environ. 2008, 43, 7–17. [Google Scholar] [CrossRef]
  23. Robitu, M.; Musy, M.; Inard, C.; Groleau, D. Modeling the influence of vegetation and water pond on urban microclimate. Sol. Energy 2006, 80, 435–447. [Google Scholar] [CrossRef]
  24. Bruse, M.; Fleer, H. Simulating surface-plant-air interactions inside urban environments with a three dimensional numerical model. Environ. Model. Softw. 1998, 13, 373–384. [Google Scholar] [CrossRef]
  25. Ge, Y. Analysis of Several Factors of the Multi-Storey Underground Garage’s Structure Cost Optimization. Master’s Thesis, Anhui Jianzhu University, Hefei, China, 2014. (In Chinese). [Google Scholar]
  26. ISO 7726. In Ergonomics of the Thermal Environment—Instrument for Measuring Physical Quantities; International Organization for Standardization: Geneva, Switzerland, 1998.
  27. Ali-Toudert, F.; Mayer, H. Numerical study on the effects of aspect ratio and orientation of an urban street canyon on outdoor thermal comfort in hot and dry climate. Build. Environ. 2006, 41, 94–108. [Google Scholar] [CrossRef]
  28. Swaid, H.; Bar-El, M.; Hoffman, M.E. A bioclimatic design methodology for urban outdoor spaces. Theor. Appl. Climatol. 1993, 48, 49–61. [Google Scholar] [CrossRef]
  29. Nunez, M.; Oke, T.R. The energy balance of an urban canyon. Appl. Meteorol. 1977, 16, 11–19. [Google Scholar] [CrossRef]
  30. Fanger, P.O. Thermal Comfort: Analysis and Applications in Environmental Engineering; Danish Technical Press: Copenhagen, Denmark, 1970. [Google Scholar]
  31. Bruse, M. The Influences of Local Environmental Design on Microclimate-Development of a Prognostic Numerical Model Envi-Met for the Simulation of Wind, Temperature and Humidity Distribution in Urban Structures; Temperature and Humidity Distribution in Urban Structures; Institute of Geography, University of Bochum: Bochum, Germany, 1999. (In German) [Google Scholar]
Figure 1. The influence process of the OTUS on outdoor thermal environment (picture source: author self-drawing).
Sustainability 10 03205 g001
Figure 2. The framework of the optimization design of underground space overburden thickness (picture source: author self-drawing).
Sustainability 10 03205 g002
Figure 3. Two common plant collocations above underground buildings. (a) Middle- and high-level plant collocations; (b) middle- and low-level plant collocations. (Picture source: Author self-drawing).
Sustainability 10 03205 g003
Figure 4. Models of plant collocations under different ratios of trees to shrubs. (ac) were middle- and low-level plant collocations corresponding to tree to shrub ratios of 2:3, 1:2, and 1:3; (df) were middle- and high-level plant collocations corresponding to tree to shrub ratios of 2:3, 1:2, and 1:3. Each greening configuration corresponded to a kind of underground space overburden thickness that could meet the requirements of growth for plants (picture source: ENVI-met).
Sustainability 10 03205 g004aSustainability 10 03205 g004b
Figure 5. The changes in wind velocity for two plant collocations under different ratios of trees to shrubs (1.5 m above ground, 15:00); (ac) were middle- and low-level plant collocations corresponding to tree to shrub ratios of 2:3, 1:2, and 1:3; (df) were middle- and high-level plant collocations corresponding to tree to shrub ratios of 2:3, 1:2, and 1:3 (picture source: ENVI-met).
Sustainability 10 03205 g005
Figure 6. Time-averaged value of the average wind velocity for each configuration. (a–c) were middle- and low-level plant collocations corresponding to tree to shrub ratios of 2:3, 1:2, and 1:3; (d–f) were middle- and high-level plant collocations corresponding to tree to shrub ratios of 2:3, 1:2, and 1:3 (picture source: Author self-drawing).
Sustainability 10 03205 g006
Figure 7. The changes in air temperature for the two plant collocations under different ratios of trees to shrubs (1.5 m above ground, 15:00). (ac) were middle- and low-level plant collocations corresponding to tree to shrub ratios of 2:3, 1:2, and 1:3; (df) were middle- and high-level plant collocations corresponding to tree to shrub ratios of 2:3, 1:2, and 1:3 (picture source: ENVI-met).
Sustainability 10 03205 g007
Figure 8. Time-averaged value of the average air temperature for each configuration. (ac) were middle- and low-level plant collocations corresponding to tree to shrub ratios of 2:3, 1:2, and 1:3; (df) were middle- and high-level plant collocations corresponding to tree to shrub ratios of 2:3, 1:2, and 1:3 (picture source: Author self-drawing).
Sustainability 10 03205 g008
Figure 9. The changes in relative humidity for two plant collocations under different ratios of trees to shrubs (1.5 m above ground, 15:00). (ac) were middle- and low-level plant collocations corresponding to tree to shrub ratios of 2:3, 1:2, and 1:3; (df) were middle- and high-level plant collocations corresponding to tree to shrub ratios of 2:3, 1:2, and 1:3 (picture source: ENVI-met).
Sustainability 10 03205 g009aSustainability 10 03205 g009b
Figure 10. Time-averaged value of the average relative humidity for each configuration. (ac) were middle- and low-level plant collocations corresponding to tree to shrub ratios of 2:3, 1:2, and 1:3; (df) were middle- and high-level plant collocations corresponding to tree to shrub ratios of 2:3, 1:2, and 1:3 (picture source: Author self-drawing).
Sustainability 10 03205 g010
Figure 11. The changes in MRT for two plant collocations under different ratios of trees to shrubs (1.5 m above ground, 15:00. (ac) were middle- and low-level plant collocations corresponding to tree to shrub ratios of 2:3, 1:2, and 1:3; (df) were middle- and high-level plant collocations corresponding to tree to shrub ratios of 2:3, 1:2, and 1:3 (picture source: ENVI-met).
Sustainability 10 03205 g011
Figure 12. Time-averaged value of the average MRT for each configuration. (ac) were middle- and low-level plant collocations corresponding to tree to shrub ratios of 2:3, 1:2, and 1:3; (df) were middle- and high-level plant collocations corresponding to tree to shrub ratios of 2:3, 1:2, and 1:3 (picture source: Author self-drawing).
Sustainability 10 03205 g012
Table 1. Vegetation and initial boundary conditions parameters.
ParameterDefinitionValues
Vegetation parametersVertical trees5 m × 5 m × 10 m
(L × W × H)
Transverse trees7 m × 7 m × 6 m
(L × W × H)
Large shrubs3 m × 3 m × 2 m
(L × W × H)
Small shrubs1 m ×1 m × 1 m
(L × W × H)
Lawn0.2 m (H)
Building modelBuilding dimensions30 m × 15 m × 18 m
(L × W × H)
Building materialConcrete
Building colorGray
Initial boundary conditions (typical weather in summer)Wind velocity (m/s)2.4
Wind direction (°)157.5
Initial atmospheric temperature (K)294.95
Outdoor atmospheric pressure (Pa)100,250
Relative humidity (%)80

