Exploring the Hierarchical Structure of China’s Railway Network from 2008 to 2017


Abstract
1. Introduction
2. Development of Railway System and Dataset
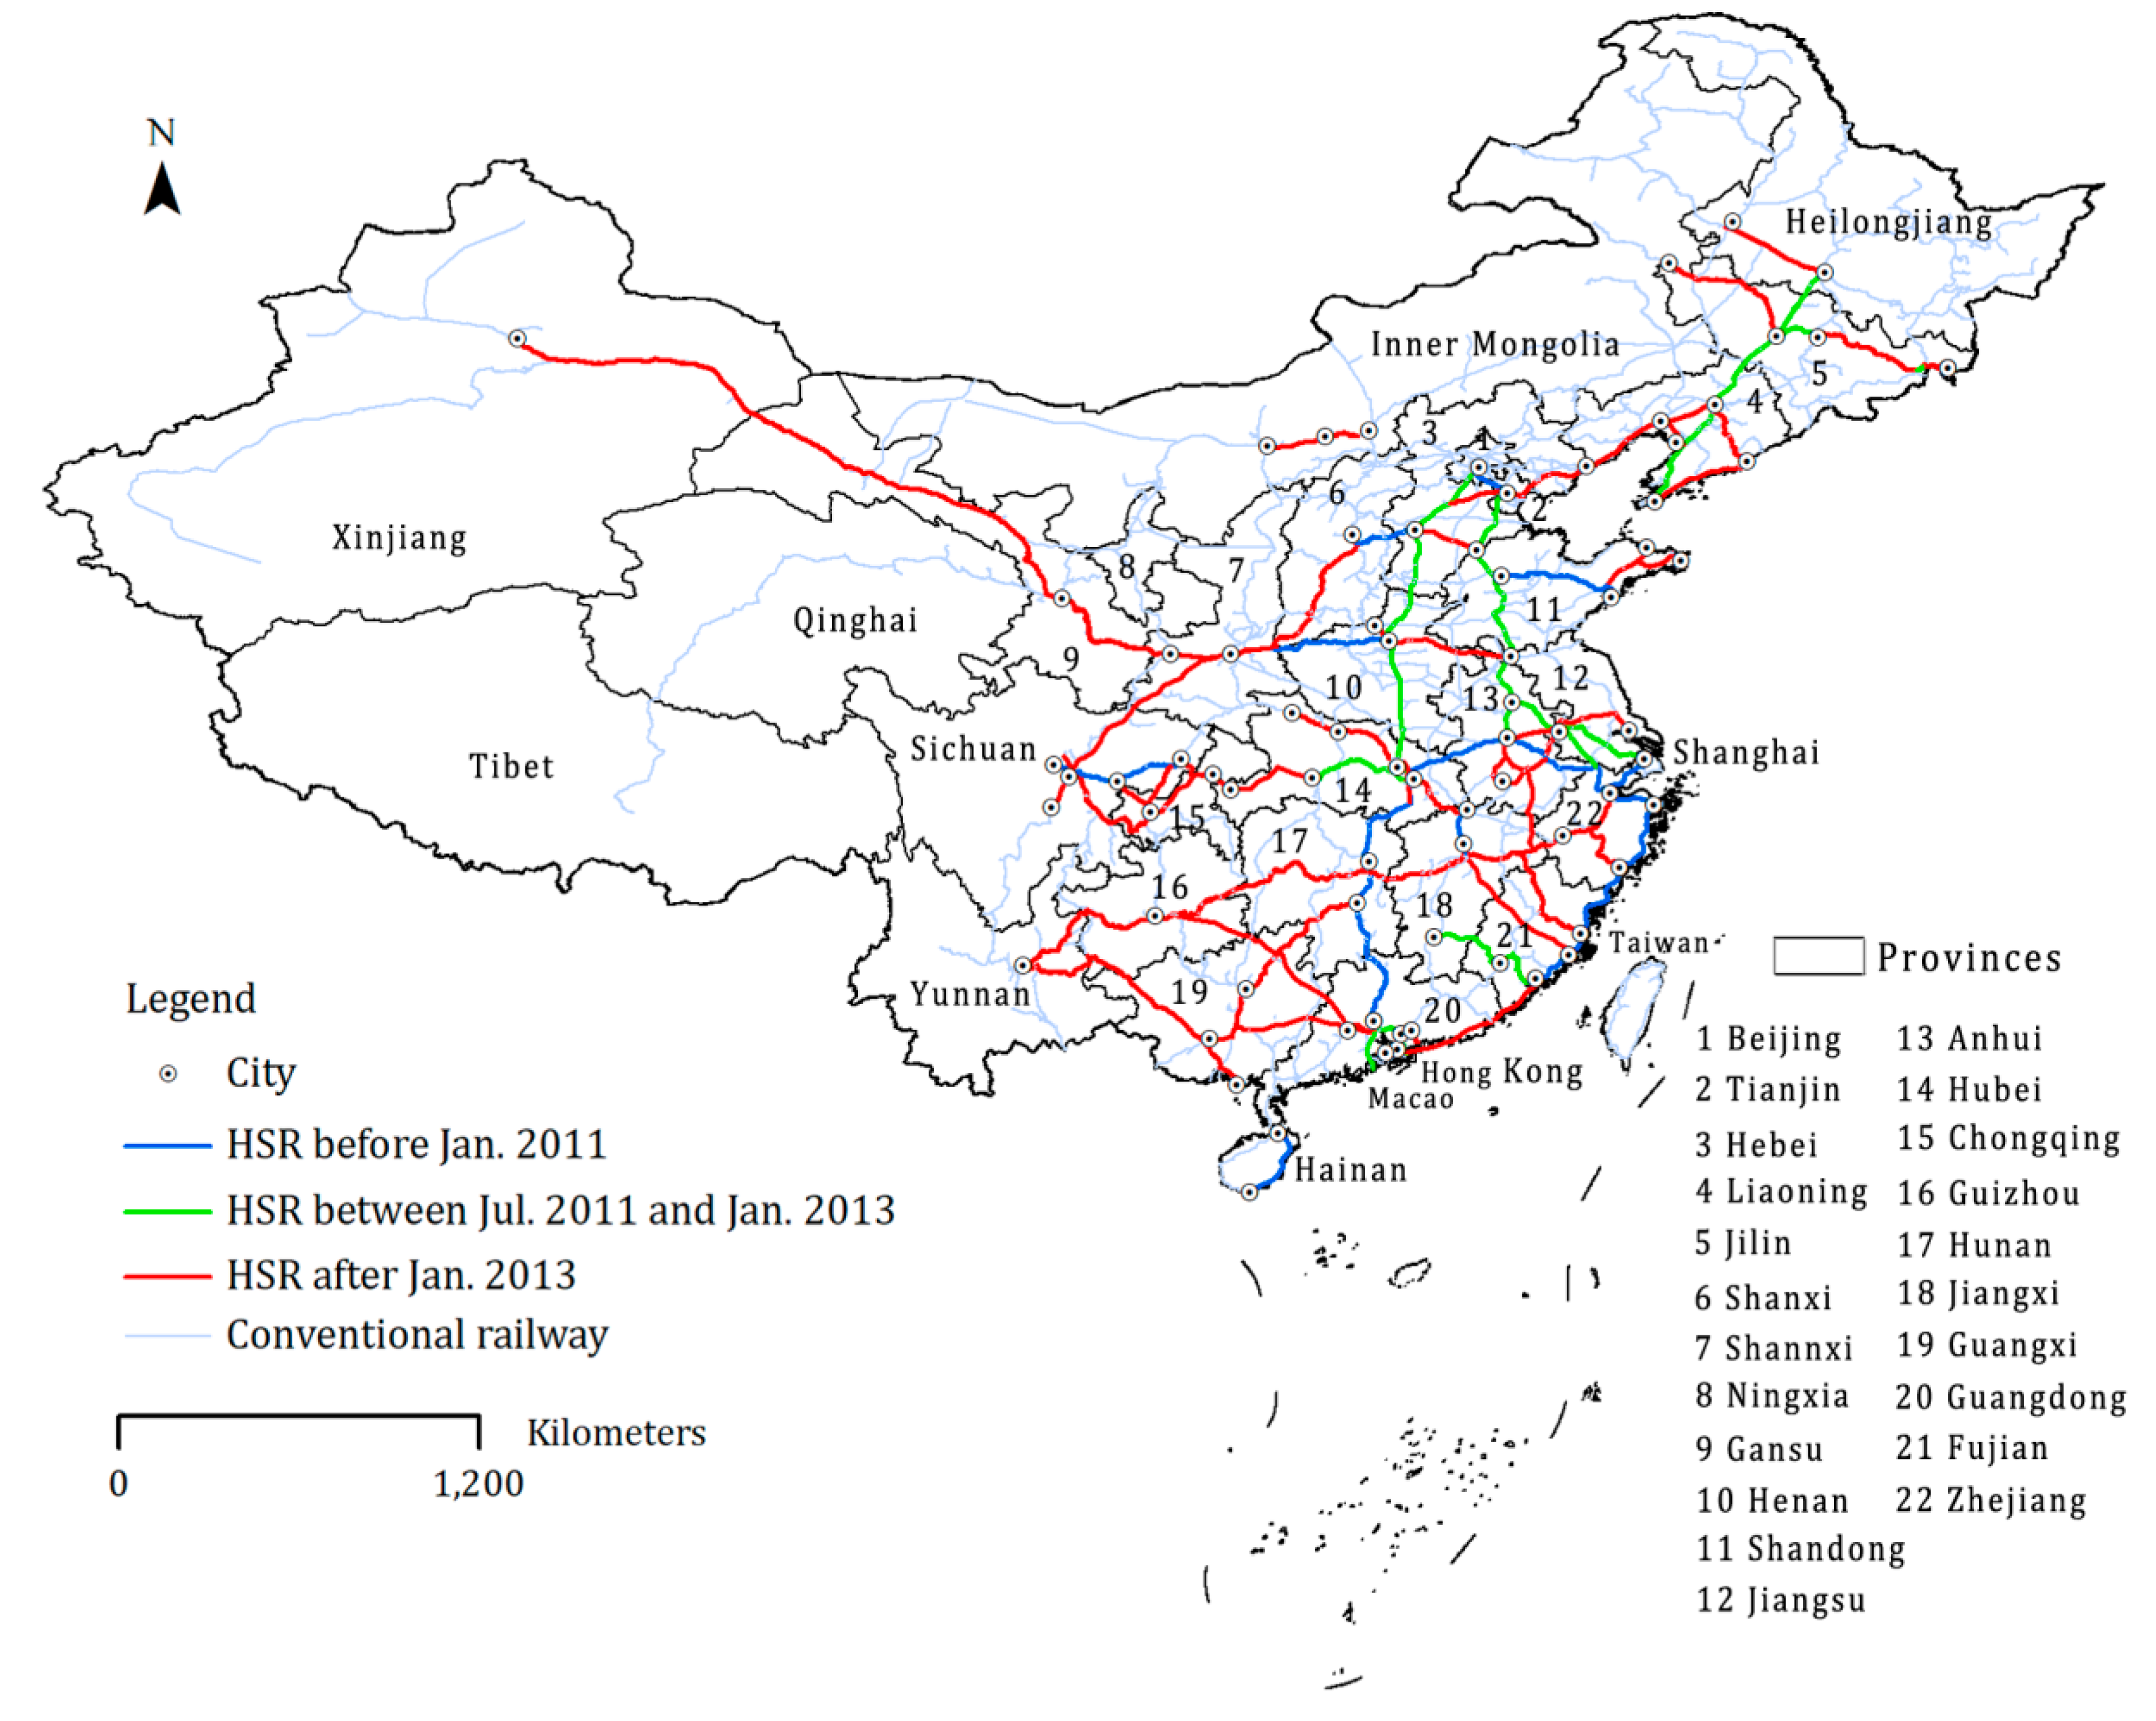
2.1. Development of Railway System
2.2. Train Timetable Data
3. Methodology
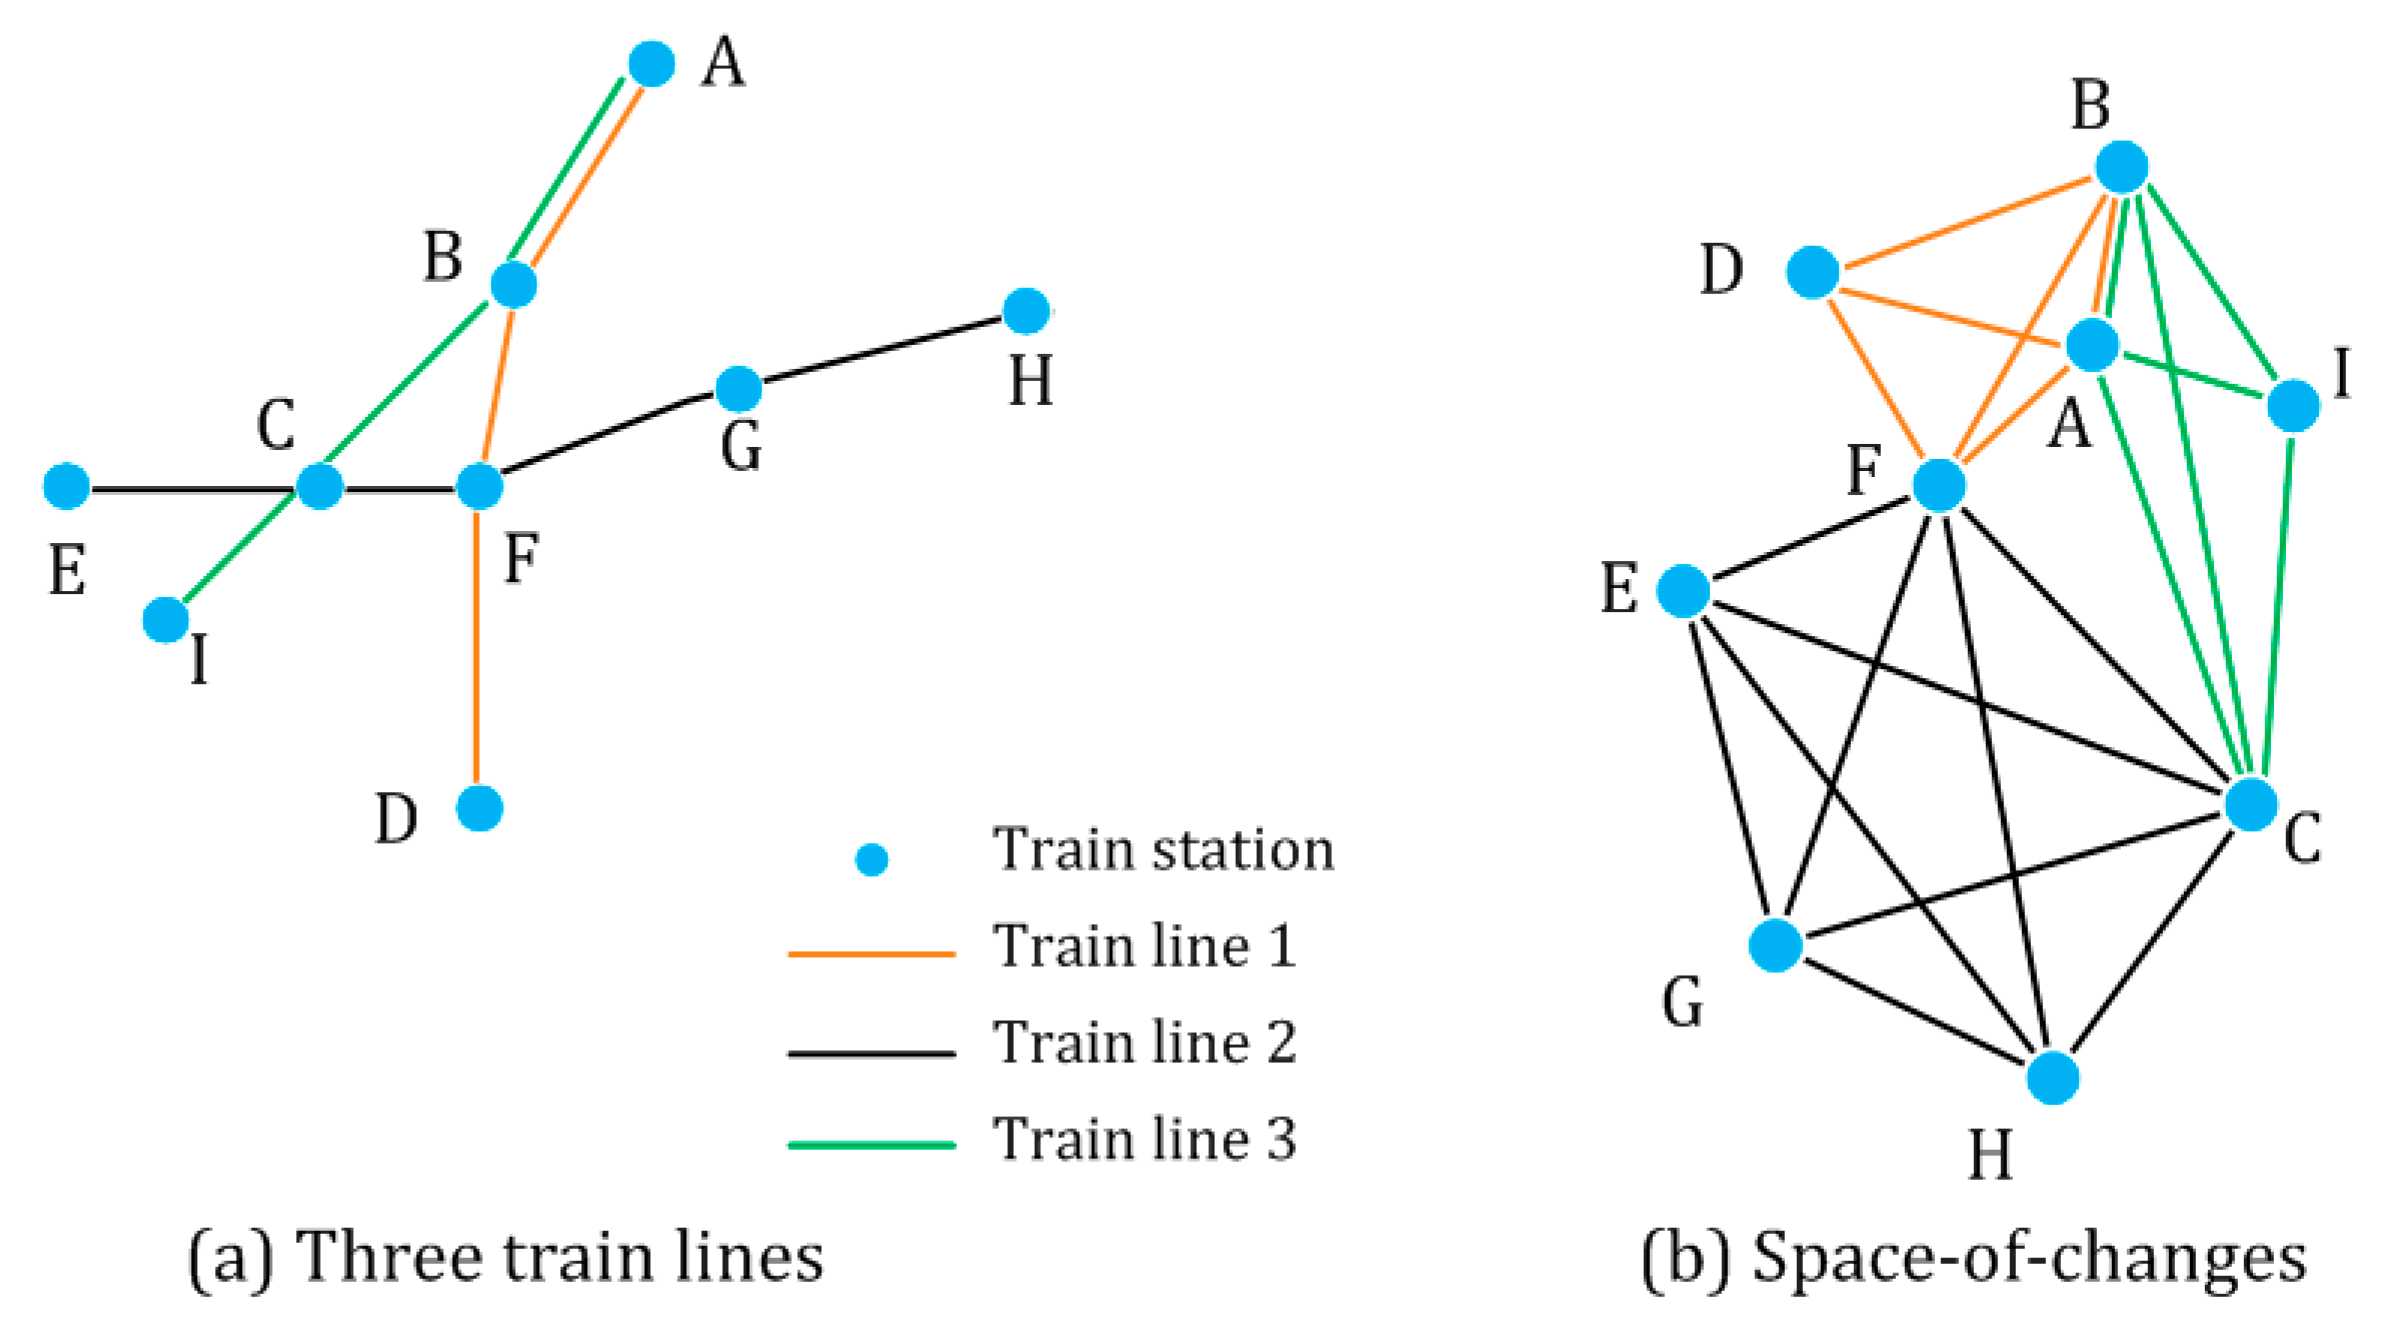
3.1. P-Space Graph of Railway Network
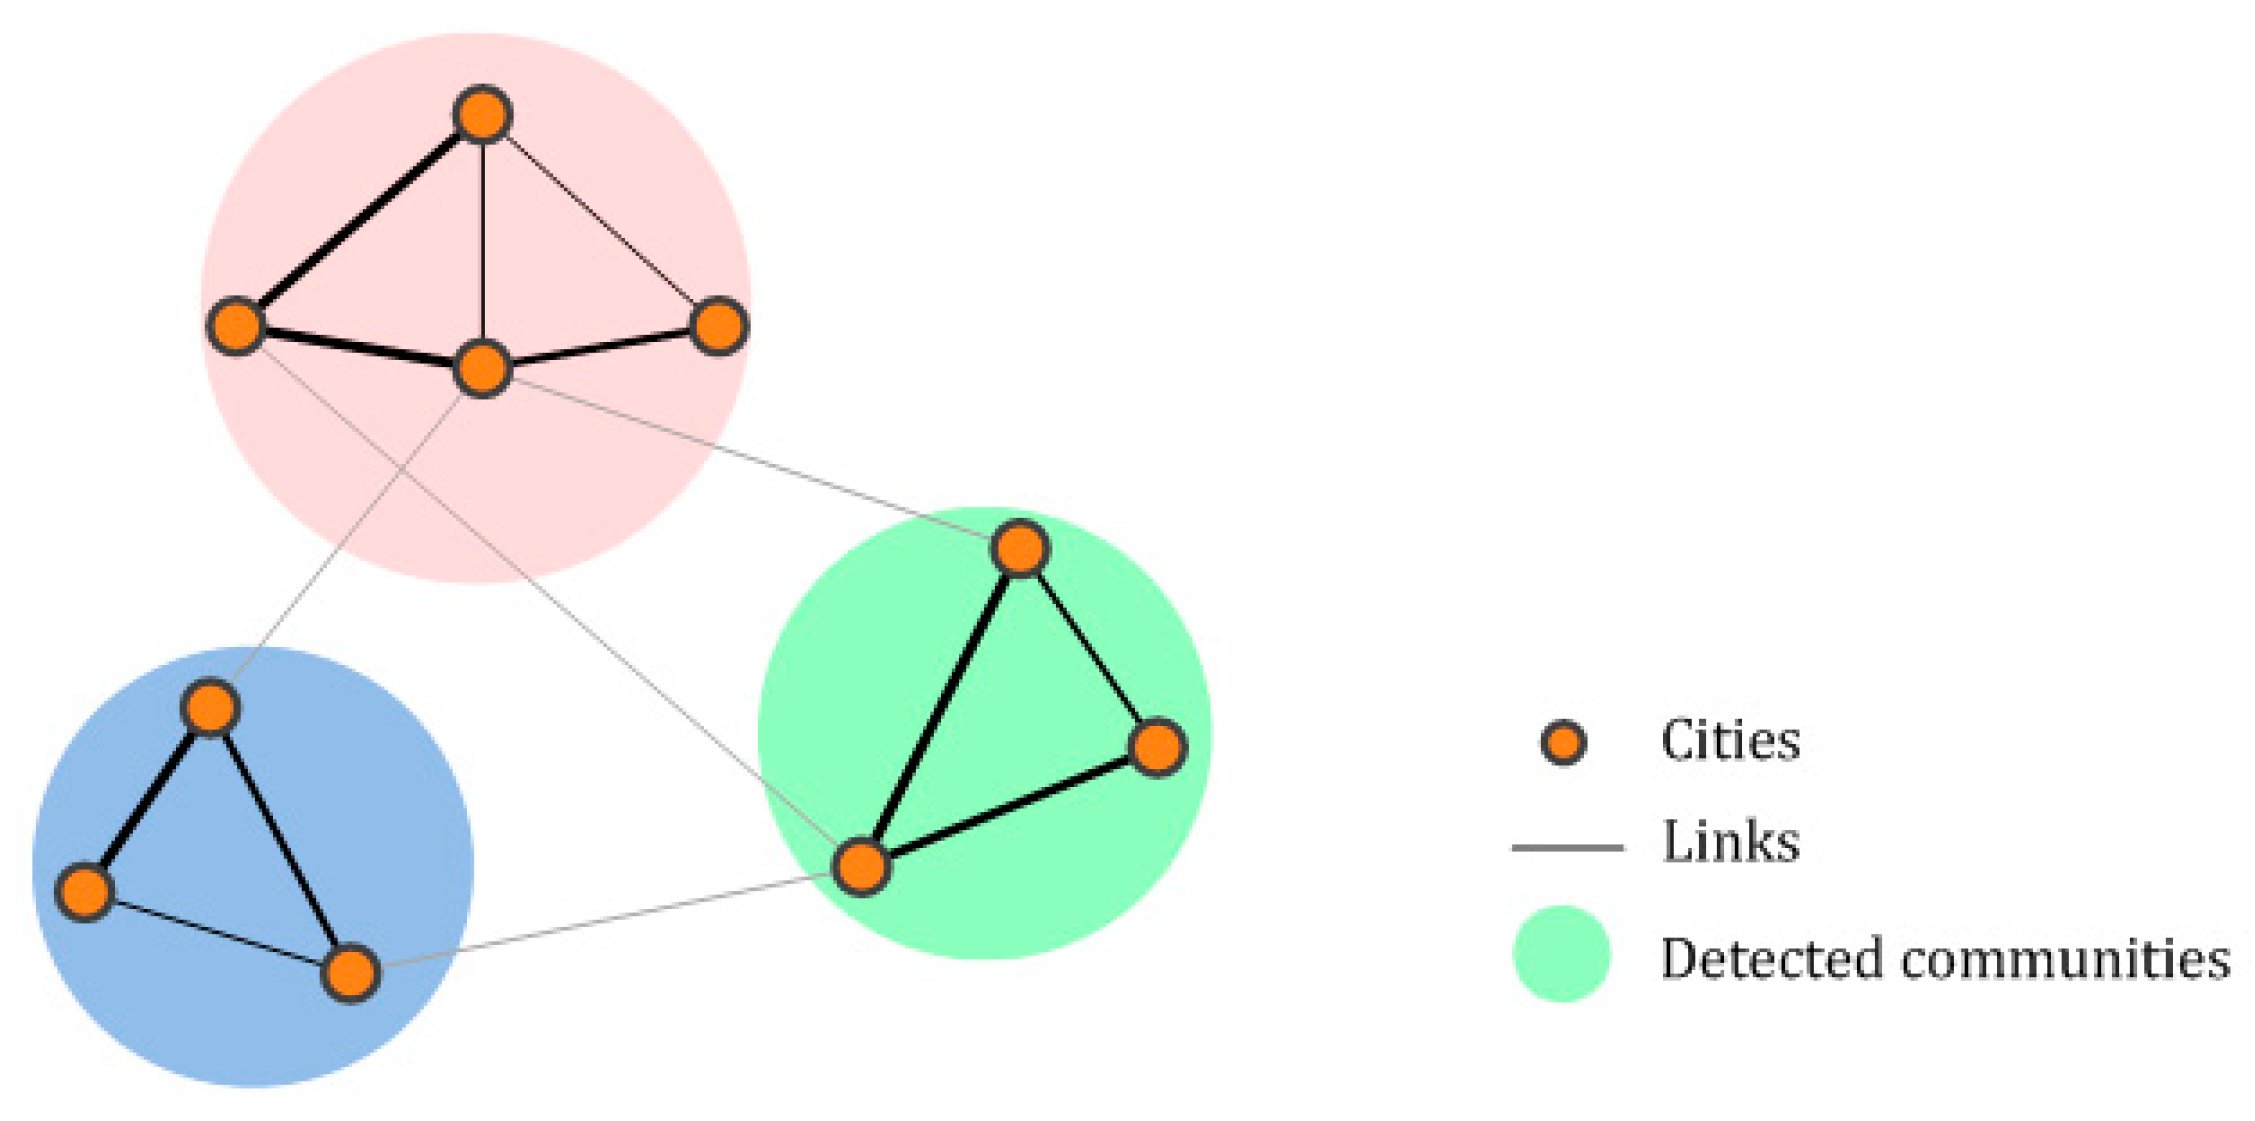
3.2. Community Detection for Railway Network
3.3. Assessing the Influence of Nodes within Each Community
4. Results and Discussions
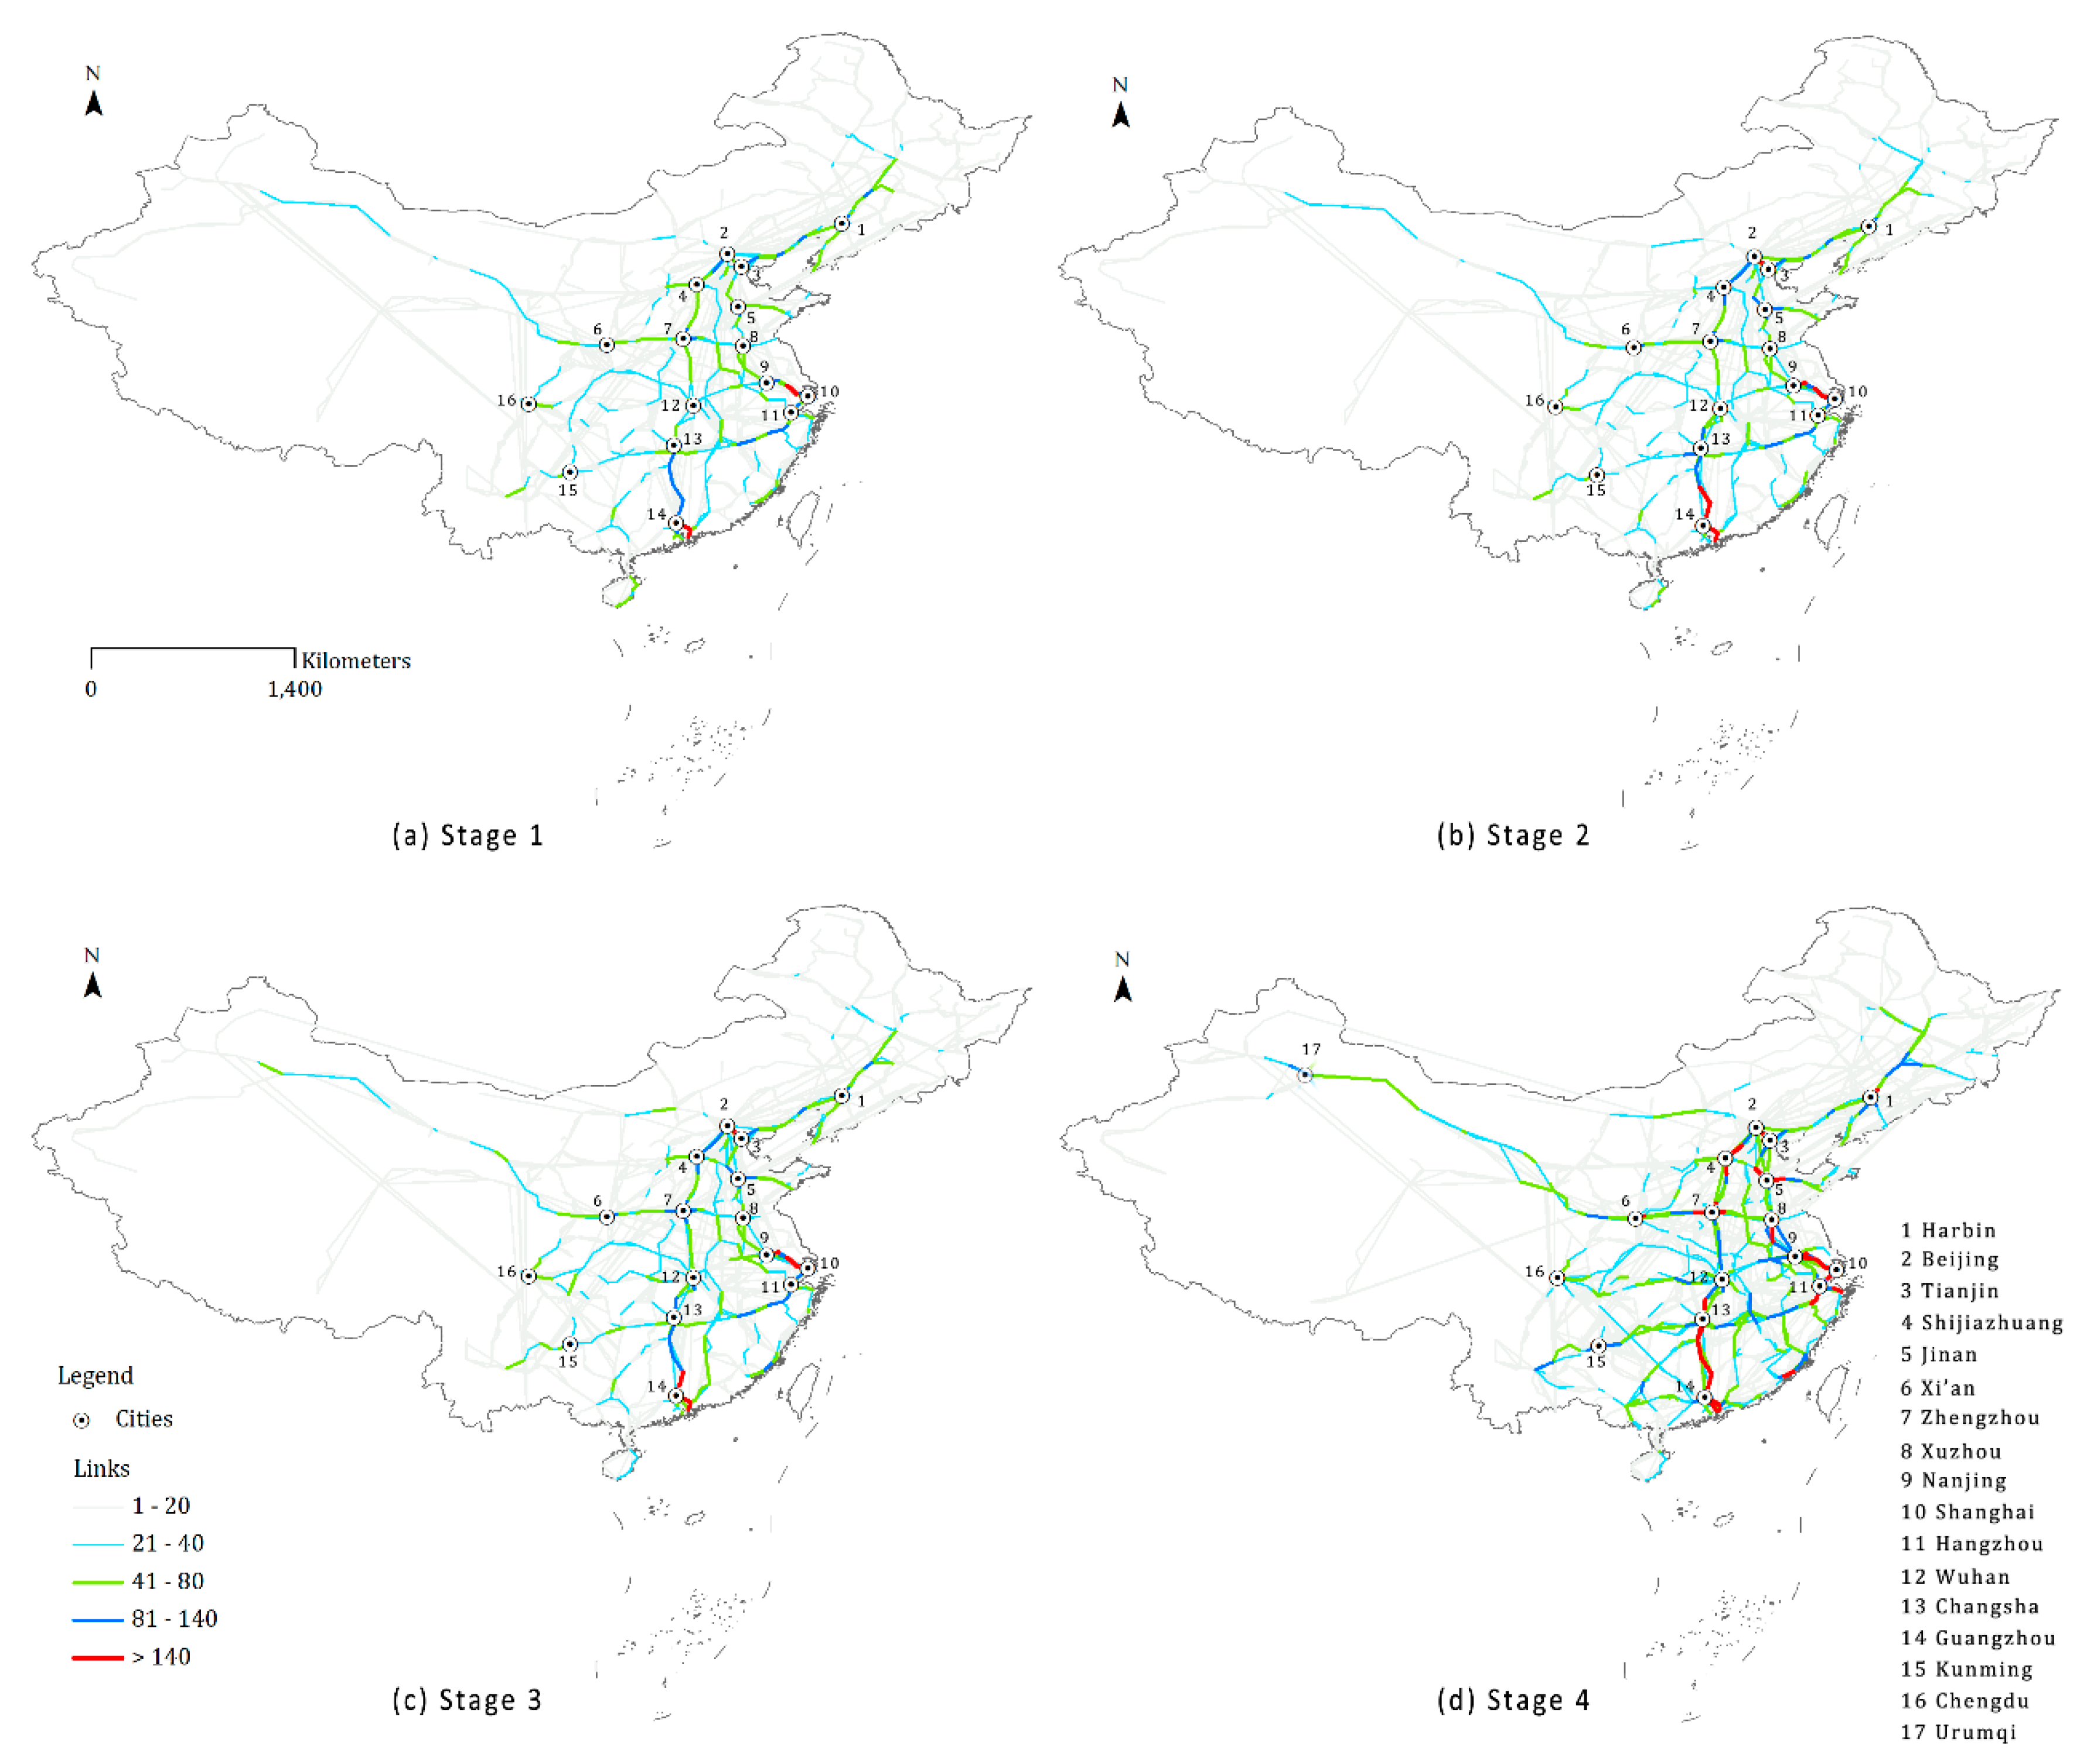
4.1. The Spatial Connectivity of Railway Networks
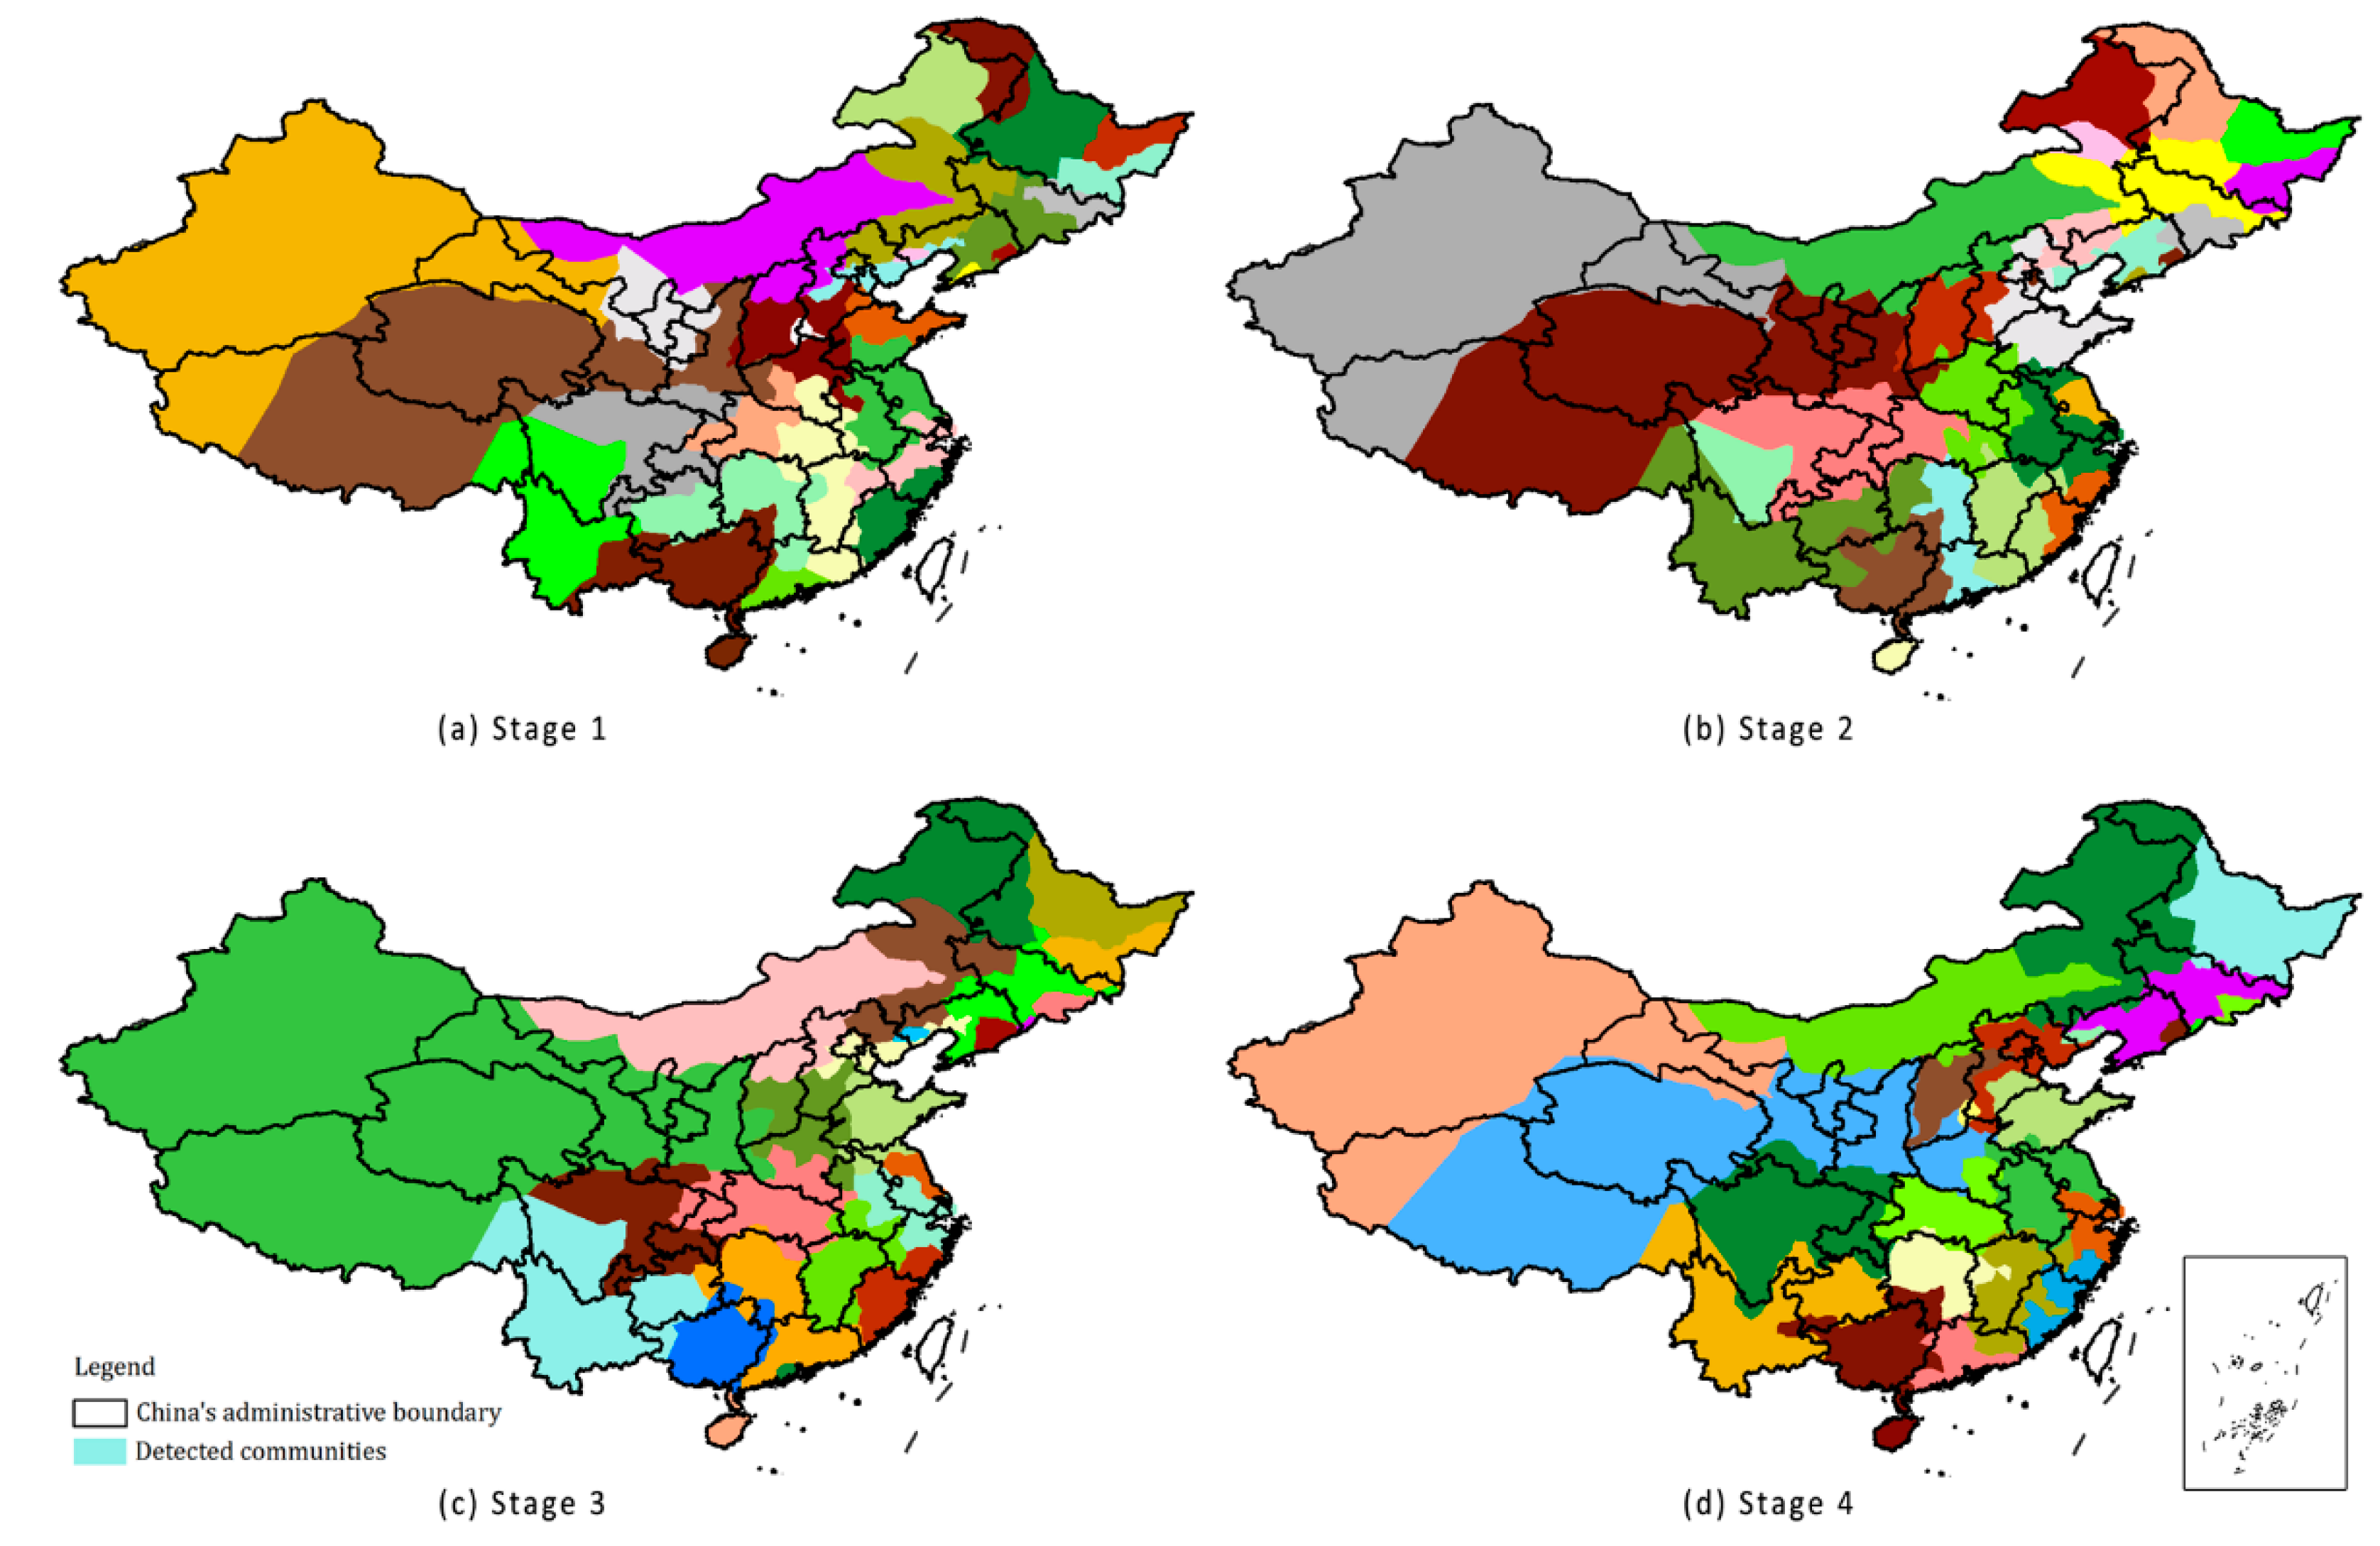
4.2. Community Detection
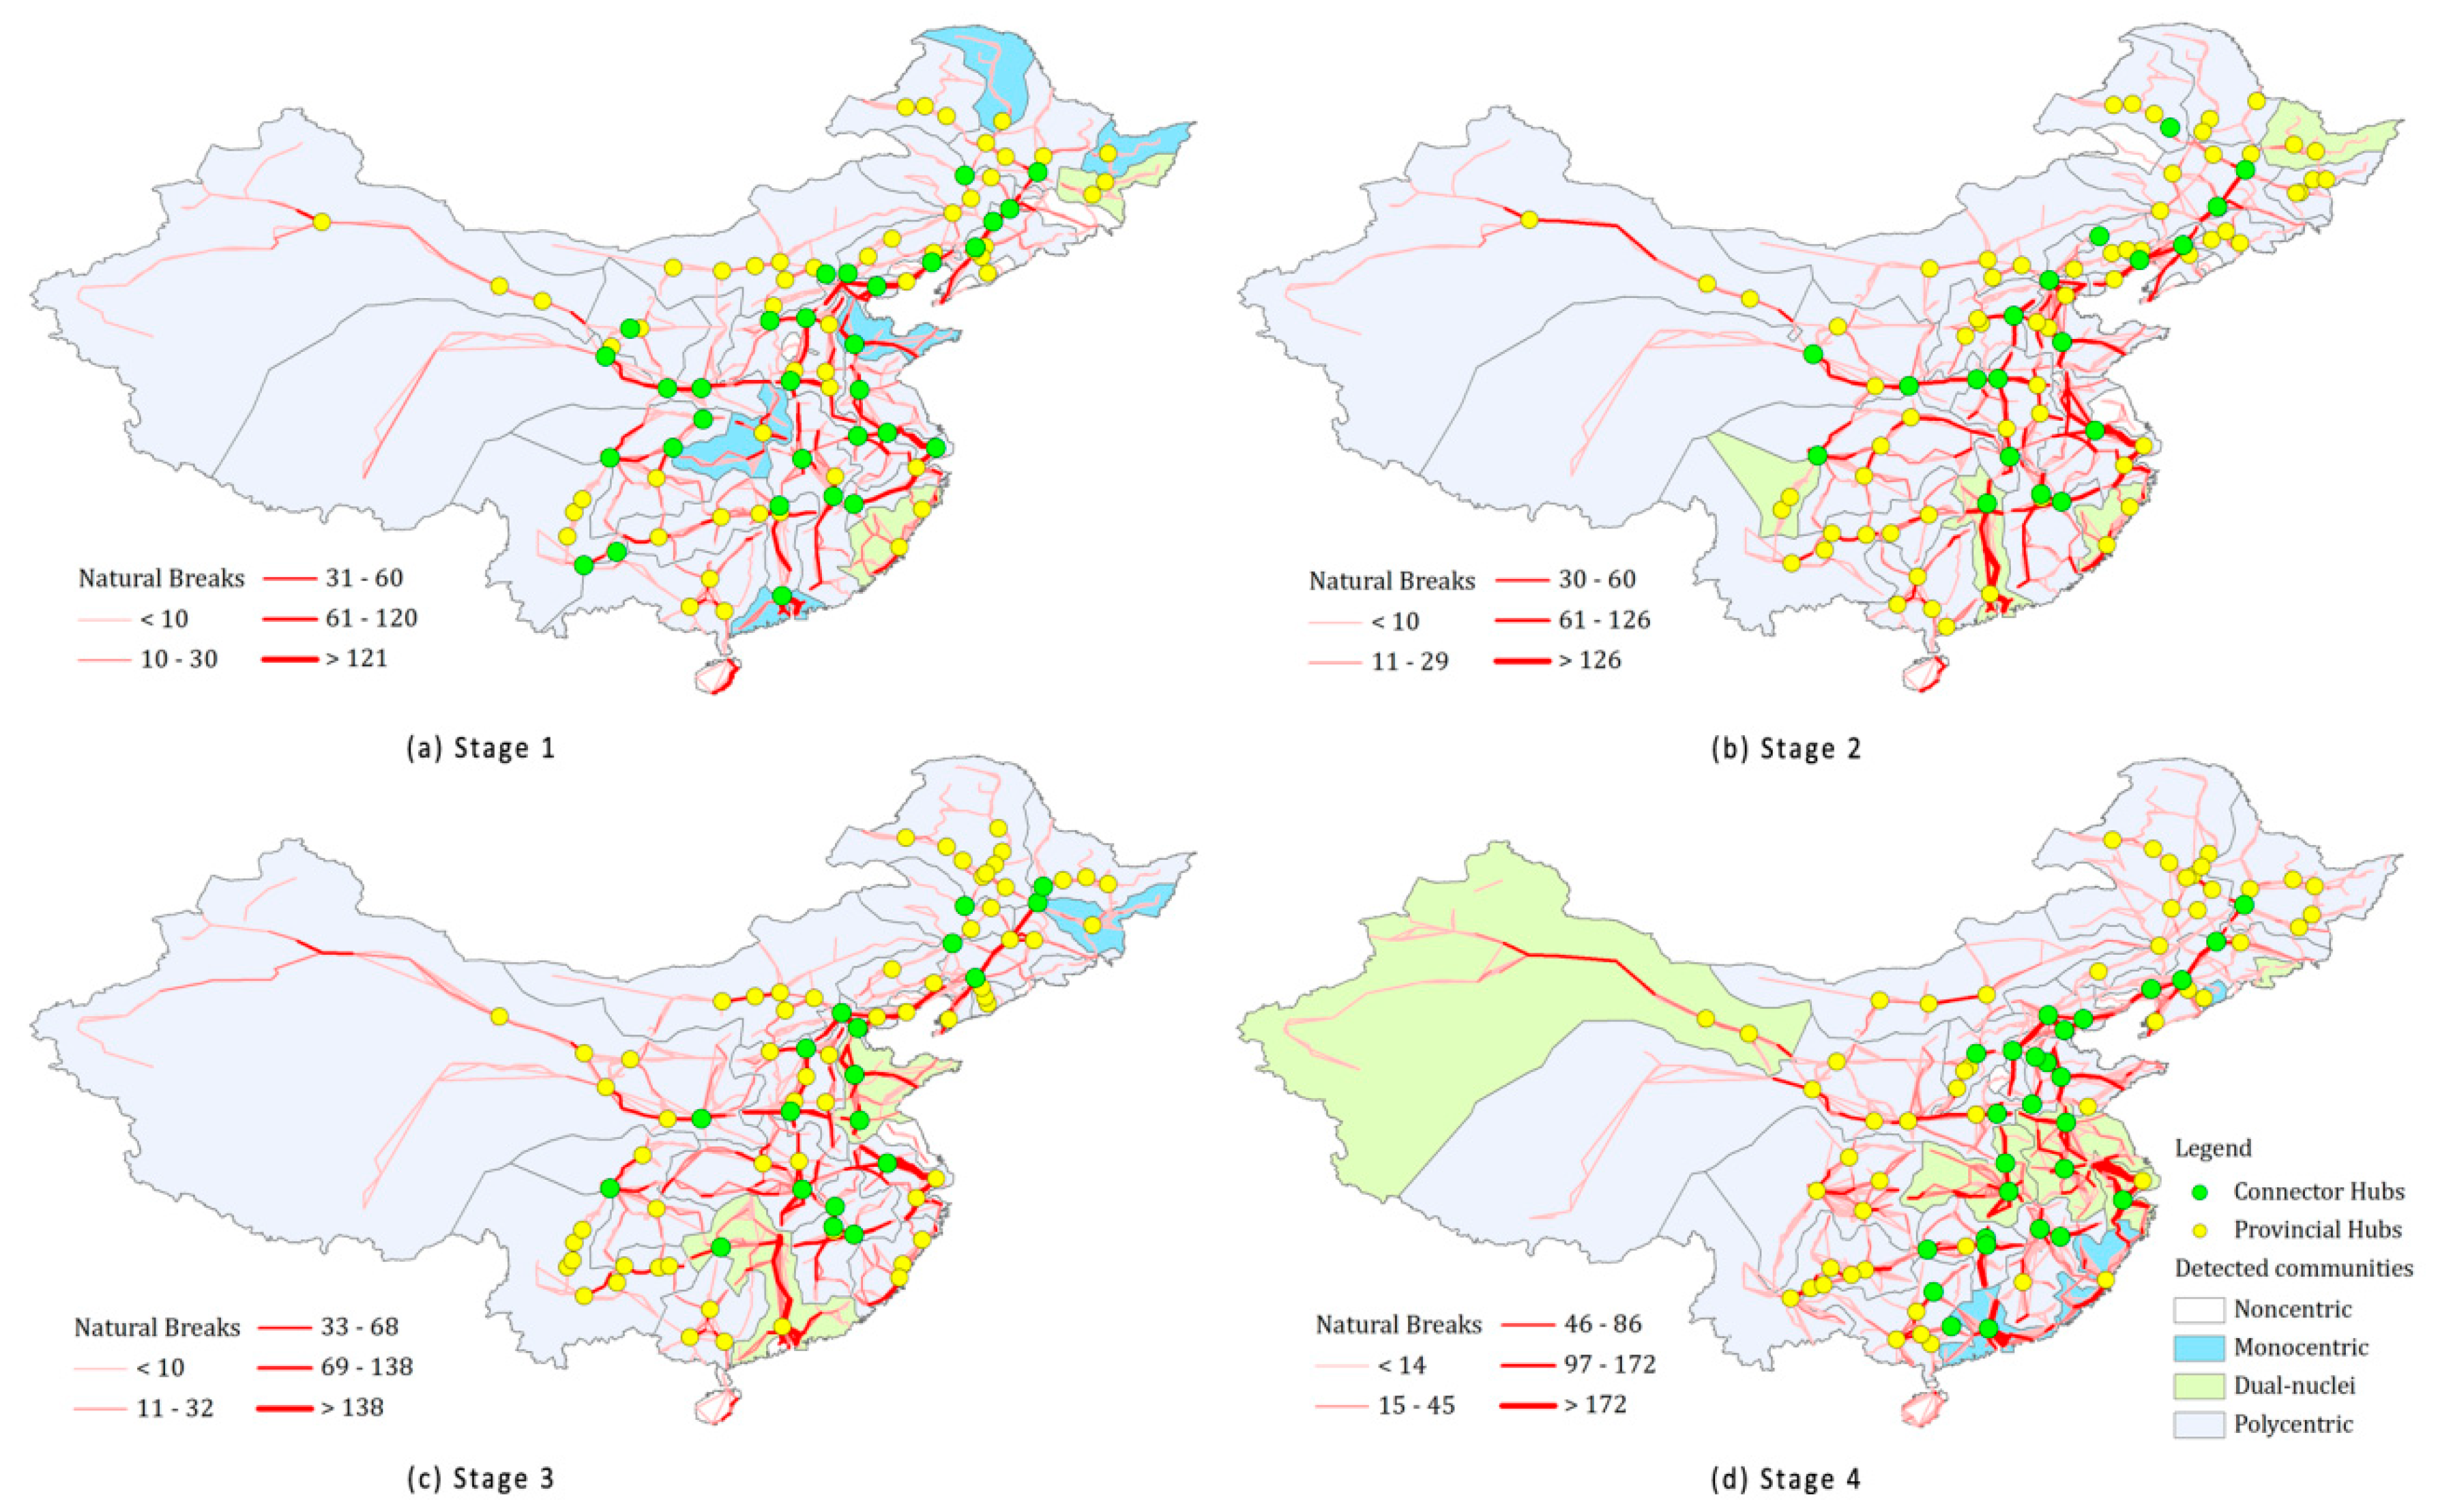
4.3. Analyzing the Influences of Nodes
4.4. Inner Structure of Each Detected Community
5. Conclusions
Author Contributions
Funding
Conflicts of Interest
References
- Bigotte, J.F.; Krass, D.; Antunes, A.P.; Berman, O. Integrated modeling of urban hierarchy and transportation network planning. Transp. Res. Part A Policy Pract. 2010, 44, 506–522. [Google Scholar] [CrossRef]
- Guerrero, D.; Proulhac, L. Freight flows and urban hierarchy. Res. Transp. Bus. Manag. 2014, 11, 105–115. [Google Scholar] [CrossRef]
- Liu, X.; Gong, L.; Gong, Y.; Liu, Y. Revealing travel patterns and city structure with taxi trip data. J. Transp. Geogr. 2015, 43, 78–90. [Google Scholar] [CrossRef]
- Wallace, E.R. Indirect connectivity and hierarchies of urban dominance. Ann. Assoc. Am. Geogr. 2015, 60, 770–785. [Google Scholar]
- Otiso, K.M.; Derudder, B.; Bassens, D.; Devriendt, L.; Witlox, F. Airline connectivity as a measure of the globalization of African cities. Appl. Geogr. 2011, 31, 609–620. [Google Scholar] [CrossRef]
- Wang, R.; Tan, J.X.; Wang, X.; Wang, D.J.; Cai, X. Geographic coarse graining analysis of the railway network of China. Phys. A Stat. Mech. Its Appl. 2008, 387, 5639–5646. [Google Scholar] [CrossRef]
- Shaw, S.-L.; Fang, Z.; Lu, S.; Tao, R. Impacts of high speed rail on railroad network accessibility in China. J. Transp. Geogr. 2014, 40, 112–122. [Google Scholar] [CrossRef]
- Chen, W.; Liu, W.; Ke, W.; Wang, N. Understanding spatial structures and organizational patterns of city networks in China: A highway passenger flow perspective. J. Geogr. Sci. 2018, 28, 477–494. [Google Scholar] [CrossRef]
- Taylor, P.J.; Catalano, G.; Walker, D.R.F. Measurement of the world city network. Urban Stud. 2002, 39, 2367–2376. [Google Scholar] [CrossRef]
- Taylor, P.J.; Walker, D.R.F.; Catalano, G.; Hoyler, M. Diversity and power in the world city network. Cities 2002, 19, 231–241. [Google Scholar] [CrossRef]
- Zhou, Y.; Fang, Z.; Thill, J.C.; Li, Q.; Li, Y. Functionally critical locations in an urban transportation network: Identification and space–time analysis using taxi trajectories. Comput. Environ. Urban Syst. 2015, 52, 34–47. [Google Scholar] [CrossRef]
- Reades, J.; Calabrese, F.; Ratti, C. Eigenplaces: Analysing cities using the space- time structure of the mobile phone network. Environ. Plan. B Plan. Des. 2009, 36, 824–836. [Google Scholar] [CrossRef]
- Yin, J.; Soliman, A.; Yin, D.; Wang, S. Depicting urban boundaries from a mobility network of spatial interactions: A case study of Great Britain with geo-located Twitter data. Int. J. Geogr. Inf. Sci. 2017, 31, 1293–1313. [Google Scholar] [CrossRef]
- Maggioni, M.A.; Nosvelli, M.; Uberti, T.E. Space versus networks in the geography of innovation: A European analysis. Pap. Reg. Sci. 2007, 86, 471–493. [Google Scholar] [CrossRef]
- Matthiessen, C.W.; Schwarz, A.W.; Find, S. World cities of scientific knowledge: Systems, networks and potential dynamics. An analysis based on Bibliometric indicators. Urban Stud. 2010, 47, 1879–1897. [Google Scholar] [CrossRef]
- Guimerã, R.; Amaral, L.A. Cartography of complex networks: Modules and universal roles. J. Stat. Mech. 2005, 2005, P02001. [Google Scholar] [CrossRef] [PubMed]
- Alderson, A.S.; Beckfield, J. Power and position in the world city system. Am. J. Sociol. 2004, 109, 811–851. [Google Scholar] [CrossRef]
- Smith, D.A.; Timberlake, M.F. World city networks and hierarchies 1977–1997. Am. Behav. Sci. 2001, 44, 1656–1678. [Google Scholar] [CrossRef]
- Cao, J.; Liu, X.C.; Wang, Y.; Li, Q. Accessibility impacts of China’s high-speed rail network. J. Transp. Geogr. 2013, 28, 12–21. [Google Scholar] [CrossRef]
- Chen, C. Reshaping Chinese space-economy through high-speed trains: Opportunities and challenges. J. Transp. Geogr. 2012, 22, 312–316. [Google Scholar] [CrossRef]
- Kim, K.S. High-speed rail developments and spatial restructuring: A case study of the Capital region in South Korea. Cities 2000, 17, 251–262. [Google Scholar] [CrossRef]
- Yang, H.; Zhang, A. Effects of high-speed rail and air transport competition on prices, profits and welfare. Transp. Res. B 2012, 46, 1322–1333. [Google Scholar] [CrossRef]
- Zhang, Q.; Yang, H.; Wang, Q. Impact of high-speed rail on China’s Big Three airlines. Transp. Res. A Policy Pract. 2017, 98, 77–85. [Google Scholar] [CrossRef]
- Gutiérrez, J. Location, economic potential and daily accessibility: An analysis of the accessibility impact of the high-speed line Madrid-Barcelona-French border. J. Transp. Geogr. 2001, 9, 229–242. [Google Scholar] [CrossRef]
- Coto-Millán, P.; Inglada, V.; Rey, B. Effects of network economies in high-speed rail: The Spanish case. Ann. Reg. Sci. 2007, 41, 911–925. [Google Scholar] [CrossRef]
- Ortega, E.; López, E.; Monzón, A. Territorial cohesion impacts of high-speed rail at different planning levels. J. Transp. Geogr. 2012, 24, 130–141. [Google Scholar] [CrossRef]
- Castells, M. The Rise of the Network Society; Blackwetl Publishers: Cambridge, MA, USA, 1996. [Google Scholar]
- Wang, J.; Mo, H.; Wang, F.; Jin, F. Exploring the network structure and nodal centrality of China's air transport network: A complex network approach. J. Transp. Geogr. 2011, 19, 712–721. [Google Scholar] [CrossRef]
- Liu, X.; Derudder, B.; Taylor, P. Mapping the evolution of hierarchical and regional tendencies in the world city network, 2000–2010. Comput. Environ. Urban Syst. 2014, 43, 51–66. [Google Scholar] [CrossRef]
- Huang, Y.; Lu, S.; Yang, X.; Zhao, Z. Exploring railway network dynamics in China from 2008 to 2017. ISPRS Int. J. Geo-Inf. 2018, 7, 320. [Google Scholar] [CrossRef]
- Whebell, C.F.J. Corridors: A theory of urban systems. Ann. Assn. Am. Geogr. 2015, 59, 1–26. [Google Scholar] [CrossRef]
- Taylor, P.J.; Hoyler, M.; Verbruggen, R. External urban relational process: Introducing central flow theory to complement central place theory. Urban Stud. 2010, 47, 2803–2818. [Google Scholar] [CrossRef]
- Castells, M. Globalisation, networking, urbanisation: Reflections on the spatial dynamics of the information age. Urban Stud. 2010, 47, 2737–2745. [Google Scholar] [CrossRef]
- Garcia-López, M.Á.; Hémet, C.; Viladecans-Marsal, E. Next train to the polycentric city: The effect of railroads on subcenter formation. Reg. Sci. Urban Econ. 2017, 67, 50–63. [Google Scholar] [CrossRef]
- Clauset, A.; Newman, M.E.J.; Moore, C. Finding community structure in very large networks. Phys. Rev. E 2004, 70, 066111. [Google Scholar] [CrossRef] [PubMed]
- Girvan, M.; Newman, M.E.J. Community structure in social and biological networks. Proc. Natl. Acad. Sci. USA 2002, 99, 7821–7826. [Google Scholar] [CrossRef] [PubMed]
- Pons, P.; Latapy, M. Computing communities in large networks using random walks. J. Graph Algorithms Appl. 2006, 10, 191–218. [Google Scholar] [CrossRef]
- Blondel, V.D.; Guillaume, J.L.; Lambiotte, R.; Lefebvre, E. Fast unfolding of communities in large networks. J. Stat. Mech. Theory Exp. 2008, 2008, P10008. [Google Scholar] [CrossRef]
- Raghavan, U.N.; Albert, R.; Kumara, S. Near linear time algorithm to detect community structures in large-scale networks. Phys. Rev. E 2007, 76, 036106. [Google Scholar] [CrossRef] [PubMed]
- Xie, J.; Szymanski, B.K.; Liu, X. SLPA: Uncovering overlapping communities in social networks via a speaker-listener interaction dynamic process. In Proceedings of the 11th International Conference on Data Mining Workshops, Vancouver, BC, Canada, 11 December 2011. [Google Scholar]
- Rosvall, M.; Bergstrom, C.T. Maps of random walks on complex networks reveal community structure. Proc. Natl. Acad. Sci. USA 2008, 105, 1118–1123. [Google Scholar] [CrossRef] [PubMed]
- Sun, L.; Axhausen, K.W.; Lee, D.H.; Huang, X. Understanding metropolitan patterns of daily encounter. Proc. Natl. Acad. Sci. USA 2013, 110, 13774–13779. [Google Scholar] [CrossRef] [PubMed]
- Zheng, J.; Gong, J.; Li, R.; Hu, K.; Wu, H.; Yang, S. Community evolution analysis based on co-author network: A case study of academic communities of the journal of “Annals of the Association of American Geographers”. Scientometrics 2017, 113, 845–865. [Google Scholar] [CrossRef]
- Samory, M.; Cappelleri, V.M.; Peserico, E. Quotes reveal community structure and interaction dynamics. In Proceedings of the ACM Conference on Computer Supported Cooperative Work and Social Computing, Portland, OR, USA, 25 February–1 March 2017; pp. 322–335. [Google Scholar]
- Han, Y.; Chen, S.; Feng, Z. Empirical studies on community structure for networked web services. Int. J. Comput. Sci. Issues 2013, 10, 528–534. [Google Scholar]
- Dorfman, M.J.; Medanic, J. Scheduling trains on a railway network using a discrete event model of railway traffic. Transp. Res. B 2004, 38, 81–98. [Google Scholar] [CrossRef]
- Kurant, M.; Thiran, P. Extraction and analysis of traffic and topologies of transportation networks. Phys. Rev. E Stat. Nonlinear Soft Matter Phys. 2006, 74, 036114. [Google Scholar] [CrossRef] [PubMed]
- Sen, P.; Dasgupta, S.; Chatterjee, A.; Sreeram, P.A.; Mukherjee, G.; Manna, S.S. Small-world properties of the Indian railway network. Phys. Rev. E Stat. Nonlinear Soft Matter Phys. 2003, 67, 036106. [Google Scholar] [CrossRef] [PubMed]
- Tobler, W. On the first law of geography: A reply. Ann. Assoc. Am. Geogr. 2004, 94, 304–310. [Google Scholar] [CrossRef]
- Lu, F.; Liu, K.; Duan, Y.; Cheng, S.; Du, F. Modeling the heterogeneous traffic correlations in urban road systems using traffic-enhanced community detection approach. Phys. A Stat. Mech. Its Appl. 2018, 501, 227–237. [Google Scholar] [CrossRef]
- Guerrero, M.; Montoya, F.G.; Baños, R.; Alcayde, A.; Gil, C. Community detection in national-scale high voltage transmission networks using genetic algorithms. Adv. Eng. Inform. 2018, 38, 232–241. [Google Scholar] [CrossRef]
- Sun, Y.; Mburu, L.; Wang, S. Analysis of community properties and node properties to understand the structure of the bus transport network. Phys. A Stat. Mech. Its Appl. 2016, 450, 523–530. [Google Scholar] [CrossRef]
- Rives, A.W.; Galitski, T. Modular organization of cellular networks. Proc. Natl. Acad. Sci. USA 2003, 100, 1128–1133. [Google Scholar] [CrossRef] [PubMed]
- Han, J.D.; Bertin, N.; Hao, T.; Goldberg, D.S.; Berriz, G.F.; Zhang, L.V.; Vidal, M. Evidence for dynamically organized modularity in the yeast protein-protein interaction network. Nature 2004, 430, 88–93. [Google Scholar] [CrossRef] [PubMed]
- National Development and Reform Commission (NDRC). People’s Republic of China. National New Urbanization Planning (2014–2020). Available online: http://ghs.ndrc.gov.cn/zttp/xxczhjs/ghzc/201605 /t20160505_800839.html (accessed on 22 June 2018).
- Romein, A. Polycentric structures in Latin American metropolitan areas: Identifying employment sub-centres. Reg. Stud. 2014, 48, 1954–1971. [Google Scholar]


| Stage | Time Period | HSR Lines Construction | Additional Policy Changes |
|---|---|---|---|
| 1 | Before August 2008 | No HSR service | |
| 2 | Between August 2008 and July 2011 | Preliminary construction | Rearrangement of timetable |
| 3 | Between July 2011 and January 2013 | Network skeleton | Speed and price reduction |
| 4 | Between January 2013 and July 2017 | Deep intensification | Rearrangement of timetable |
| Station | Arrival Time | Departure Time | Stop Time (min) | Distance from Origin Station (km) | Ticket Fare (Yuan) |
|---|---|---|---|---|---|
| 1. Beijing West | - | 07:05 | - | - | - |
| 2. Baoding East | 07:46 | 07:48 | 2 | 139 | 64 |
| 3. Shijiazhuang | 08:24 | 08:28 | 4 | 281 | 129 |
| 4. Xingtai East | 08:56 | 08:58 | 2 | 403 | 186 |
| 5. Handan East | 09:14 | 09:16 | 2 | 456 | 209 |
| 6. Hebi East | 09:44 | 09:46 | 2 | 562 | 255 |
| 7. Zhengzhou East | 10:19 | 10:26 | 7 | 693 | 309 |
| 8. Longyanglongmen | 11:07 | 11:09 | 2 | 836 | 368 |
| 9. Huashan North | 12:12 | 12:14 | 2 | 1095 | 471 |
| 10. Xi’an North | 12:48 | - | - | 1216 | 516 |
| City Links | Stage 1 | Stage 2 | Stage 3 | Stage 4 |
|---|---|---|---|---|
| Maximum | 202 | 280 | 282 | 368 |
| Average | 7.66 | 8.20 | 8.90 | 11.44 |
| Minimum | 2 | 2 | 2 | 2 |
| Standard deviation | 13.32 | 15.44 | 16.48 | 21.48 |
| Index | Stage 1 | Stage 2 | Stage 3 | Stage 4 |
|---|---|---|---|---|
| Modularity Value | 0.86 | 0.85 | 0.84 | 0.83 |
| Number of Communities | 30 | 29 | 24 | 24 |
| Average distance between communities (km) | 1611.72 | 1574.81 | 1532.26 | 1529.42 |
| Index | z-Score | p-Score | Stage 1 | Stage 2 | Stage 3 | Stage 4 |
|---|---|---|---|---|---|---|
| Provincial Hubs | >2.5 | [0, 0.3] | 53 | 64 | 63 | 53 |
| Connector Hubs | >2.5 | (0.3, 0.75) | 31 | 19 | 19 | 27 |
| Total Hubs | 84 | 83 | 82 | 80 |
| Community Type | No. of Hubs | Stage 1 | Stage 2 | Stage 3 | Stage 4 |
|---|---|---|---|---|---|
| Noncentric | 0 | 6 (20.00%) | 7 (24.14%) | 5 (20.83%) | 4 (16.67%) |
| Monocentric | 1 | 5 (16.67%) | 0 | 1 (4.17%) | 3 (12.50%) |
| Dual-nuclei | 2 | 2 (6.67%) | 4 (13.79%) | 2 (8.33%) | 4 (16.67%) |
| Polycentric | ≥ 3 | 17 (56.67%) | 18 (62.07%) | 16 (66.67%) | 13 (54.17%) |
© 2018 by the authors. Licensee MDPI, Basel, Switzerland. This article is an open access article distributed under the terms and conditions of the Creative Commons Attribution (CC BY) license (http://creativecommons.org/licenses/by/4.0/).
Share and Cite
Lu, S.; Huang, Y.; Zhao, Z.; Yang, X. Exploring the Hierarchical Structure of China’s Railway Network from 2008 to 2017. Sustainability 2018, 10, 3173. https://doi.org/10.3390/su10093173
Lu S, Huang Y, Zhao Z, Yang X. Exploring the Hierarchical Structure of China’s Railway Network from 2008 to 2017. Sustainability. 2018; 10(9):3173. https://doi.org/10.3390/su10093173
Chicago/Turabian StyleLu, Shiwei, Yaping Huang, Zhiyuan Zhao, and Xiping Yang. 2018. "Exploring the Hierarchical Structure of China’s Railway Network from 2008 to 2017" Sustainability 10, no. 9: 3173. https://doi.org/10.3390/su10093173
APA StyleLu, S., Huang, Y., Zhao, Z., & Yang, X. (2018). Exploring the Hierarchical Structure of China’s Railway Network from 2008 to 2017. Sustainability, 10(9), 3173. https://doi.org/10.3390/su10093173