Article

An Assessment of the Implementation of the European Tourism Indicator System for Sustainable Destinations in Italy

1
Department of Economics and Business, University of Cagliari, Via Sant’Ignazio da Laconi, 70, 09123 Cagliari, Italy
2
Department of Business Economics and Law-DiSEADE, University of Milano Bicocca, Via Bicocca degli Arcimboldi, 8, 20126 Milano, Italy
3
Department of Statistics and Quantitative Methods, University of Milano-Bicocca, Via Bicocca degli Arcimboldi, 8, 20126 Milano, Italy
*
Author to whom correspondence should be addressed.
Sustainability 2018, 10(9), 3160; https://doi.org/10.3390/su10093160
Submission received: 21 June 2018 / Revised: 25 August 2018 / Accepted: 27 August 2018 / Published: 4 September 2018

Abstract

:
The European Tourism Indicators System (ETIS) is a product of the European Union (EU) Sustainable Development Strategy, which was formulated with the objectives of promoting economic prosperity, social equity, cohesion, and environmental protection. In this paper, we present an analysis of the results of the implementation of the ETIS during the period 2013–2016, in the Italian tourist destination of South Sardinia. While the implementation of ETIS constitutes a significant advancement in Italy, and more widely in Europe, our findings reveal that an adaptive management approach is necessary for achieving the anticipated objectives and adapting these standardized indicators to different territorial contexts. Difficulties were encountered in both data collection and stakeholders’ involvement in the implementation process. Insufficient knowledge, and familiarity with the complex technical aspects of the indicator toolkit among primary stakeholders, was another constraint associated with its implementation. We believe that the findings of this analysis can provide guidelines and inputs for other European countries and tourist destinations that are currently in the process of implementing the ETIS toolkit or similar methodologies. In particular, the pioneering sustainable tourism performance measurement system (STPMS) can be adapted to meet local needs.

1. Introduction

In recent decades, sustainability has emerged as a primary goal in tourism-related decision making [1]. Stakeholders in the tourism sector, including tourists and host communities, are now considerably more aware of the importance of sustainable development in tourism than they were in the past [2]. Nonetheless, the concept and nature of sustainability remain vague, especially in the absence of their operationalization using tools that enable the planning, management, and monitoring of the impacts of tourism on the target destinations [3,4,5]. Apart from the necessity of formulating quantitative measures for sustainable tourism relating to its social, economic, and environmental dimensions (i.e., indicator systems), a methodology is required for implementing these operational tools. There have been relatively few studies on indicator systems and associated methodologies for their implementation. This study, which was aimed at developing a procedure for operationalizing indicator systems to measure sustainability, seeks to address this gap. In general, the process of selecting an indicator system entails multiple stages. Firstly, a literature review is conducted to analyze potentially suitable indicator systems developed by international organizations. Secondly, in light of the findings of this review, a specific indicator system is selected. Thirdly, individual indicators are chosen and working groups are established to discuss these indicators with tourism stakeholders. Fourth an implementation process is developed at the municipal level. Lastly, the results are presented and discussed in the tourist destination with concerned stakeholders in tourism and related sectors.
We conducted a case study to assess the process of implementing the European Tourism Indicator System (ETIS) for sustainable destinations designed by the European Commission (EC) [6]. The selected case was the project of “Visit South Sardinia” (VSS) destination management organization (DMO) in Italy. This project has been promoted by public sector stakeholders in Southern Sardinia, with the aim of managing and marketing the above destination in collaboration with the private sector and other primary stakeholders in tourism. The project was developed to assess and implement a pioneering sustainable tourism performance measurement system (STPMS) in collaboration with the University of Cagliari, with the subsequent involvement, too, of the University of Milano-Bicocca.
In 2013, VSS became an early adopter of the Global Sustainable Tourism Council (GSTC) criteria and indicators program). The GSTC is an international organization endorsed by the United Nations (UN), the United Nations World Tourism Organization (UNWTO), and the United Nations Environment Programme (UNEP). As the acknowledged global authority in this field, its sustainability standards relating to the travel and tourism industry are definitive. VSS was one of 10 international destinations selected to demonstrate pioneering initiatives, and progress in sustainable management. During 2013 and 2014, it participated in the first pilot phase of implementing the ETIS, the objective of which was to define a comprehensive tourism monitoring system for European destinations, with the objective of maintaining Europe’s standing as “the world’s number one tourist destination” [7]. Whereas implementation of both programs, GSTC and ETIS, in Southern Sardinia demonstrated high levels of sustainability relating to communities and the environment. They also highlighted the need to improve methods of managing and monitoring tourism impacts. Lessons learned from implementing the STPMS were applied in policy making and management by organizations in the public and private sectors. Their enhanced awareness of sustainable development of tourism served as a strategic lever, motivating their decision-making processes. For example, since 1998, Capo Carbonara, which is situated in the municipality of Villasimius on the east coast of the VSS site, has been designated as a marine protected area. In 2018, a new marine protected area, Capo Spartivento, located within the municipality of Domus de Maria, was established on the west coast. Through its recognition by VSS primary stakeholders, STPMS evidently contributed to the development of environmental policies and practices in the destination area.
This paper is organized as follows. Further details on the background of VSS are provided in the Section 2, and a review of the literature on sustainable tourism indicators is presented in the Section 3. The study methods and results are discussed in the Section 4 and Section 5, respectively, and conclusions are offered in the Section 6 of the paper.

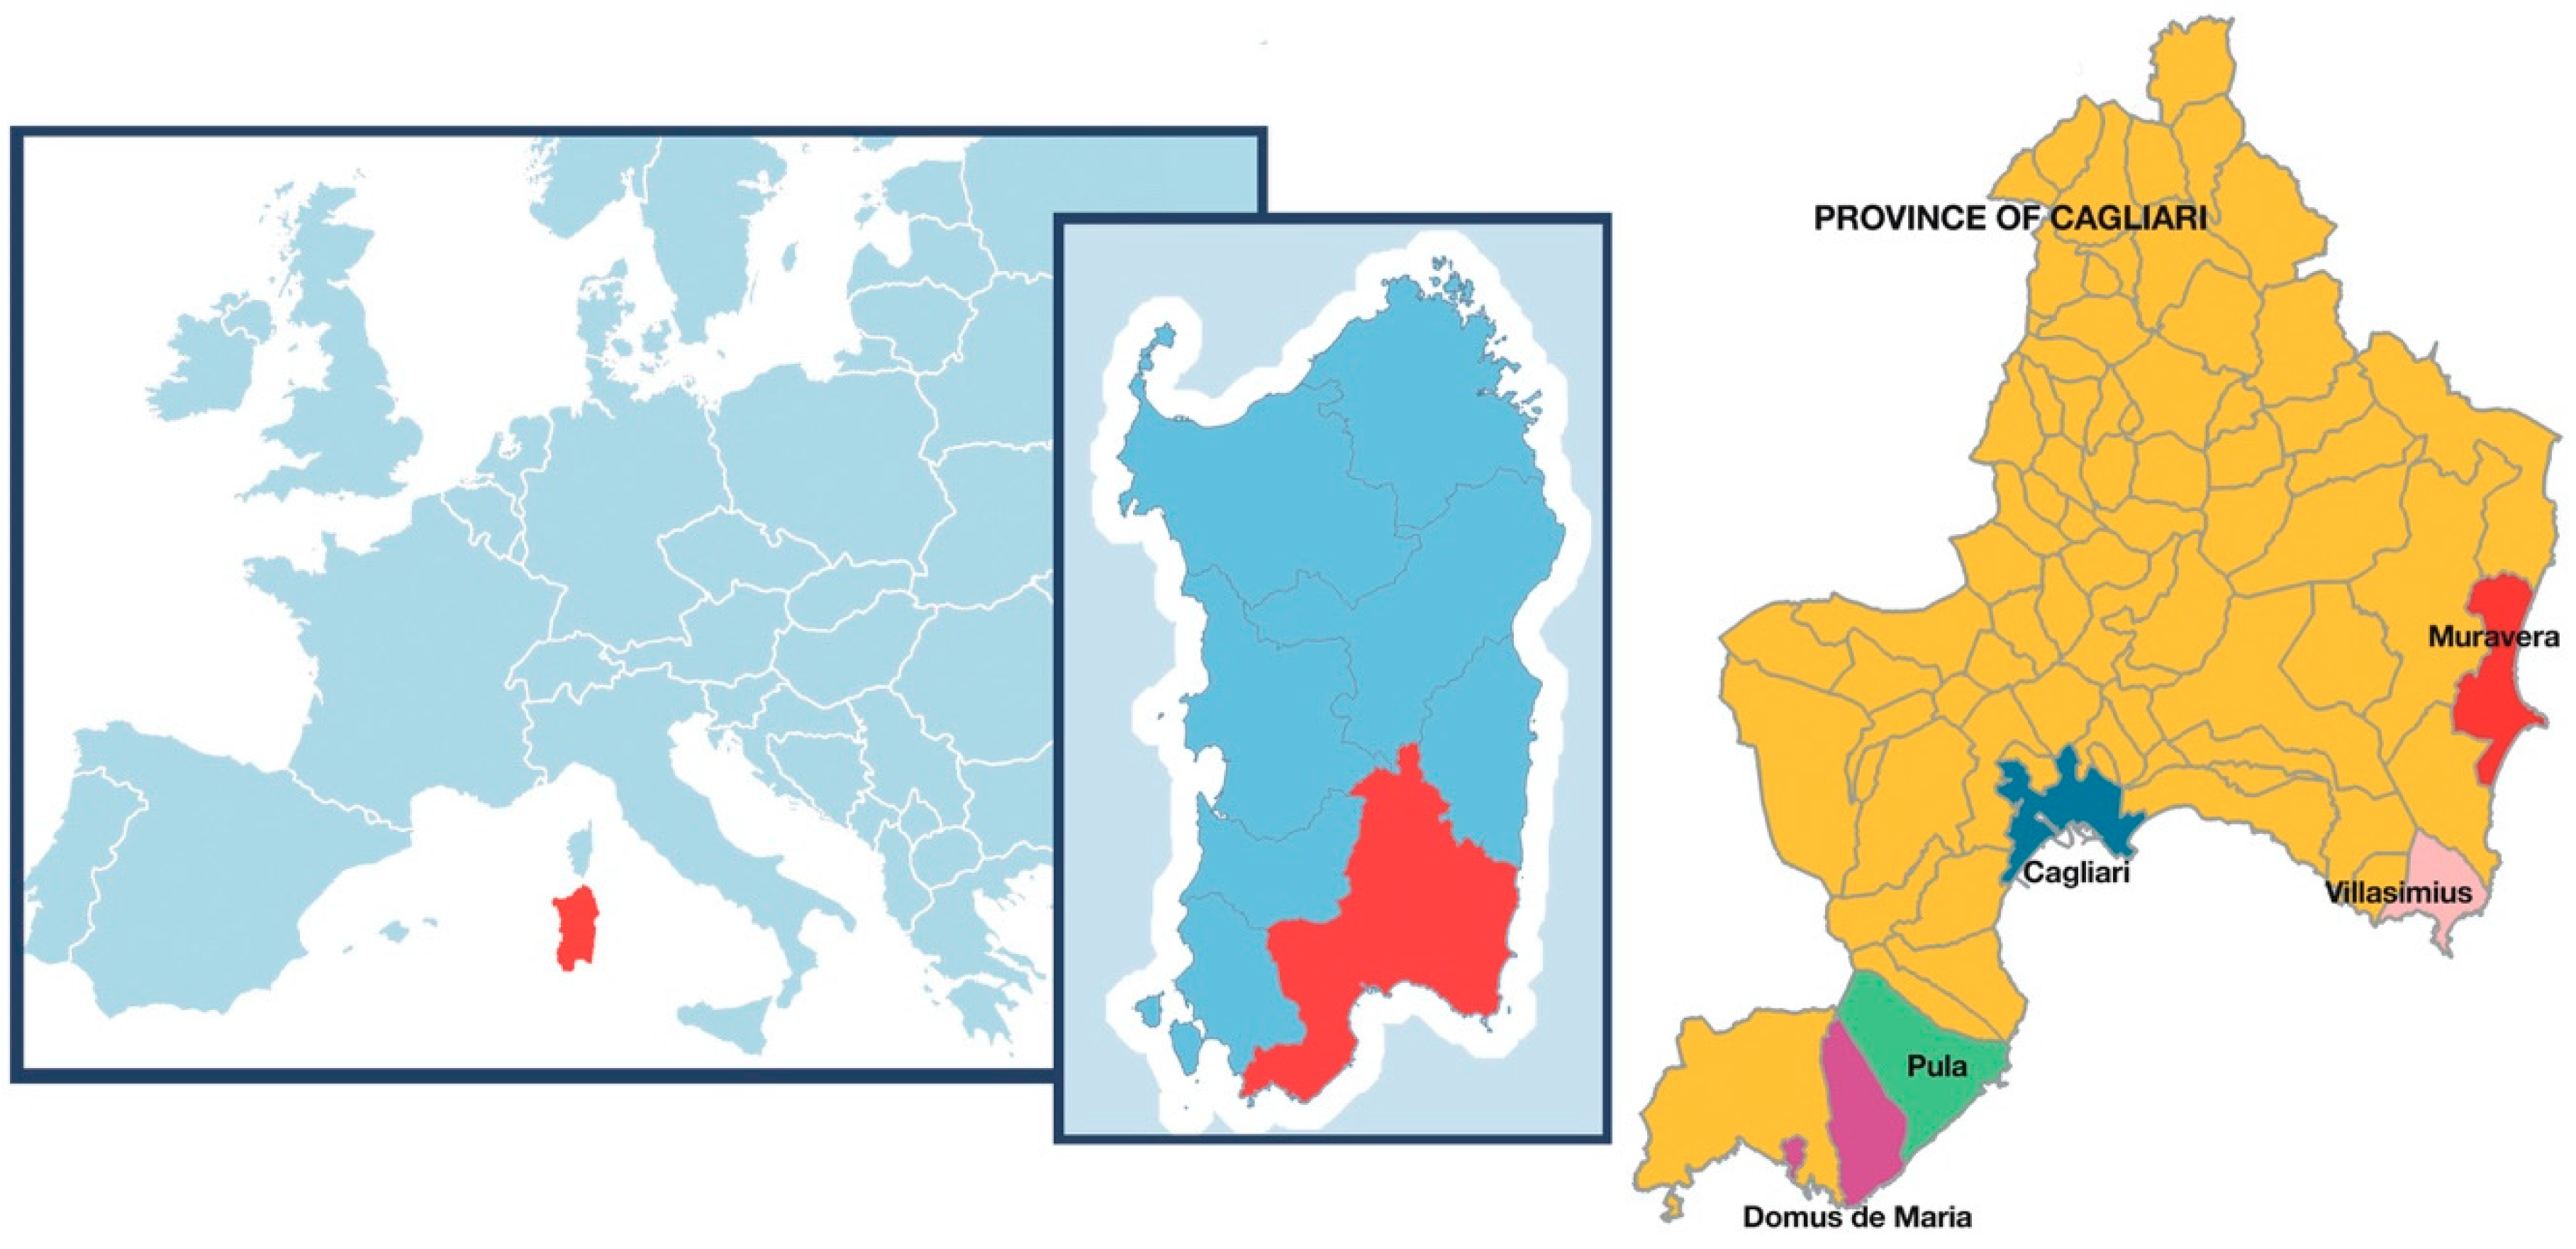
2. Background on the Case Study Destination

The case study examined in this paper is the VSS project, under which the Gulf of Angels destination in Southern Sardinia, including the city of Cagliari, Sardinia’s capital, is managed (see Figure 1). The project also encompasses four coastal municipalities, while private sector interests are represented by four consortia.
The island of Sardinia is a well-known Mediterranean tourist destination that receives more than 3,100,000 tourists annually, with a recorded figure in 2017 of 14,386,000 tourist nights and an average length of stay of 4.59 nights [8]. The island’s official accommodation comprises a total of 212,751 beds. In 2017, Cagliari Province received 758,487 tourists, and figures for tourist nights and the average length of stay were 3,308,011 and 4.36 nights, respectively. The total number of beds available for tourists during this year was 43,717. The Sistema Informativo di Raccolta ed Elaborazione Dati (SIRED) [8] of the Region of Sardinia reported that the five municipalities included in the VSS project received a total of 572,372 tourists in 2017, and recorded 2,453,641 tourist nights and an average length of stay of 4.28 nights.
VSS is actively engaged in sustainable tourism initiatives, and its progress over time can be tracked using internationally recognized standards. In the spring and summer of 2013, VSS was included in the GSTC international program for assessing sustainable tourism. An on-site evaluation was conducted by a third-party organization, Sustainable Travel International. The assessment was based on 40 criteria and 81 indicators related to the four pillars of tourism sustainability: (1) Destination management, (2) social and economic benefits, (3) cultural heritage, and (4) environmental protection.
Following its launch in early 2013, VSS also took up the challenge of implementing the ETIS for sustainable destinations [6]. Accordingly, VSS participated in the first pilot phase of ETIS implementation and remained involved in the initiative from 2013 to 2016. The initial ETIS pilot project implemented by VSS in 2013 included 27 core and 40 optional indicators relating to four domains: (1) Destination management, (2) economic value, (3) social and cultural impact, and (4) environmental impact. In 2016, based on the findings of the two pilot phases (in 2013 and 2014) in destinations across Europe, the ETIS was revised, with inputs provided by the ETIS pool of experts (PoE) [9]. The principal difference between the ETIS and the GSTC program is that the former monitors ongoing developments relating to sustainability, whereas the latter measures the current status of sustainable tourism management.
In 2016, VSS was awarded the European Sustainable Destination prize associated with the first joint ETIS and Accessible Tourism Awards disbursed by the EC. This prize was awarded to the VSS project in recognition of its effective combination of UN and EU indicators of sustainable tourism in destination management and monitoring resulting from its involvement in the GSTC assessment and in the ETIS pilot phase.

3. Literature Review

In recent decades, the literature on sustainable tourism has largely focused on: Clarifying the evolving meaning of sustainability in the context of tourism; identifying the methods and tools deemed valid for measuring sustainability; verifying the models proposed; and scrutinizing the indicators whose implementation has progressively advanced at international, national, regional, and local levels. A brief overview of the sustainability literature relating to the purpose of this study is presented below.
According to Reference [10] and other authors, key issues in the interpretation of sustainable development are the role of economic growth in promoting human well-being, the impacts of human population growth, the existence of environmental limits to growth, the substitutability of natural resources, the role of new technologies, the degree to which a systems (ecosystems) perspective should be adopted, and the importance of maintaining the functional integrity of ecosystems [11,12,13]. Some studies focusing on the sustainability of the tourism sector have highlighted initiatives aimed at satisfying current needs without compromising the ability of future generations to meet their own needs [14,15]. From this perspective, balancing economic growth, conservation of environmental resources, and development is critical at local destination levels [16,17,18,19,20,21,22,23,24,25,26]. However, several examples of tourism destination management, discussed in the literature, have fallen short of adhering to the principles of sustainability [27,28,29]. The following topics are highlighted in this literature: The relationship between residents and tourists [30]; the environmental implications of tourism; the development and preservation of the culture, inheritance, and artistic values of local communities [31,32]; support for the local economy; engagement of local communities in discussions between stakeholders and residents; and managing tourism development through the creation of clear and transparent policies for involving all local players, increasing tourism education and training, and improving the services offered [33,34,35].
Following the above clarification of the meaning of sustainability in the context of the tourism sector, determining whether sustainability can be measured at the local systemic level in the destination becomes an important task. Measurement of sustainability first requires the identification of its dimensions, followed by the determination of tools capable of measuring these dimensions [36]. According to Reference [37], three integrated dimensions, namely, economic growth, environmental sustainability, and social equity constitute the basis for the measurement process [38].
Several sets of indicators have been proposed for measuring sustainability in relation to tourism [39,40,41], with the aim of operationalizing “sustainable tourism” and facilitating its implementation [42,43,44,45,46]. Most indicator sets refer to criteria such as involvement of local communities, sustainable use of resources, tourism planning, and promoting information and research [36,47].
Indicators are considered the best tools for controlling and measuring progress toward sustainable tourism [14,48,49,50,51,52]. In one study, indicators were defined as the biophysical, social, managerial, or other conditions that concern people in a given situation [3]. Conversely, Reference [3] suggested that indicators are helpful for measuring and framing management objectives in quantitative terms and for specifying appropriate levels or acceptable limits for tourism’s impacts. According to Reference [53], a longstanding objective has been to develop quantitative indicators of sustainability for the tourism sector [14,16]. The most difficult aspect entails establishing environmental accounting measures, so this remains a research priority. The measurement and management of all types of tourism impacts are growing in importance.
In addition to discussions of indicator sets, there have also been some attempts to measure the interconnections among different dimensions of sustainability and to conduct cross-analyses, as revealed in the literature. One such attempt is the “prism of sustainability” developed in [53] as a holistic framework entailing four interrelated dimensions of sustainability: Environmental, economic, sociocultural, and institutional. This holistic model has been adopted by several researchers as its indicators are suitable for dynamic modeling. Consequently, it is suitable for assessing the sustainability of different policies and strategies. The use of indicator sets for controlling and measuring the multiple dimensions of sustainability within the tourism sector has become widespread, although not all researchers agree on their importance and effectiveness [4,53,54,55].
In 2003, the EC adopted guidelines that focused entirely on sustainable development in the field of tourism, titled “Basic orientations for the sustainability of European tourism.” Three years after its inception in 2004, the Tourism Sustainability Group adopted the “Action for More Sustainable European Tourism, 2007.” In the same year, the EC approved an “Agenda for a sustainable and competitive European tourism.” In 2010, the EC defined four strategic priorities: (1) Encouraging competitiveness within the tourism sector; (2) promoting sustainable, high-quality tourism; (3) strengthening Europe’s image as a tourism destination; and (4) improving EU financial policies and instruments.
The EC’s continued focus on the sustainability issue culminated, in 2013, in the formulation of a European system of indicators [6] for the EU’s sustainable development strategy, based on the objectives of achieving economic prosperity, social equity, cohesion, and environmental protection. Twenty-one actions were derived from the four priorities, including the ETIS for sustainable tourism. The ETIS was launched in Brussels on 22 February 2013. It was designed, on behalf of the EC, by a consortium of organizations led by the University of Surrey, and tested in a selected number of European destinations, including Saint Tropez in France, Florence in Italy, Alqueva in Portugal, and Brasov in Romania. Two pilot phases, implemented across Europe in 2013 and 2014, led to the updating of the ETIS and related tools in 2016. As noted by [56], the ETIS “is designed as a locally owned and led process for monitoring, managing, and enhancing the sustainability of a tourism destination,” and “it has been developed as a result of lessons learned from previously existing indicator system initiatives.” The ETIS provides all of the specific tools necessary for developing local-level tourism impact monitoring mechanisms at the tourist destination.
Seven steps are required for facilitating the implementation of the ETIS toolkit, which is aligned with the most commonly applied international standards, such as those of the UNWTO and GSTC. The first step of raising awareness is particularly important for advancing understanding of sustainability among stakeholders. The second step defines and creates a profile of the destination. In the third step, a working group comprising stakeholders is formed, which plays a fundamental role in tourism destination management. The fourth step entails assigning roles and responsibilities within the working group during its consultations. Data collection and analysis are key aspects constituting the fifth and sixth steps of the ETIS. The final step entails the formulation of an action plan and strategic management for long-term improvement.
There are few applications of the ETIS reported in the tourism literature. Examples include “ATL del Cuneese” in Italy [57]; Malta [58]; and Brasov County in the Romanian Carpathians [59]. However, only the Brasov case study provides details relating to the challenges and difficulties encountered in the implementation of the ETIS in a tourist destination. The development of an innovative decision-making support system for tourist destination management based on the ETIS has been proposed [60]. In this context, the present case study of VSS, considered as a successful model of sustainably developing an island destination in the absence of conflict between tourists and residents [61], is in line with recent studies focusing on municipalities [5].

4. Materials and Methods

The VSS project is the only example entailing the testing of two international systems relating to the impacts of tourism, namely the GSTC program and the ETIS in the Mediterranean region. Several other destinations in Italy, such as Cuneo Alps, Abano Terme, and Terrae Anio Iubensanae, and within Europe, such as Broceliande (France), the province of Barcelona (Spain), Podgorica (Montenegro), Ljubljana (Slovenia), Birmingham (UK), Dark Sky Alqueva (Portugal), and Uzundure (Turkey), have been involved in the ETIS testing phases. However, none of these destinations participated in the GSTC Early Adopter Program.
In Sardinia the pioneering STPMS was the outcome of a step-wise procedure, coordinated by the University of Cagliari. First, the primary stakeholders group (PSG), comprising key stakeholders was established and a VSS sustainability team (ST) was subsequently formed. The next step comprised tourism data collection, followed by an assessment of indicators through PSG discussions. A software survey platform (SSP) was used to store tourism data. The final three steps entailed quantifying the selected indicators, analyzing the results, and presenting and discussing lessons learned with the PSG.
The VSS project commenced in February 2013 and continues to be operational. The main project partners include the University of Cagliari, which coordinates activities in the destination areas and is the project’s liaison; the municipality of Cagliari, which leads the project; the municipalities of Domus de Maria, Muravera, Pula, and Villasimius; the Area Marina Protetta Capo Carbonara; the consortia of tourism enterprises, namely Consorzio Costa Sud, Consorzio Turistico di Villasimius, Azienda di Promozione Turistica, Muravera, and Consorzio Costiera Sulcitana; and the Regione Autonoma della Sardegna, which supervises the project.
The PSG that was initially formed comprised mayors and tourism councilors from the five municipalities. During the second phase, it was expanded to include the presidents of the tourism enterprises consortia. One of the objectives of the VSS project was to combine public and private sector representatives, which proved to be a strategic lever for the initiative’s success. Moreover, the PSG was responsible for relating to the university coordinator and for implementing the STPMS. In the third phase, the group was further expanded to include key representatives of public organizations (e.g., the port authority and labor agency), associations, single enterprises, media representatives, and other representatives from the private sector. Most members of the expanded PSG owned or had access to data that was relevant for developing the STPMS.
The ST, coordinated by research assistants under the supervision of the University of Cagliari, was established following the PSG’s creation. Initially comprising four student interns from a professional graduate program in tourism, its composition subsequently changed with the addition of 20 student trainees from a university undergraduate program in tourism. The two primary responsibilities of the ST are to identify all tourism stakeholders possessing relevant data in the destination area and to collect these data through ETIS surveys. The PSG was involved in the implementation of the STPMS and in the assessment and discussions on which indicators should be included for each of the four aspects of sustainability.
In our project, data were collected through face-to-face interviews and self-completed questionnaires. LimeSurvey software version 2.55.2 (LimeSurvey GmbH, Hamburg, Germany) was used to set up an SPSS v. 25 for the data analysis.
By the end of 2014, the VSS project had implemented the entire ETIS toolkit. The principal aim was to evaluate all of the indicators suggested in the EC toolkit, published in 2013. The 27 core indicators and 40 optional indicators (the complete list of indicators is listed in Table A1 of Appendix A) were aggregated into the following four categories: (1) Destination management, (2) social and cultural impacts, (3) economic value, and (4) environmental impacts.
During the first phase of the investigation, to prevent duplication of efforts, the ST explored the main available statistical information sources providing relevant data on ETIS indicators at the local level in Italy. Table 1 shows the results of this first phase. The data sources that the ST decided to use to calculate all of the indicators in VSS are listed in this table, which indicates a lack of statistical data sources, especially at the municipal level. To bridge this gap, we conducted four separate surveys covering the principal stakeholders of VSS: Residents, tourists and daily visitors, enterprises, and local public actors. We decided to employ the questionnaires contained in the ETIS toolkit produced in 2013 [62].
The ETIS questionnaire, which was administered to a sample comprising 590 residents from the five municipalities included in the VSS project, was aimed at evaluating the indicators for measuring the impacts of tourism on the local community. Random sampling was performed to recruit representative participants from the resident population. Respondents were selected through random quota sampling according to sex and age as well as the population size of the municipality. We set the sample size at 1% of the target population that we evaluated based on information furnished by the Italian Statistics Institute (ISTAT) in 2014. Questionnaires were completed through face-to-face interactions conducted in public areas (e.g., on the street and at public events) from May to September 2015.
A survey of tourists and same-day visitors was also conducted from May to September 2015. Again, the questionnaire was administered directly, face-to-face, among Italian and foreign tourists who were present in the VSS territory. In determining the survey sample, we applied time location sampling (TLS) in light of the particular characteristics of the population. The specific TLS for tourism-focused surveys entailed a two-stage stratified sampling design with unequal selection probabilities for first-stage units and constant selection probabilities for second-stage units. The first-stage units comprised a combination of places, days, and hours (i.e., venue-day-time units). The second-stage units comprised (non-resident) Italian and foreign tourists visiting the VSS municipalities. Our aim was to collect relevant direct information for the entire period spent in the tourist destination. Following the approach, described in Reference [63], and using the ISTAT official data on tourist arrivals, we selected a random sample characterized by unequal probabilities (proportional to the estimated tourism flows for each combined unit comprising the month, place, and tourist typology). The final dataset comprised 514 units.
The survey of enterprises was conducted from July 2015 to February 2016, using the computer-assisted web interviewing technique. Given the low response rate for this survey, companies were solicited through emails and direct phone calls. Ultimately, even though a large number of enterprises visited the website on which the questionnaire was posted, only 25 of them partially or fully answered the questionnaire.
In addition, the ETIS toolkit contained a questionnaire tailored for local administrators and aimed at gathering information concerning the 10 indicators listed in Table 1. Questionnaires were provided to the boards of the five municipalities involved in VSS: Cagliari, Villasimius, Pula, Domus De Maria, and Muravera.

5. Results

In light of our objective of assessing the implementation of the ETIS, in this section we identify the main problems that we encountered during the phase of evaluating the indicators. In some cases, missing data affected the reliability of the indicators and in others, it was difficult to contact the respondents who had not completed the entire questionnaire. Below, we elaborate on our experiences in collecting the data that we used for calculating the indicators.

5.1. Official Relevant Statistics for the Evaluation of ETIS Indicators

ISTAT, which conducts two monthly surveys on tourist accommodation capacity and occupancy, respectively, is the official and principal source of tourism data in Italy. Data on numbers of tourists who stay in registered accommodation, obtained from this source, were used to calculate the following four indicators in the system: Number of tourist nights per month (B.1.1); occupancy rate in commercial accommodation per month and the average for the year (B.2.2.), number of beds available in commercial visitor accommodation per 100 residents (C.1.1.2), and the average length of stay of tourists (nights) in commercial accommodation per month (B.2.1). In addition, access to databases created and managed by the Italian Institute for Environmental Protection and Research (the Italian Institute for Environmental Protection and Research is part of the national system for environmental protection network; comporising of 21 territorial environmental protection agencies established in accordance with regional laws), enabled the calculation of the following indicators: Waste volume produced in the destination (D.3.1), level of contamination per 100 mL (fecal coliforms, campylobacter (D.9.1), and number of days beach/shore closed due to contamination (D.9.1.1).) Because the separation of different types of waste is mandatory in Italy, it was possible to estimate an optional indicator: Percentage of tourism enterprises separating different types of waste (D.3.1.1). Accessibility to official data ensured that the information obtained for these indicators was complete, reliable, and valid for the analysis.
Table 2 shows the values of the eight indicators that we estimated for the year 2015. These values clearly reveal the strengths of the DMO in terms of sustainability. This DMO has one of the highest values for the tourism dimension in Italy (about 174 miles of tourist nights per month, and an occupancy rate of 50% of the available beds, that is, 15.1 per 100 residents’ beds in the area for commercial accommodation), and the high quality of the surrounding sea is remarkable.

5.2. Survey of Residents

The face-to-face modality of survey administration that we selected for the residents in the DMO proved to be highly effective. The number of surveyed residents corresponded to the preset sample size and respondents answered all of the questions. The data in the collected questionnaires enabled us to calculate the following ETIS indicators: Percentage of residents satisfied with their involvement and their influence in the planning and development of tourism (A.1.1.1), percentage of residents who have positive views on the impacts of tourism on destination identity (C.4.1.1), and percentage of residents who are satisfied with tourism in the destination per season (C.1.1.1). Given the comprehensiveness of the information obtained through the residents’ survey, the calculated values of these indicators, which were assessed in the analysis, were considered reliable and valid. Table 3 shows the values of the indicators estimated using data collected through the residents’ survey. The results indicate that seasonality affected the satisfaction level relating to tourism among residents in VSS. Specifically, we found that respondents were highly satisfied in the peak season but were highly dissatisfied in the off-season. Moreover, although most residents felt that tourism helps to strengthen the distinctiveness of the VSS destination, and to enhance its local identity, culture, and heritage, they felt that their involvement in tourism planning and development was minimal.

5.3. Survey of Tourists and Same-Day Visitors

We administered the questionnaire to tourists and same-day visitors, applying the face-to-face modality, and did not experience any particular difficulties in collecting the preset number of questionnaires. Nonetheless, contrasting with respondents in the residents’ survey, some of the respondents in this survey did not answer all the questions. Table 4 shows the indicators that we calculated using the responses obtained from surveyed tourists and daily visitors and the percentage of missing data affecting the corresponding answers. On average, missing data in the responses amounted to 4.4%. Specifically, missing data for questions on the core questions averaged 2.6%, whereas missing data for optional indicators averaged 6%. Given the low percentage of non-responses for individual questions, we overcame the problem using the donor technique, which entails replacing missing values with values obtained from a “similar” responding unit. After applying the abovementioned correctional procedure, we obtained estimates of the indicators, listed in Table 4. The compiled responses revealed that almost all tourists and same-day visitors (92.2%) were very satisfied with their overall experience at the VSS destination, and more than a half of the respondents (56.2%) had visited it at least once during the last previous 5 years. Considering the lack of data on the local economic impacts of tourism, the average daily spending of same-day visitors (37 €) and that of tourists (56 €) were considered two of the most important evaluated indicators. It is noteworthy that with reference to the indicators that most related to the degree of sustainable development, only 39% of the surveyed respondents were aware of efforts to promote sustainable destinations (indicator A.4.1), and slightly more than 50% of the tourists were satisfied with the destination’s accessibility for those with disabilities or specific access requirements (indicator C.3.2.1). The assessment of indicators relating to the environmental dimension revealed that 44.8% of respondents used different modes of transport to reach the destination (indicator D.1.1), but only 40.1% used local/”soft” mobility/public transport services to travel around the destination site (indicator D.1.1.1). On average, tourists traveled 1,160 km to and from home (indicator D.1.2), whereas same-day visitors traveled 90 km to and from the destination (indicator D.1.2.1).

5.4. Survey of Enterprises

As discussed in Section 4, because of the high number of enterprises and their dispersion across the VSS territory, we applied a computer-assisted web interviewing technique for surveying the enterprises. Only a very small percentage of the contacted subjects answered the questionnaire, resulting in invalidation of the sample randomness. Moreover, because of the incompleteness of some of the answers, we were unable to obtain a stable and reliable estimate for the indicators listed in Table 5. This table shows the percentage of missing data affecting the corresponding answers for each indicator. Evidently, the percentages of missing data range from a minimum of 12% (for the D.6.1.1 and D.3.1.1 indicators) to a maximum of 52% (for the core indicator, C.2.1), with an average value of 30.13%. In this case, it was not possible to apply any technique to overcome the issue of missing data. Therefore, we did not calculate this group of indicators. The lack of data received from enterprises was discussed during PSG meetings, with the objective of increasing awareness among tourism enterprises on the importance of sustainability practices relating to their customers, and of strengthening the involvement of the private sector in implementing the STPMS.

5.5. Survey of Local Public Actors

The ETIS toolkit included a questionnaire that was tailored to local administrators, with the aim of gathering information relating to the 10 indicators listed in the last row of Table 1. Questionnaires were provided to the boards of the five municipalities involved in the VSS project: Cagliari, Villasimius, Pula, Domus De Maria, and Muravera.
Table 6 shows the estimated values of the indicators. The local administrators evidently demonstrated different degrees of interest in realizing the system of indicators. For instance, repeated requests elicited a limited response from the local administration of Cagliari. This is partly attributable to the fact that data for the capital city are distributed across a large number of locations. Moreover, the attitude and involvement of the PSG in the implementation of indicator systems can change over time. Some of the indicators showed strongly contrasting values for the municipalities. Although all of the municipalities confirmed that they had implemented a public policy for sustainable tourism management (A.1.1. and A.1.1.2), their situations relating to accessibility (C.3.1.1) and landscape and biodiversity protection (D.7.1 and D.7.1.2) differed.

5.6. An Overview of the ETIS in VSS

Table 7 shows the percentages of indicators that VSS estimated for each category of the ETIS. For the categories of destination management, social and cultural impacts, and economic value, the calculated indicators were more than 50% of the complete list of indicators. Only 35% of the indicators of environmental impact were calculated, with the majority of these indicators associated with the enterprise survey that reflected serious problems relating to missing data and sample representativeness.
The overall analysis of the ETIS showed that VSS could be considered a sustainable destination. Despite the extensive tourism in this area, residents did not perceive tourism as an intrusion into their personal lives; on the contrary, they believed that tourism helps to enhance the distinctiveness of the destination, strengthening its local identity, culture, and heritage. The tourists were very satisfied with their experiences in this destination, with more than a half of them returning within a 5-year period. In general, the high quality of the sea and territorial environments was confirmed using each of the environmental indicators.
Several insights emerge from the implementation of the ETIS in the VSS tourist destination. The first is that the different sources used to calculate the ETIS complement each other. For example, the official statistics did not reveal unregistered tourism supply, which could be explored using information provided by the municipalities on second/rental homes. Moreover, some indicators were objectively difficult to calculate in relation to missing data (e.g., when queried on the distance traveled in kilometers to and from a destination, a visitor would need to respond, and could decide whether or not to answer to the question). In addition, the surveying technique applied influenced the availability of respondents; whereas a survey administered personally allows for direct contact with respondents, it entails high costs and covers a limited area.

5.7. Conclusion of the Process of Implementing Indicators

A final sequence of PSG meetings, which was aimed at critically analyzing best practices in sustainable management and identifying areas for improvement, marked the conclusion of the VSS project. The GSTC indicators were first employed, followed by the ETIS indicators for assessing best practices relating to the environmental and social dimensions of sustainability. An environmental concern relating to the indiscriminate use of plastic bottles in the destination area was highlighted and discussed. The lack of tourism data on the economic dimension of sustainability (e.g., the contribution of tourism to the GDP) was also considered. Last, the PSG recognized that while the ETIS and similar methodologies promote responsible management, monitoring, and marketing of the tourism industry at the sub-national level, the key role of the destination coordinator in implementing the indicator systems cannot be neglected.

5.8. Highlights

From the onset of the implementation of the ETIS across Europe, the VSS PSG demonstrated an enduring commitment to pursue the EC initiative under the coordination of the University of Cagliari. Active and fully-fledged engagement within the ETIS entailed participation in events, meetings, and working groups, as shown in Table 8. The objective of this paragraph is to first demonstrate and subsequently explain the most important events in terms of outcomes that can be useful for strengthening awareness of the level of involvement that is needed for replication of the STPMS in other destinations.
More than 350 delegates from European countries participated in Event 1, which was organized by the EC. The ETIS was launched by the EC on 22 February 2013, and this initiative concluded on 22 April 2016 with the bestowal of the ETIS award. Whereas the 2016 ETIS toolkit has been implemented in specific destinations in Croatia, the UK, Italy, Spain, France, and other countries, without the coordination of the EC, its implementation at the level of Europe as a whole is still pending.
Event 2 can be considered as foundational for the VSS STPMS. International standards and indicators, such as GSTC and ETIS, were introduced to VSS mayors participating in the event. Tourism indicators were considered a means for acquiring and/or systematizing tourism data required for decision making. The plan was for the VSS project to be included in the GSTC Early Adopter initiative. However, at that time, fragmented modalities were being applied by VSS municipalities in an uncoordinated manner to compile tourism data.
Event 3 was the first to include exchanges among representatives of the EC and agencies at the tourist destination interested in ETIS implementation. At the inception of the ETIS, the system and toolkit were only available in the English language. This was emphatically viewed as a strong limitation, given that not all stakeholders at local levels may be conversant in English. Two key questions concerned the costs of ETIS implementation. The first concerned financial support provided by the EC and the second related to the implementation cost incurred at the destination. These questions were motivated by the generally limited resources available to municipalities for collecting tourism data. The ETIS pilot phases were developed on a voluntary basis in the selected destinations, with costs dependent on the implementation level of the ETIS system.
Event 4 was at the core of the overall STPMS. The focus of PSG meetings was contingent on the locations and special features within each municipality. Discussions held on economic indicators in the Cagliari municipality revealed a lack of relevant economic data related to tourism, which was also confirmed by the representative from the statistics office of the region of Sardinia. The PSG highlighted the need for collection of economic data at the municipal level and the use of indicator systems to achieve this objective. In the municipalities of Domus de Maria and Muravera, the meetings of the PSG focused on enterprises based on tourism and related sectors, and on the public sector. The importance of utilizing indicators from the perspective of tourism enterprises was discussed. Enterprises acknowledged the need for data compilation, but in some cases, they observed that the implementation of sustainability practices constrained their business development. Discussions in the municipality of Pula focused on the social aspect of sustainability and related indicators, whereas those in the municipality of Villasimius focused on environmental indicators and their utility for the marine protected area. During PSG meetings held in 2013, primary stakeholders suggested new indicators that better fitted with the information needed for the management of the tourist destination and more accurately reflected its characteristics.
Event 5 involved the Sardinian media and press, whose attendance was required for broadcasting the results of the STPMS derived from the GSTC assessment. The EC produced a video highlighting the importance of the ETIS for sustainable destinations and the implementation of the Visit South Sardinia project.
Events 6 and 7 enabled sharing of the methodology for implementing the VSS project used during the first year (2013–2014) of ETIS implementation. In the absence of a dedicated office in the destination area for gathering tourism data relating to the construction of indicators, it was proposed, first of all, to restrict the level of implementation selectively to a limited number of geographical areas at the destination. Second, it was recommended that the number of indicators collected should be limited, starting with those that were easily available. After a period of testing the usefulness of the compiled indicators, it would then be possible to gradually extend the number of indicators collected and the areas of collection at the destination.
Events 8 and 9 were aimed at strengthening the PSG’s awareness regarding a new 2015 ETIS phase, termed EC GROW ETIS (The term GROW derives from the name of the EC Directorate General (DG) GROWTH for Internal Market, Industries, Entrepreneurship and SMEs that was responsible for the ETIS in 2015) to enable collection of all data related to ETIS indicators through the administration of the ETIS surveys provided in the ETIS toolkit.
During Events 10 and 11, the EC and agencies at the destination site shared their experiences and suggested improvements relating to the indicators and the toolkit. Destinations that had not established a ST requested overall simplification of the system and a reduction in the number of indicators. VSS, following the implementation of the 2015 ETIS surveys, shared the finding that administration of the ETIS survey of residents took just 5 min per respondent, while surveying each tourist required 10 min. Nonetheless, in the absence of a ST, and insufficient human resources and knowledge of indicators at local levels, it is not possible for destinations to administer the preset number of questionnaires for achieving the objective of compiling the impacts of tourism impacts for decision making.
Considering the results of events 7, 10, and 11, and in light of the inputs of the pool of experts, the EC released the new ETIS 2016 toolkit at Event 12.
Event 13 marked the conclusion of the EC’s commitment to the ETIS. During the award-giving ceremony, the EC representatives encouraged the VSS project to assume a leading position as an ETIS destination. Following the EC encouragement, the ETIS Destination Network (EDN) was established as an informal network in 2016 with the following two objectives: (1) To promote exchanges and augment experiences of measuring and monitoring sustainable tourism performances at the destination level through the use of a common methodology and tools, such as ETIS and/or other recognized European and/or international schemes; and (2) to benchmark and compare destinations. A final EDN-facilitated meeting was held at the University of Cagliari on 28 June 2018 in collaboration with the University of Surrey.

6. Conclusions and Discussion

The experience of implementing the ETIS in the VSS project within an Italian tourism destination provides insights on several critical issues. Firstly, it is objectively difficult to obtain statistical data at local levels in Italy. Statistical data are often not collected, and when they are, the methodologies usually differ, even for geographically proximate destinations. There is no codification of the methods used to collect statistical data at local levels. Another important constraint concerns the time taken to collect data. The delay in collecting statistical data concerning tourism performance, such as occupancy rate, the average daily rate, and the yield rate, is usually at least six months, and sometimes longer. For management purposes, this is a significant limitation that reduces the efficiency of the system. In sum, statistical data are not collected by following codified methodologies, which means that they are often not comparable, and they are not generated in a timely manner. The main consequence at the local level is the high cost of collecting statistical data, both in terms of time and financial resources. Such data should be collected periodically, but this requires an efficient system that has not yet been established in Italy, as demonstrated in the VSS case study.
Secondly, only a few of the surveyed enterprises completed the questionnaire (partially or fully). This finding suggests the need within future investigations for strengthening the involvement of the private sector in implementing the STPMS. Similarly, local administrators demonstrated different degrees of interest in realizing the system of indicators, revealing another area for future research.
Thirdly, as a consequence of the above two limitations, it was not possible for the VSS project to develop a governance system at the local level to promote more sustainable destination management using only the ETIS indicators toolkit. To achieve this aim, it proved necessary to implement the pioneering STPMS. This is an important finding, indicating that the ETIS should not be perceived merely as a statistical instrument. It should be an important driver for reducing gaps among different stakeholders, particularly at the local level, to create a shared vision of sustainable tourism. This requires the creation of a system for regulating destination management. In the case of the VSS project, the ETIS fulfilled its scope as an instrument with the capacity to bring and keep together different tourism stakeholders, but this was only possible through the use of the STPMS to ensure their cooperation.
Fourthly, the VSS experience highlights the key role of the destination coordinator, for the success of the project. The destination coordinator must perform more activities than those foreseen by ETIS. Because local stakeholders do not have the tools, not even the organizational ones, to continue the project independently. This represents a great weakness of the whole ETIS system. For this reason, it is important that ETIS projects are supported by institutions (such as universities, research centers, etc.), that they are able to raise funds, train staff, etc., as local stakeholders cannot implement indicator systems independently.
The above findings reveal the importance of working with stakeholders within a territory to simplify the indicators toolkit and improve the statistical culture and implementation of joint procedures, supported by new technologies that facilitate the collection of statistical data.
At the EU level, it is necessary to facilitate the implementation of standard indicator systems to increase sustainability policies and facilitate planning processes. The indicator systems must also encourage the development of practical methodologies that support the simple use of indicators. Only through the development of appropriate methodologies it is possible to optimize the results obtained from the implementation of indicator systems. We recommend simplifying the ETIS in consideration of the organizational characteristics of local stakeholders.
The use of recognized and relatively simple indicator systems allows comparability between different local experiences. Comparability is an essential prerequisite for the adoption of best practice at local, regional, national and international levels. The implementation of best practice, through evaluation of indicator systems, can be a significant support for both public and private planning processes.
The VSS experience shows that the lack of reliability and timeliness in the collected data may undermine the quality of some indicators. This is important in ETIS, having been conceived as a tool to implement and monitor sustainable policies at local level with respect to the objectives proposed by the EU.
To be effective in planning policies at the local level, it is essential to have reliable and accurate indicators. This requires the investment of considerable resources for data collection which are not often available locally. The lack of resources therefore makes the indicators less reliable and consequently less used, which may be to the detriment of local planning policies
In an area where data gathering can be problematic, indicator systems can still afford significant insight into public and private planning, although in the absence of sufficient hard data, caution must be exercised in the interpretation of these indicators. We recommend the continuity of the project so that, at the local level, both public and private actors can obtain valid insights into the local planning processes via the evaluation of indicator systems.
In summary, when implementing the ETIS, the VSS project relied on the STPMS to achieve the expected results. Following the revisions made to the ETIS in 2016, it would be advantageous for the EC to improve the indicator toolkit in light of the results of the implementation of new voluntary pilots in destinations across Europe. However, it is essential to first improve data collection techniques and procedures.
Any destination seeking to implement the ETIS toolkit or a similar methodology should be cognizant of the associated challenges. The lessons from this case study are of particular relevance at the municipal level. Our findings contribute to a better understanding of the ETIS as a globally recognized standard for developing best practices in monitoring the impacts of tourism. Though it clearly has great potential, this instrument is not yet sufficiently developed to achieve tangible outcomes reflecting the enhancement of sustainable cultures at local levels.

Author Contributions

The authors have contributed equally to research design and development, data analysis, and writing the paper. The authors have read and approved the final manuscript.

Funding

This research received no external funding.

Acknowledgments

The project presented in this paper has been supported by the municipalities of VSS, Area Marina Protetta Capo Carbonara, Università di Cagliari and Fondazione Banco di Sardegna. We also thank the academic editor and the two anonymous reviewers for their constructive comments.

Conflicts of Interest

The authors declare no conflict of interest.

Appendix A

Table A1. ETIS indicators. Note. Adapted from Reference [6].
Section A:Destination Management
A.1Sustainable Tourism Public Policy
A.1.1Percentage of the destination with a sustainable tourism strategy/action plan, with agreed monitoring, development control and evaluation arrangement
A.1.1.1Percentage of residents satisfied with their involvement and their influence in the planning and development of tourism
A.1.1.2Percentage of the destination represented by a destination management organization
A.2Sustainable Tourism Management in Tourism Enterprises
A.2.1Percentage of tourism enterprises/establishments in the destination using a voluntary verified certification/labelling for environmental/quality/sustainability and/or Corporate Social Responsibility (CSR) measures
A.2.2.1Number of tourism enterprises/establishments with sustainability reports in accordance with the Global Reporting Initiative (GRI)
A.3Customer Satisfaction
A.3.1Percentage of visitors that are satisfied with their overall experience in the destination
A.3.1.1Percentage of repeat/return visitors (within 5 years)
A.4Information and Communication
A.4.1The percentage of visitors who note that they are aware of destination sustainability efforts
A.4.1.1The percentage of businesses that communicate their sustainability efforts to visitors in their products, marketing, or branding
Section B:Economic Value
B.1Tourism Flow (volume and value) at Destination
B.1.1Number of tourist nights per month
B.1.1.1Relative contribution of tourism to the destination’s economy (% GDP)
B.1.1.2Number of ‘same day’ visitors in high season and low season
B.1.1.3Daily spending per same day visitor
B.1.2Daily spending per tourist (accommodation, food and drinks, other services)
B.2Tourism Enterprise(s) Performance
B.2.1Average length of stay of tourists (nights)
B.2.1.1Average length of stay of same day visitors (hours)
B.2.1.2Percentage of ten largest tourism enterprises involved in destination management/cooperative marketing
B.2.2Occupancy rate in commercial accommodation per month and average for the year
B.2.2.1Average price per room in the destination
B.3Quantity and Quality of Employment
B.3.1Direct tourism employment as percentage of total employment in the destination
B.3.1.1Percentage of jobs in tourism that are seasonal
B.3.1.2Percentage of tourism enterprises providing student internships
B.4Safety and Health
B.4.1Percentage of tourism enterprises inspected for fire safety in the last year
B.4.1.1Percentage of tourists who register a complaint with the police
B.5Tourism Supply Chain
B.5.1Percentage of tourism enterprises actively taking steps to source local, sustainable, and fair trade goods and services
B.5.1.1Percentage of the destination covered by a policy promoting local, sustainable and/or fair trade products and services
B.5.1.2Percentage of tourism enterprises sourcing a minimum of 25% of food and drink from local/regional producers
Section C:Social and Cultural Impact
C.1Community/Social Impact
C.1.1Number of tourists/visitors per 100 residents
C.1.1.1Percentage of residents who are satisfied with tourism in the destination (per month/season)
C.1.1.2Number of beds available in commercial visitor accommodation per 100 residents
C.1.1.3Number of second/rental homes per 100 homes
C.2Gender Equality
C.2.1Percentage of men and women employed in the tourism sector
C.2.1.1Percentage of tourism enterprises where the general manager position is held by a woman
C.2.1.2Average wage in tourism for women compared to average wage for men (sorted by tourism job type)
C.3Equality/Accessibility
C.3.1Percentage of commercial accommodation with rooms accessible to people with disabilities and/or participating in recognized accessibility schemes
C.3.1.1Percentage of destination served by public transport that is accessible to people with disabilities and people with specific access requirements
C.3.2Percentage of visitor attractions that are accessible to people with disabilities and/or participating in recognized accessibility schemes
C.3.2.1Percentage of visitors satisfied with the accessibility of the destination for those with disabilities or specific access requirements
C.4Protecting and Enhancing Cultural Heritage, Local Identity and Assets
C.4.1Percentage of the destination covered by a policy or plan that protects cultural heritage
C.4.1.1Percentage of residents who have positive or negative views on the impact of tourism on destination identity
C.4.1.2Percentage of the destination’s biggest events that are focused on traditional/local culture and assets
Section D:Environmental Impact
D.1Reducing Transport Impact
D.1.1Percentage of tourists and same day visitors using different modes of transport to arrive at the destination (public/private and type)
D.1.1.1Percentage of visitors using local/soft mobility/public transport services to get around the destination
D.1.2Average travel (km) by tourists to and from home or average travel (km) from the previous destination to the current destination
D.1.2.1Average travel (km) by same day visitors from and to destination
D.2Climate Change
D.2.1Percentage of tourism enterprises involved in climate change mitigation schemes—such as: CO2 offset, low energy systems, etc.—and “adaptation” responses and actions
D.2.1.1Percentage of the destination included in climate change adaptation strategy or planning
D.2.1.2Percentage of tourism accommodation and attraction infrastructure located in “vulnerable zones.”
D.3Solid Waste Management
D.3.1Waste volume produced by destination (tonnes per resident per year or per month)
D.3.1.1Percentage of tourism enterprises separating different types of waste
D.3.2Volume of waste recycled (percent or per resident per year)
D.4Sewage Treatment
D.4.1Percentage of sewage from the destination treated to at least secondary level prior to discharge
D.4.1.1Percentage of commercial accommodation connected to central sewage system and/or employing tertiary sewage treatment
D.5Water Management
D.5.1Fresh water consumption per tourist night compared to general population water consumption per person night
D.5.1.1Percentage of tourism enterprises with low-flow shower heads and taps and/or dual flush toilets/waterless urinals
D.5.1.2Percentage of tourism enterprises using recycled water
D.5.1.3Percentage of water use derived from recycled water in the destination
D.6Energy Usage
D.6.1Energy consumption per tourist night compared to general population energy consumption per person night
D.6.1.1Percentage of tourism enterprises that have switched to low-energy lighting
D.6.1.2Annual amount of energy consumed from renewable sources (Mwh) as a percentage of overall energy consumption
D.7Landscape and Biodiversity Protection
D.7.1Percentage of destination (area in km2) that is designated for protection
D.7.1.1Percentage of local enterprises in the tourism sector actively supporting protection, conservation, and management of local biodiversity and landscapes.
D.7.1.2Percentage of destination covered by a biodiversity management and monitoring plan
D.8Light and Noise Management
D.8.1The destination has policies in place that require tourism enterprises to minimize light and noise pollution
D.8.1.1Percentage of the destination and percentage of population covered by local strategy and/or plans to reduce noise and light pollution
D.9Bathing Water Quality
D.9.1Level of contamination per 100 mL (fecal coliforms, campylobacter)
D.9.1.1Number of days beach/shore closed due to contamination

References

  1. Bramwell, B.; Higham, J.; Lane, B.; Miller, G. Twenty-five years of sustainable tourism and the Journal of Sustainable Tourism: Looking back and moving forward. J. Sustain. Tour. 2017, 25, 1–9. [Google Scholar] [CrossRef]
  2. Hall, C.M. Framing behavioural approaches to understanding and governing sustainable tourism consumption: Beyond neoliberalism, “nudging” and “green growth”? J. Sustain. Tour. 2013, 21, 1091–1109. [Google Scholar] [CrossRef]
  3. Miller, G. The development of indicators for sustainable tourism: Results of a Delphi survey of tourism researchers. Tour. Manag. 2001, 22, 351–362. [Google Scholar] [CrossRef]
  4. Torres-Delgado, A.; Lopez Palomeque, F. Measuring Sustainable Tourism at the Municipal Level. Ann. Tour. Res. 2014, 49, 122–137. [Google Scholar] [CrossRef]
  5. Torres-Delgado, A.; Saarinen, J. Using indicators to assess sustainable tourism development: A review. Tour. Geogr. 2014, 16, 31–47. [Google Scholar] [CrossRef]
  6. European Commission. European Tourism Indicator System for Sustainable Destinations—Detailed Indicator Reference Sheets; European Union: Brussels, Belgium, 2013. [Google Scholar]
  7. European Commission. Communication Europe, the World’s No 1 Tourist Destination—A New Political Framework for Tourism in Europe; European Union: Bruxels, Belgium, 2010. [Google Scholar]
  8. Sistema Informativo di Raccolta ed Elaborazione Dati SIRED. 2018. Available online: http://osservatorio.sardegnaturismo.it/sites/default/files/2018-06/OsservatorioTurismoreport2017online_20180517_0.pdf (accessed on 4 June 2018).
  9. European Commission. European Tourism Indicator System for Sustainable Destinations; European Union: Bruxels, Belgium, 2016. [Google Scholar]
  10. Hunter, C. Sustainable tourism as an adaptive paradigm. Ann. Tour. Res. 1997, 24, 850–867. [Google Scholar] [CrossRef]
  11. Daly, H.; Cobb, J.B. For the Common Good: Restructuring the Economy toward Community, the Environment and a Sustainable Future; Beacon Press: Boston, MA, USA, 1989. [Google Scholar]
  12. Pepper, D. The Roots of Modern Environmentalism; Croom Helm: London, UK, 1984. [Google Scholar]
  13. Trainer, T. A Rejection of the Brundtland Report. IFAD Dossier 1990, 77, 71–84. [Google Scholar]
  14. Butler, R.W. Sustainable tourism—A state of the art review. Tour. Geogr. 1999, 1, 7–25. [Google Scholar] [CrossRef]
  15. Sinclair, D.; Jayawardena, C. The development of sustainable tourism in the Guianas. Int. J. Contemp. Hosp. Manag. 2003, 15, 402–407. [Google Scholar] [CrossRef]
  16. Butler, R.W. Tourism, environment, and sustainable development. Environ. Conserv. 1991, 18, 201–209. [Google Scholar] [CrossRef]
  17. Dowling, R. An Environmentally-Based Planning Model for Regional Tourism Development. J. Sustain. Plan. Model Reg. Tour. Dev. Tour. 1993, 1, 17–37. [Google Scholar] [CrossRef]
  18. Eagles, P.F.J. Understanding the market for sustainable tourism. In Linking Tourism, the Environment and Sustainability; McCool, S.F., Watson, A.E., Eds.; General Technical Report INT-GTR-323; USDA Service Center: Ogden, UT, USA, 1994; pp. 23–33. [Google Scholar]
  19. Farrel, B. Tourism as an Element in Sustainable Development: Hana, Maui. In Tourism Alternatives; Smith, V., Eadington, W., Eds.; University of Pennsylvania Press: Philadelphia, PA, USA, 1992. [Google Scholar]
  20. Forsyth, T. Sustainable Tourism: Moving from Theory to Practice; World Wildlife Fund/Tourism Concern: Godalming, UK, 1996. [Google Scholar]
  21. Hunter, C. Environmental impact assessment and tourism Development. In Tourism and the Environment: A Sustainable Relationship? Hunter, C., Green, H., Eds.; Routledge: London, UK, 1995. [Google Scholar]
  22. Lane, B. Sustainable Rural Tourism strategies: A Tool for Development and Conservation. J. Sustain. Tour. 1994, 2, 102–111. [Google Scholar] [CrossRef]
  23. McCool, S.F. Linking tourism, the environment, and concepts of sustainability: Setting the stage. In Linking Tourism, the Environment and Sustainability; McCool, S.F., Watson, A.E., Eds.; General Technical Report INT-GTR-323; USDA Service Center: Ogden, UT, USA, 1994; pp. 3–7. [Google Scholar]
  24. McKercher, B. Some fundamental truths about tourism: Understanding tourism’s social and environmental impacts. J. Sustain. Tour. 1993, 1, 6–16. [Google Scholar] [CrossRef]
  25. Sanson, L. An Ecotourism Case Study in Sub-Antarctic Island. Ann. Tour. Res. 1994, 21, 344–354. [Google Scholar] [CrossRef]
  26. Wheeller, B. Sustaining the ego. J. Sustain. Tour. 1993, 1, 121–129. [Google Scholar] [CrossRef]
  27. Morgan, M. Dressing up to survive: Marketing Majorca Anew. Tour. Manag. 1991, 12, 15–20. [Google Scholar] [CrossRef]
  28. Owen, R.E.; Witt, S.; Gammon, S. Sustainable Tourism Development in Wales: From Theory to Practice. Tour. Manag. 1993, 14, 463–474. [Google Scholar] [CrossRef]
  29. Sanchez, C.I.; Jaramillo-Hurtado, M.E. Policies for enhancing sustainability and competitiveness in tourism in Colombia. Worldw. Hosp. Tour. Themes 2010, 2, 153–162. [Google Scholar] [CrossRef]
  30. May, V. Tourism, environment and development—Values, sustainability and stewardship. Tour. Manag. 1991, 12, 112–118. [Google Scholar] [CrossRef]
  31. Stocking, M.; Perkin, S. Conservation-with-Development: An application of the concept in the Usambara Mountains, Tanzania. Trans. Inst. Br. Geogr. 1992, 17, 337–349. [Google Scholar] [CrossRef]
  32. Pretty, J.; Pimbert, M. Beyond Conservation Ideology and the Wilderness Myth. Nat. Resour. 1995, 19, 5–14. [Google Scholar]
  33. Oreja Rodriguez, J.R.; Yanes-Estevez, V.; Parra Lopez, E. The sustainability of island destinations: Tourism area life cycle and teleological perspectives. The Case of Tenerife. Tour. Manag. 2008, 29, 53–65. [Google Scholar] [CrossRef]
  34. Spenceley, A. Requirements for Sustainable Nature-based Tourism in Transfrontier Conservation Areas: A Southern African Delphi Consultation. Tour. Geogr. 2008, 10, 285–311. [Google Scholar] [CrossRef]
  35. Woodside, G.; Dubelaar, C. A General Theory of Tourism Consumption Systems: A Conceptual Framework and an Empirical Exploration. J. Travel Res. 2002, 41, 120–132. [Google Scholar] [CrossRef]
  36. Twining-Ward, L.; Butler, R. Implementing STD on a Small Island: Development and Use of Sustainable Tourism Development Indicators in Samoa. J. Sustain. Tour. 2002, 10, 363–387. [Google Scholar] [CrossRef]
  37. Nijkamp, P.; Van der Bergh, C.J.M.; Soeteman, F.J. Regional Sustainable Development and Natural Resource Use. In Proceedings of the World Bank Annual Conference on Development Economics, Washington, DC, USA, 26–27 April 1990. [Google Scholar]
  38. Swarbrooke, J. Sustainable Tourism Management; CABI Publishing: Wallingford, UK, 1999. [Google Scholar]
  39. Carley, M. Social Measurement and Social Indicators: Issues of Policy and Theory; George Allen and Unwin: London, UK, 1981. [Google Scholar]
  40. Hart, S. Beyond Greening: Strategies for a Sustainable World. Harvard Business Review. January–February 1997, pp. 67–76. Available online: https://hbr.org/1997/01/beyond-greening-strategies-for-a-sustainable-world (accessed on 2 September 2018).
  41. Van Esch, S. Indicators for the Environment Programme in the Netherlands. In Sustainability Indicators: Report of the Project on Indicators of Sustainable Development; Moldan, B., Bilharz, S., Eds.; Wiley & Sons: Chichester, UK, 1997. [Google Scholar]
  42. Bramwell, B.; Henry, I.; Jackson, G.; Prat, A.G.; Richards, G.; Van der Straaten, J. (Eds.) Sustainable Tourism Management: Principles and Practice; Tilburg University Press: Tilburg, The Netherlands, 1996. [Google Scholar]
  43. Eber, S. Beyond the Green Horizon: A Discussion Paper on Principles for Sustainable Tourism; Worldwide Fund for Nature: Godalming, UK, 1992. [Google Scholar]
  44. Gerken, G. Die Geburt der Neuen Kultur—Vom Industrialismus zum Light-Age; ECON Verlag: Dusseldorf, Germany; Wien, Austria; New York, NY, USA, 1988. [Google Scholar]
  45. McIntyre, G. Sustainable Tourism Development: Guide for Local Planners; World Tourism Organization (WTO): Madrid, Spain, 1993. [Google Scholar]
  46. World Travel & Tourism Council (WTTC); World Tourism Organization (WTO); Earth Council. Agenda 21 for the Travel & Tourism Industry; World Travel & Tourism Council: London, UK, 1996. [Google Scholar]
  47. Dymond, S.J. Indicators of sustainable tourism in New Zealand: A local government perspective. J. Sustain. Tour. 1997, 5, 279–293. [Google Scholar] [CrossRef]
  48. Goodall, B.; Stabler, M.J. Principles Influencing the Determination of Environmental Standards for Sustainable Tourism. In Tourism & Sustainability: Principles to Practice; Stabler, M.J., Ed.; CAB International: Wallingford, UK, 1997. [Google Scholar]
  49. Gunn, C.A. Tourism Planning, 2nd ed.; Taylor and Frances: Washington, DC, USA, 1988. [Google Scholar]
  50. Moisey, R.N.; McCool, S.F. Sustainable tourism in the 21st century: Lessons from the past: Challenges to address. In Tourism Recreation and Sustainability; McCool, S.F., Moisey, R.N., Eds.; CAB International: Oxford, UK, 2001; pp. 343–352. [Google Scholar]
  51. Mowforth, A.; Munt, I. Tourism and Sustainability: New Tourism in the Third World; Routledge: London, UK, 1998. [Google Scholar]
  52. Weaver, D.B. Introduction to ecotourism. In Ecotourism in the Less Developed World; Weaver, D.B., Ed.; CAB International: Wallingford, UK, 1998; pp. 1–33. [Google Scholar]
  53. Buckley, R. Sustainable tourism: Research and reality. Ann. Tour. Res. 2012, 39, 528–546. [Google Scholar] [CrossRef]
  54. Spangenberg, J.H. Environmental space and the prism of sustainability: Frameworks for indicators measuring sustainable development. Ecol. Indic. 2002, 2, 295–309. [Google Scholar] [CrossRef]
  55. Liu, Z. Sustainable Tourism Development: A critique. J. Sustain. Tour. 2003, 11, 459–475. [Google Scholar] [CrossRef] [Green Version]
  56. Tudorache, D.M.; Simon, T.; Frent, C.; Musteaţă-Pavel, M. Difficulties and Challenges in Applying the European Tourism Indicators System (ETIS) for Sustainable Tourist Destinations: The Case of Braşov County in the Romanian Carpathians. Sustainability 2017, 9, 1879. [Google Scholar] [CrossRef]
  57. Zamfir, A.; Corbos, R.A. Towards Sustainable Tourism Development in Urban Areas: Case Study on Bucharest as Tourist Destination. Sustainability 2015, 7, 12709–12722. [Google Scholar] [CrossRef] [Green Version]
  58. Zabetta, M.C.; Sacerdotti, S.L.; Mauro, S. Community-based monitoring in tourism sector: An application of the European Tourism Indicators System, in the “A.T.L. del Cuneese”. In Leadership and Governance for Sustainable Tourism: Proceeding of Summer School 2014; Keskinarkaus, S., Matilainen, A., Barbone, S., Makela, A.-M., Eds.; University of Helsinki, Ruralia Insitute: Helsinki, Finland, 2014. [Google Scholar]
  59. Cannas, R.; Theuma, N. Strategies and tools for sustainable tourism destination management: Applying the European Tourism Indicator System in Malta. In Proceedings of the International Conference on Tourism (ICOT 2013)—Trends, Impacts and Policies on Sustainable Tourism Development, Limassol, Cyprus, 5–8 June 2013; Andriotis, K., Ed.; International Association for Tourism Policy: Patras, Greece, 2013. [Google Scholar]
  60. Iunius, R.; Cismaru, L.; Foris, D. Raising Competitiveness for Tourist Destinations through Information Technologies within the Newest Tourism Action Framework Proposed by the European Commission. Sustainability 2015, 7, 12891–12909. [Google Scholar] [CrossRef] [Green Version]
  61. Byrd, E.T.; Cárdenes, D.A.; Greenwood, J.B. Factors of stakeholder understanding of tourism: The case of Eastern North Carolina. Tour. Hosp. Res. 2008, 8, 192–204. [Google Scholar] [CrossRef]
  62. European Commission. The European Tourism Indicator System—ETIS Toolkit for Sustainable Destination Management; Publications Office of the European Union: Luxembourg, 2013. [Google Scholar]
  63. Kalsbeek, W.D. Sampling minority groups in health surveys. Stat. Med. 2003, 22, 1527–1549. [Google Scholar] [CrossRef] [PubMed]
Figure 1. Map of the Province of Cagliari in Sardinia, including Cagliari and the other four municipalities included in the “Visit South Sardinia” (VSS) project.
Sustainability 10 03160 g001
Table 1. Data sources used to calculate the European Tourism Indicator System (ETIS) during the implementation of the VSS project.
Data Sources ClassificationSourceReference Number of ETIS Indicators
Publicly available data from official sources“Occupancy of tourist accommodation establishments“ and “Capacity of collective tourist accommodation“ ISTAT census surveysB.1.1; B.2.1; B.2.2; C.1.1; C.1.1.2
Italian Institute for Environmental Protection and Research and Italian Ministry of the Environment, Land and Sea (http://www.minambiente.it/).D.3.1; D.3.1.1; D.9.1
Ad hoc surveys realized by VSSResidents surveyA.1.1.1
C.1.1.1; C.4.1.1.
Tourists and same day visitors survey A.3.1; A.3.1.1; A.4.1;
B.1.1.3; B.1.2; B.2.1.1;
C.3.2.1;
D.1.1.1; D.1.2; D.1.2.1
Enterprises surveyA.2.1; A.2.2.1; A.4.1.1;
B.2.2.1; B.3.1.1; B.3.1.2; B.4.1; B.5.1; B.5.1.2;
C.2.1; C.2.1.1; C.2.1.2; C.3.1;
D.2.1; D.3.1.1; D.4.1.1; D.5.1; D.5.1.1; D.5.1.2; D.6.1; D.6.1.1; D.6.1.2; D.7.1.1
Local public actors surveyA.1.1; A.1.1.2;
B.1.1; B.1.1.2; B.2.1.1;
C.1.1.3; C.3.1.1;
D.7.1; D.7.1.2; D.8.1.
Table 2. Indicator values estimated on the basis of publicly available data from official sources (* yearly average).
Indicator CodeIndicator Value
B.1.1173,426.58 tourist nights per month
B.2.1 *6 days
B.2.2 *49.4%
C.1.1.215.1 per 100 residents
D.3.1104,798.3 tonnes
D.3.1.1100%
D.9.10.0%
D.9.1.10
Table 3. Values of indicators estimated from data obtained in the residents’ survey.
Indicator CodeIndicator Value
A.1.1.135.6%
C.1.1.1 (in summer)75.5%
C.1.1.1 (in winter)25.9%
C.1.1.1 (in autumn)30.7%
C.1.1.1 (in spring)60.9%
C.4.1.160.8%
Table 4. ETIS indicators evaluated on the basis of data obtained from the survey of tourists/same-day visitors.
Indicator CodeMissing Data (%) for the Question Generating the IndicatorIndicator Value
A.3.14.592.2%
A.3.1.14.956.2%
A.4.16.538.8%
B.1.1.310.537.38 €
B.1.21.956.02 €
B.2.1.17.07.34 h
C.3.2.11.758.3%
D.1.1044.8%
D.1.1.1040.1%
D.1.201160 km
D.1.2.111.490 km
Table 5. Evaluation of ETIS indicators based on data from the surveyed enterprises.
Indicator CodeMissing Data (%) for the Item Generating the Indicator
A.2.144.0
A.2.2.140.0
A.4.1.140.0
B.2.2.140.0
B.3.1.136.0
B.3.1.220.0
B.4.136.0
B.5.120.0
B.5.1.228.0
C.2.152.0
C.2.1.120.0
C.2.1.232.0
C.3.128.0
D.2.132.0
D.3.1.112.0
D.4.1.124.0
D.5.150.0
D.5.1.124.0
D.5.1.224.0
D.6.117.0
D.6.1.112.0
D.6.1.232.0
D.7.1.117.0
Table 6. ETIS evaluation based on data obtained from surveyed local administrators.
Indicator CodeIndicators Values for Each Municipality of the Destination Management Organization (DMO)
PulaDomus de MariaVillasimiusCagliariMuravera
A.1.1100%100%100%100%100%
A.1.1.2100%100%100%100%100%
B.1.1.1--90%-50%
B.1.1.2--It is not possible to know-It is not possible to know
B.2.1.1--12 h-It is not possible to know
C.1.1.3206.9%181.0%120.2%-150.6%
C.3.1.121.6%100%100%-21.4%
D.7.194%96%100%-27%
D.7.1.216%6.4%58% 23%
D.8.1YesYesYesYesYes
Table 7. Percentages of ETIS indicators calculated in the VSS project for each category of the ETIS.
Category%
Destination management67
Social and cultural impacts50
Economic value50
Environmental impact35
Table 8. VSS events, meetings, and working groups associated with implementation of the ETIS.
EventPlaceDateContentResults
1Bruxelles22 February 2013Launch of the ETISKnowledge on the ETIS
2Cagliari13 March 2013Sustainable Tourism conference PSG decision to start with international and European indicator systems implementation (GSTC and ETIS)
3Bruxelles19 April 2013Expert MeetingFirst discussions at the EU level on the problems that destinations encountered with the ETIS toolkit and its first implementation
4Cagliari, Domus de Maria, Muravera, Pula and Villasimius24 July–5 August 2013PSG working group discussionDiscussion on the utility and availability of environmental, social and economic indicators based on GSTC criteria and indicators Early Adopters program
5Cagliari30 November 2013Press release organized by PSG and University of Cagliari Presentation of GSTC implementation and results
6Rome25 June 2014Info day-European Tourism Indicator System. ETIS implementation in Italian Destinations. Conference organized by Lazio Region, Italian ETIS PoE in collaboration with the ECEC ETIS implementation across Europe.
Results from VSS and Cuneo Alps ETIS first pilot phase
7Bruxelles4 July 2014WORKSHOP—European Tourism Indicator System.
The results of the first pilot testing phase: Exchanges of experiences
Presentation of the results of the 1 ETIS pilot phase from 6 selected destinations and presentation of the document of the overall results from the EC and ETIS PoE
8Oristano9 March 2015Presentation of VSS project and STPMSInvolvement of PSG and students in ETIS data collection through 2015 surveys
9Villasimius29 April 2015VSS DMO promotion with the participation of tourism enterprisesPresentation of ETIS surveys to PSG and distribution of the ETIS enterprise survey: Request of collaboration
10Bruxelles (videoconference)25 June 2015ETIS pilot phases Discussion between EC, ETIS PoE and destination representatives
11Bruxelles (videoconference)29 October 2015ETIS pilot phases Discussion between EC, ETIS PoE and destination representatives
12Bruxelles28 January 2016ETIS and Accessible Tourism conference.
Managing and promoting sustainable and accessible tourism destinations
EC release of the ETIS toolkit 2016.
Presentation of VSS implementation of GSTC and ETIS indicators, difficulties and challenges.
13Bruxelles22 April 2016ETIS AwardETIS ceremony.
Decision of the ETIS winners to continue their experience and share results through the establishment of the ETIS Destinations Network (EDN) leaded by VSS

