1. Introduction
Sustainable urban drainage systems (SUDS) are an alternative approach to conventional urban stormwater management; they use and promote natural processes to mimic predevelopment hydrology in urbanised areas. SUDS mitigate urban flooding and water pollution [
1], save energy, and provide multiple ecosystem services [
2]. Hence, SUDS are part of the urban green infrastructure [
3] that can be considered as an effective tool to face the challenges that our cities will have to deal with during the next decades regarding the effects of climate change on rainfall regimes and heat waves.
Green roofs are one specific type of SUDS consisting of areas of living vegetation; they are installed on the top of buildings, which promotes the reduction of surface water runoff quantity and pollution, and also provides ecosystem services such as aesthetic benefits, ecological-added value, and an enhancement of building performance [
4,
5]. Interest in green roofs has increased in recent years, as many more benefits have been reported beyond the hydrological ones: energy savings, thermal benefits, air pollution improvement, carbon sequestration, and psychological benefits [
6,
7,
8]. Kuronuma et al. [
9] demonstrated that green roofs contribute actively to carbon sequestration and energy savings, thus enhancing global warming mitigation. Luo et al. [
10] investigated the thermal benefits of green roofs, and also demonstrated the air quality improvement in the green roof surroundings.
From the hydrological perspective, a green roof attenuates runoff hydrographs at the catchment source by providing rainfall retention and runoff detention [
11]. Many experimental studies have been reported showing the hydrological performance of green roofs. The literature includes many references on the hydrological performance of both laboratory and full-scale roof installations [
12,
13]. Results from previous studies show that green roofs can achieve runoff volume reductions ranging from 0% to 100% [
13], even though there is a general agreement on the potential of green roofs to effectively manage runoff at the source. Nevertheless, there is still very scarce evidence of their performance under semi-arid climatic conditions such as those in the eastern Mediterranean coastline of Spain [
14]. Indeed, many authors have pointed out that the performance of green roofs largely varies with their hydroclimatic exposure [
15], especially regarding the rainfall regime (frequency, rainfall volumes) and the soil moisture conditions. Antecedent dry weather periods between storms allow the green roof soil to dry, and consequently have more retention capacity in the next rainfall event. On the other hand, the green roof retention rate will decline with the increase in rainfall event volume, as well as with the increase in rainfall intensity.
Climate change threats on highly urbanised areas represent a great challenge for the coming decades; green infrastructure, including SUDS, represents a promising solution to mitigating these effects [
16]. The European Commission recognises green infrastructure as a smart solution for today’s challenges [
17], providing strong climate change mitigation and adaptation benefits. Managing stormwater in cities through green infrastructure is one of the challenges included in the European Union’s green infrastructure strategy, where green roofs are listed as one of the new engineering approaches to provide the above-mentioned benefits. In addition, green roof performance at the building scale is not fully representative of their effect at a higher scale; hence, one must consider the city scale to assess their efficiency within the whole system.
Modelling the hydrological performance of SUDS is a complex issue, given the number of processes involved. Several authors have successfully used the Hydrus-1D software for this purpose. Hilten et al. [
18] highlighted the importance of calibrating soil parameters to achieve the good accuracy of the model; Palla et al. [
19] achieved good results with Hydrus-1D compared to those obtained with a conceptual model; and Hakimdavar et al. [
20] revealed the limitations of Hydrus-1D to reproduce the hydrological performance of a green roof. The Storm Water Management Model (SWMM) has also been widely used to model SUDS through its Low-Impact Development (LID) module [
21]. Burszta-Adamiak and Mrowiec [
22] reproduced the hydrological response of laboratory green roof pilots in SWMM with unsatisfactory simulation results; Zhang and Guo [
23] compared the performance of the SWMM for the continuous simulation of a green roof with an analytical probabilistic model, and highlighted the lack of data for estimating the parameters of the LID module. Finally, Peng and Stovin [
11] conducted a critical validation of the potential of the SWMM LID module for representing the hydrological performance of an extensive green roof in response to actual rainfall events. As emphasised by other authors, they revealed the need for calibration to obtain accurate modelling results. In addition, they pointed out the sensitivity of the green roof hydrological model to evapotranspiration.
The objective of this research is to compare the hydrological performance of a green roof and a conventional roof under Mediterranean climatic conditions at two different scales: the plot or building scale, and the city scale. A hydrological model at these two scales is set up using SWMM (v. 5.01.12). Calibration and validation of the model is carried out at the building scale using recorded data from both monitored roofs at the study site in Benaguasil (Valencia, Spain). Hence, the long-term hydrological performance of the green roof and the conventional roof is estimated by simulating a 17-year historical rainfall series. Upscaling at the city scale is analysed through a hypothetical urban area that is representative of the compact and dense cities in the region. Several ratios of green roofs against conventional roofs are analysed to assess the hydrological impact of this type of SUDS at the city scale.
2. Materials and Methods
2.1. Site Description
The study site is located in Benaguasil, which is a Mediterranean city 25 km inland from the city of Valencia, on the eastern Mediterranean Spanish coast. With a mild and semi-arid climate, Benaguasil has an average annual rainfall of 430 mm, with very strong seasonality. Similar to many Mediterranean cities, it experiences very high peak rainfall intensities that are concentrated in short intervals of time, which together with city characteristics such as large impermeability makes urban stormwater management difficult. The average temperature in Benaguasil is around 17 °C, (10 °C in January, and 25 °C in August). This climate regime differs significantly from that of the more northern and temperate climates where SUDS originated. In addition, the lack of experience justifies the need to monitor SUDS in the Mediterranean in order to provide evidence of their performance and tools for engineers and practitioners to properly design and manage the systems.
Nowadays, Benaguasil tackles three major issues in terms of urban water management: frequent pluvial flooding and backup flows from overloaded combined sewers, pollution of watercourses from combined sewer overflows (CSO), and high-energy consumption. Since the solution could not come only from a higher capacity of conveyance and treatment facilities, the Municipality of Benaguasil started to switch the paradigm, understanding that a more nature-based approach to face urban water management might be needed [
24].
Within this context, the Municipality of Benaguasil retrofitted a 315 m
2 green roof in 2014 in a public building [
25]. Experience in setting up green roofs in Spain is still scarce, especially when focussing on their filtrated water quality performance. To avoid previously observed problems [
26], a mineral soil that was poor in nutrients and without brick debris was used. To preserve the drainage capacity of the soil and reduce the runoff colour and turbidity, volcanic gravel (40%) and silica sand (20%) were mixed in the substrate. The remaining 40% corresponded to compost substrate. Organic matter constituted only 13.3%, total nitrogen constituted 0.06%, and phosphorus constituted 0.04%. The nitrogen and phosphorus content fulfils the requirements adopted in the German guidelines for the planning, execution, and upkeep of green roofs [
27]. Organic matter is slightly higher than the maximum amount recommended, but it is over half the amount used in previous experiences. With this composition, washing effects were expected to be reduced during the start-up period of the infrastructure.
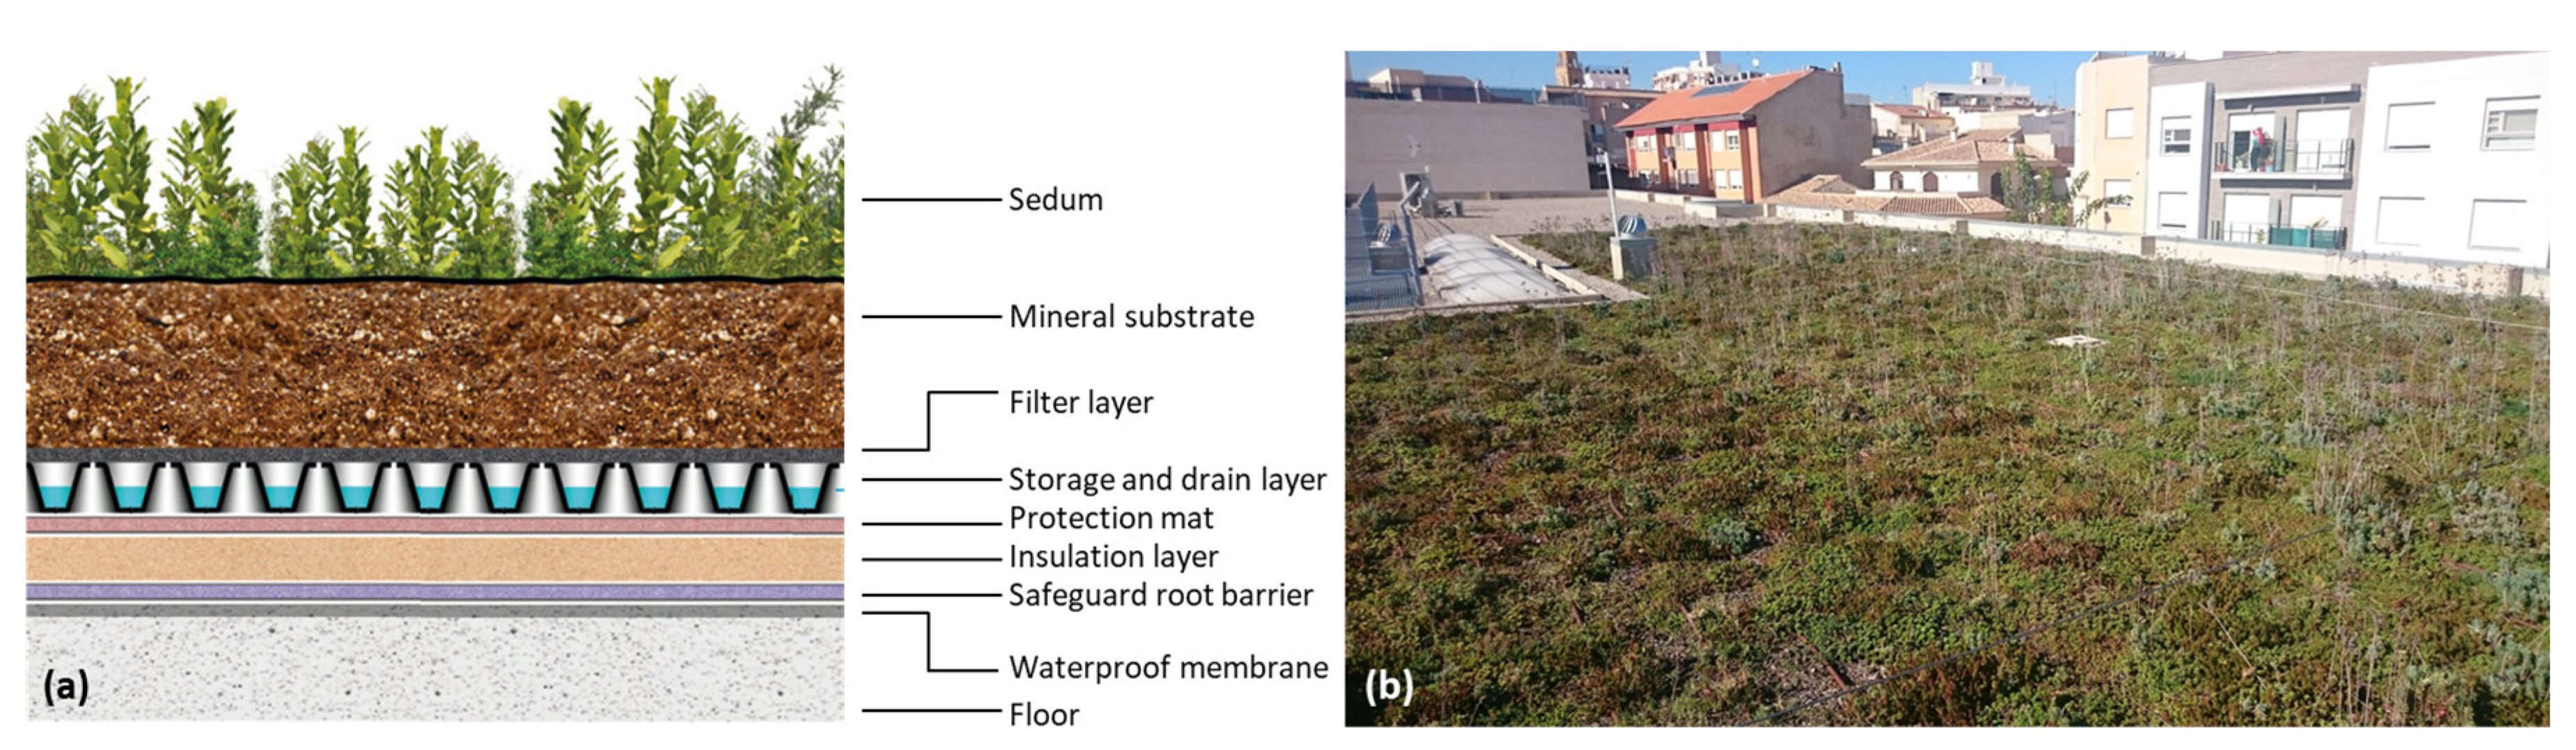
Figure 1 shows the retrofitted green roof and its different layers. The soil layer is 100-mm thick over a storage and drainage plastic layer (25-mm thick). Vegetation consists of a mixed sedum composed of 20%
album, 18%
acre, 34%
floriferum, 17%
spurium, 3%
rupestre, 3%
sediform, and 5%
sexangulare. Sedums represent one of the most utilised species in green roof surfaces [
28]. The previous non-retrofitted roof consists of a conventional inverted flat roof with a standard gravel layer. The inverted roof typology is characterised by a thermal insulation layer over the waterproofing membrane. The thermal insulation layer is protected by a geotextile, and finally, on the top, a 4–5 cm layer of gravel completes the conventional roof section.
2.2. Hydrometeorological Data Collection
The monitored period lasted from June 2014 to June 2015. A Detectronic rainfall gauge (0.2-mm accuracy) with a Bühler Montec datalogger was installed near the green roof. A continuous rainfall record was obtained with a two-minute time interval aggregation. For the same period, the flow rate through the downpipes of the green roof was monitored with a tipping bucket flow gauge. To compare the green roof performance against its previous cobbled conventional situation, flows generated by its nearby non-retrofitted conventional roof (with an area of 240 m2) were also monitored. Hydrographs recorded during this period were used to calibrate and validate the hydrological model.
To analyse the long-term green roof efficiency, a long historical rainfall series is needed. For the analysis developed in this paper, high-resolution rainfall records for the period 1990–2006 in Valencia were available. Data corresponded to a five-minute resolution rain gauge located at the Júcar river basin hydrological service headquarters. Data verification and validation were performed before this study by daily comparison with the Spanish Meteorological Agency observations, as well as monthly and annual accumulation comparisons with nearby rain gauge stations [
29].
Finally, the hydrological model requires evapotranspiration data to accurately represent the soil moisture content during the simulation period, and especially at the beginning of a rainfall episode. Evapotranspiration data were obtained from the Spanish Ministry of Agriculture through its agroclimatic information system for irrigation [
30]. This system provides data for the potential evapotranspiration (ET
0) and the crop coefficient (K
C), whose product yields the real evapotranspiration (ET). Data corresponds to daily averaged values from data recorded since 1999 at the nearby Moncada station (IVIA, Valencian Institute for Agricultural Research); crop coefficient corresponds to pastures (
Table 1). Although some authors have highlighted the sensitivity of green roof hydrological modelling to evapotranspiration [
11], the influence of this variable is much more negligible under semi-arid conditions, provided that long dry inter-event periods are expected to occur, so the soil layer is likely to be dry at the beginning of each rainfall episode.
2.3. Hydrological Model
The Storm Water Management Model (SWMM v.5.1.012) [
21] was used to model the hydrological response of the green roof and the adjacent conventional roof in Benaguasil. The latest releases of SWMM have implemented the LID (Low-Impact Development) module to simulate the hydrological performance of SUDS such as permeable pavements, bioretention areas, rain gardens, infiltration trenches, vegetative swales, green roofs, and rooftop disconnections. Many authors have shown the potential of the LID module to model SUDS performance [
11,
31,
32,
33].
Nevertheless, many difficulties arise when trying to calibrate and validate a hydrological model using the LID control module. Only focussing on the green roof SUDS type, 14 parameters are needed to characterise the three layers that define the infrastructure: surface (berm height, vegetation fraction, and surface roughness), soil (thickness, porosity, field capacity, wilting point, saturated conductivity, conductivity slope, and suction head) and drainage mat layer (thickness, void ratio, and roughness). This high number of parameters has a direct impact on the results’ uncertainty when using this module. As concluded by Peng and Stovin [
11], as many parameters are required, the model is not generic, and many uncertainties exist in estimating the values of the parameters. Some processes in the response of real green roofs are not well represented using the SWMM LID module: more robust retention and detention models are required. The authors concluded that the LID module in the SWMM could represent the hydrology of runoff from the green roof only after calibration.
Many factors may influence the detention modelling of the green roof, but the drainage layer parameters have been shown to influence the peak runoff the most, while the conductivity slope influences the smoothness of the runoff profile. Burszta-Adamiak and Mrowiec [
22] also proved that the LID module model has limited capabilities in correctly simulating the hydrograph of storm water runoff from green roofs. The model tends to significantly overestimate the maximum flow rates, while its attempts to calibrate the model to the maximum flow rates lead to a significant underestimation of the generated volume of storm water runoff. Rosa et al. [
32] demonstrated that uncalibrated SWMM simulations, using parameter values found in the literature and measured in the field, underestimated the runoff from an LID watershed.
These findings represent a barrier to the use of the LID module for planning and designing objectives under uncalibrated circumstances. A more robust model is desirable to minimise uncertainty. Thus, the aim of this work is to set up, calibrate, and validate a hydrological runoff model that is as simple as possible to minimise uncertainty, but robust enough to accurately represent the hydrological performance of the green and the conventional roofs for comparison. Although the Soil Conservation Service–Curve Number (SCS-CN) model [
34] was not preliminarily developed for urban areas, it has been successfully used within this context [
35,
36]. The SWMM allows runoff production to be modelled by using the SCS-CN model.
Table 2 shows the data and initial values of the parameters that were used to set up the model.
2.4. Calibration and Validation of the Hydrological Model
The hydrological model is calibrated and validated for the green roof and the conventional roof configurations. The calibration and validation procedure consists of comparing the modelled and recorded hydrographs at the outlets of both roof downpipes. The results in SWMM are obtained with a 10-min time interval. The parameters to be calibrated and validated are those shown in
Table 2, and initially estimated according to other references: surface roughness, depression storage, and curve number (CN).
To quantify the hydrological model goodness-of-fit, the Nash–Sutcliffe Efficiency index (NSE) is calculated to assess the model accuracy in replicating the recorded outflow hydrographs [
37]. In addition, the total runoff volumes that were modelled and recorded per rainfall event are compared to assess the model performance in volumetric terms.
2.5. Continuous Simulation at Building and City Scales
Once the building scale models (green roof and conventional roof) are calibrated and validated, the historical long rainfall series is modelled to assess the long-term hydrological performance of both roofs. Thus, the green roof efficiency in terms of runoff reduction can be compared to the conventional roof. Runoff per rainfall event is extracted from the continuous simulation results, and the cumulative probability functions are inferred. Then, the percentiles of runoff generated by both roofs are finally deducted.
This paper is focussed on assessing the effect of green roofs at the city scale. For this purpose, a hypothetical urban area representative of the study site conditions is considered and modelled in the SWMM with the historical long rainfall series. Four land uses are considered to characterise the subcatchments: roads, conventional roofs, green roofs, and permeable areas (gardens and parks). To assess the effect of green roofs compared to conventional roofs, three scenarios are considered by varying the ratio of the subcatchment area covered by both types of roof. The percentages of roads and permeable areas are constant and representative of the region’s dense towns and cities (
Table 3). Scenario A represents a conventional land-use distribution in a densely urbanised area of the region. Scenarios B and C are defined to analyse feasible retrofitting strategies, from conventional roofs to green roofs. Scenario C represents the most ambitious but realistic retrofitting strategy. Scenario B is an intermediate stage between scenarios A and C to better assess the impact of moving from conventional roofs to green roofs. Previously calibrated parameters are used for roads and permeable areas [
35], while the parameters calibrated and validated within this work are used for conventional and green roofs.
3. Results and Discussion
3.1. Hydrometeorological Data
Seventeen rainfall events were recorded during the monitored period (
Table 4), totalling 381.7 mm. This annual total amount of rainfall is slightly lower than the annual average rainfall amount for Benaguasil, according to the Spanish meteorological agency. Rainfall volumes per event (V) highlighted the strong seasonality and irregularity of the Mediterranean climate; events from 3.2 mm to 125.2 mm occurred during this period. The average rainfall amount per event was 23.8 mm, and the standard deviation for the monitored period was 34.4 mm. Regarding the maximum 10-min intensities (I
10), maximum records were experienced in autumn (45.6 mm/h and 52.8 mm/h), as expected according to the probable convective events occurrence during that season. Nevertheless, a noticeable event (long and intense) occurred in March. The duration of each event (D) is also shown in
Table 4.
The runoff volumes (RCR for the conventional roof and RGR for the green roof) and hydrological efficiencies (ratio between the detained volume and the rainfall volume; HECR for the conventional roof and HEGR for the green roof) are presented for each event. All of the recorded events produced runoff in the conventional roof (RCR). The hydrological efficiency of the conventional roof (HECR) ranged from 1% for the greater events to 75% for the lower ones. Regarding the green roof, five events out of 17 (29.4%) did not produce runoff (RGR = 0 mm; HEGR = 100% hydrological efficiency). For the events that produced runoff, the hydrological efficiency of the green roof ranged from 53% to 93%. The average values of hydrological efficiency during the whole monitored year were 13% for the conventional roof and 65% for the green roof.
3.2. Calibration and Validation Results
The calibration and validation of the parameters of the hydrological model in the SWMM have focussed on surface roughness, depression storage, and curve number (CN). The objective functions were the volume error (%) per event (difference between the observed and modelled runoff volume), and the NSE per event, which considers the intra-event progression, especially focussing on the occurrence of peak flows.
Table 5 shows the final values for the calibrated and validated parameters. The conventional roof model finally consisted of an impervious surface (CN = 100) where only depression storage (1.5 mm) affected the rainfall–runoff transformation. Surface propagation kinetics were well performed with a 0.12 roughness coefficient value. The green roof model consists, as expected, of a pervious surface with CN = 85 and no depression storage. This may seem counterintuitive; nevertheless, rainfall losses are accounted for through the infiltration mechanism, as described by the SCS method.
The calibration data set was composed of 11 events (65%) whereas the other six events (35%) were used for validation. The criteria to select calibration and validation events consisted of having, in both sets, a representative sample of all of the events recorded according to their duration, rainfall volume, and maximum intensity.
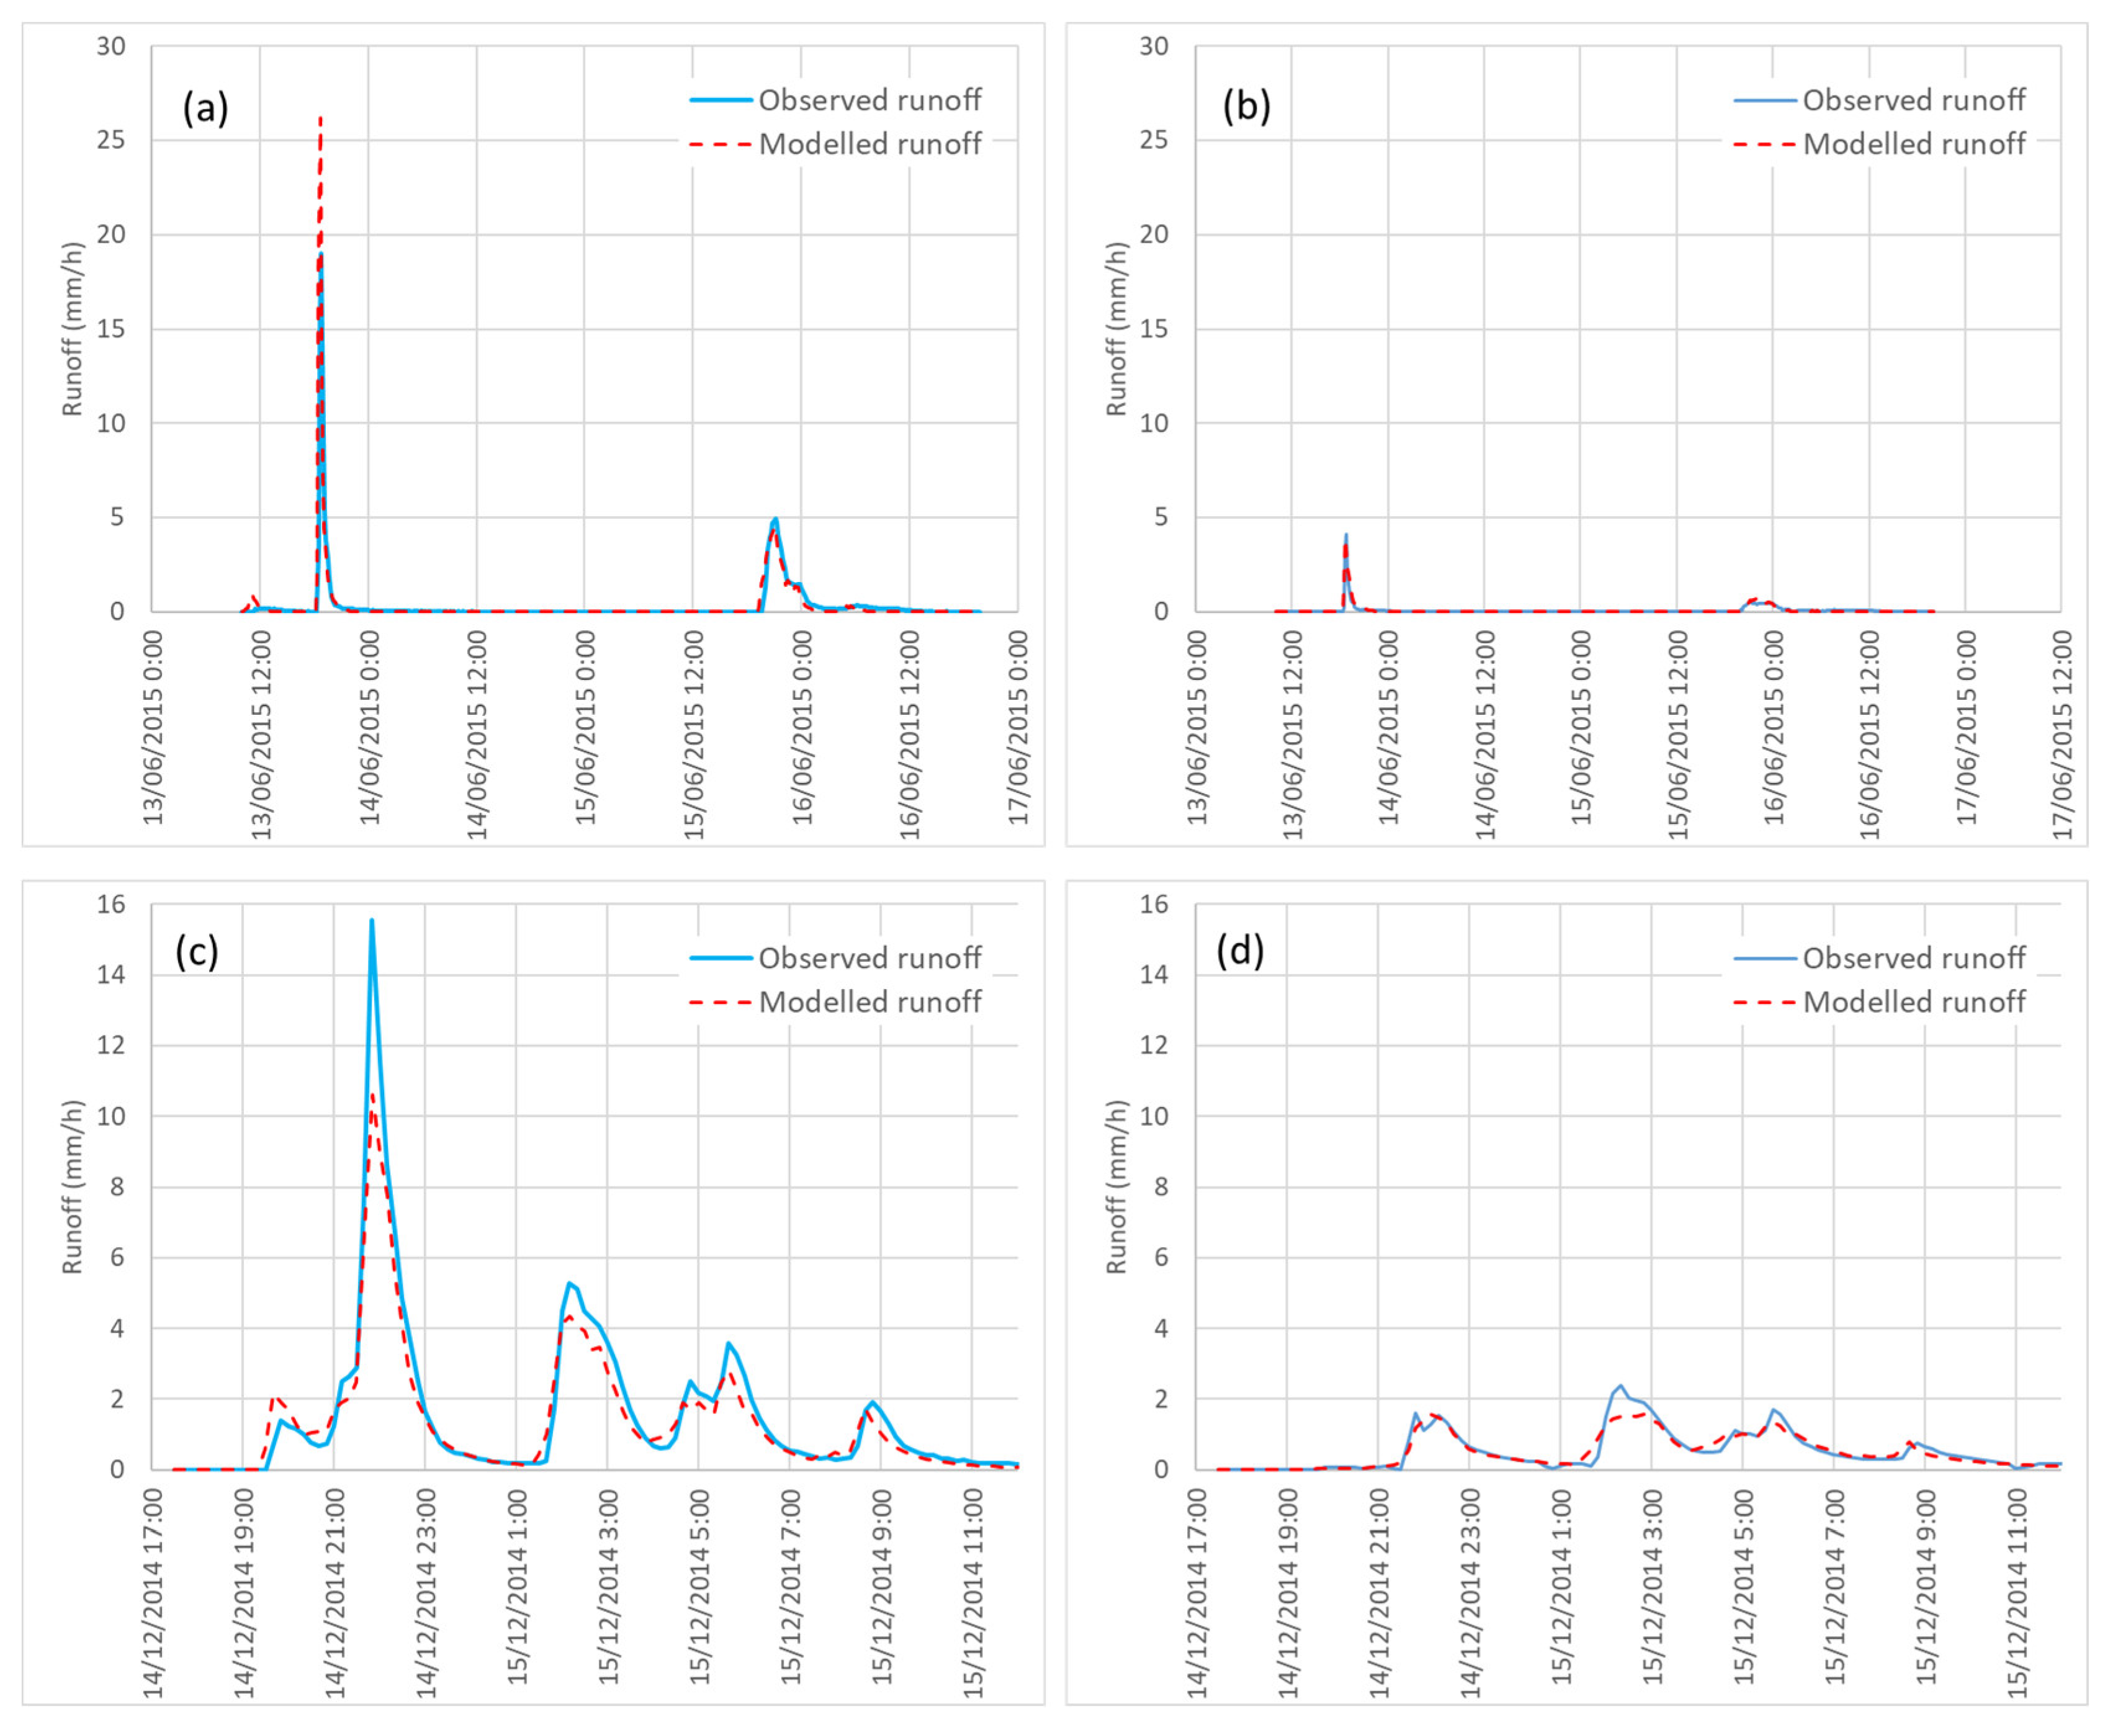
Figure 2a,b show the results for the calibration event recorded on 13 June 2015.
Figure 2c,d show the results for the validation event recorded on 14 December 2014. The model reproduces the runoff kinetics in both roofs well, although peak flows were not always quantitatively reproduced well.
Table 6 shows the complete summary of the model calibration and validation results. Events used for calibration (C) and validation (V) are indicated. Observed (Obs.) and modelled (Mod.) runoff volumes are compared through the volume errors. The Nash–Sutcliffe Efficiency indexes (NSE) are also calculated for each event.
Regarding the conventional roof model, volume errors ranged from −20.1% to 58.1%. The latter corresponds to the smallest event recorded (3.2 mm of rainfall and 0.8 mm of runoff), so a high uncertainty is expected to occur. If we focus on the next event, the maximum volume error falls to 35.4%. The overall volume error for the calibration set is 0.4%, whereas for the validation set, it is –8.0%. For the calibration set, the NSE indexes ranged from negative values (small events) to 0.93 (the average NSE for the calibration set is 0.66); for the validation set, the results were better, and the average NSE is 0.89.
The green roof model performs poorer. Events 3, 11, 12, 13, and 14 are rejected for direct calibration and validation, as they did not produce runoff. They are only considered in the preliminary screening of a feasible range of parameters. Volume errors ranged from −68.5% to 66.4%. The overall volume error for the calibration set was 1.3%, whereas for the validation set, it was −16.5%. For the calibration set, the NSE indexes ranged from negative values (small events) to 0.90. Nevertheless, the average NSE for the calibration set fell to 0.36; for the validation set, better indexes reached 0.91, whereas the average NSE was 0.31. In this case, the differences were due to a weakness in the green roof hydrological model. As highlighted before, evapotranspiration can strongly affect the green roof hydrological response, whereas our ET data comes from the nearby Moncada weather station. Further research must focus on a better estimation of variables affecting evapotranspiration, and consequently soil moisture.
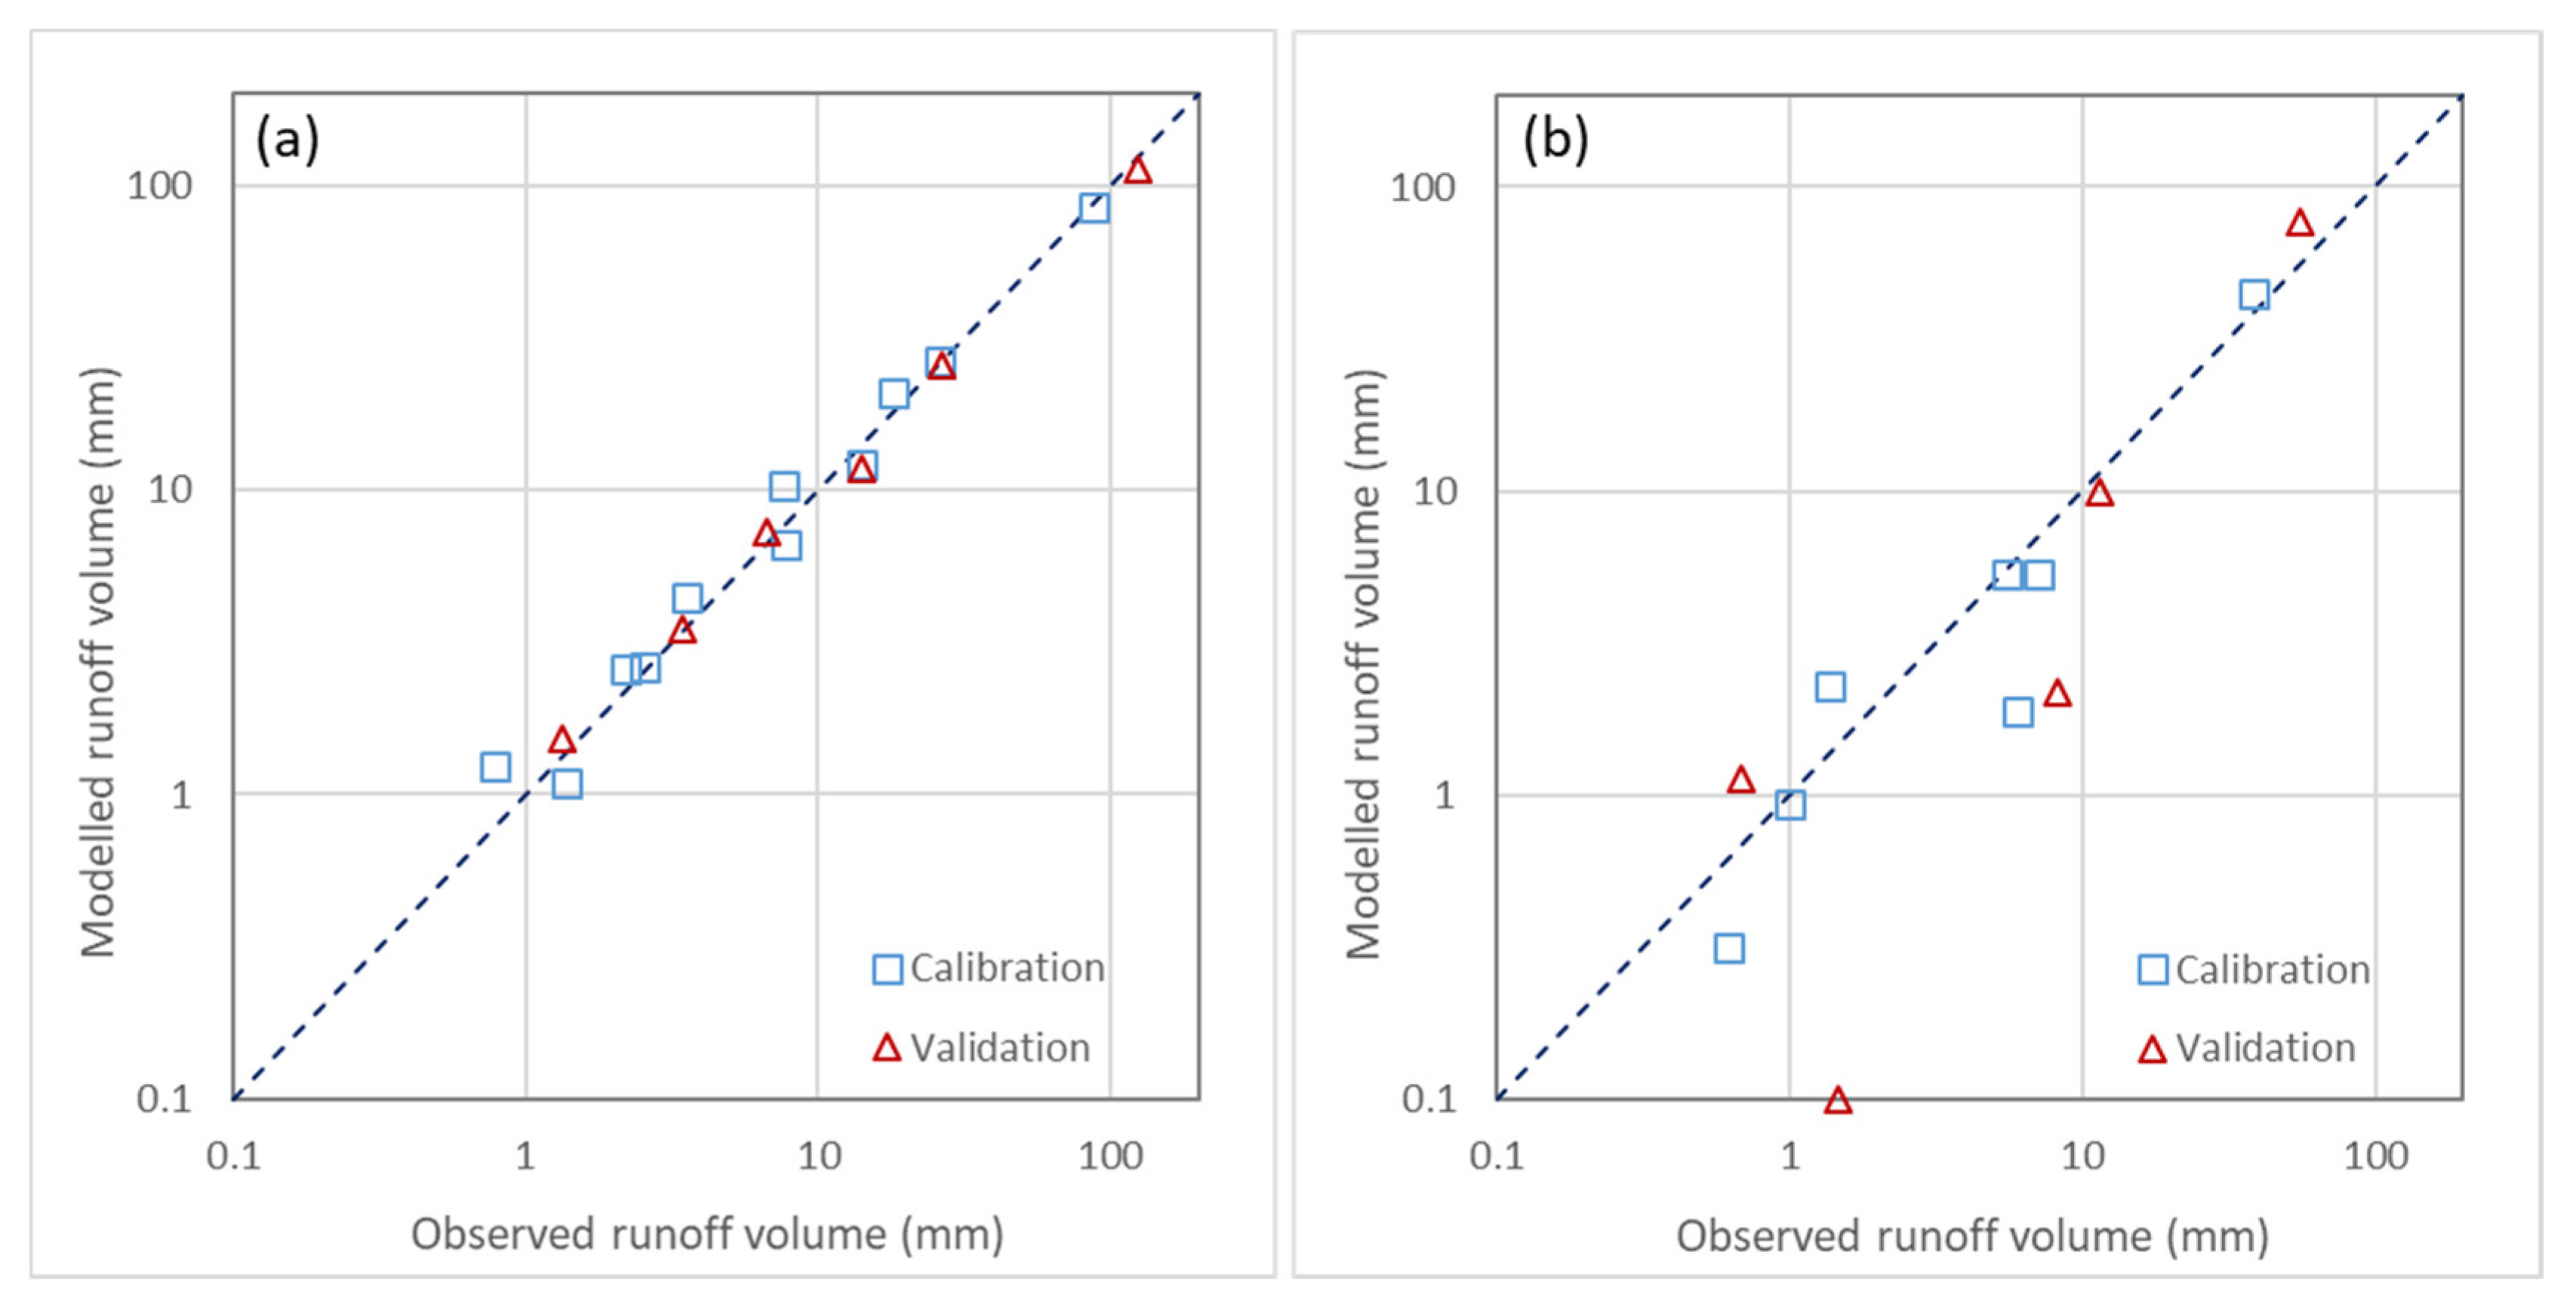
Figure 3 compares the modelled runoff volumes against the observed ones for the conventional roof and the green roof. The Pearson correlation coefficient is 0.99 for the conventional roof (calibration and validation) and 0.98 (calibration) and 0.97 (validation) for the green roof.
3.3. Comparison of Green Roof and Conventional Roof Hydrological Efficiency at the Building Scale
The long-term green roof efficiency is analysed by simulating the 1990–2006 historical rainfall series. According to Andrés-Doménech et al. [
35], 464 events occurred within this period, which yields an average of 27.3 events/year. The percentiles of rainfall volumes are represented in
Figure 3. The 80% rainfall volume percentile is 19.2 mm, whereas the 90% rainfall volume percentile is 32.8 mm. These percentiles are required in many SUDS design procedures [
5,
38].
The calibrated and validated SWMM for the conventional and the green roof are simulated with this long rainfall series. In total, 398 events produced runoff in the conventional roof (23.4 events/year), whereas 295 events produced runoff in the green roof (17.4 events/year). In terms of occurrence, at the building scale, 36% of rainfall events were completely detained (no runoff occurs) by the green roof, whereas the conventional roof only fully detained 14% of the registered events. The cumulative rainfall amount during the period 1990–2006 was 6505 mm. Regarding the long-term hydrological efficiency, the cumulative runoff from the conventional roof was 5300 mm (HECR = 18.5%), whereas the cumulative runoff from the green roof fell to 2136 mm (HECR = 67.1%). These values are similar to those registered during the monitored period. The average runoff coefficients (total runoff over total rainfall) were 0.81 for the conventional roof and 0.33 for the green roof. These percentages are of paramount interest for design purposes within the region.
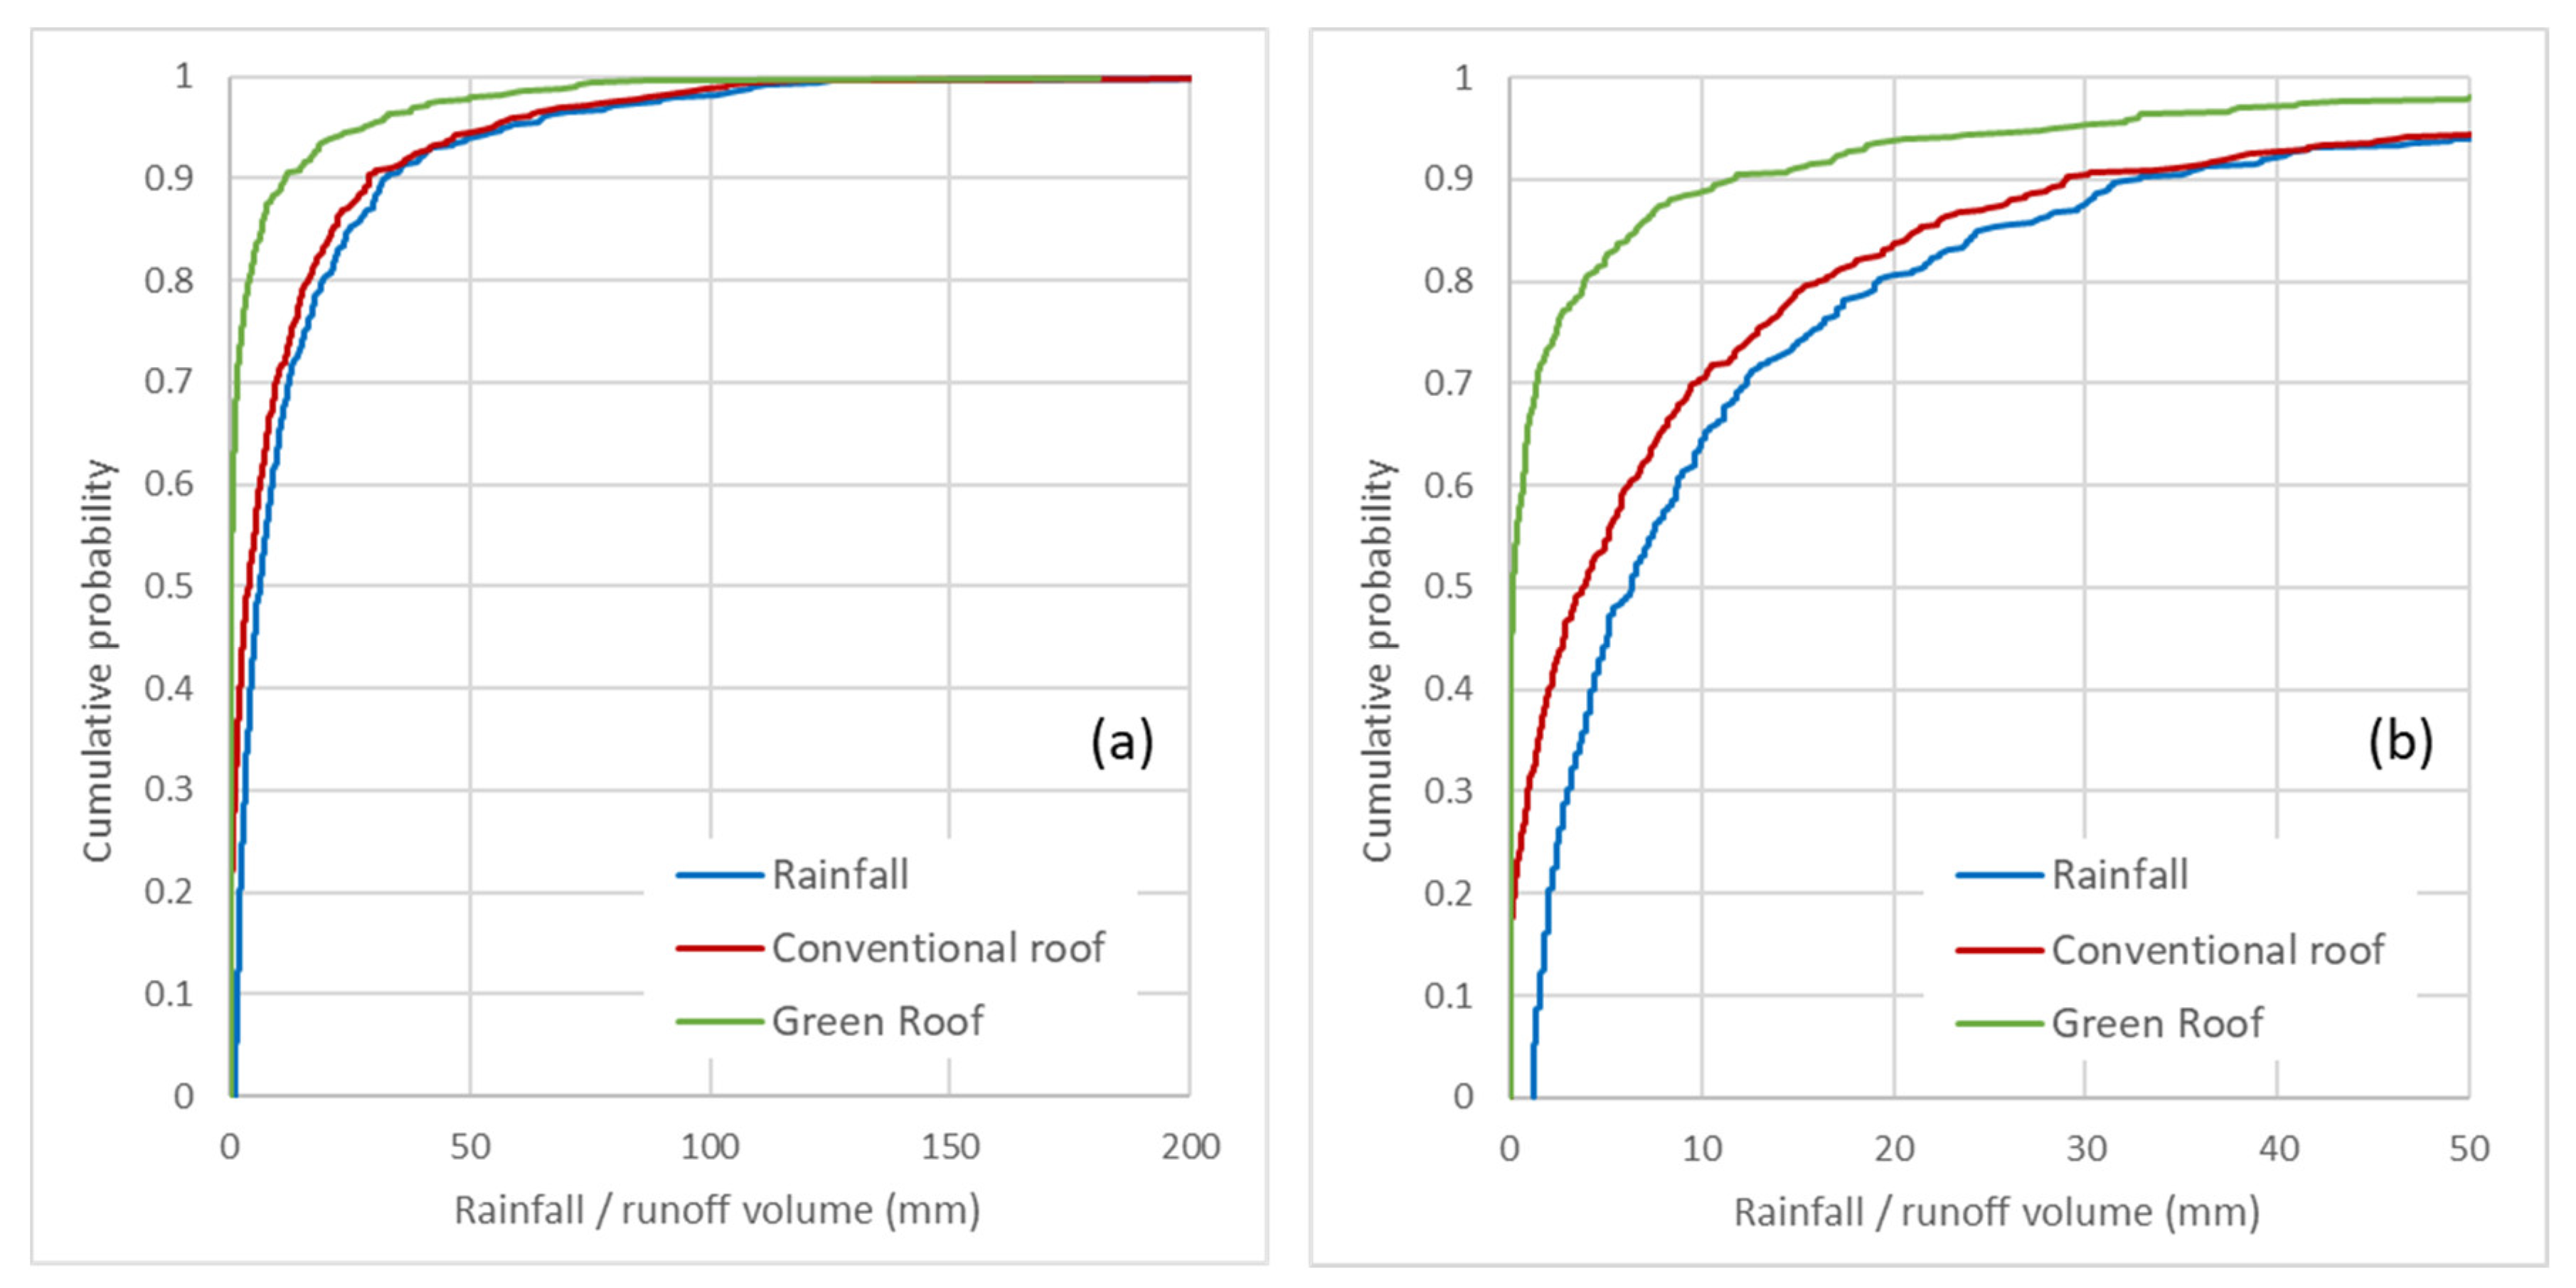
Figure 4 shows the cumulative distributions of rainfall volumes, conventional roof runoff volumes, and green roof runoff volumes. The green roof completely smoothens the rainfall regime at the building scale. The 80% percentile of the rainfall regime fell to 3.9 mm (–79.7%), whereas the 90% percentile of the rainfall regime fell to 11.7 mm (–64.3%). These variations for the conventional roof were −11.8% and –15.6%, respectively. The results demonstrate the high potential of green roofs to manage runoff at the source from a hydrological perspective.
3.4. Effect of Green Roofs on Hydrological Efficiency at the City Scale
Scenario A represents the baseline to compare the effect of green roofs on the hydrological efficiency at the city scale.
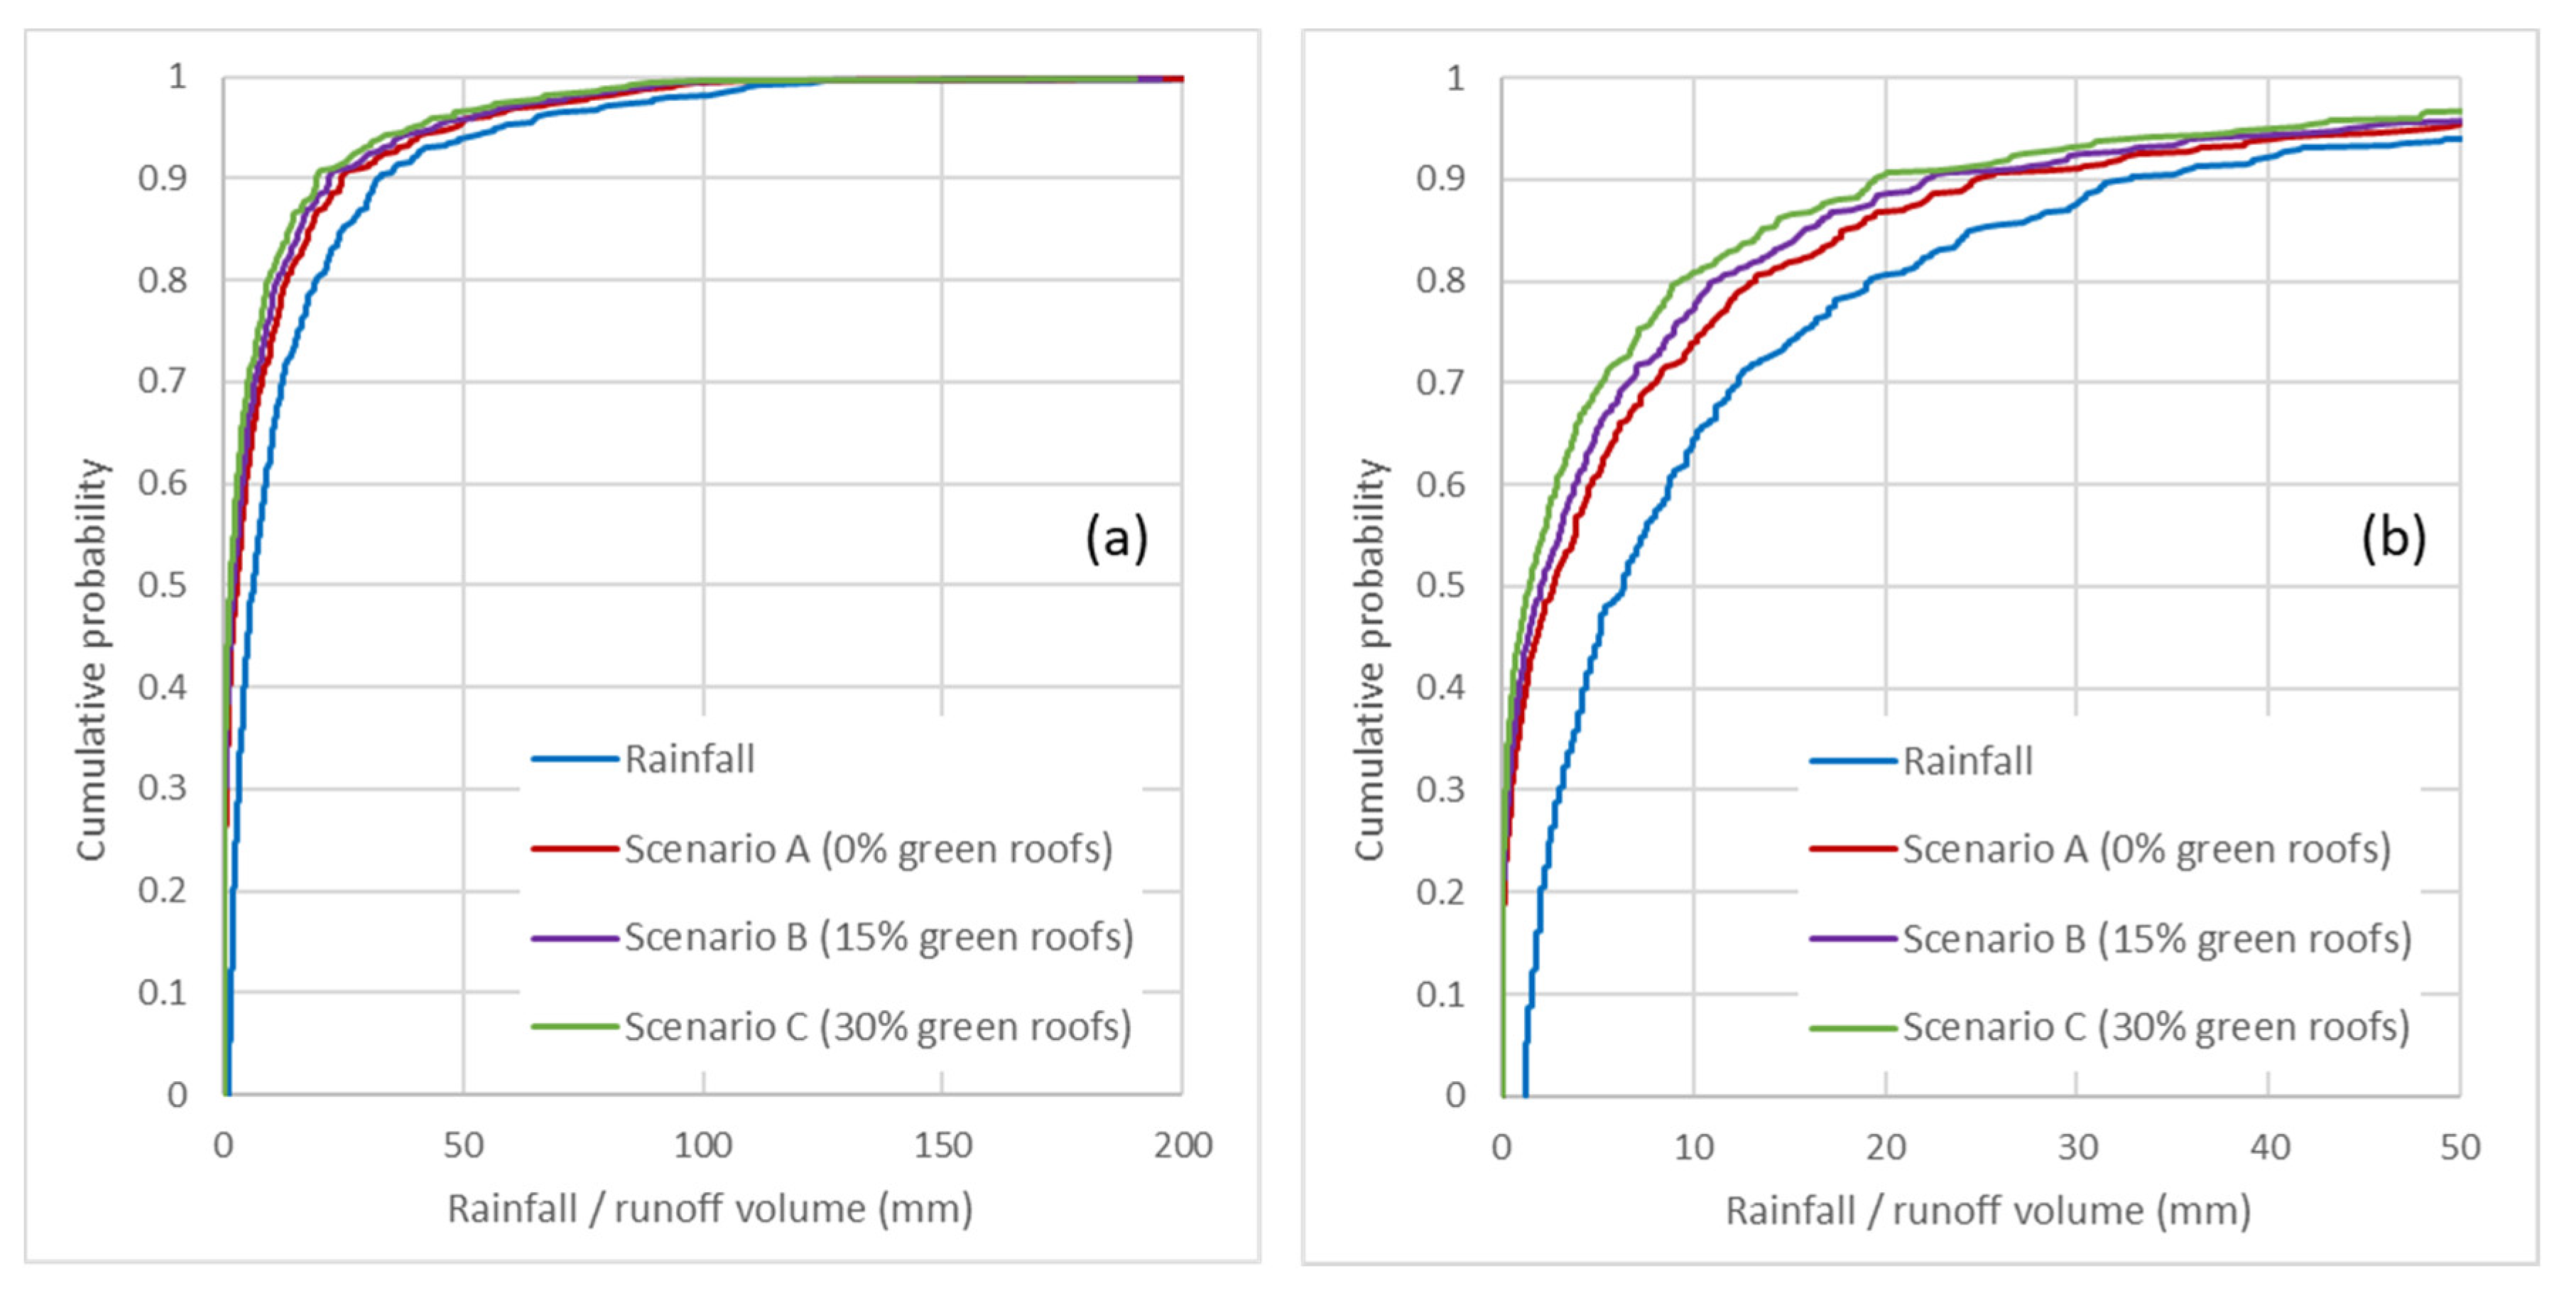
Figure 5 shows the cumulative distributions of rainfall volumes and runoffs for scenarios A, B, and C. As expected, the influence of green roofs at the city scale is much more moderate than at the building scale. Nevertheless, their contribution to reducing the magnitude and frequency of runoff volumes is noticeable: the 80% runoff percentile for scenario A is 13.2 mm, whereas it is 11.2 mm (–15%) for scenario B and 9.4 mm (–29%) for scenario C; the 90% runoff percentile for scenario A is 24.7 mm, whereas it is 22.2 mm (–10%) for scenario B and 19.5 mm (–21%) for scenario C. The contribution of green roofs to reducing the 90% runoff percentile is relevant. As stated before, many SUDS manuals recommend managing the 90% rainfall percentile to adequately manage water quality through the SUDS treatment train. As a source technique, green roofs only represent the upstream side of the treatment train (together with permeable pavements, rainwater harvesting, etc.); hence, combination with other types of SUDS to complete the system is needed to achieve the objective of completely managing the 90% rainfall percentile.
In terms of hydrological performance, the cumulative runoff volume within the period 1990–2016 is 4478 mm for scenario A, 4012 mm for scenario B, and 3511 mm for scenario C. Thus, the average runoff coefficients (total runoff over total rainfall) for the city scale are, respectively, 0.69, 0.62 (–10%) and 0.54 (–22%). These results demonstrate the high potential of this type of SUDS to manage runoff at the source.
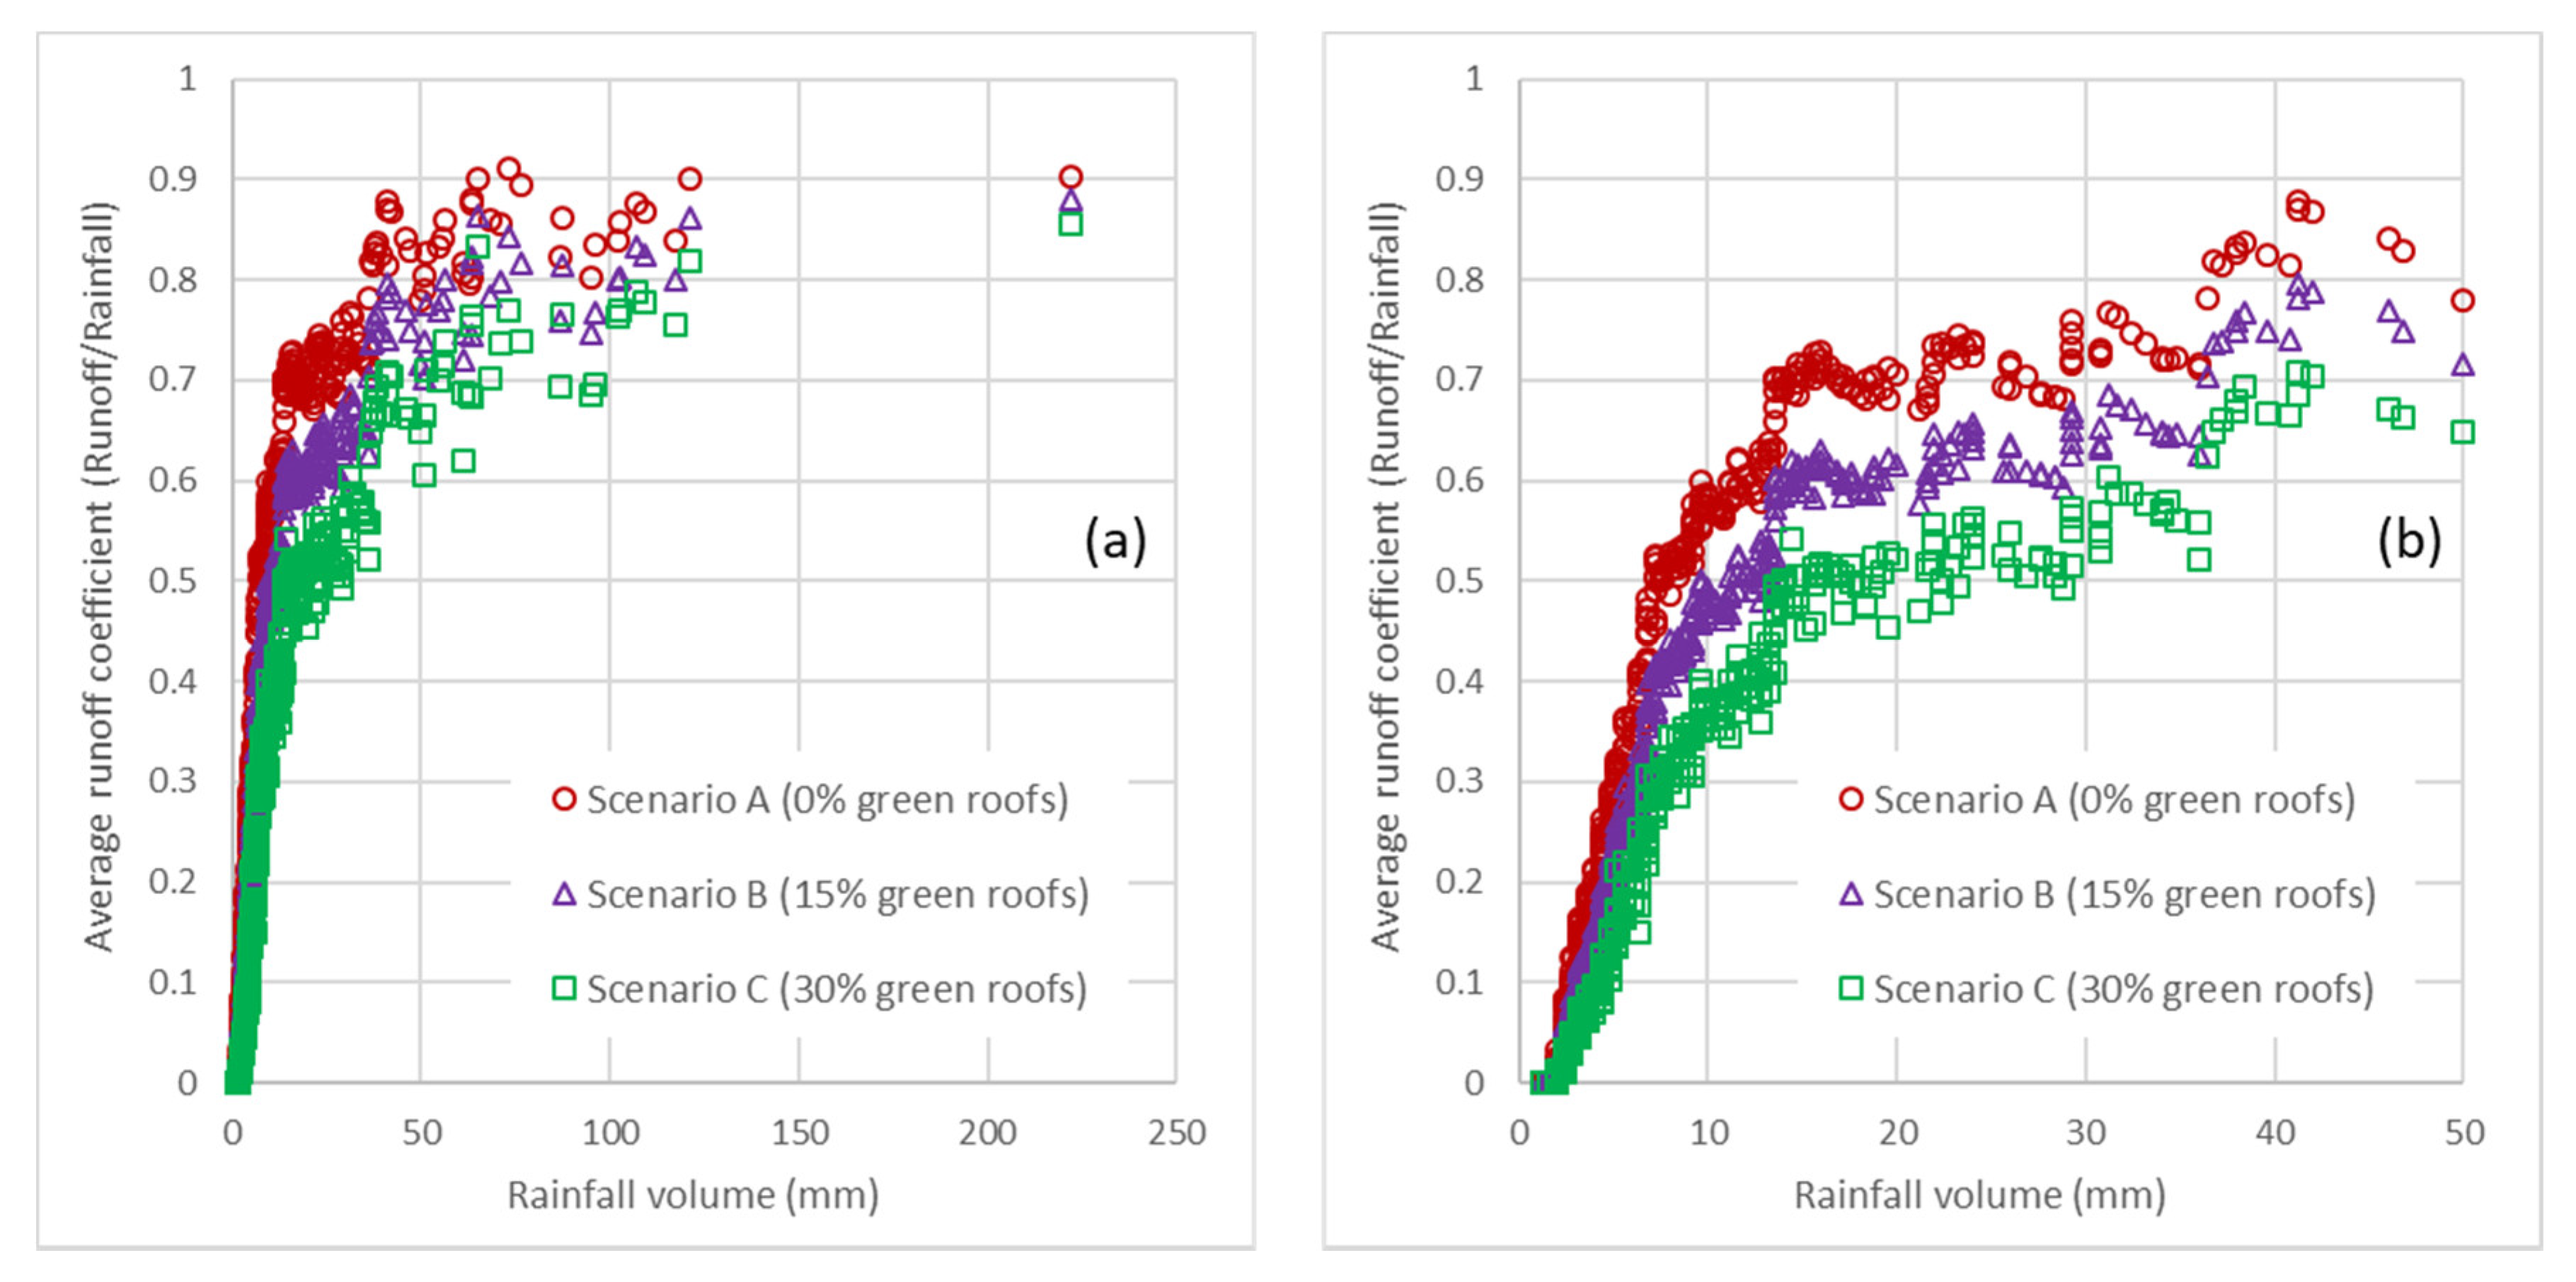
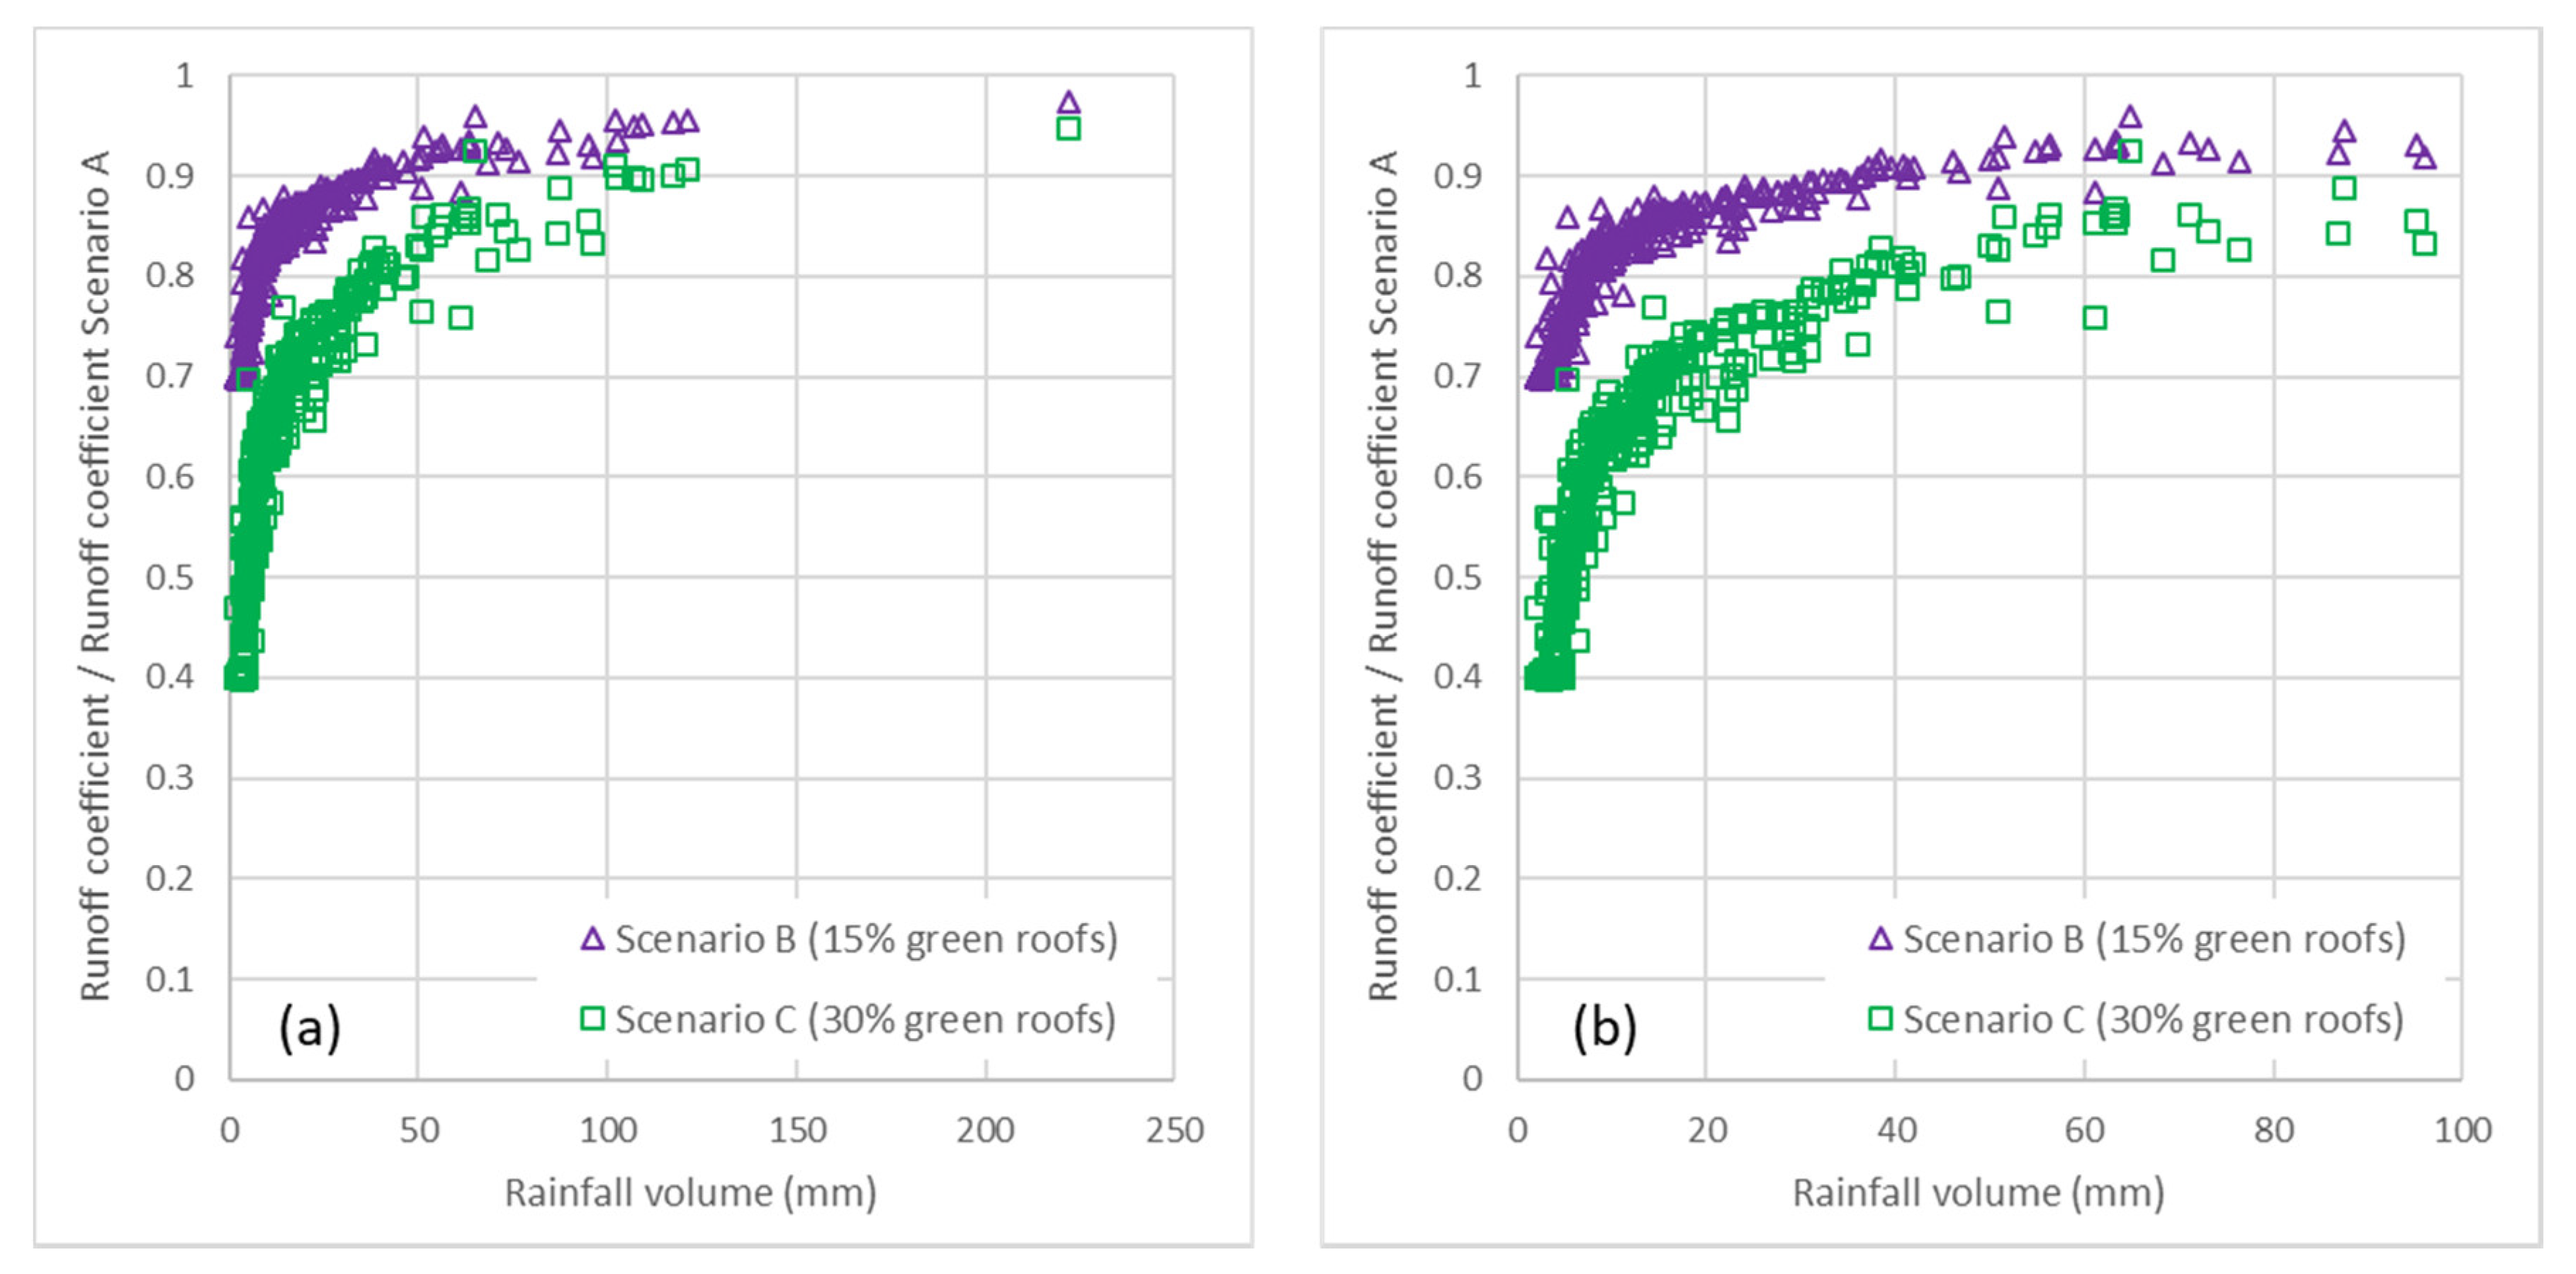
Figure 6 shows the averaged runoff coefficient for scenarios A, B, and C. The results show that the runoff production reduction is not constant for the complete rainfall range. In addition, the graph shows a change in the trend curves of around 15–20 mm, underlining the effective range of rainfall that can be controlled by the green roof is under this threshold. To better analyse this point,
Figure 7 represents the evolution of runoff coefficients for scenarios B and C divided by the corresponding runoff coefficient for scenario A (which is considered the baseline for the comparison). The graph highlights the range where green roofs represent a high contribution for runoff control at the source. For small rainfall events (1–10 mm), runoff coefficients for scenario B are 70–80% of those for scenario A, whereas for scenario C, they are 40–60% of those for scenario A. These differences are the consequence of considering different ratios of green roof surface in each scenario. Nevertheless, the runoff coefficients are more and more similar as rainfall volumes increase. For rainfall events greater than 15–20 mm, the runoff coefficients evolution begins to stabilise, and both scenarios tend show a similar hydrological behaviour. As expected for larger rainfall volumes, runoff coefficients tend to 1, and the differences between scenarios disappear. This evolution was expected to occur as for high rainfall volumes, the hydrological effect of green roofs at the city scale becomes less important: the retention capacity of the green roof is exceeded, and consequently, the hydrological response of the urban catchment increases the runoff rates.
4. Conclusions
Green roofs have been demonstrated to be an effective type of SUDS for managing runoff at the source. Nevertheless, evidence of their hydrological performance is still scarce in the Mediterranean. The results achieved after one year of monitoring in Benaguasil (Spain) are inspiring, provided that high hydrological efficiencies are also obtained, such as those widely reported for more wet climates.
The hydrological modelling of green roofs is complex; the high number of parameters needed to represent flows and storage through the different layers usually makes these highly physically-based models less robust. The calibration and validation of the SCS-CN model to the recorded data provide good results in terms of volumetric response and long-period performance. Nevertheless, the model does not achieve good performances regarding the peak flow representation. Despite this loss of precision, one of the challenges of this research was to prove whether a simple hydrological model was able to adequately represent the green roof response. The results demonstrate a good performance and consequently, the potential of using simple models when calibration is unfeasible. The calibrated parameters herein could be used in new green roof projects under similar climatic and design conditions. Further research must focus on a better estimation of variables affecting evapotranspiration, and consequently, soil moisture.
The impact of a green roof at the building scale in the hydrological response is positive. The long-term modelling reinforces the results obtained during the monitored period: the hydrological efficiency of the green roof is high, and the cumulative probabilities of runoff volumes are significantly reduced regarding those produced by a conventional roof. The analysis at the city scale also provides promising results. Results show that the effective range of rainfall that can be controlled by the green roof is around 15–20 mm, which corresponds with the most frequent rainfall events. The average runoff coefficients at the city scale under Mediterranean conditions can be considerably reduced by considering the feasible ratios of green roofs. If half of the current conventional roofs were retrofitted to green roofs, runoff coefficients would be reduced to below 75% of the current ones for the frequent rainfall events. These hydrological benefits, when added to other reported benefits of green roofs, make this type of SUDS a promising solution to face urban challenges caused by climate threats.

 ,
, 


