Article

Assessing the Potential of Rural Settlement Land Consolidation in China: A Method Based on Comprehensive Evaluation of Restricted Factors

1
Institute of Remote Sensing and Digital Earth, Chinese Academy of Sciences, Beijing 100101, China
2
University of Chinese Academy of Sciences, Beijing 100049, China
*
Author to whom correspondence should be addressed.
Sustainability 2018, 10(9), 3102; https://doi.org/10.3390/su10093102
Submission received: 7 August 2018 / Revised: 26 August 2018 / Accepted: 26 August 2018 / Published: 31 August 2018
(This article belongs to the Section Sustainable Urban and Rural Development)

Abstract

:
Rural settlement land consolidation potential calculation is the basic work of land consolidation. An accurate potential is essential to rural development planners and policy makers as a project target or prediction. The traditional calculation methods include the per capita/household construction land method, idle rural residential land method, and comprehensive evaluation method. Though there have been some improvements, the potential for calculation methods on a national level is still limited. This article illustrates a new method for calculating the consolidation potential of rural settlement land, based on field data and the restructuring restrictions applicable to each rural land parcel in China. The field data was from Shandong Province because it lies within the country’s biggest grain-producing area with the largest distribution density of rural settlements. It is an excellent representative sample for rural settlement land consolidation, offering a microcosm of rural development in China. For the study’s comprehensive evaluation system, due to the lack of nationwide field survey data, the potential of Shandong Province was chosen as the standard value. We selected indicators concerning land resources, depopulation, transportation accessibility, local economic development, urbanization, and natural conditions to build an evaluation system. We then calculated the potential of each province according to their coefficients and field data from Shandong Province. Every province except Taiwan (for which no data were available) was divided into five zones for rural settlement land consolidation: the most-suitable zone, suitable zone, general zone, restricted zone, and most-restricted zone. The total rate of land consolidation is estimated at 0.24 for 2010 and forecast at 0.33 for 2020, while those years’ respective consolidation potentials are 32,777.92 km2 and 44,707.81 km2. The rate is the total rural settlement land before land consolidation divided by added cultivated land after consolidation. The higher the rate, more effective the land consolidation is.

1. Introduction

China is pursuing rapid urbanization—leading to tremendous economic growth, social improvement, and environmental changes—and also encouraging more farmers to move to urban areas and cities. Therefore, China’s rural areas are undergoing a transition [1]. Rapid urbanization is causing changes in rural land use, rural-to-urban population migration, and increasing exploitation and utilization of natural resources [2]. Indeed, unprecedentedly massive rural-to-urban migration is a significant result of China’s economic reform and rapid urbanization over the past three decades [3]. Thus, economic development and urbanization are the major causes of rural population decline [4], confronting China with the dilemma of an increasing urban population and decreasing rural population. Since 1979, more than 500 million people have been added to China’s urban population, of which 78% is attributable to rural-to-urban migrants [5]. According to data released by China’s National Bureau of Statistics, the country’s rural population in 2000 was 808.37 million, which accounted for 63.78% of the total population. By 2010, the rural population had plummeted to 671.13 million, or 50.5% of the total population. The decline continued from 2010 to 2015, by which point the rural population was 603.46 million, accounting for only 43.90% of China’s total population.
Rural depopulation is leading to a distinctive Chinese phenomenon called “village-hollowing” [6]. The hollowed villages have two essential features: (1) a significant loss of land resources; (2) a decrease of village residents [7]. With the improvement in villagers’ incomes, land at village fringes has been occupied to build new houses, while old houses in the inner village have been abandoned but not demolished. Meanwhile, out-migration caused by urbanization has led to the gradual abandonment of dilapidated and empty dwellings in traditional rural areas [8]. With the rising number of abandoned houses and growing depopulation, the rural natural environment has been increasingly destroyed, with the inefficient use and waste of rural land becoming even more serious [9,10]. The most favorable approach to solve the land waste and environment problem is land consolidation.
Land consolidation (LC) can be described as the planned readjustment of land parcels and rearrangement of their ownership according to developing agricultural technology [11,12,13]. The classical form of LC involves changing the land tenure structure and providing the necessary infrastructure [14]. Since 1998, some LC projects were initiated in China with an object of increasing the quantity of cultivated land. Recently, LC in China evolved into a comprehensive consolidation of fields, water, roads, forests, and villages [6]. This article focuses LC on rural settlement land which is defined as land used for village settlements extracted from 30-m resolution remote sensing images [15]. Due to the resolution, a rural settlement land parcel may contain several houses and roads. The need to consolidate rural settlement land is very pressing in China, not only to improve the physical environment, strengthen community ties, and decrease the risk of rural crime, but also to accelerate urbanization. Especially with the deepening of urbanization in China, an increasing amount of cultivated land at the urban fringe is being urbanized [16]. The great demand for urban land is starting to threaten China’s food security and cultivated land protection. Rural settlement land consolidation (RSLC) can reclaim inefficiently used and abandoned residential land, converting it to cultivation to replace urbanized land, it is an effective approach to keep urbanization sustainable. Therefore, the purposes of RSLC is to increase the arable land and solve the problems caused by village-hollowing.
In China, RSLC exists tremendous potential due to the aggravated village-hollowing [17]. The rural settlement land consolidation potential is defined as the amount of land which can be transferred from rural settlement land to other types of land (especially cultivated land) after RSLC. Estimating the potential is an important part of rural restructuring [18,19,20]. This great potential would help achieve a better allocation of land resources between rural and urban and release agricultural land [6].
Calculation of this potential is usually based on the rural population structure, applicable land policy, and the stage and feasibility of consolidation. Several different methods are universally used to estimate the potential, including the per capita/household construction land method, idle rural residential land method, and comprehensive evaluation method [21,22,23]. The per capita construction land method has been the most used according to Code of Classification of Urban Land Use and Planning Standards of Development Land published by Ministry of Housing and Urban-Rural Development of the People’s Republic of China (MOHURD). In this standard, area of per capita construction land is limited from 65 m2 to 115 m2 [24]. However, after extensive investigation of rural consolidation planning, many scholars, experts, and land resources management officials found that this method always overestimated achievable consolidation [25]. Scholars have sought to improve the method by introducing correction factors [26,27] and assuming populations under different urbanization scenarios [17]. However, it remained difficult to accurately calculate consolidation potential on a national scale as outdated county-scale data continued to be used. The idle rural residential land method investigates the area of such land in typical villages, calculating the proportion of idle land to determine the potential of land consolidation [22]. Because a large amount of labor and time is spent on household investigation of idle rural residential land, this method is always used for small areas, such as several villages or counties, but cannot be generalized to national scale. Another limitation of this method is that it ignores the potential of other land in rural settlements, such as pools or threshing fields, therefore always underestimating the land consolidation potential. Finally, the comprehensive evaluation method considers natural, social, and economic factors to evaluate the potential of specific areas [28]. It is used for classifying potential rather than calculating the consolidation potential of specific land.
The methods detailed in the preceding paragraph focus mostly on rural population structure and land policy, taking into consideration the stage and feasibility of consolidation in hollowed villages; however, they hardly consider several factors restricting RSLC, such as geographical features, the status of economic and social development, and land-use/cover change. Yet the economic activities of rural settlements are closely linked to the natural environment: for rural areas and settlements in mountainous or hilly areas with a wide variety of natural conditions, the influence of the natural environment is much greater than it is on urban settlements [29]. There is another key inadequacy of current research on national-scale RSLC: due to the lack of accurate spatial distribution data on China’s rural settlements, the minimum unit for calculating and estimating consolidation is the county scale. It is difficult to obtain a more detailed spatial distribution of rural settlement consolidation potential.
This article’s overall aim is to illustrate a new method for calculating the potential of rural settlement land consolidation, incorporating survey data, spatial distribution data of land use, and the restructuring restrictions for each rural settlement land parcel in China. First, we selected indicators concerning land resources, depopulation, transportation accessibility, local economic development, urbanization, and geographical conditions to build an evaluation system. Second, we collected indicator values for each rural settlement land parcel to generate a series of coefficients for each province. Third, we calculated the potential of each province according to their coefficients and the field investigation data from Shandong Province, because it is an excellent representative sample for rural settlement land consolidation, offering a microcosm of rural development in China.

2. Data and Materials

The methodology comprises the following steps. First, adequate data on rural settlement land use, social-economic development, and the natural conditions were prepared. Second, an appropriate set of indicators for rural settlement land consolidation potential were identified. Third, rural settlement land was divided into five zones and the consolidation potential calculated, building upon the comprehensive indicator system.

2.1. Land-Use Data

Three types of land-use data were used in this research. The land-use data for calculating rural settlement land consolidation potential in Shandong Province was interpreted from 0.25 m resolution aerial photographs. The land-use types were utilized, inefficiently utilized, abandoned, and idle rural residential land; threshing fields; ponds; idle land; and roads [30]. The inefficiently utilized rural residential land means someone is living in the house short time of a year. Abandoned rural residential land means buildings on the ground have been damaged and have lost their residential functions. The idle rural residential land includes (1) those that have an owner but at present there is no long-term ground attachment; (2) and a well-prepared building left unoccupied for a long time. The threshing field is used for rolling, drying, and storing crops or crop straw in rural areas. However, with the improvement of agricultural mechanization, the threshing field is not used for most of the time. Idle land refers to the unused land located behind houses, on the corners of the village, and around ponds. In addition, it has often evolved into abandoned land with garbage.
In province level, the land-use data in 2010, including rural settlement land, cultivated land, and urban land, were retrieved from the National Land-Use/Cover Database of China (NLUD-C). Developed by Chinese Academy of Sciences, NLUD-C contains six first-level and 25 second-level land-use/cover types [15]. This type of data were based on 30-m remote sensing images. Due to the lower resolution, a rural settlement land parcel may contain all the land-use types in village level.
In order to verify the result, we extracted the same land-use types as in Shandong province from 0.5-m resolution images cover 14 villages chosen from different provinces.

2.2. Transportation Data

Though the definition of rural–urban fringe varies between counties, it is consistently regarded as an area combining traditional, agricultural, rural characteristics with an intense impact of urbanization. Land use at the rural–urban fringe gradually shifts from rural settlement to urban communities. This study defined the connection between rural and urban by calculating the distance from a rural settlement to the nearest urban boundaries. It is easy to perform land consolidation in rural settlements at the urban fringe due to urban sprawl. An area can be classified by the one-way travel time along major roads or highways to the nearest urban core: urban at 0–10 minutes; suburban at 10–30; exurban at 30–60; and rural at >60 [31]. However, in this study, it was impractical to calculate the distance from each rural settlement to its nearest urban core for the entire country. Zhu et al. [32] consider that rural settlements located within 1 km from urban boundaries are most convenient for daily life and have the greatest potential for urbanization. This study, accordingly, chose 1 km as the buffer distance to define a rural settlement land at the urban fringe.
Street data were sourced from OpenStreetMap (OSM), a free-for-download map. As geo-data from the web may be inaccurate, many scholars have examined the positional accuracy, completeness, and the collection accuracy of OSM, finding it to have high-quality street data in European countries [33]. In China, OSM’s data accuracy has been found to average 66% [34]. Though the data were most complete and positionally accurate in eastern China and big cities like Beijing and Shanghai, there was also detailed information for some poor areas [35,36].
Transportation accessibility improvement is one of the reasons for rural settlement change and sprawl. Convenient transportation links facilitate villagers working in cities, which increases the depopulation of rural areas to some extent [37]. The transportation accessibility of each village was determined by the distance from the center of the rural settlement parcel to the nearest road.
OpenStreetMap classifies several types of roads, the five most important (in descending order) being motorway, trunk, primary, secondary, and tertiary. Motorway is defined as a high-speed road with more than two running lanes and an emergency hard shoulder. At the other end of the scale, tertiary roads link small towns, villages, and hamlets. This classification was the basis of analyzing transportation accessibility results analysis.

2.3. Relief Amplitude

Relief amplitude was chosen to describe the terrain of rural settlement land. It can quantitatively present macro-regional terrain characteristics, and divide regions into different geomorphic types. Relief amplitude is defined as the difference between the highest and the lowest elevations in a particular analysis region [38]. It plays a profound role in the spatial distribution of human population and economic activity, including urbanization [39].
Global Earth observation and analysis is mostly performed using the shuttle radar topography mission (SRTM) digital elevation model (DEM) and the advanced spaceborne thermal emission and reflectance radiometer global digital elevation model (ASTER GDEM) [40]. Although GDEM has a higher spatial resolution than the SRTM DEM, the ASTER GDEM’s accuracy has attracted controversy due to the anomalies and noise caused by limitations in its optical imaging [41,42]. Comparatively, SRTM DEM is the more commonly used data source due to its relatively stable accuracy [43].
The statistical unit is the most important element in relief amplitude calculation, and its optimal value varies between DEM resolutions and study areas. A statistical unit of 3.24 km2 was chosen, based on researchers’ finding that the best unit size to calculate relief amplitude in China using SRTM and ASTER DEM ranges from 2.25 km2 to 4.72 km2 [44]. According to the relief amplitude, rural settlement terrain was divided into six types (Table 1) [45].

2.4. Field Survey and Statistical Data

Survey data of 111 villages in Shandong Province were collected as field checks of the land-use data from high resolution aerial photographs. The questionnaire survey considered information such as the house owner’s name, how long they live in the house every year, and reasons for abandoning or idling [30].
Social and economic data were derived from the Statistical Yearbook of China.

3. Methodology

The comprehensive evaluation method was employed to calculate the potential of rural settlement land consolidation in China. The major steps in building a comprehensive evaluation system were: selecting indicators that captured the restrictions on land consolidation of hollowed villages, normalizing and weighting each indicator, and calculating the score and potential of each province.
Shandong Province lies on the North China Plain, the country’s biggest grain-producing area. The North China Plain has the largest distribution density of rural settlements and a similar rural population structure, primary industry structure, and gradient of regional economic growth to those of China as a whole [6]. Therefore, Shandong Province is an excellent representative sample for RSLC, offering a microcosm of rural development in China. For the study’s comprehensive evaluation system, due to the lack of nationwide field survey data, the potential of Shandong Province was chosen as the standard value.
In the comprehensive evaluation system, restricting indicators weights of all provinces were calculated. Then the potentials of other provinces can be calculated based on the standard value and the weight ratio of Shandong Province to others.

3.1. Selecting Indicators

Based on the accessibility and rationality of data, this study selected indicators of four targets: economic development, social improvement, natural conditions, and land use to characterize and classify rural settlement land. These are the main four restrictions on RSLC. Extraction of the optimal indicators builds upon the reviews and data preparation above (Table 2).
To choose the least and most appropriate indicator for each aspect, the linear correlations were examined [56]. We chose Spearman’s Rho rs as the correlation measure due to the non-linear relationships between indicators. To reduce the number of indicators, those showing strong correlations (absolute correlation >0.75) with other indicators were omitted from further analysis.
There were two steps in this process: first, we performed correlation analysis among indicators in the same group, deleting the redundant indicators; and, second, we performed the same procedure among all of the retained indicators.

3.2. Normalization and Weighting of Indicators

Li and Liu [57] tested six weight-assigning methods: entropy, maximizing deviation, variation coefficient, mean-variance decision, factor analysis, and gray correlation. They found the entropy method to be the most sensitive, so it was determined to be the best for assigning weight to indicators.

3.2.1. Normalization

Through the data extreme difference method, standard processing was carried out to normalize the indicators. For positive indicators,
  Y i j   = X i j m a x j X i j m a x j X i j m i n j X i j
for negative indicators,
  Y i j   = m a x j X i j X i j m a x j X i j m i n j X i j
where Yij is the normalized value of indicator j in province i; Xij is the actual value of indicator j in province i; minjXij is the minimum of indicator j in province i; maxjXij is the maximum of indicator j in province i; and i [ 1 , n ] ,   j [ 1 , m ] .

3.2.2. Weighting Indicators

The entropy method is an objective weighting method based on the quantity of information from each indicator. When the values of evaluation objects differ widely, this means that the indicator provides a relatively large quantity of information, so it deserves large weight. In contrast, an indicator will have lower weight if it provides less information. First, information entropy was calculated as
  E j = ln n 1   i = 1 n p i j   l n   p i j
  p i j   = Y i j / i = 1 n Y i j
If p i j = 0 , lim   p i j 0 p i j ln   p i j = 0 , then, according to the information entropy (E1, E2, … Ek), the weight of each indicator can be calculated as
  W i = ( 1 E i   ) / ( k E i ) ( i = 1 ,   2 ,   ,   k ) ,
where Wi is the weight of indicator I, and Ei is the information entropy of indicator i.

3.3. Evaluation Score

The scores produced by the comprehensive evaluation system show the differences in land consolidation suitability and necessity among provinces. These differences are the basis for estimating the potential of each province, except for Shandong, the score for which was directly obtained from field investigation data.
To calculate the score of each province, the formulas are
f i k   = i = 1 , j = 1 n W j × Y i j ( k = 1 ,   2 ,   3 ,   4 )
  f i = i = 1 , j = 1   n W k × f i k ( k = 1 ,   2 ,   3 ,   4 )
where Wj is the weight of indicators; Wk is the weight of targets; fik is the score of target k in province i; and fi is the total score of province i.
We characterized and divided all the provinces into five zones based upon the score of each province using the natural break method in ArcGIS. Natural-geographic, socio-economic, and cultural factors combine to form a human–land relationship system. The score is regarded as an index of the similarity and differences between these systems. Based on the result, we can discuss the characteristics, distribution, generation, and development of rural settlement in particular zones. This may contribute to further studies, such as typical village extraction from remote-sensing images.

3.4. Potential Calculation

3.4.1. The Potential of Shandong Province

The potential of Shandong Province was the basis of other provinces’ potential. This potential was calculated in a micro-scale according to data acquired from villages. Liu et al. [30] highlighted that realizing the potential of rural settlement land consolidation is a long process; they proposed the following method for calculating the potential of Shandong Province in 2010 and 2020 (beginning with the equations for 2010)
  P 2010   = S w + S a + S i × 10 % + S v + S p × 40 % + S t × 60 %
  S n = S 0 ( S C + S F + S Y   )
  β 2010   = P 2010 / S n
where P2010 is the potential in 2010; Sw, Sa, and Si are the areas of abandoned, idle, and inefficiently utilized rural residential land, respectively; Sv is the area of idle land; Sp is the area of ponds; St is the area of threshing fields. Sn is the non-agricultural area of a village; S0 is the official area of a village; SC, SF, and SY are the areas of cultivated land, woodland, and garden plots, respectively; and β2010 is the rate of rural settlement land consolidation in 2010.
The land that can be sorted out before 2020 is regarded as the long-term potential [58]. The potential in 2020 should consider the depopulation caused by urbanization. Referring to the data from Shandong provincial bureau of statistics [59], it can be considered that 20% of the rural population lived in the city in 2020. Liu et al. [30] assumed 40% of roads, 60% of ponds and 80% of threshing field to be consolidated in the future as potential which is 20% higher than in 2010.
The equations for the potential in 2020 are
  P 2020   = S w + S a + S i S k × n i + S v + S s × 40 % + S p × 60 % + S t × 80 %
  S n = S 0 ( S C + S F + S Y   )
  β 2020   = P 2020 / S n
where P2020 is the potential in 2020; Sk is the standard area of inefficiently utilized rural residential land (for instance, less than 150 m2); Ss is the area of roads; ni is the number of inefficiently utilized rural houses; and β2020 is the forecast rate of rural settlement land consolidation in 2020.
Based on β, the rural consolidation rate which indicates the ratio between increased lands after consolidation to the current rural settlement land [17], and rural settlement land area of counties, we acquired the potential of counties. According to the potential and land consolidation rate of counties, we calculated the potential of Shandong Province.

3.4.2. Potential of Other Provinces

To acquire each province’s potential through the comprehensive evaluation system built above, its comprehensive correction factors should be calculated as
  Q i = f i / f s d    
where Qi is the comprehensive correction factor of province i, fi is the score of province i, fsd is the score of Shandong Province. According to the fieldwork data in Shandong Province, the potential and consolidation rate of each province is calculated as
  β i = β s d   × Q i
  P i = β i × S i  
where βi is the rate of rural settlement land consolidation of province i; βsd is the rate of Shandong Province, in 2010 it is β2010; Pi is the potential of province i, Si is the rural settlement area of province i.

4. Results

4.1. Weights of Indicators

Based on the correlations among the economic development indicators, the disposable income of urban residents per capita (UI/capita), the ratio of incomes of urban and rural residents (UI/RI), per capita rural electricity consumption (RE/capita), and year-end home value (HV) were removed due to their close relationship with net income of rural residents per capita (RI/capita), which had a stronger connection with RSLC than the former three indicators.
Based on the correlations among the social improvement indicators, the area proportion of rural settlements influenced by roads (PARR) and the area proportion of rural settlements at the urban fringe (PARU) were omitted due to their close relationships with the number proportion of rural settlements influenced by roads (PNRR) and the number proportion of rural settlements at the urban fringe (PNRU) separately. PNRR and PNRU were chosen as they were more independent from the other indicators than PARU and PNRU. Road density (RD) was excluded due to its high correlation with the average population with high school education or above per hundred persons (HSP), and it overlapped with transportation accessibility and the number proportion of rural settlements influenced by roads (PNRR).
Based on the correlations among land-use indicators, the number of patches (NP) and rural settlement land per household (RL/household) were removed due to their close relationship with rural settlement land per capita (RL/capita). RL/capita was retained because it was more relevant to RSLC. The ratio of cultivated land and rural settlement land (CL/RL) was removed due to its close relationship with patch density (PD), which was retained for the same reasons as RL/capita.
In the second stage of weighting indicators, none of the indicators were removed. Building upon the selected indicators and their weights, a comprehensive indicator system for characterizing and classifying rural settlement land was established (Table 3).

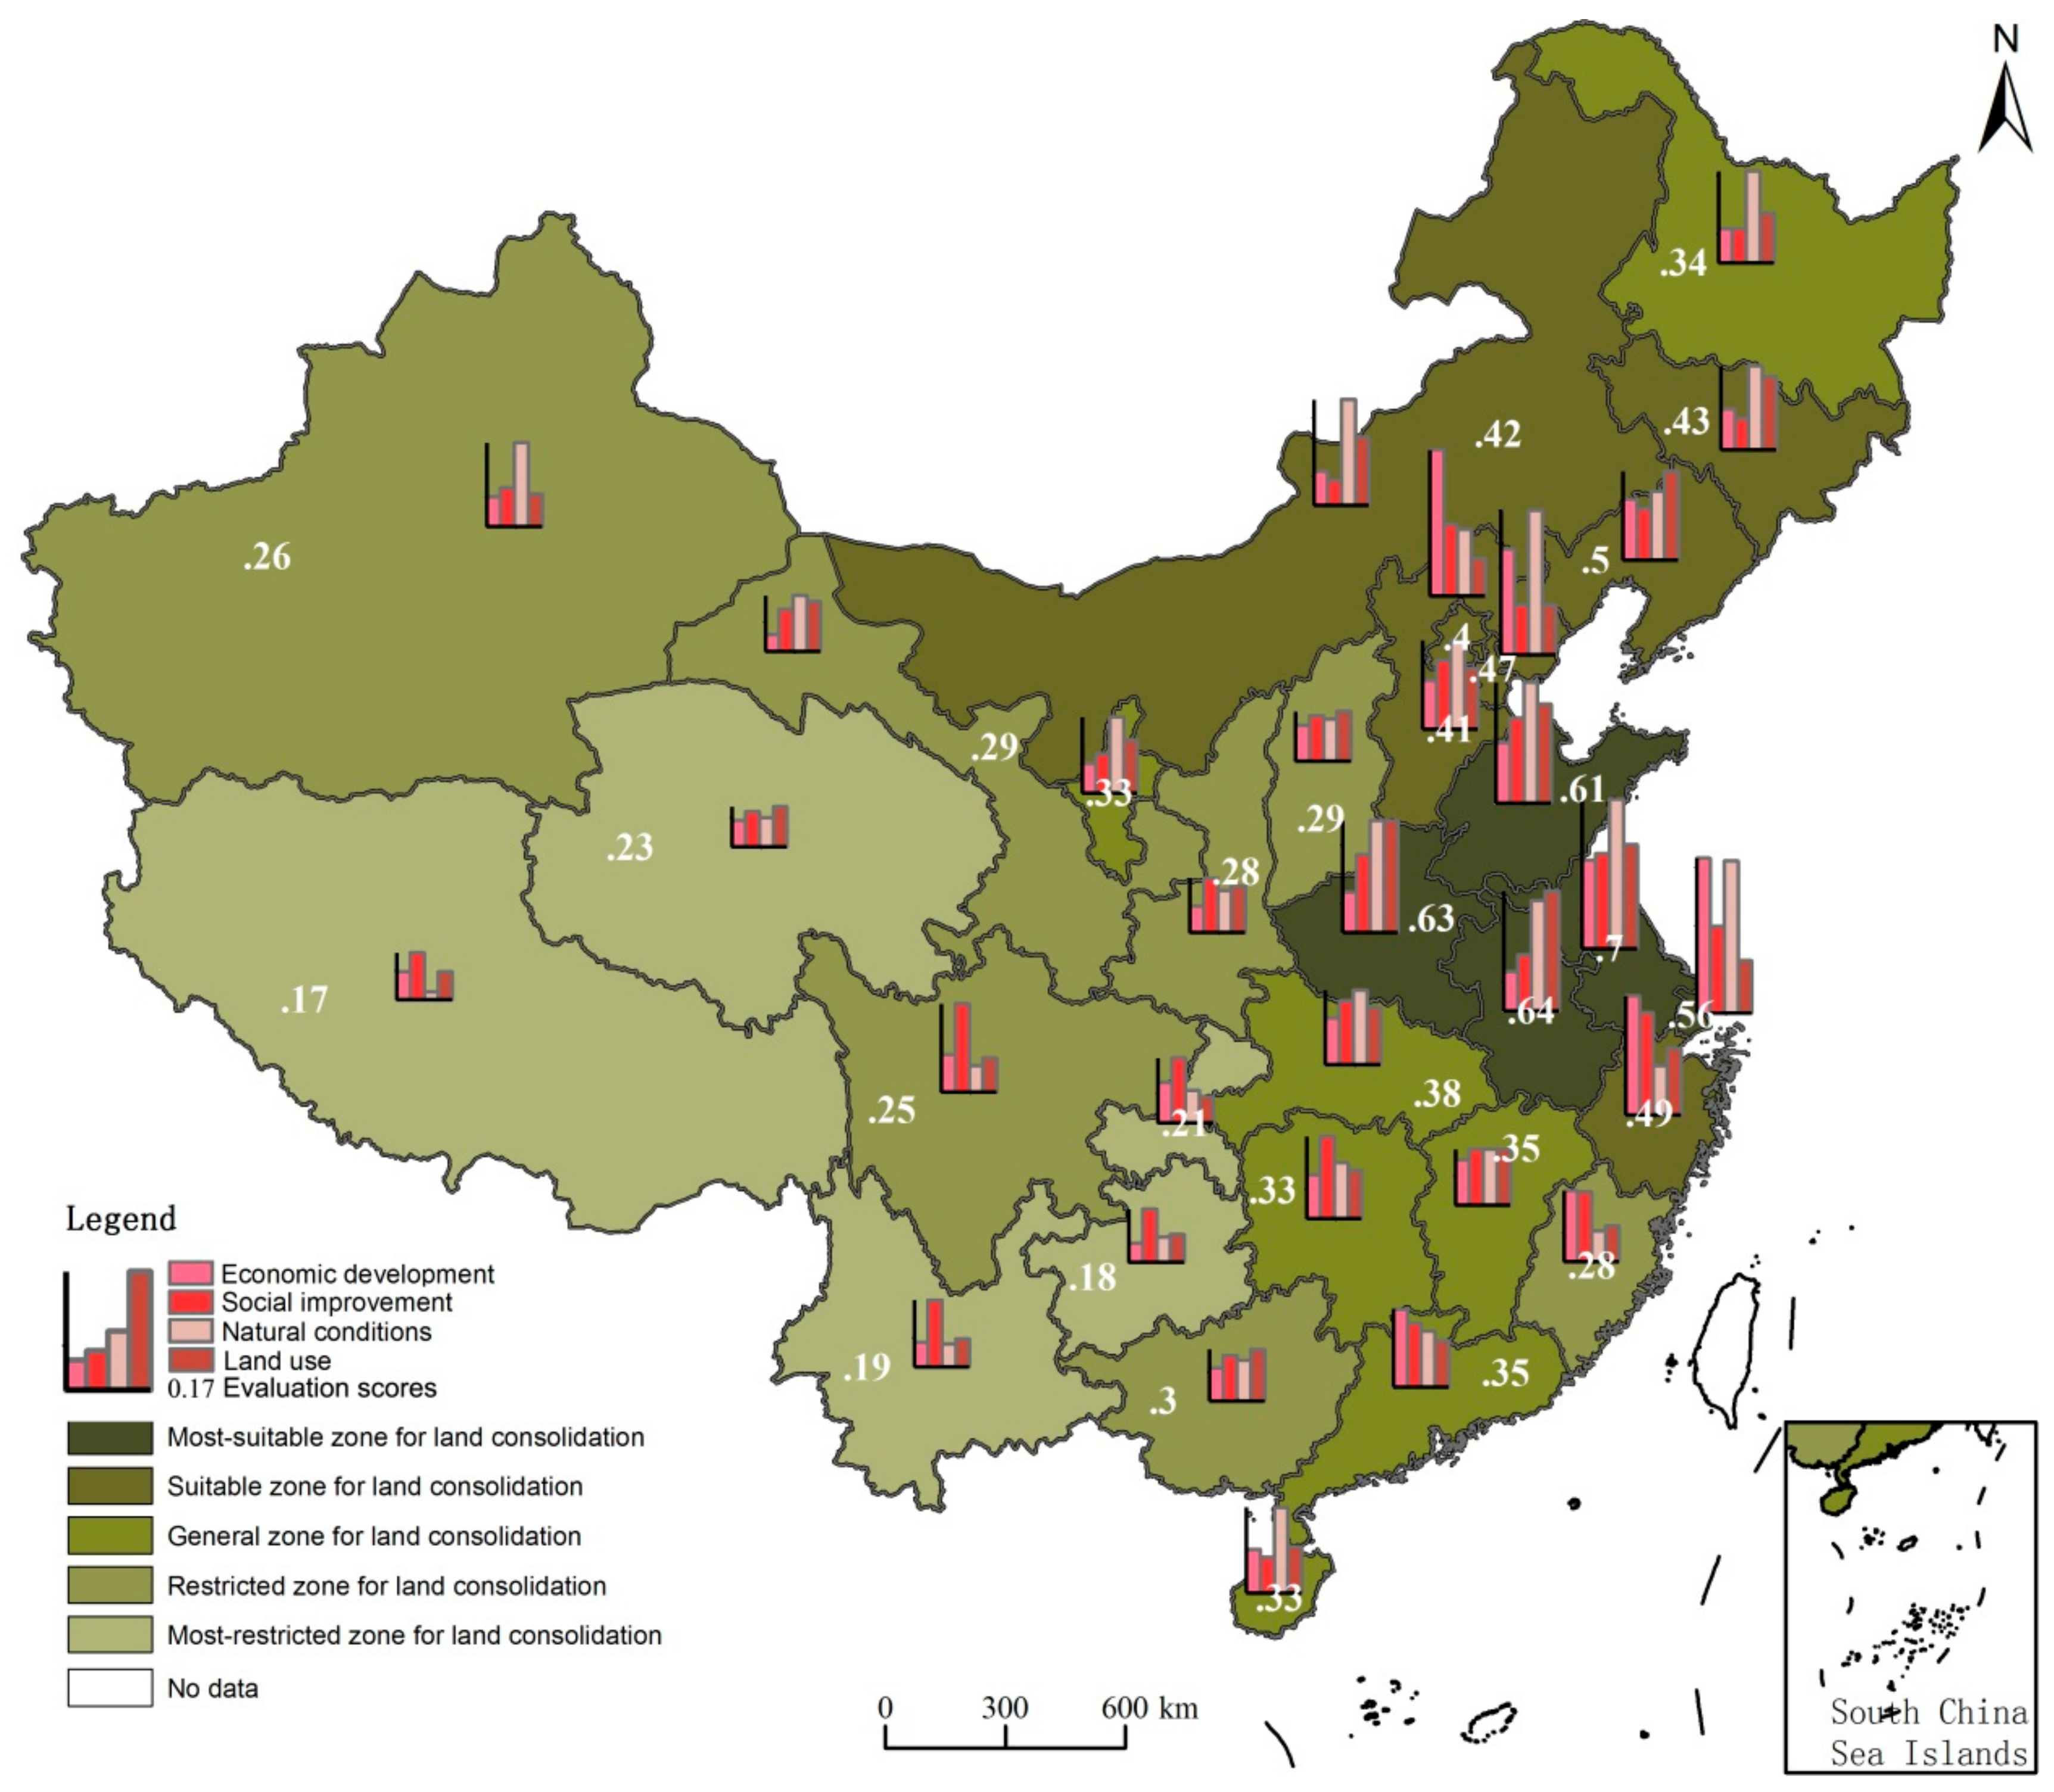
4.2. Classification of Rural Settlement Land Consolidation

Using the comprehensive indicator system thus formulated, the score of each province for classifying rural settlement land consolidation was calculated (Figure 1). The bar charts reveal each province’s scores in economic development, social improvement, natural conditions, and land use respectively. Based on these scores, we delineated five zones: most-suitable zone for land consolidation, suitable zone for land consolidation, general zone for land consolidation, restricted zone for land consolidation, and most-restricted zone for land consolidation. For additional description of bar charts in Figure 1 and further analysis, the average scores of each zone in four aspects were calculated (Table 4).
The most suitable zone for land consolidation comprised provinces with high comprehensive scores range from 0.70 to 0.56, including Jiangsu, Anhui, Henan, Shandong, and Shanghai. Compared to the other four zones, this zone has the least restrictions on land consolidation. Land consolidation in Anhui and Henan was mainly restricted by economic and social indicators. Jiangsu and Shandong suffered lower economic, social, natural, and land-use restrictions than the other three provinces in this zone. All five provinces suffered lower natural restrictions than the provinces in the other zones.
The suitable zone for land consolidation comprised provinces with scores range from 0.5 to 0.4, including Liaoning, Zhejiang, Tianjin, Jilin, Inner Mongolia, Hebei, and Beijing. Jilin and Inner Mongolia suffered more from a lack of funding. Zhejiang faced greater natural restrictions due to its small area proportion of plains. Both Tianjin and Hebei had medium per capita cultivated land and large mean patch size (MPS), leading to limited demands for land consolidation. In general, provinces in this zone can afford the demands of land consolidation and need to implement this.
Provinces in the general zone for land consolidation, including Hubei, Jiangxi, Guangdong, Heilongjiang, Ningxia, Hainan, and Hunan with scores range from 0.38 to 0.33. Guangdong, Hunan, and Hubei had lower economic and social limitations than the other four provinces in this zone. While Heilongjiang had lower natural restrictions, Jiangxi and Ningxia suffered lower land-use restrictions. In brief, the provinces in this zone have medium-level economic, social, natural, and land-use restrictions.
The restricted zone for land consolidation, including the provinces of Guangxi, Shanxi, Gansu, Shaanxi, Fujian, Xinjiang, and Sichuan suffered extensively from each type of restriction. Their comprehensive scores range from 0.30 to 0.25. Xinjiang, Gansu, Shaanxi, Shanxi, Guangxi, and Sichuan were manifestly restricted in terms of both economic and social issues. Shanxi had a low demand for cultivated land. Fujian had the smallest area of plains of all the provinces, which is a significant natural restriction. In brief, land consolidation in this zone is difficult due mainly to economic and social restrictions.
The most restricted zone for land consolidation included the provinces of Qinghai, Chongqing, Yunnan, Guizhou, and Tibet with scores range from 0.23 to 0.17. They had the greatest restrictions and the lowest efficiency. Provinces in this zone had large natural and land-use limitations and the worst economic conditions.

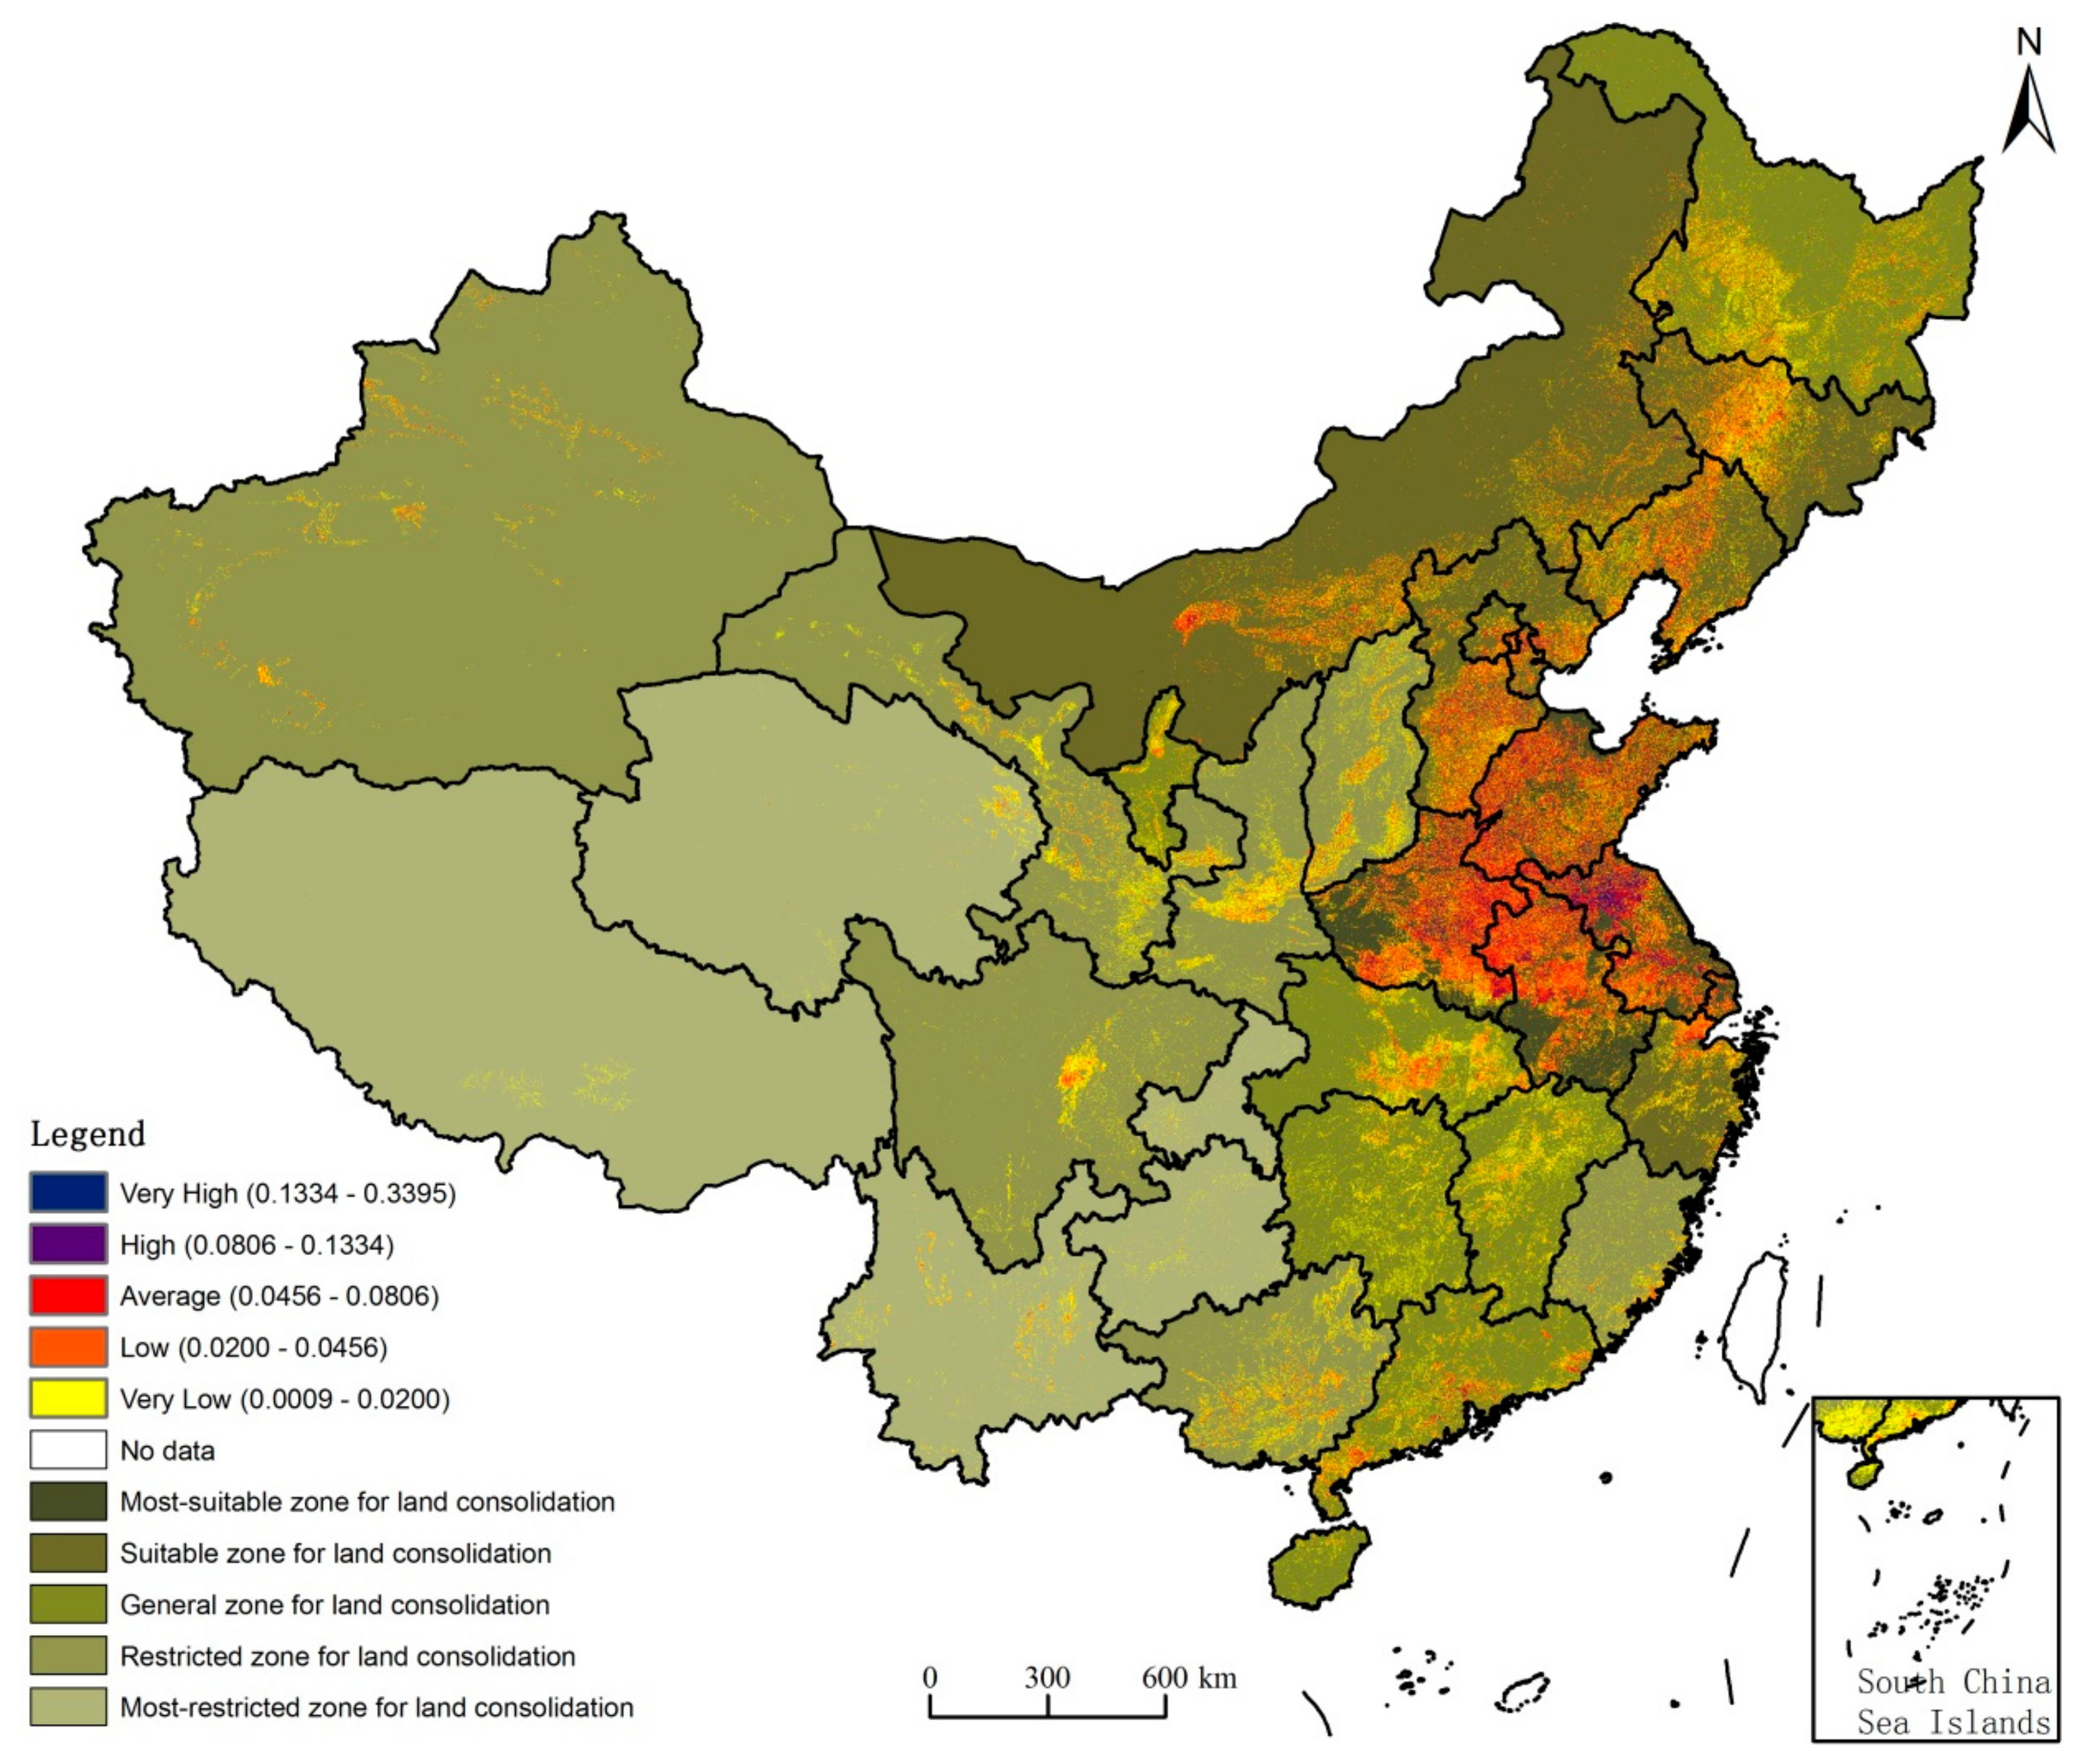
4.3. Potential of Rural Settlement Land Consolidation

Using equations (8) to (13), we calculated the rural settlement land consolidation potential of China’s provinces (Figure 2, Table 5). The results were ordered from high land consolidation evaluation scores to low. The average value of each zone gives a direct way to separate the five zones. It also shows that high rate does not equal to large potential areas.
Potential was not only related to the rate of land consolidation but also influenced by the area of rural settlement land. In 2010, the nationwide potential was 32,777.92 km2 (Figure 2). Shandong had the highest potential of all the provinces (4873.05 km2), followed by Henan (4642.92 km2), and Jiangsu (3879.83 km2). The lowest potential was recorded for Tibet (4.21 km2). Very high potentials were located in the north of Jiangsu and Anhui. High potential and average potential were distributed across North China Plain, Middle-Lower Yangtze Plain, and Northeast Plain, which are the most important grain producing areas of China. Low potential was found in provinces in middle and southern China, like Shanxi, Hubei, Guangdong, and Guangxi. Very low potential was distributed across western China, especial in Gansu, Shaanxi, Sichuan, and Xinjiang.
In 2020, the nationwide potential is forecast to be 44,707.81 km2 (Figure 3). Provincial potential rankings in 2020 are similar to those in 2010: for instance, the highest three provinces are Shandong (6646.65 km2), Henan (6332.76 km2), and Jiangsu (5291.94 km2). Again, Tibet has the lowest potential (5.75 km2). The distribution of potential in 2020 is also similar to that in 2010.

4.4. Verification of Rural Settlement Land Consolidation Potential

To verify potential based on 0.5 m resolution images, 14 villages were selected, of which six were in the suitable zone, five in the general zone, one in the restricted zone, and two in the most restricted zone. To obtain accurate rural settlement results, experts’ interpretation was employed to identify the land-use types of rural settlements. The potential interpreted from high-resolution images of the 14 villages was used to verify potential at national scale. Based on the interpretation results and the calculation methods detailed in Section 3, the potential was determined for each of the 14 villages (Table 6).
Regarding the sources of rural settlement land consolidation potential in 2010, idle land had the greatest potential, followed by abandoned, idle resident land (Table 7). However, the sources of potential varied between regions: for instance, villages in Beijing had more potential from idle land, while those in Jiangxi had higher potential in abandoned and idle rural resident land. Comparing the forecast potential in 2020 with the findings for 2010, the total value in 2020 is predicted to be larger given the additional time to realize the potential. Roads were only considered as long-term potential as it related to planning.
On comparing the comprehensive evaluation method results and verification results, we found that while they were similar, the former were generally lower. This makes sense because comprehensive evaluation considered social, economic, natural, and land-use factors, based on potential calculation at the village level. These indicators lead to a more realistic evaluation of potential compared to the verification method.
Among the verified villages, Qianliwu, Xujie, Xiaolaowei, Xiazheshu, Jiuzhuang, Chenke, Yinlong, and Shuangtang showed the most similar rate of land consolidation compared to their provinces’ respective values as calculated through the comprehensive evaluation method (Table 8).
Based on the fieldwork findings for Shandong Province, as villages vary within regions, there are sufficient available samples to ensure the accuracy of calculated potential. Therefore, we can conclude that the comprehensive evaluation method is reliable and appropriate for national wide application.

5. Discussion

5.1. Comparison to Previous Studies

Several prior studies have calculated land consolidation potential on a national scale, most have been based on the per capita construction land method according to urbanization level. Li et al. [26] claimed that land consolidation potential in China was 1,692,100–2,839,600 hm2 (about 16,921 km2–28,396 km2) by introducing correction factors. More recently, Liu et al. [17] forecast the consolidation potentials of hollowed villages in 2020 to be 8,098,854 hm2 (80,988.54 km2) in a complete urbanization scenario, 6,991,892 hm2 (69,918.92 km2) in a semi-urbanization scenario, 7,578,937 hm2 (75,789.37 km2) in an urbanization-in-batches scenario and 9,921,642 hm2 (99,216.42 km2) in an urbanization scenario. This study’s potentials were lower than Liu’s but higher than Li’s; in terms of the potentials trend and distribution, this study’s findings are more similar to Liu’s.
In micro-scale or village scale, Zhang et al. [58] calculated the potential of 12 villages in Juye County, Shandong province in 2010 and 2020. According to the actual situation of 12 villages, the author chose a land-use type similar to mine, including inefficiently utilized, abandoned and idle rural residential land; threshing field; ponds; idle land; and roads. The average potential of 12 villages is 68.2 hm2 (0.28 km2). This result is hard to be used for further comparative analysis because the potential is varied from villages. That is one of the limitations of micro-scale potential calculation research.
In my research, I combined micro and macro scale methods by building a comprehensive evaluation system to keep their advantages and avoid the limitations. I acquired potential in Shandong province in micro scale according to village data. The next step is based on the comprehensive evaluation system in macro scale. This method takes the economics, social, and natural differences among the provinces into consideration.

5.2. Distribution Characteristics of RSLC Potential

Evident differences of rural settlement land consolidation potential exist across provinces and regions (eastern, central, western China). There were some tight clusters in both Figure 2 and Figure 3 which means large amount of rural settlement land areas and relatively high potential.
In 2010, the total area of rural settlement land in China was 136,864.90 km2, accounting for 1.44% of China’s total land use area [60]. In 2010, the rural settlement land in Shandong Province had the largest land area, followed by Henan, Jiangsu, Anhui; the rural settlement land in Tibet was the smallest. This order of provinces was same as the RSLC potential in 2010 which reveals that RSLC potential is tightly related to the size of rural settlement land areas.
Rural settlement land in China is unevenly distributed in space, and the east, middle, and west steps are obvious. In 2010, the proportions of rural settlement land in eastern, central, and western China were 2.04: 1.47:1.00 [60]. The potential showed a similar trend as rural settlement land in eastern, central, and western parts. In 2010, rural settlement land with very high and high potential was mostly located in eastern and central regions. The land with average and low potential was dispersed in central and western parts of China. The very low potential land was distributed most evenly in eastern, central, and western regions. This situation is expected to persist in 2020.
The bar charts in Figure 1 represent scores of each province in economic development, social improvement, natural conditions, and land use respectively. Obviously, the economic development and natural conditions in eastern provinces were better than central and western provinces.
The uneven distribution of rural settlement land and social-eco conditions in eastern, central, and western parts of China contributes to uneven rural settlement land consolidation potential. Rural settlement land in developed areas and plains tends to have higher consolidation potential than that in less developed areas and in mountain areas.

5.3. Sources of Potential in Land-Use Type Perspective

On a micro scale, the land-use sources of land consolidation potential were not only in the residential land, but also in other land types such as idle land and ponds. According to my verification process, more than half of the potential in Beijing’s villages were from idle land which may be caused by natural conditions. However, in Jiangxi province, most of the potential sources were abandoned and idle residential land which may have been caused by depopulation. Roads seem to have large potential in most villages. Land consolidation is able to solve land fragmentation problems, enhance land productivity, and improve rural living conditions.
On a macro scale, from the late 1980s to 2010s, the rural settlement land expanded to occupy 14,255.95 km2 of cultivated land, accounting for 68.33% of the total expanded area of rural settlement land [60]. The house construction in rural areas was an individual behavior of farmers. Their ability to transform land-use type is very limited, therefore they prefer to transfer land-use types such as cultivated land that is easy to develop. Conversely, 3219.89 km2 of rural settlement land was converted to urban land, and only 37.73 km2 was converted to cultivated land. That means the rural settlement land consolidation have a large potential to develop cultivated land. In the past, most of the rural settlement land change occurred in a passive way, motivated by urbanization. In the future, the government can pay more attention to land consolidation in order to build a new countryside.

6. Conclusions

Theoretically, this study is an attempt to calculate the potential of rural settlement land consolidation based on detailed rural settlement land parcel data and additional reference information such as land use, social-economic development, and the natural conditions. A rural settlement land consolidation potential calculation method was established, considering both micro-scale field data and macro-scale land consolidation restrictions, aimed to link methods used in different scales. From an initial set of 25 indicators, 14 were ultimately selected. We classified five zones in terms of their suitability for land consolidation. The most suitable areas for land consolidation were located in the North China Plain, Middle-Lower Yangtze Plain, and Northeast Plain. Potential was determined by rural settlement land areas and evaluation scores. Land use had the most influence in the evaluation. The combination of relatively small parcel area, large density of rural settlement land, and smaller cultivated land per capita provides the best land consolidation conditions.
In “The 13th Five-Year Plan for Economic and Social Development of the People’s Republic of China,” the country decided to accelerate infrastructure reform, improving rural human settlement environment, and strengthening the protection of traditional villages, constructing beautiful, livable villages. In this sense, our study can be considered a useful reference for the government, since it presents the details and regional differences of land consolidation potential throughout China.
In comparison to traditional approaches used in previous works, the method employed in this study placed greater emphasis on land use, economic, and natural factors rather than population transfer and policy. The land-use indicators impacted most on land consolidation potential. In addition, the results were based on each rural settlement land parcel, rather than county-level land-use data used in previous studies. The nationwide potential was 32,777.92 km2 and forecast to be 44,707.81 km2 in 2010 and 2020, respectively. These are lower than some previous results which were possibly the fault of the of evaluation systems. The effectiveness of this method highly depends on the selected indicators. In further research, the potential calculation should consider optimal land allocation between urban and rural settings. More detailed social and economic data and updated land-use data will be collected to improve the indicator system.

Author Contributions

M.Z. is the first author and her role is formal analysis, investigation and writing-original draft. X.W. is the correspondence author, the role is conceptualization, methodology and writing-review & editing. Z.Z. is our team’s leader and his role is the project administrator. X.Z. is the forth author, and her role is data curation.

Funding

This research was funded by the Ministry of Science and Technology of China (grant no. 2014BAL01B01).

Acknowledgments

The Shandong fieldwork data and constructive suggestions provided by Prof. Yansui Liu and his team at the Institute of Geographic Sciences and Natural Resources Research, CAS, are greatly appreciated.

Conflicts of Interest

The authors declare no conflict of interest.

References

  1. Dumreicher, H. Chinese villages and their sustainable future, The European Union-China-Research Project “SUCCESS”. J. Environ. Manag. 2008, 87, 204–215. [Google Scholar] [CrossRef] [PubMed]
  2. Tan, M.; Li, X. The changing settlements in rural areas under urban pressure in China, Patterns, driving forces and policy implications. Landsc. Urban Plan. 2013, 120, 170–177. [Google Scholar] [CrossRef]
  3. Li, J.; Rose, N. Urban social exclusion and mental health of China’s rural–urban migrants—A review and call for research. Health Place 2017, 48, 20–30. [Google Scholar] [CrossRef] [PubMed]
  4. Zhang, K.H.; Song, S. Rural–urban migration and urbanization in China Evidence from time-series and cross-section analyses. China Econ. Rev. 2003, 14, 386–400. [Google Scholar] [CrossRef]
  5. Su, Y.; Tesfazion, T.; Zhao, Z. Where are migrants from? Inter- vs. intra-provincial rural–urban migration in China. China Econ. Rev. 2017. [Google Scholar] [CrossRef]
  6. Long, H. Land consolidation: An indispensable way of spatial restructuring in rural China. J. Geogr. Sci. 2014, 24, 211–225. [Google Scholar] [CrossRef]
  7. Sun, H.; Liu, Y.; Xu, K. Hollow villages and rural restructuring in major rural regions of China: A case study of Yucheng City, Shandong Province. Chin. Geogr. Sci. 2011, 21, 354–363. [Google Scholar] [CrossRef] [Green Version]
  8. Liu, Y.; Liu, Y.; Chen, Y.; Long, H. The process and driving forces of rural hollowing in China under rapid urbanization. J. Geogr. Sci. 2010, 20, 876–888. [Google Scholar] [CrossRef]
  9. Long, H.; Liu, Y.; Li, X.; Chen, Y. Building new countryside in China, A geographical perspective. Land Use Policy 2010, 27, 457–470. [Google Scholar] [CrossRef]
  10. Wang, J.; Liu, Y.; Chen, Y. Spatial expansion pattern and its dynamic mechanism of typical rural settlements in Huang-Huai-Hai Plain. Geogr. Res. 2010, 29, 1833–1840. (In Chinese) [Google Scholar]
  11. Cay, T.; Uyan, M. Evaluation of reallocation criteria in land consolidation studies using the Analytic Hierarchy Process (AHP). Land Use Policy 2013, 30, 541–548. [Google Scholar] [CrossRef]
  12. Uyan, M. Determination of agricultural soil index using geostatistical analysis and GIS on land consolidation projects: A case study in Konya/Turkey. Comput. Electron. Agric. 2016, 123, 402–409. [Google Scholar] [CrossRef]
  13. Uyan, M.; Cay, T.; Inceyol, Y.; Hakli, H. Comparison of designed different land reallocation models in land consolidation: A case study in Konya/Turkey. Comput. Electron. Agric. 2015, 110, 249–258. [Google Scholar] [CrossRef]
  14. Demetriou, D.; Stillwell, J.; See, L. Land consolidation in Cyprus: Why is an integrated planning and decision support system required? Land Use Policy 2012, 29, 131–142. [Google Scholar] [CrossRef]
  15. Zhang, Z.; Wang, X.; Zhao, X.; Liu, B.; Yi, L.; Zuo, L.; Wen, Q.; Liu, F.; Xu, J.; Hu, S. A 2010 update of National Land Use/Cover Database of China at 100,000 scale using medium spatial resolution satellite images. Remote Sens. Environ. 2014, 149, 142–154. [Google Scholar] [CrossRef]
  16. Deng, X.; Huang, J.; Rozelle, S.; Zhang, J.; Li, Z. Impact of urbanization on cultivated land changes in China. Land Use Policy 2015, 45, 1–7. [Google Scholar] [CrossRef] [Green Version]
  17. Liu, Y.; Yang, R.; Li, Y. Potential of land consolidation of hollowed villages under different urbanization scenarios in China. J. Geogr. Sci. 2013, 23, 503–512. [Google Scholar] [CrossRef]
  18. Bonfanti, P.; Fregonese, A.; Sigura, M. Landscape analysis in areas affected by land consolidation. Landsc. Urban Plan. 1997, 37, 91–98. [Google Scholar] [CrossRef]
  19. Castro Coelho, J.; Aguiar Pinto, P.; Mira da Silva, L. A systems approach for the estimation of the effects of land consolidation projects (LCPs), a model and its application. Agric. Syst. 2001, 68, 179–195. [Google Scholar] [CrossRef]
  20. Long, H.; Liu, Y. Rural restructuring in China. J. Rural Stud. 2016, 47, 387–391. [Google Scholar] [CrossRef] [Green Version]
  21. Qiu, B. Significance, mistakes and policies to the renovations of rural villages in China. Urban Stud. 2006, 13, 1–6. [Google Scholar]
  22. He, Y.; Chen, Y.; Yao, Y.; Wei, N.; Xu, X.; Tang, P.; Yu, Q. Commentary on Study Methodology of Rural Residential Land Consolidation Potential. Geogr. Geo-Inf. Sci. 2008, 24, 80–83. (In Chinese) [Google Scholar]
  23. Tu, S.; Long, H.; Liu, Y.; Li, T. Research Progress and Prospects in the Methodology of Assessing the Potential of Rural Residential Land Consolidation. J. Natl. Resour. 2015, 30, 1956–1968. (In Chinese) [Google Scholar]
  24. MOHURD (Ministry of Housing and Urban-Rural Development). Code of Classification of Urban Land Use and Planning Standards of Development Land; Ministry of Housing and Urban-Rural Development, Ed.; China Architecture & Building Press: Beijing, China, 2010.
  25. Song, W.; Chen, B.; Chen, X. Theoretical and empirical analysis of potential calculation model for rural habitat consolidation. Trans. Chin. Soc. Agric. Eng. 2008, 24, 1–5. (in Chinese). [Google Scholar]
  26. Li, X.; Zhang, J.; Zheng, W.; Tang, C.; Miao, Z.; Liu, K. Calculation and analysis of land consolidation potential in rural habitat during rapid urbanization process in China. Trans. Chin. Soc. Agric. Eng. 2004, 20, 276–279. (In Chinese) [Google Scholar]
  27. Fan, F.; Liu, Y.; Zhang, Y.; He, H. Estimation of land consolidation realistic potential of rural residential areas in Guangxi. Econ. Geogr. 2012, 32, 119–123. (In Chinese) [Google Scholar]
  28. Chen, R.; Zhang, F.; Meng, Y.; Guo, L. Estimation of realistic potential of land consolidation in rural residential areas. Trans. Chin. Soc. Agric. Eng. 2009, 25, 216–221. (In Chinese) [Google Scholar]
  29. Potosyan, A.H. Geographical features and development regularities of rural areas and settlements distribution in mountain countries. Ann. Agrar. Sci. 2017. [Google Scholar] [CrossRef]
  30. Liu, Y.; Long, H.; Chen, Y.; Wang, J. A Research Report on Rural Development in China—Rural Hollowing and Its Consolidation Strategy; Science Press: Beijing, China, 2011. (In Chinese) [Google Scholar]
  31. Theobald, D.M. Targeting conservation action through assessment of protection and exurban threats. Conserv. Biol. 2005, 17, 1624–1637. [Google Scholar] [CrossRef]
  32. Zhu, X.; Wang, H.; Yuan, X.; Hou, X. Evaluation and optimization of spatial distribution of rural settlements based on GIS. Trans. Chin. Soc. Agric. Eng. 2010, 26, 326–333. (In Chinese) [Google Scholar]
  33. Haklay, M. How good is volunteered geographical information? A comparative study of OpenStreetMap and Ordnance Survey datasets. Environ. Plan. B Plan. Des. 2010, 37, 682–703. [Google Scholar] [CrossRef]
  34. Zheng, S.; Zheng, J. Assessing the Completeness and Positional Accuracy of OpenStreetMap in China. In Thematic Cartography for the Society; Bandrova, T., Konecny, M., Zlatanova, S., Eds.; Springer: Cham, Switzerland, 2010; pp. 171–189. [Google Scholar]
  35. Zhang, Y.; Li, X.; Wang, A.; Bao, T.; Tian, S. Density and diversity of OpenStreetMap road networks in China. J. Urban Manag. 2015, 4, 135–146. [Google Scholar] [CrossRef]
  36. Zhao, P.; Jia, T.; Qin, K.; Shan, J.; Jiao, C. Statistical analysis on the evolution of OpenStreetMap road networks in Beijing. Physica A 2015, 420, 59–72. [Google Scholar] [CrossRef]
  37. McGrath, B. The sustainability of a car dependent settlement pattern, an evaluation of new rural settlement in Ireland. Environmentalist 1998, 19, 99–107. [Google Scholar] [CrossRef]
  38. Zhang, J.; You, X. A prediction model of optimum statistical unit of relief. J. Remote Sens. 2013, 7, 728–741. [Google Scholar]
  39. Christensen, P.; McCord, G.C. Geographic determinants of China’s urbanization. Reg. Sci. Urban Econ. 2016, 50, 90–102. [Google Scholar] [CrossRef]
  40. Yue, L.; Shen, H.; Zhang, L.; Zheng, X.; Zhang, F.; Yuan, Q. High-quality seamless DEM generation blending SRTM-1, ASTER GDEM v2 and ICESat/GLAS observations. ISPRS J. Photogramm. Remote Sens. 2017, 123, 20–34. [Google Scholar] [CrossRef]
  41. Tachikawa, T.; Hato, M.; Kaku, M.; Iwasaki, A. Characteristics of ASTER GDEM version 2. In Proceedings of the 2011 IEEE International Geoscience and Remote Sensing Symposium (IGARSS), Vancouver, BC, Canada, 24–29 July 2011; pp. 3657–3660. [Google Scholar]
  42. Mukherjee, S.; Joshi, P.; Mukherjee, S.; Ghosh, A.; Garg, R.; Mukhopadhyay, A. Evaluation of vertical accuracy of open source Digital Elevation Model (DEM). Int. J. Appl. Earth Obs. Geoinf. 2013, 21, 205–217. [Google Scholar] [CrossRef]
  43. Yang, L.; Meng, X.; Zhang, X. SRTM DEM and its application advances. Int. J. Remote Sens. 2011, 32, 3875–3896. [Google Scholar]
  44. Zhang, W.; Li, A. Study on the optimal scale for calculating the relief amplitude in China based on DEM. Geogr. Geo-Inf. Sci. 2012, 28, 8–12. (In Chinese) [Google Scholar]
  45. Li, B.; Pan, B.; Han, J. Basic terrestrial geomorphological types in China and their circumscriptions. Quat. Sci. 2008, 28, 535–543. (In Chinese) [Google Scholar]
  46. Turner, M.G. Landscape ecology: The effect of pattern on process. Ann. Rev. Ecol. Syst. 1989, 20, 171–197. [Google Scholar] [CrossRef]
  47. Saura, S.; Martinez-Millan, J. Sensitivity of landscape pattern metrics to map spatial extent. Photogramm. Eng. Remote Sens. 2001, 67, 1027–1036. [Google Scholar]
  48. Huang, Q.; Li, M.; Chen, Z.; Li, F. Land consolidation: An approach for sustainable development in rural China. Ambio 2011, 40, 93–95. [Google Scholar] [PubMed]
  49. Gao, Y.; Ye, Y. Index system and methods for suitability evaluation of readjustment of village land use, China. Soils. 2004, 36, 365–370. (In Chinese) [Google Scholar]
  50. Song, W.; Chen, Y.; Bai, Z.; Pei, T.; Zhang, W. A study on the potential of rural settlement land. Chin. Agron. Bull. 2014, 30, 108–115. (In Chinese) [Google Scholar]
  51. Zhou, T.; Yang, Q.; Zhou, L. Quantitative evaluation of the potential of rural settlement—A case study of Yubei District in Chongqing. J. Southwest Univ. Sci. Technol. Philos. Soc. Sci. Ed. 2004, 21, 50–54. (In Chinese) [Google Scholar]
  52. NBS Department of Rural Socio-Economic Statistics. China Rural Statistical Yearbook; China Statistical Press: Beijing, China, 2011. [Google Scholar]
  53. Wang, Z.; Liu, Y.; Wei, J.; Zeng, H. The impacts of road pattern on land uses in rapidly urbanizing regions. Res. Environ. Sci. 2008, 21, 180–185. (In Chinese) [Google Scholar]
  54. Lucas, R.E. The effects of proximity and transportation on developing country population migrations. J. Econ. Geogr. 2001, 1, 323–339. [Google Scholar] [CrossRef] [Green Version]
  55. Chen, M.; Wu, C. A study on rural urbanization and rural settlement land consolidation. Econ. Geogr. 1999, 19, 97–100. (In Chinese) [Google Scholar]
  56. Schwarz, N. Urban form revisited—Selecting indicators for characterising European cities. Landsc. Urban Plan. 2010, 96, 29–47. [Google Scholar] [CrossRef]
  57. Li, X.; Liu, X. Comparative analysis on the weight assigning methods of land evaluation index. J. Gansu Agric. Univ. 2012, 47, 129–133. (In Chinese) [Google Scholar]
  58. Zhang, J.; Zhu, X.H.; Liu, Y.S.; Li, Y.Y. A survey of village land use potentiality based on 0.25 m resolution images: Exemplified by 12 villages in Juye County, Shandong Province. Econ. Geogr. 2010, 30, 1717–1721. [Google Scholar]
  59. Shandong Statistical Bureau. Shandong Statistical Yearbook 2010; China Statistics Press: Beijing, China, 2010. (In Chinese) [Google Scholar]
  60. Zhang, Z.; Zhao, X.; Liu, F.; Xu, J.; Wen, Q.; Hu, S. Remote Sensing Monitoring of Land Use in China; Star Map Press: Beijing, China, 2012. (In Chinese) [Google Scholar]
Figure 1. Rural settlement land consolidation zones in China.
Sustainability 10 03102 g001
Figure 2. Potential of rural settlement land consolidation in China in 2010.
Sustainability 10 03102 g002
Figure 3. Potential of rural settlement land consolidation in China in 2020.
Sustainability 10 03102 g003
Table 1. Basic land geomorphic types of China.
Terrain TypeRelief Amplitude
1Plain<30 m
2Platform/Hill30–200 m
3Low-relief mountain200–500 m
4Intermediate-relief mountain500–1000 m
5High-relief mountain1000–2500 m
6Extremely high-relief mountain>2500 m
Table 2. Landscape metrics and socio-economic indicators for rural settlement analysis.
TargetIndicatorMeasurementReferences
Land UseNumber of patches (NP)Number of rural settlement patches[46]
Patch density (PD)PD = N/A, where N is the number of rural settlement patches and A is the area of province[47]
Mean patch size (MPS)Mean size of rural settlement patches (m2)[47]
Cultivated land per capita (CL/capita)Cultivated land/capita (m2)[48]
Rural settlement land per capita (RL/capita)Rural settlement land/capita (m2)[17,49]
Rural settlement land per household (RL/household)Rural settlement land/household (m2)[17,49]
Ratio of cultivated land and rural settlement land (CL/RL)Cultivated land/rural settlement land[50]
Economic DevelopmentPer capita output of grain (OG/capita)Output of grain/capita (kg)[51]
Net income of rural residents per capita (RI/capita)Net income of rural residents/capita (Yuan/capita)[51]
Disposable income of urban residents per capita (UI/capita)Disposable income of urban residents/capita (Yuan/capita)[52]
Ratio of incomes of urban and rural residents (UI/RI)Incomes of urban residents/incomes of rural residents[52]
Per capita rural electricity consumption (RE/capita)Rural electricity consumption/capita[51]
Year-end home value (HV)The value of houses in rural areas at the end of a year (Yuan/m2)[52]
Social ImprovementThe number proportion of rural settlements influenced by roads (PNRR)Number of rural settlements influenced by roads/total number of rural settlements in province[53,54]
The area proportion of rural settlements influenced by roads (PARR)Area of rural settlements within 1 km buffer of roads/total area of rural settlements in province[53,54]
The number proportion of rural settlements at the urban fringe (PNRU)Number proportion of rural settlements at the urban fringe/total number of rural settlements in province[32]
The area proportion of rural settlements at the urban fringe (PARU)Area of rural settlements within 1km buffer of cities/total area of rural settlements in province[32]
Road density (RD) Road mileage/area of land (km/km2)[28]
Rural population (RP)Rural population in province[28]
The average population with high school education or above per hundred persons (HSP)Population with high school education or above/100[28]
The proportion of employment in primary industry (PEP)Employment in primary industry/total employment[52]
Per capita post and panel structure area (PP/capita)Post and panel structure area/capita (m2)[55]
Natural ConditionsThe area proportion of nature reserves (PNR)Area of nature reserves/area of province[51]
The area proportion of relief <200 m (PR200)Area of relief <200 m/area of province[51]
Table 3. Comprehensive indicator system.
Criterion LayerIndex LayerInfluenceWeightEffect
Economic
Weight: 0.16
Net income of rural residents per capita (RI/capita)The government in rich areas can supply enough money to satisfy rural residents’ compensation, thus reducing the biggest limitation on land consolidation.0.85positive
Per capita output of grain (OG/capita)Lower output means lower land productivity, making cultivated land more scarce and the demands of rural settlement land consolidation more urgent. 0.15negative
Social
Weight: 0.08
The number proportion of rural settlements at the urban fringe (PNRU)This reveals the connection between urbanization and rural settlement land consolidation. It is easy to perform land consolidation in rural settlements at the urban fringe due to urban sprawl.0.27positive
The number proportion of rural settlements influenced by roads (PNRR)PNRR expresses the transportation accessibility of villages: the higher the transportation accessibility, the lower the cost of land consolidation.0.15positive
Rural population (RP)RP impacts land consolidation in two respects: the labor force and the human–land relationship. A larger population means more available labor, leading, in turn, to more intense human–land conflict. This can be solved by rural settlement land consolidation.0.27positive
The average population with high school education or above per hundred persons (HSP)HSP reveals villagers’ acceptance of change: the higher the education of villagers, the fewer the barriers to land consolidation.0.09positive
The proportion of employment in primary industry (PEP)This has a similar influence to RP.0.09positive
Per capita post and panel structure area (PP/capita)PP/capita reveals villages’ land consolidation demands due to the poor performance of post and panel structure houses, in terms of withstanding seismic activity, waterproofing, and service life.0.13positive
Natural
Weight: 0.16
The area proportion of nature reserves (PNR)This limits the available area for land consolidation.0.18negative
The area proportion of relief <200 m (PR200)PR200 plays an important role in land consolidation. In general, rural settlements on plains have a larger mean patch size than those in mountains, and the land consolidation cost is also reduced.0.82positive
Land-Use
Weight: 0.60
Mean patch size (MPS)MPS indicates land consolidation project. A small-size rural settlement is suitable to perform village merging, which is the most popular land consolidation project.0.12negative
Patch density (PD)PD illustrates the fragmentation degree of a rural settlement. Larger patch density means more fragments, meaning more useful land is available for consolidation.0.45positive
Cultivated land per capita (CL/capita)Lower values of CL/capita lead to a more tense human–land relationship, demanding help from land consolidation.0.08negative
Rural settlement land per capita (RL/capita)RL/capita is an important internal indicator, revealing the potential for land consolidation.0.35positive
Table 4. Average scores of each zone in four aspects.
Rural Settlement Land Consolidation ZoneEconomic DevelopmentSocial ImprovementNatural ConditionsLand UseComprehensive Scores
Most-suitable Zone0.490.520.830.630.63
Suitable Zone0.510.370.560.410.45
General Zone0.300.350.460.330.35
Restricted Zone0.230.350.290.280.28
Most-restricted Zone0.180.340.150.190.20
Table 5. Potential of rural settlement land consolidation in China.
20102020
Land Consolidation ZoneProvinceLand
Consolidation Rate *
Potential (km2)Land
Consolidation Rate *
Potential (km2)
Most-Suitable Zone for Land ConsolidationJiangsu0.353879.830.485291.94
Anhui0.323517.620.444797.9
Henan0.324642.920.436332.76
Shandong0.314873.050.426646.65
Shanghai0.29287.260.39391.82
Average10.323440.140.434692.21
Suitable Zone for Land ConsolidationLiaoning0.251994.510.342720.44
Zhejiang0.25754.750.341029.45
Tianjin0.24213.770.33291.58
Jilin0.221250.650.291705.84
Inner Mongolia0.212142.150.292921.81
Hebei0.212205.630.283008.39
Beijing0.2216.030.28294.66
Average20.231253.930.311710.31
General Zone for Land Consolidation, Restricted Zone for Land ConsolidationHubei0.19723.480.26986.79
Jiangxi0.18426.80.24582.14
Guangdong0.18794.10.241083.12
Heilongjiang0.171258.940.231717.15
Ningxia0.17145.080.23197.88
Hainan0.1780.860.23110.3
Hunan0.17276.220.23376.75
Average30.18529.350.24722.02
Restricted Zone for Land ConsolidationGuangxi0.15521.630.21711.49
Shanxi0.15460.830.2628.55
Gansu0.15446.670.2609.24
Shaanxi0.143850.19525.12
Fujian0.14290.30.19395.96
Xinjiang0.13431.710.18588.83
Sichuan0.12276.30.17376.86
Average40.14401.780.19548.01
Most-Restricted Zone for Land ConsolidationQinghai0.1271.730.1697.84
Chongqing0.1133.160.1445.23
Yunnan0.1148.260.13202.22
Guizhou0.0924.460.1333.36
Tibet0.084.210.125.75
Average50.1056.360.1476.88
Total0.2432,777.920.3344,707.81
* Land consolidation rate means potential/original rural settlement land area.
Table 6. Potentials and land consolidation rates of 14 villages.
ZoneProvinceVillagePotential (m2)Land Consolidation Rate
2010202020102020
SuitableBeijingMaxingzhuang171,289.40 229,201.90 0.330.45
Houliwu245,024.84 305,569.04 0.340.43
Qianliwu43,835.05 50,528.28 0.270.31
ZhejiangGuanzhuang50,974.88 59,071.45 0.470.54
Luciwan46,009.08 51,403.85 0.540.6
Xutie19,087.10 29,071.75 0.240.36
GeneralJiangxiXiatuoshu4335.50 6373.45 0.180.26
Qilangfu7780.43 9746.50 0.40.5
HeilongjiangYinlong20,848.50 27,378.90 0.190.25
HubeiChenke6522.88 15,771.90 0.160.38
GuangdongShuangtang7890.80 9492.75 0.210.26
RestrictedShanxiJiuzhuang10,676.03 21,050.65 0.180.36
Most
Restricted
YunnanDalaowei5767.38 7729.45 0.30.4
Xiaolaowei1357.50 2040.90 0.180.27
Table 7. Proportion of land-use types contribute to potential.
ZoneProvinceVillagePondsIdle LandRoadsAbandoned and Idle Residential LandInefficient Utilized Residential Land
201020202010202020202010202020102020
SuitableBeijingMaxingzhuang2.68%3.01%71.24%53.24%23.40%25.57%19.11%0.51%1.25%
Houliwu8.39%10.10%74.22%59.51%16.38%17.29%13.87%0.10%0.15%
Qianliwu0.32%0.42%74.97%65.04%13.05%24.66%21.40%0.04%0.09%
ZhejiangGuanzhuang1.19%1.54%38.93%33.59%9.45%57.73%49.82%2.15%5.60%
Luciwan11.34%15.22%56.81%50.85%4.57%31.10%27.83%0.76%1.53%
Xutie0.00%0.00%12.29%8.07%23.68%81.45%53.48%6.26%14.77%
GeneralJiangxiXiatuoshu0.00%0.00%25.91%17.62%21.02%63.85%43.43%10.25%17.93%
Qilangfu22.52%26.97%36.53%29.16%11.12%40.52%32.34%0.44%0.41%
HeilongjiangYinlong0.00%0.00%35.34%26.91%21.57%63.37%48.25%1.29%3.27%
HubeiChenke13.20%8.19%26.91%11.13%16.73%30.96%12.81%28.92%51.14%
GuangdongShuangtang0.00%0.00%23.68%19.69%16.84%75.47%62.73%0.85%0.74%
RestrictedShanxiJiuzhuang0.00%0.00%34.96%17.73%41.15%57.80%29.31%7.25%11.81%
Most RestrictedYunnanDalaowei1.37%1.54%92.05%68.68%24.99%6.02%4.49%0.56%0.30%
Xiaolaowei0.00%0.00%72.25%48.05%27.75%33.49%18.46%0.00%0.00%
Table 8. Comparing rates of land consolidation between the comprehensive evaluation method and typical villages verification.
Comprehensive Evaluation MethodTypical Villages Verification
2010202020102020
Beijing0.200.270.270.31
Zhejiang0.250.340.240.36
Jiangxi0.180.240.180.26
Yunnan0.100.130.180.27
Shanxi0.150.200.180.36
Hubei0.190.260.160.38
Heilongjiang0.170.230.190.25
Guangdong0.180.240.210.26

