Abstract
Land use and land cover is a fundamental variable that affects many parts of social and physical environmental aspects. Land use and land cover changes (LUCC) has been known as one of the key drivers of affecting in ecosystem services. The trans-boundary Gandaki River Basin (GRB) is the part of Central Himalayas, a tributary of Ganges mega-river basin plays a crucial role on LUCC and ecosystem services. Due to the large topographic variances, the basin has existed various land cover types including cropland, forest cover, built-up area, river/lake, wetland, snow/glacier, grassland, barren land and bush/shrub. This study used Landsat 5-TM (1990), Landsat 8-OLI (2015) satellite image and existing national land cover database of Nepal of the year 1990 to analyze LUCC and impact on ecosystem service values between 1990 and 2015. Supervised classification with maximum likelihood algorithm was applied to obtain the various land cover types. To estimate the ecosystem services values, this study used coefficients values of ecosystem services delivered by each land cover class. The combined use of GIS and remote sensing analysis has revealed that grassland and snow cover decreased from 10.62% to 7.62% and 9.55% to 7.27%, respectively compared to other land cover types during the 25 years study period. Conversely, cropland, forest and built-up area have increased from 31.78% to 32.67%, 32.47–33.22% and 0.19–0.59%, respectively in the same period. The total ecosystem service values (ESV) was increased from 50.16 × 10⁸ USD y−1 to 51.84 × 10⁸ USD y−1 during the 25 years in the GRB. In terms of ESV of each of land cover types, the ESV of cropland, forest, water bodies, barren land were increased, whereas, the ESV of snow/glacier and grassland were decreased. The total ESV of grassland and snow/glacier cover were decreased from 3.12 × 10⁸ USD y−1 to 1.93 × 10⁸ USD y−1 and 0.26 × 10⁸ USD y−1 to 0.19 × 10⁸ USD y−1, respectively between 1990 and 2015. The findings of the study could be a scientific reference for the watershed management and policy formulation to the trans-boundary watershed.
1. Introduction
Land use and land cover change (LUCC) is a fundamental of the global change [1] that influences the relationship between human and natural system in many parts of the social and physical environmental aspects [2,3]. Particularly, after the beginning of large-scale alternation in land use land cover (LULC), the impact of anthropogenic activities including global climate change has directly impacted in socio-economic development [4]. In addition, the current changing rate of LUCC, extents and intensities are far greater than ever in the history. These changes encompass the greatest environmental concerns of human population today including climate change, loss of biodiversity and overall ecosystem services at the local, regional and global scales [5]. Besides, LUCC is a fundamental component of global environmental change with direct implications on the Earth’s climate, ecology and interactions between human society and physical factors, thus, it considered as one of the key factors while studying the dynamics of LUCC [6,7]. On one hand, land use change is also recognized as the most pervasive drivers of degradation and change of ecosystems which altered the earth’s landscape and can have long-term implications to important ecosystem services [1,3,8]. Among the various causes, the human activities are the key drivers to shape land for many years [9], while on the other side the changing land use land cover results in a large economic improvement and human well-being with the cost of ecosystem services provided by lands [10].
The Himalayan region is the sources of world’s major river systems including the Ganges, Brahmaputra and Indus [11] as well a repository of biodiversity and ecosystem services [12]. The GRB encompasses the headwaters of the major river systems which play an important role for drinking, agriculture, tourism and other environmental services. There has been lots of changes on LULC with many environmental and economic consequences. For example, the rapid population growth, urbanization and urban migration in many Chinese cities have resulted the arable land transformation to urban land with a large amount of natural land and losing ecosystem services values [13]. Similarly, Nepal is also experiencing the emerging urbanization taking place to agricultural land, forest, grassland, water bodies in recent decades while the large number of population (close to 66%) of the total population engaged in agricultural sectors for their livelihood [14]. Between 1990 and 2013, the agricultural land converted to urban area by 29.19 km2 in one of the main (Seti) watershed of the GRB [15], while the urban area of the Pokhara sub-metropolitan city has increased from 6.33% to 51.42% in between 1977 to 2010 [16]. Historically, the LULC has been changing at different spatial and temporal scales. Still, studies have not covered in the GRB with trans-boundary watershed level of the Central Himalayas which needs to understand the LULC changing trend for managing the better ecosystem services and policy formulation.
Ecosystem provides a various form of services through payment mechanism which contributes surplus money to national income and supports to improve the local livelihoods [17,18,19]. The ecosystem services provides several goods and services to human via ecosystem function [18,20,21]. These services are directly or indirectly linked by human for life support from its process and functions [22]. However, due to rapidly growing demands of the services, it has been degrading significantly during the recent past compared to the long-term history, which resulted in a substantial and largely irreversible loss in the natural diversity of life on Earth [23]. Due to changing landscape and management, the ecosystem service values (ESV) has been decreased of USD 20.2 trillion/year from 1997 at the globally [18,24]. Similarly, in the Tibetan Plateau, the ESV has been declining by 9363.9 × 108 Yuan (Chinese currency) annually which accounting for 17.68% in China and 0.61% of the global [25], which also affects the ecosystem services to local livelihoods and community at the regional scales in recent time [26,27]. The decreasing ESV on the global scale to local scales are the major concerns to manage ecosystem services. However, still, studies on ESV in GRB has not carried out. It has necessary to understand the ESV that how land use land cover dynamics affecting to the overall ESV of an area.
Remote sensing (RS) analysis delivers a synoptic information of LULC at a particular time and location [28]. The integrated GIS and RS application found to be effective tools in understanding the rate of LULC change with time and space [29,30,31] and it can answer the various questions about LUCC and impact on humankind and the environment [32]. Since historical time, many studies were used GIS and RS to detect LUCC at the different spatio-temporal scales. Some of them, the studies were covered in the global scales at the different periods adopting various satellite images, resolution and methods [33,34,35,36,37]. The previous studies also used GIS and RS methods to analyze the LUCC detection at the different small scales of the GRB [15,16,38,39,40,41]. Still, studies regarding the LUCC and ESV in the transboundary level have not covered to the GRB. Quite a few attempts have been made to assess the impact of LUCC on the ecosystem service in some parts. However, such studies are very scanty in the GRB. In this context, the present study aims to find the spatial and temporal analysis of LUCC and assessing the ESV provided by different land cover types between 1990 and 2015 in the GRB, Central Himalayas.
2. Materials and Methods
2.1. Study Area
The GRB is the trans-boundary river basin located between 25.6°−29.4° N latitude and longitudes 82.8°−85.82° E longitude covering the territory of China (Tibet), Nepal and India [42]. The river basin is a sub-basin of Ganges mega-river basin where about 72% area lies in Nepal and rest around 28% in India and the Tibet Autonomous Region (TAR) of China (Figure 1). The basin covers 44,770 km2 area of the Central Himalaya. The main trans-boundary Trishuli River originates from Shigatse (TAR) then it flows the central part of Nepal then confluence to the Ganges River in Patna (Bihar), India. The GRB has seven main Himalayan tributaries namely: Trishuli, Budhi Gandaki, Daraudi, Marsyandi, Madi, Seti and Kali Gandaki, also called Sapta Gandaki. The Kali Gandaki flows between the 8000 m in the Dhaulagiri and Annapurna ranges which is the deepest Gorge in the world [43].
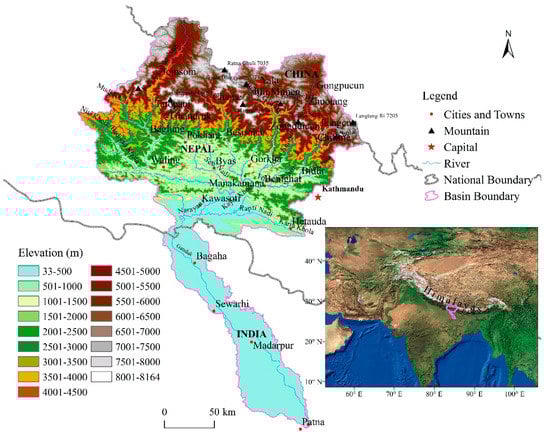
Figure 1.
Topographical and altitudinal distribution of the GRB, Central Himalaya.
The GRB covers different districts/county of the three countries. The basin partially covers three counties (Gyirong, Nyalam and Saga) in Shigatse of the TAR in the northern part of the basin, which accounts for 10% of the basin. The dominant part covers in Nepal by 19 districts (12 districts are fully and seven districts are partial) of the different ecological regions (Mountain, Hill and Tarai). Likewise, in the southern part (India), the basin covers nine districts; two districts from Uttar Pradesh and seven districts from Bihar Pradesh. The GRB covers 18% area in India.
The GRB has large altitudinal gradient starting from 33 m above mean sea level (masl) in the south to 8164 masl in the north. Within the area, the land cover types existed extremely heterogeneous, as well as diverse climates and varied ecological conditions, which has been resulting in a high level of biodiversity with diverse ecosystem services in the basin. The cropland and forest are most dominant land cover in the mid and down-stream reaches of the basin. Most of the forested areas are under the protected area such as Mt. Qomolangma, Chitwan, Langtang, Shivapuri national park, Annapurna, Manaslu conservation area and Valmiki Tiger Reserve.
2.2. Data Sources
Due to low image quality, availability of satellite images and existing quality of reference dataset, this study was chosen 1990 as earlier year. Based on previous studies, still studies on LUCC have not analyzed the recent year in the GRB, thus, this study were chosen 2015 as recent year. This study obtained maximum cloud-free (below 5%) Landsat 5-TM (Thematic Mapper) 1990 and Landsat 8-OLI (Operational Land Imager) 2015 satellite images with 30 m spatial resolution downloaded from a scientific data-sharing platform of the United States Geological Survey (USGS) earth explorer (https://earthexplorer.usgs.gov/) geoportal. A total of 6 scenes of satellite images were retrieved in November 2017 (Table 1). The land cover dataset of 1990 for Chinese and Indian part was extracted by supervised classification methods and Nepalese part was collected from International Centre for Integrated Mountain Development (ICIMOD) (http://rds.icimod.org). The land cover database of the ICIMOD also based on Landsat 5-TM with 30 m spatial resolution. Besides, RS data and other auxiliary spatial datasets were collected from the Survey Department, Government of Nepal and DIVA-GIS (http://www.diva-gis.org) geoportal.

Table 1.
Details of remotely sensed satellite images used in this study.
2.3. Image Processing and Extraction of LULC
The multi-spectral satellite images were first acquired and pre-processed in ENVI 5.3 and GIS 10.5 software. The pre-processing such as radiometric correction, dark object subtraction and atmospheric correction was carried out by using ENVI 5.3. Figure 2 has presented the overall workflow for the study.
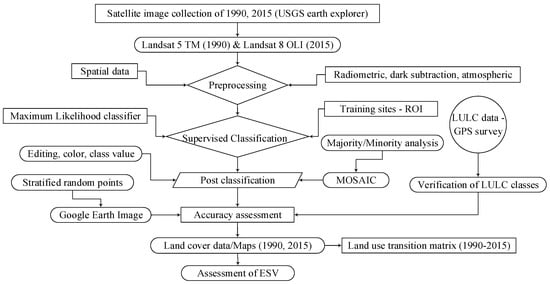
Figure 2.
Schematic flowchart of the study.
Supervised classification: Supervised classification is one of the techniques most frequently used for quantitative analysis of RS data [44]. Maximum Likelihood Classification (MLC) is a well-known and most widely used parametric classification algorithm [45,46,47]. In the study, the supervised classification methods with MLC algorithm was used to produce land cover database (Figure 2). Spatially random samples were selected as the training points/ROI for supervised classification. Due to well knowledge on landscape of the GRB, this study applied expert’s knowledge to generate training samples/ROI and also consulted as references to the national land cover data (China, Nepal and India) in case of confusions. The ROI/training samples were created in each satellite images to extract the LULC classes existed in the GRB. Each image was classified using MLC separately and mosaicked at the final stage. The land cover classification system was adopted from existing classification systems (Table 2) of Food and Agricultural Organization and United Nations Environment Programme Land Cover Classification System (LCCS) [48], land cover classification system of Kaski [49], land cover mapping of Nepal for 1990 [50], land cover classification of Nepal for 2010 [51], land cover mapping of the Koshi River Basin for 2010 [52] and land cover classification of India [53].
Table 2.
Land cover classification systems.
2.4. Accuracy Assessment
Accuracy assessment/ validation is the final and one of the most important steps of RS data that establishes the information value of resulting data to the user [54]. Most commonly accepted stratified random points methods were adopted to validate the classification accuracy of land cover data in Google Earth. The Google Earth provides cost-free high resolution of satellite images which are very important references to validate the LULC classification [55]. The previous various studies were used Google Earth images for image classification accuracy [51,52,56,57,58]. For the reference/sample database, this study used Google Earth images and field verification data collection from different places of the GRB. A total of 1093 and 1017 stratified random points (reference locations) were created in the classified image for 1990 and 2015, respectively then verified with high-resolution Google Earth images. The random samples/points per LULC class were assigned minimum 50 and maximum 200 m distances apart. The small area of land cover types such as rivers and lakes and built-up areas were selected by 57, 53 samples for the validation of classified data. For the large areas such as cropland, and forests cover were selected by 223 and 211 respectively for the year 2015. The topographical maps of Survey Department of the Government of Nepal during 1992–2001 were commonly used as references to validate the 1990 land cover database in Nepal [59]. This study also used the topographical maps as references to validate the 1990 land cover database.
Additionally, during the field study in May 2018, a total of 238 homogeneous land cover ground truthing (samples) were collected by using Global Positioning System (GPS) and verified with classified images of 2015. Each ground truth (location) was selected at approximately 100 × 100 m2 area of regular of LULC types from the study area. The surrounding land class from the selected location also recorded while surveying the field. In order to calculate the Kappa statistics, this study followed the Equation (1) from previous studies [54,60]. Lastly, the accuracy of the classified images was computed based on the calculation of the user’s, producer’s and overall accuracy.
where; K = Kappa Coefficient, r = no. of rows and columns in error matrix, N = total no. of observations (pixels), xii = observation in row i and column j, xi+ = marginal total of row i and x+1 = marginal total of column i.
Land use transition matrix: In order to assess the quantitative changing pattern of the transition of land use changes especially for landscape ecology and GIS studies, the land use transition matrix is widely used [61]. Land use transition matrix refers the land use change into two stages for example from 1990 and 2015 in this study. This study computed the transition matrix from the following Equation (2) [62].
where; Pij indicates the area in transition from landscape i to j. Each element in the transition matrix is characterized assuming (1) Pij is no-negative and (2) .
2.5. Assessment of the Ecosystem Service Values (ESV)
In order to estimate the ESV in the GRB, the present study followed the modified global ecosystem service values developed by previous scholars [18,24,46]. To estimate the global ecosystem service values, Costanza et al. (1997) have classified 17 ecosystem services for 16 biomes. Based on Costanza’s global ESV, Xie et al. (2003) have estimated the ESV for per unit area of the different land types in the Tibetan Plateau by using ecological assets value table with adjusted price value of the biomass, which established as the ecosystem services value unit area of the Chinese terrestrial ecosystems. Zhao et al. (2017) adopted the ESV of Xie et al. (2003) in Koshi River Basin (KRB) adjoining to the eastern part of the GRB. Due to partial coverage in the Tibetan Plateau by GRB, this study also followed Xie et al. (2003) to assess the ecosystem service valuation per hector of the terrestrial ecosystem in the GRB (Table 3). In addition, the similar topographic features, geological and climatic characteristics, the same ESV coefficient is replicated in the GRB as applied in the KRB.
Table 3.
Different land cover types and ESV (USD ha−1 y−1).
To obtain the total ecosystem service value of each land use, it was obtained by multiplying the area of each land types by the value coefficient Equation (3) [63].
where, ESV is the estimated ecosystem services value, Ak = area (ha), VCk = the value coefficient (USD/ha/year) for the land use category “k”.
3. Results
3.1. LULC Classification Accuracy
The classification accuracy was computed by 85.16% by user’s and 87.90% by producer’s accuracy in 2015. Similarly, in 1990, the user’s and producer’s accuracy were computed by 91.86% and 86.11, respectively. The overall accuracy was calculated by 86.63% in 2015. The Kappa statistics are almost perfect rank (0.81–1.00) that computed by 0.845 and 0.854 for 1990 and 2015, respectively. The classification accuracy of the each LULC has shown in Table 4. Due to similar characteristics of river/lake and swamp/wetland and having small fractional area, this study evaluated in a single class by water body.
Table 4.
Confusion matrix and LULC accuracy of the study in 2015.
3.2. Status and Spatial Distribution of LULC
The results revealed the important changes of LULC over the 25 years study periods. This basin has categorized into nine land use land cover classes. Predominantly the cropland is distributed in the mid and down-streams reaches of the basin which accounted for 29.03% and 69.11%, respectively in 2015. Only a few patches of croplands have distributed in the up-stream reaches, particularly in the north-eastern and north-western part of the study area. Similarly, in the mid and down-stream reaches; forest and croplands are the most dominant land cover of the basin. Spatially, the forest covers 33.22% which is mostly distributed in the mid-stream to down-stream of the basin. Obviously, the high mountains are roofed by snow/glacier (7.27%) and barren land (13.75%), which is mostly distributed in the northern part of the basin. Primarily, snow cover, grassland and barren land are dominant land cover in the up-stream reaches. Though, the swamp/wetland is the smallest area of about 0.41% of the total basin, which particularly located in the southern part, that is, near to the Ganges River and lower elevation of the basin. The built-up areas have mostly increased in the central, eastern and southern parts of the basin which covered 0.59% of the basin in 2015 (Figure 3).
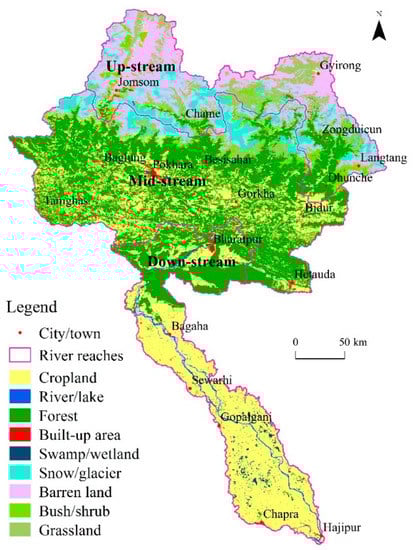
Figure 3.
Distribution and status of LULC in the GRB in 2015.
3.2.1. Spatio-Temporal Changing Pattern of LULC from 1990 to 2015
Based on ecological zones of Nepal, including Mountain, Hill and Tarai, this study has divided into 3 reaches (up-stream, mid-stream and down-stream) of the basin. The changing patterns of LULC is distinctly observed in all the reaches from 1990 to 2015 (Figure 4). The status of forest has a bit improved in recent years in the mid-stream reaches of the GRB. During the last 25 years, the cropland has increased from 0.94% to 2.04% in the up-stream reaches. Similarly, the cropland has increased from 27.24% to 29.3% over the same periods in the mid-stream region. Only a small area decreased in cropland (70.11% to 69.11%) in the down-stream reaches. Though, the built-up area has increased in all the reaches. The areas have increased from 0.01% to 0.05%, 0.16% to 0.56% and 0.42% to 1.17% in the up, mid and down-stream reaches, respectively during the 25 years.
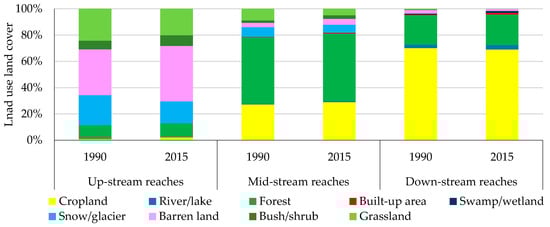
Figure 4.
Changing trend of LULC between 1990 and 2015 at the different reaches in the GRB.
3.2.2. Key Changes in Different LULC between 1990 and 2015
Cropland: From the study, it was found that cropland is the predominant land type of the basin. The area under cropland has increased from 31.78% to 32.67% between 1990 and 2015 (Table 5). Mostly, the conversion of forest land into cropland was observed with the minute amount from other land use types (Table 6).
Table 5.
LULC status and changes between 1990 and 2015.
Table 6.
Transition matrix of different LULC types in the GRB during 1990–2015 (area km2).
Forest cover: During the past 25 years, the forest cover has increased in the GRB. The area under forest cover was 32.47% (14,537.80 km2) in 1990, whereas, it has increased to 33.22% (14,873.59 km2) in the basin (Table 5). The increased forest cover converted from chiefly cropland land and small patches from other different land cover types over the years.
Built-up area: Unlike to the other land use types, the areas under built-up has been increasing trend over the basin. The built-up areas have gained more than 300% during the periods of 1990 to 2015. However, the distribution and increasing trend is not uniform across the basin. The built-up areas have encroached mainly to cropland and forest areas (Table 6). The urbanization has dramatically increased in Pokhara, Narayanghat and Hetauda cities of Nepal and near to Patna city, India (Figure 5). Overall, the results revealed that the built-up area has increased from 84.71 km2 (0.19%) to 263.71 km2 (0.59%) in the GRB.
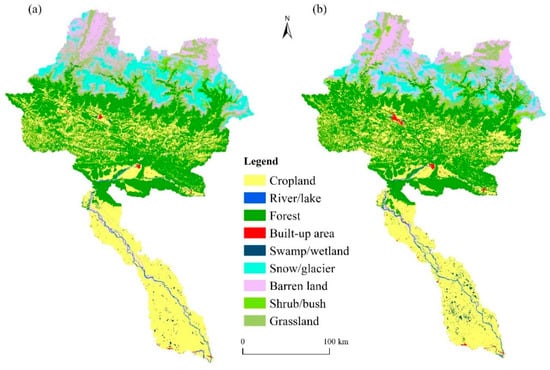
Figure 5.
Spatial and temporal LUCC in the GRB; 1990 (a) and 2015 (b).
Snow/glacier cover: The study has revealed that the snow/glacier cover have contracted from 9.55% to 7.27% (4273.66 km2 to 3253.22 km2) between 1990 and 2015. The decreased areas resulted to other types of land cover such as barren land and other form of small land cover patches.
Grassland and bush/shrub land: Grassland has shrunk from 4755.29 km2 to 3253.22 km2 (10.62% to 7.62%) during the study period. In the meantime, the bush/shrub land has expanded by 297.74 km2 (2.68% to 3.35%) over the study area between 1990 and 2015.
River/lake, swamp/wetland and barren land: Mostly the rivers and small streams are originated from the higher Himalayan region. The river/lake and swamp/wetlands have been increasing trend which increased from 0.99% to 1.22% and 0.19% to 0.59%, respectively between 1990 and 2015. Likewise, the barren land also has increased notably from 11.52% to 13.66% over the same time span.
3.3. Assessing the Ecosystem Service Values
Based on ecosystem services, modified by Xie et al. (2003) (Table 3), this study has followed and estimated the ESV between 1990 and 2015 in the GRB (Table 7). From the estimation of total ESV, it was found by 50.16 × 10⁸ USD y−1 in 1990 in the GRB. Among the values of different LULC types, per unit area values of ecosystem services, forest, cropland, river/lake and grassland comprised of the highest as compared to the other land cover types in 1990. The ESV of forest was estimated by 31.53 × 10⁸ USD y−1; cropland, 9.95 × 10⁸ USD y−1; grassland, 3.12 × 10⁸ USD y−1; river/lake, 2.91 × 10⁸ USD y−1, respectively in 1990. These high values of the four land types accounted for 94.74% of the whole river basin. The highest coefficient value carries for swamp/wetland areas among the land cover classes are mostly observed in the down-stream reaches.
Table 7.
ESV of the different land cover types between 1990 and 2015.
Overall, the ESV has increased from 50.16 × 10⁸ USD y−1 to 51.84 × 10⁸ USD y−1 between 1990 and 2015 (Table 7, Figure 6). The areas increased in cropland, forest, water bodies, swamp/wetland, barren land are the main contributing factors in overall increased of ESV in the GRB (Table 7). However, at the same time, the values of the snow/glacier and grassland have decreased over the basin. The ESV of snow/glacier and grassland was 0.26 × 10⁸ USD y−1 and 3.12 × 10⁸ USD y−1, respectively in 1990, while the values of snow/glacier and grassland have decreased into 0.19 × 10⁸ USD y−1, 1.93 × 10⁸ USD y−1, respectively in 2015.
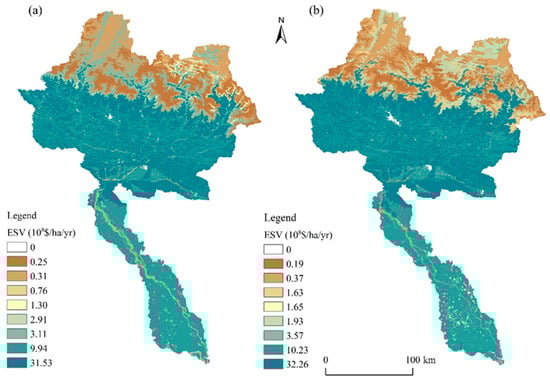
Figure 6.
Spatial and temporal status of ESV in the GRB between 1990 (a) and 2015 (b).
4. Discussion
4.1. Spatio-Temporal Dynamics of LULC
Historically, the cropland has shown increasing trend over the three countries (China, Nepal and India). During the past 300 years (1700–2010), China experienced the highest increased in cropland. Due to population growth, the cropland was increased in the cost of forest land before 1980s, however, after 1980s land use dynamics exhibited by agricultural intensification and rapid industrialization in the country [64,65]. In Nepal, about two-thirds of the total population rely on agriculture for their livelihoods and subsistence [66]. Over the recent past 50 years, the cropland has increased by 13% over the country [67]. A similar pattern was also observed in India. The increasing population has been driving the increase in the agricultural land across the country. During 1880–2010, the cropland has increased from 92 million to 140.1 million hectors. Simultaneously, the population also increased from 200 million to 1200 million over the country at the same time span [68]. As a result, the number of emerging cities and megacities have increased from 5161 to 7935 in 2011 across the country [69]. However, the LUCC are different according to spatio-temporal scales in the different reaches of the GRB.
4.1.1. LUCC in the Up-Stream Reaches
The snow/glacier cover is sensitive to climate change that plays a fundamental role for the characterization of the land cover composition of an area [52]. The climate change and human activities have been playing a crucial role to change on snow/glacier cover. The increasing temperature has been resulting to the permafrost and snow melting over the Tibetan region in the recent years [70]. Importantly, temperature fluctuation is the vital role on glacier changes in the Mt. Qomolangma (Everest) National Nature Preserve (QNNP) region. The wetland area increased after the establishment of reserve area in the Mt. QNNP. The glacier has decreased by 501.91 km2 with the annual mean reduction rate of 16.73 km2, while the glacier lake increased by 36.88 km2 over the area [71], especially the glacier lakes expanded by approximately 14.1% from 1990 to 2015 in the southern slopes of the Central Himalayas [11]. The object-based image classification and geographical information have found that during 1976 to 2006, the wetland expanded by 94.5 km2 (5.60%) over the QNNP [72]. In the case of snow/glacier changes, the findings of the present study are good agreement with Nie and Li (2011) that the decreasing trend of snow/glacier cover also observed in the GRB during the period of 1990 to 2015.
Historically, the snow/glacier cover has been decreasing trend in Nepal Himalayas. The average annual mean temperature has increased by 0.12 °C/year and 0.09 °C/year in the Langtang and Imja region. As a result, the glacier cover decreased by 24% over the country between 1977 and 2010 [73]. Similarly, Langtang and Khumbu Trans-Himalaya region also experienced the decrease in snow/glacier cover. Between 1976 and 2000, the snow/glacier cover has decreased by 89.6 km2 and 42.32 km2, respectively in the region [74]. However, over a small area (Lamjung district) of the basin, the snow cover has increased by 2% during 1976–2010 [75]. This only an exceptional result could be due to adopted the cloud cover by 25.98% of the satellite images and spatially at small area. In addition, the classification accuracy also not very high (overall accuracy by 80.47%). Most of the studies were used the cloud cover less than 5%. The current studies also used less than 5% cloud cover in the satellite images.
The human activities encroaching the grassland across the Tibetan Plateau over the past 50 years [70]. Moreover, other several triggering factors such as altitudinal gradient, climate change effects, slopes and aspects are the major causes of vegetation changes in the Mt. QNNP. The anthropogenic activities near to gentle slopes, water bodies, roads also have found a significant impact on grassland contraction in the Tibetan Plateau. Due to these various causes, the vegetation cover degraded dramatically by 5.04% during 1981–2001 in the Mt. QNNP [76]. Likewise, in the trans-Himalaya region of Nepal also have decreasing trend of rangeland/pastureland due to human activities, fragile ecology and scattered rainfall [77,78,79]. Consistent with previous studies, the present study also found decreasing trend of grassland over the last 25 years in the GRB.
4.1.2. LUCC in the Mid-Stream Reaches
The mid-stream reaches experienced the increase in cropland areas. A historical study has found that the agricultural land was increased by 1693 ha in between 1957 to 1988 in upper Pokhara valley. The forest cover had mostly converted to rice fields during this period [80]. In addition, the barren land and open forest were also converted to agricultural land and settlement area by 1.24%, 9.17%, respectively at Begnas and Rupa lake watersheds in between 1988 to 1999 [81]. However, in the upper Pokhara valley, the increasing agricultural land was converted from shrub land, pasture and forest from 1950 to 1990 [82,83,84]. Population growth, human migration to urban areas and intensive agricultural farming systems are the main drivers of the agricultural land change across the basin [16,85,86]. Due to introduce of cash crops farming, the agriculture land has increased significantly in Lamjung district. The agricultural land increased from 18.10% to 32.50% in between 1976 to 1999 in the district [75]. During 1976 to 2003, cultivated land increased dramatically by 82% at the Pokhare Khola watershed, a sub-catchment of the Trishuli River. The establishment of irrigation canals in 1995 and increase of human and livestock population at this watershed were the key triggering factors to increase the cultivated areas at the watershed [82]. This current study also supports to the aforementioned studies that in the mid-stream reaches also increased the cropland during the 25 years. The long-term plan and policies (Pesticides Act 1991, Agriculture Perspective Plan 1995/96, Land Use Policy 2012) and development of infrastructures over the country are the major fundamentals of the increasing trend of cropland over the country after 1990s [87,88,89].
The historical forest cover change study from 1930 to 2014 has found that forest cover decreased at the high rate during 1930–1975 at the annual rate of 760 km2. After 1975, the annual forest degradation rate has been controlled by 212 km2, 57 km2, 38 km2, 4 km2 in between 1975–1985, 1985–1995, 1995–2005 and 2005–2014, respectively [90]. The current study observed the forest cover increasing trend between 1990 and 2015 in the GRB. The various causes could be the causing factors for the increasing trend of the forest cover. The improvement of forest cover has been driven by different factors such as forest acts, started of community forest and establishment of protected areas in Nepal [91,92,93,94]. The introducing of Community Forest (1970s) and Forest Act (1993) and Forest Regulation (1995) also the fundamentals to improve forest cover over the country [92]. The community-based forest management practices have resulted in dense forest expansion by 82.3% during 1975–2015 at Phewa lake watershed [57]. The previous studies have analyzed that around 1% of forest cover increased annually as well increased watershed quality after the 1990s in the Phewa lake watershed [91,95,96].
The urbanization has been increasing trend across the GRB since historical time periods. The previous studies based on different satellite image analysis, secondary data sources and the field studies also have concluded the expanding of urban area in the large cities and adjacent sub-urban areas [38,80,97]. In Pokhara city (second biggest city of Nepal), the urban area has been increased from 20.8% to 51.42% during the last two decades (1990–2010) [16]. The population growth also recorded the highest at the rate of 5.6% in the city while the overall country had only 2.25% in 2001. Due to increasing population, the urbanization has resulted from 24.62 ha to 416.35 ha during 1978–2001 in the city. A study has revealed that the urbanization process largely encroached to the large open spaces of the city [40]. Similarly, a study based on satellite image analysis has found that the built-up area has increased more than two folds (from 24.03 to 54.20 km2) in Pokhara Valley from 1990 to 2013 [15]. The status of the city also upgraded from sub-metropolitan city to metropolitan city in 2016 as well Government of Nepal has declared the capital of Gandaki Province in 2017. This present study also observed the built-up area expanded more than threefold during 1990 to 2015 in the GRB. The similar pattern of the results could be due to rapid spatial and temporal changes of LULC in the basin with increasing anthropogenic activities. River/lake and swamp/wetlands have been increasing trend in the basin. A historical study on LUCC has found that the water bodies was increasing trend in the Phewa lake watershed during 1975–2015 [57]. Likewise, the barren land also increasing trend over the study period. Snow/glacier melting could be the causes of increasing area of barren land over the study area.
4.1.3. LUCC in the Down-Stream Reaches
The down-stream reaches have been experiencing increase extent on forest cover since historical time periods. During 1990 to 2015, the forest cover observed increasing trend in the down-stream reaches. The almost forest covers in the down-stream reaches are under the protected areas such Chitwan, Parsa national park and buffer zones and Valmiki tiger reserve. The establishment of community forest and minimized on illegal felling of trees, the forest cover has increased by 0.44% per year during 1991–2013 in Barandabhar forest corridor, Chitwan district [94]. Baidhya et al. (2009) also studied the land use changes at the buffer zone of Chitwan national park with using of topographic maps, Land Resources Mapping Project (LRMP) data and Landsat images. Study were revealed that the dominant forest cover was expanded by 45.33% during the 1978–1999. However, a study has revealed that forest cover has decreased by 32% and 22% in two small watershed Shakti and Kair of Chitwan district during 1978 to 1992 [98]. The degraded forest could be due to development of East-West Highway, development process and eradication of Malaria in the Tarai region of Nepal [99,100]. However, the others previous studies were not found the decreasing forest trend in this region. The spatial and temporal scale, adopted aerial photos, manually digitization, and coarse resolution adopted from historical studies could be the opposing results to the GRB.
The urbanization and rapid industrialization process have been encroaching to agricultural land day by day in many urban areas of Tarai region (Nepal) and Bihar Pradesh (India). During 2003 to 2013, the agricultural land has decreased by 5.83% over the Bihar Pradesh [101]. However, a study based on GIS analysis has resulted that the agricultural land was increased at the cost of forest and grazing land at the Khageri watershed, Chitwan. This study was showed that agricultural land increased more than two times (10.10% to 28.96%) during 1978–1999 at the watershed [102]. This contradicts result could be due to adopted data sources, study area and temporal coverage. Dhakal (2014) was used LRMP (1978/79) at the scale 1:50,000 and Topographic map (1994/96) at the scale 1:25,000, while this current study used 30 m resolution of Landsat images with more than 80% of the overall accuracy of the classified images. In addition, the spatial coverage of the two study is vast differences that Khageri watershed covers only 148.65 km2 while GRB covers 44,770 km2 area of the Central Himalaya.
Built-up areas have been increasing trend over the down-stream reaches. The large cities/towns of the reaches such as Bharatpur, Chapra, Hajipur are increasing over the study periods in the GRB. The analysis of GIS and RS have resulted in urbanization being increased by 320% from 1989 to 2016 in Tarai region of Nepal [56]. This high rate of urbanization could be due to spatial coverage of the study area. Rimal et al. (2018) covered the whole Tarai region of Nepal which has already high urbanized cities than the down-stream reaches of the GRB. Similarly, a study based on supervised MLC analysis has also found that the built-up area increased from 2.49% to 7.76% during the past 22 years (1988–2010) in the Muzaffarpur, Bihar, India [103]. This current study also supports and the similar trend to the previous studies.
4.2. Valuation of Ecosystem Services in the GRB
Costanza et al. (1997) have provided the global ecosystem valuation which followed by many scientific studies since valuated the global ecosystem services. Their study was challenged on theoretical and empirical grounds. However, the study stand for the most comprehensive set of valuation coefficients [104]. Costanza et al. (1997) was estimated the total global benefits of $33 trillion per year that accounts close to 83% world’s gross production. The study was valuated the ecosystem services by multiplying the level of each environmental service of the marginal value of the services [105]. The changes on ESV are determines by the presence of human, social and built capital [24], socio-economic factors, similar ecosystem complexity and changes in land use policy [106,107]. According to Costanza et al. (2014), the ESV is decreasing at the globally with the amount of 4.3–20.2 × 10¹² USD per year during 1997–2011. However, the changing rate of each land cover is not implemented to all the country and region. The annual ESV from forest cover carry 969 USD/ha/year at the globally [24]. Though, Xie et al. (2003) have estimated 2168.84 USD ha/year. The difference could be due to variances the global level land cover data 1 × 1° by Costanza et al. (2014) and 30 × 30 m resolution by Xie et al. (2003). A study has revealed that the spatial scales and resolution of the satellite images influences to the ESV. The finer resolution gives the more reliable results than the coarse resolution [108]. All land cover types are also not included by Costanza et al. (2014) in his study which mentioned in Table 3. For example, the shrub land and snow/glacier did not estimate per year ESV at the global level which could be one of the most important aspects for the ecosystem, climate change and biodiversity. Xie et al. (2003) have developed an equivalent factor table for per unit area of ecosystem value by providing different nine categories of ecosystem service functions in the Tibetan Plateau, China [62,109]. The coefficient value has been used in various places in China and others. Zhao et al. (2017) also adopted Xie et al. (2003) coefficient values in the KRB. The GRB also covers in the Tibetan Plateau as well the topography also continues to the KRB. Moreover, the land cover categories and altitudinal gradient, ecosystem services almost same to the KRB. Zhao et al. (2017) classified nine land classes as the same classes to the GRB. Therefore, this study followed the Costanza’s modified Xie’s evaluation methods in the GRB. Following the classification of Zhao et al. (2017), the present study also classified into nine classes of LULC in the GRB. This study has estimated of the ESV provided by the different land covers types. Though, the ESV for urban ecosystem services was not estimated in the study due to lack of coefficient values from previous studies. A high resolution of satellite images is needed to improve the estimation of ESV delivered by the different land cover types.
4.3. LULC Dynamics and Its Impact on Ecosystem Service Values
The LULC dynamics crucially influence on the ecosystem and thus, eventually on the local livelihoods of an area [26,110]. The decline of alpine grassland in the Tibetan Plateau has a significant impact on grassland ecosystem services [111]. Due to grassland degradation, the economic loss associated with the decline of biomass was estimated by $198/ha in 2008 [112]. Though, the improvement in forest cover plays the most crucial role for ecosystem services and habitat quality of a watershed [113]. Due to increased forest and grassland in the Qinghai Lake region, the ESV were increased from 694.50 billion Yuan to 714.28 billion Yuan during 1990 to 2000. The improvement of forest cover is the fundamental role on ecosystem and environmental conservation over the region [114]. However, the decreased in woodland and water body, the total ESV in Shenzhen, China decrease of 231.3 million Yuan from 1996 to 2004 [115]. The dramatic urbanization process shrank to arable land that caused the reducing the total ESV by 123 million Yuan during the past 22 years in Huaibei, China [62]. Due to the rapid changes of agriculture in the Sanjian plain in China, ecosystem services are arising in this area. The cropland conversion into forest, wetland and grassland have decreased in ESV from 169.88 × 10⁸ to 120.00 × 10⁸ Yuan during 1980–2000 [116]. The dramatic land contraction happened significant loss of ESV in this plain [117]. Thus, the decreasing of ESV indicates the degradation of ecological condition of an area [118]. In the GRB, the land cover change has played the positive role to increase in the ESV. Overall, the ESV of the basin has indicated that the services have actually improved as compared to 1990. These declined ESV from snow/glacier and grassland were transformed to other ecosystem services such largest area in barren land, grassland and bushland. The ecosystem services delivered from swamp/wetland showed greatly increased of ESV during the 25 years. During the study periods, the ESV from swamp/wetlands increased more than two-fold in the study area. The ESV of these land cover was transformed primarily from cropland, river/lake and forest cover in the GRB.
The human-induced ecosystem is economically profitable and society also benefited but it is not the sustainable way in terms of ESV. For example, the process of urbanization encroaches the surrounding either agricultural land, forest or grassland and also generates incomes sources from tourism activities but the overall ESV is losing by the short-term profits [119] and resulting in decreased in regional ecosystem services [120]. However, in India, the urbanization process reduced the pressure on the forest. Due to gradually transforming from fuelwood to liquefied system, the forest demand has declined from 22% household in 2005 [121]. Even though, the urbanization challenging including native habitats, protected area [69]. The various studies have concluded that the contraction of agriculture land to abandoned land are subjected to destroy the different ecosystem services by different possible geomorphic hazards and food insecurity in the mountain area [41,122]. Overall the increase of ESV of the current study has indicated the improving status of watershed quality in the GRB
4.4. Future Perspective of LULC in the Trans-Boundary Level
Around 50% of the earth’s land surface area is encompassed by share river and lake basins and providing the resources on Earth [123]. In various ways, people and wild species taking advantages from the natural resources. The GRB which shares three Himalayan countries are very rich in natural resources and ecosystem services. The snow/glaciers are the major water tower for South Asian countries. Moreover, the water resources changes are the indicators of climate change that directly effects; especially in down-stream reaches [121]. Due to human activities encroaching to natural resources, the overall ecosystems have been degrading over the world. The study on LULC dynamics provides a clear micro-picture of changing earth surface with space and time. The trans-boundary LULC study and database can be used to the ecosystem, biodiversity, resource management and future plan in the areas. The collaborative works on different sectors in the cross countries could be the key fundamentals for balancing the natural resources and profit sharing in the up, mid and down streams reaches for the betterment for concern stockholders.
The ecosystem services from natural resources in the mountain region benefit not only the local communities but also living in the downstream areas such as agriculture, urban population, tourism, business, national and the international communities [124]. The highly increasing urbanization encroaching the land cover significantly at the global level. The existing many studies on ecosystem services have suggested to implement the proper policies in national park, conservation area, buffer zone and watershed areas for balancing the ecosystems and their services and proper profit sharing. Due to rapid conversion of cropland to urban areas, the studies suggested that the policy should address to control the encroachment of urban areas on cropland, grassland and woodland [125]. Due to lack of proper policy and institutional mechanism within the country, the services are not going proper sustainable way [17,126,127,128,129,130]. Therefore, the joint institutional trans-boundary watershed management system could be milestone for sustainable ecosystem services and natural resources management to the trans-boundary watershed level.
5. Conclusions
The study has analyzed the LUCC and impact on ESV in the trans-boundary of GRB during the last 25 years; from 1990−2015. The results revealed that the LULC dynamics at spatio-temporal scale has been most notable changes. There was an increasing trend of cropland, forest, built-up area, river/lake, wetland/swamp and barren land. The cropland and forest cover slightly increased, though, the built-up area increased significantly across the basin, including Pokhara, Bharatpur and Hetauda city from the mid and down-stream reaches. This indicates the rapid urbanization trend in the mid and down-stream reaches of the GRB. However, the snow/glacier and grassland decreased over the basin. The LULC dynamics change the ESV, due to positive changes in dominant land cover, the overall ESV has increased from 50.16 × 10⁸ USD y−1 to 51.84 × 10⁸ USD y−1 over the study periods. Among the land classes, the forest cover performed the highest value of ESV in both years by 31.53 × 10⁸ USD y−1 and 32.26 × 10⁸ USD y−1. The improving ecosystem services delivered from different land cover types showed the better ecosystem services in the GRB. The nexus between LULC dynamics and ESV showed that LUCC is key the determinants of the changes on ESV provided by the different LULC types. It needs to further examine by using high resolution of satellite images for better estimation of ESV for landscape planning, ecosystem management and sustainability in the Central Himalayas.
Author Contributions
Y.Z. and R.R. had the original idea for this manuscript. R.R. had prepared the database and written this manuscript. Y.Z., B.P., B.K.A. and L.B. had reviewed the manuscript and provided effort in writing and finalizing the manuscript. All authors have read and approved the final manuscript.
Funding
This study was financially supported by the Strategic Priority Research Program of the Chinese Academy of Sciences (Grant No. XDA20040201), Chinese Academy of Sciences—The World Academy of Sciences (CAS-TWAS) President’s Fellowship Program for PhD Study; National Natural Science Foundation of China (Grant No. 41761144081) and International Partnership Program of Chinese Academy of Sciences (Grant No. 131C11KYSB20160061).
Acknowledgments
The authors are thankful to Ramesh Raj Pant, Binod Baniya, Rajendra Prakash Tandan and Narendra Raj Khanal for their valuable suggestions and comments. We are grateful to the editors and anonymous reviewers for constructive comments and suggestions regarding this paper.
Conflicts of Interest
The authors declare no conflict of interest.
References
- Turner, B.; Meyer, W.B.; Skole, D.L. Global land-use/land-cover change: Towards an integrated study. Ambio 1994, 23, 91–95. [Google Scholar]
- Bajracharya, B.; Uddin, K.; Shrestha, B.R. Land Cover Mapping in the HKKH Region: Cases from Three Mountain Protected Areas; International Centre for Integrated Mountain Development: Patan, Nepal, 2009. [Google Scholar]
- Wu, J. Land use changes: Economic, social, and environmental impacts. Choices 2008, 23, 6–10. [Google Scholar]
- Pielke, R.A. Land use and climate change. Science 2005, 310, 1625–1626. [Google Scholar] [CrossRef] [PubMed]
- Ellis, E.; Pontius, R., Jr. Land-use and land-cover change—Encyclopedia of earth. Environ. Protect. 2006, 2, 142–153. [Google Scholar]
- Ganasri, B.; Raju, A.; Dwarakish, G. Different approaches for land use land cover change detection: A review. J. Eng. Technol. 2013, 2, 44–48. [Google Scholar]
- Li, X.; Wang, Y.; Li, J.; Lei, B. Physical and socioeconomic driving forces of land-use and land-cover changes: A case study of wuhan city, China. Discret. Dyn. Nat. Soc. 2016, 2016, 8061069. [Google Scholar] [CrossRef]
- Reyers, B.; O’Farrell, P.J.; Cowling, R.M.; Egoh, B.N.; Le Maitre, D.C.; Vlok, J.H. Ecosystem services, land-cover change, and stakeholders: Finding a sustainable foothold for a semiarid biodiversity hotspot. Ecol. Soc. 2009, 14, 1–23. [Google Scholar] [CrossRef]
- Meyer, W.B.; Turner, B.I. Changes in Land Use and Land Cover: A Global Perspective; Cambridge University Press: Cambridge, UK, 1994; Volume 4. [Google Scholar]
- Wang, X.C.; Dong, X.B.; Liu, H.M.; Wei, H.J.; Fan, W.G.; Lu, N.C.; Xu, Z.H.; Ren, J.H.; Xing, K.X. Linking land use change, ecosystem services and human well-being: A case study of the manas river basin of xinjiang, China. Ecosyst. Serv. 2017, 27, 113–123. [Google Scholar] [CrossRef]
- Nie, Y.; Sheng, Y.; Liu, Q.; Liu, L.; Liu, S.; Zhang, Y.; Song, C. A regional-scale assessment of himalayan glacial lake changes using satellite observations from 1990 to 2015. Remote Sens. Environ. 2017, 189, 1–13. [Google Scholar] [CrossRef]
- Sharma, E.; Bhuchar, S.; Xing, M.; Kotayari, B. Land use change and its impact on hydro-ecological linkages in himalayan watersheds. Trop. Ecol. 2007, 48, 151–161. [Google Scholar]
- Zang, S.; Wu, C.; Liu, H.; Na, X. Impact of urbanization on natural ecosystem service values: A comparative study. Environ. Monit. Assess. 2011, 179, 575–588. [Google Scholar] [CrossRef] [PubMed]
- Ministry of Agricultural Development (MoAD). Statistical Information on Nepalese Agriculture; Ministry of Agricultural Development, Government of Nepal: Kathmandu, Nepal, 2013.
- Rimal, B.; Baral, H.; Stork, N.E.; Paudyal, K.; Rijal, S. Growing city and rapid land use transition: Assessing multiple hazards and risks in the pokhara valley, Nepal. Land 2015, 4, 957–978. [Google Scholar] [CrossRef]
- Rimal, B. Urbanization and the decline of agricultural land in pokhara sub-metropolitan city, Nepal. J. Agric. Sci. 2013, 5, 54–65. [Google Scholar] [CrossRef]
- Khanal, S.; Gurung, S.; Pant, K.; Chaudhary, P.; Dangol, D. Ecosystem services and stakeholder analysis in bishajari lake and associated wetland areas, chitwan, Nepal. Int. J. Appl. Sci. Biotechnol. 2014, 2, 563–569. [Google Scholar] [CrossRef]
- Costanza, R.; d’Arge, R.; De Groot, R.; Farber, S.; Grasso, M.; Hannon, B.; Limburg, K.; Naeem, S.; O’neill, R.V.; Paruelo, J. The value of the world’s ecosystem services and natural capital. Nature 1997, 387, 253–260. [Google Scholar] [CrossRef]
- Daily, G.C. Nature’s Services: Societal Dependance on Natural Ecosystems; Island Press: Washington, DC, USA, 1997. [Google Scholar]
- Khadka, R.; Shrivastav, A. Poverty reduction program through adaptive management of ecosystem services: The concept notes for Nepal. J. Ecosyst. Ecogr. 2015, 5, 1–3. [Google Scholar]
- Birch, J.; Gurung, H.; Stattersfield, A.; Thapa, I.; Thomas, D. Conserving Biodiversity & Delivering Ecosystem Services at Important Bird Areas in Nepal; Bird Conservation Nepal: Kathmandu, Nepal, 2012; pp. 1–40. [Google Scholar]
- Zhao, Z.; Wu, X.; Yili, Z.; Jungang, G. Assessment of changes in the value of ecosystem services in the koshi river basin, central high himalayas based on land cover changes and the ca-markov model. J. Resour. Ecol. 2017, 8, 67–76. [Google Scholar]
- Millennium Ecosystem Assessment. Ecosystems and Human Well-Being: Synthesis; Island Press: Washington, DC, USA, 2005. [Google Scholar]
- Costanza, R.; de Groot, R.; Sutton, P.; Van der Ploeg, S.; Anderson, S.J.; Kubiszewski, I.; Farber, S.; Turner, R.K. Changes in the global value of ecosystem services. Glob. Environ. Chang. 2014, 26, 152–158. [Google Scholar] [CrossRef]
- Xie, G.-D.; Lu, C.-X.; Leng, Y.-F.; Zheng, D.; Li, S. Ecological assets valuation of the tibetan plateau. J. Nat. Resour. 2003, 18, 189–196. [Google Scholar]
- Pradhan, N.; Providoli, I.; Regmi, B.; Kafle, G. Valuing Water and Its Ecological Services in Rural Landscapes: A Case Study from Nepal; Mountain Forum Bulletin: Kathmandu, Nepal, 2010; pp. 32–34. [Google Scholar]
- Hu, H.; Liu, W.; Cao, M. Impact of land use and land cover changes on ecosystem services in menglun, xishuangbanna, southwest China. Environ. Monit. Assess. 2008, 146, 147–156. [Google Scholar] [CrossRef] [PubMed]
- Roy, P.; Roy, A. Land use and land cover change in india: Aremote sensing & gis prespective. J. Indian Inst. Sci. 2012, 90, 489–502. [Google Scholar]
- Baidya, N.; Bhuju, D.; Kandel, P. Land use change in buffer zone of chitwan national park, Nepal between 1978 and 1999. Ecoprint 2009, 16, 79–86. [Google Scholar] [CrossRef]
- Weng, Q. Land use change analysis in the zhujiang delta of China using satellite remote sensing, gis and stochastic modelling. J. Environ. Manag. 2002, 64, 273–284. [Google Scholar] [CrossRef]
- Wang, J.; Cheng, Q.; Chen, J. A gis and remote sensing-based analysis of land use change using the asymmetric relation analysis method: A case study from the city of hangzhou, China. Math. Geosci. 2011, 43, 435–453. [Google Scholar] [CrossRef]
- Rindfuss, R.R.; Walsh, S.J.; Turner, B.L.; Fox, J.; Mishra, V. Developing a science of land change: Challenges and methodological issues. Proc. Natl. Acad. Sci. USA 2004, 101, 13976–13981. [Google Scholar] [CrossRef] [PubMed]
- Hansen, M.; DeFries, R.; Townshend, J.R.; Sohlberg, R. Global land cover classification at 1 km spatial resolution using a classification tree approach. Int. J. Remote Sens. 2000, 21, 1331–1364. [Google Scholar] [CrossRef]
- Chen, J.; Chen, J.; Liao, A.; Cao, X.; Chen, L.; Chen, X.; He, C.; Han, G.; Peng, S.; Lu, M. Global land cover mapping at 30 m resolution: A pok-based operational approach. ISPRS J. Photogramm. Remote Sens. 2015, 103, 7–27. [Google Scholar] [CrossRef]
- European Space Agency (ESA). Climate Change Initiative Land Cover (CCI-LC) Dataset; European Space Agency: Bruxelles, Belgium, 2017. [Google Scholar]
- Loveland, T.R.; Reed, B.C.; Brown, J.F.; Ohlen, D.O.; Zhu, Z.; Yang, L.; Merchant, J.W. Development of a global land cover characteristics database and igbp discover from 1 km avhrr data. Int. J. Remote Sens. 2000, 21, 1303–1330. [Google Scholar] [CrossRef]
- Klein Goldewijk, K.; Beusen, A.; Van Drecht, G.; De Vos, M. The hyde 3.1 spatially explicit database of human-induced global land-use change over the past 12,000 years. Glob. Ecol. Biogeogr. 2011, 20, 417–433. [Google Scholar] [CrossRef]
- Rimal, B. Urban growth and land use/land cover change of pokhara sub-metropolitan city, Nepal. J. Theor. Appl. Inf. Technol. 2011, 26, 118–129. [Google Scholar]
- Dai, X.-A.; Yang, W.-N.; Tang, C. Land use and land cover change analysis using satellite remote sensing and gis. In Proceedings of the 2010 Second IITA International Conference on Geoscience and Remote Sensing (IITA-GRS), Sichuwan, China, 28–31 August 2010; pp. 385–388. [Google Scholar]
- Poudel, K.R. Urban growth and land use change in the himalaya region: A case study of pokhara sub metropolitan city, Nepal. GIS Ostrav. 2008, 27, 1–11. [Google Scholar]
- Khanal, N.R.; Watanabe, T. Abandonment of agricultural land and its consequences: A case study in the sikles area, gandaki basin, Nepal himalaya. Mt. Res. Dev. 2006, 26, 32–40. [Google Scholar] [CrossRef]
- Regmi, B.; Pandit, A. Classification of Adaptation Measures in Criteria for Evaluation: Case Studies in the Gandaki River Basin; HI-AWARE Working Paper; HI-AWARE: Kathmandu, Nepal, 2016. [Google Scholar]
- Pant, R.R.; Zhang, F.; Rehman, F.U.; Wang, G.; Ye, M.; Zeng, C.; Tang, H. Spatiotemporal variations of hydrogeochemistry and its controlling factors in the gandaki river basin, central himalaya Nepal. Sci. Total Environ. 2018, 622, 770–782. [Google Scholar] [CrossRef] [PubMed]
- Richards, J.A. Supervised classification techniques. In Remote Sensing Digital Image Analysis; Springer: Berlin, Germany, 2013; pp. 247–318. [Google Scholar]
- Bailly, J.; Arnaud, M.; Puech, C. Boosting: A classification method for remote sensing. Int. J. Remote Sens. 2007, 28, 1687–1710. [Google Scholar] [CrossRef]
- Liu, X.-H.; Skidmore, A.; Van Oosten, H. Integration of classification methods for improvement of land-cover map accuracy. ISPRS J. Photogramm. Remote Sens. 2002, 56, 257–268. [Google Scholar] [CrossRef]
- Manandhar, R.; Odeh, I.O.; Ancev, T. Improving the accuracy of land use and land cover classification of landsat data using post-classification enhancement. Remote Sens. 2009, 1, 330–344. [Google Scholar] [CrossRef]
- Di Gregorio, A.; Jansen, L.J. Land Cover Classification System (LCCS): Classification Concepts and User Manual; Food and Agriculture Organization (FAO): Rome, Italy, 1998. [Google Scholar]
- Rimal, B.; Zhang, L.; Keshtkar, H.; Sun, X.; Rijal, S. Quantifying the spatiotemporal pattern of urban expansion and hazard and risk area identification in the kaski district of Nepal. Land 2018, 7, 37. [Google Scholar] [CrossRef]
- International Center for Integrated Mountain Development (ICIMOD). Land cover of Nepal 1990; ICIMOD: Kathmandu, Nepal, 2015. [Google Scholar]
- Uddin, K.; Shrestha, H.L.; Murthy, M.; Bajracharya, B.; Shrestha, B.; Gilani, H.; Pradhan, S.; Dangol, B. Development of 2010 national land cover database for the Nepal. J. Environ. Manag. 2015, 148, 82–90. [Google Scholar] [CrossRef] [PubMed]
- Wu, X.; Gao, J.; Zhang, Y.; Liu, L.; Zhao, Z.; Paudel, B. Land cover status in the koshi river basin, central himalayas. J. Resour. Ecol. 2017, 8, 10–19. [Google Scholar]
- Roy, P.S.; Meiyappan, P.; Joshi, P.K.; Kale, M.P.; Srivastav, V.K.; Srivasatava, S.K.; Behera, M.D.; Roy, A.; Sharma, Y.; Ramachandran, R.M.; et al. Decadal Land Use and Land Cover Classifications across India, 1985, 1995, 2005; ORNL DAAC: Oak Ridge, TN, USA, 2016. [Google Scholar]
- Rwanga, S.S.; Ndambuki, J. Accuracy assessment of land use/land cover classification using remote sensing and gis. Int. J. Geosci. 2017, 8, 611–622. [Google Scholar] [CrossRef]
- Tilahun, A.; Teferie, B. Accuracy assessment of land use land cover classification using google earth. Am. J. Environ. Protect. 2015, 4, 193–198. [Google Scholar] [CrossRef]
- Rimal, B.; Zhang, L.; Stork, N.; Sloan, S.; Rijal, S. Urban expansion occurred at the expense of agricultural lands in the tarai region of Nepal from 1989 to 2016. Sustainability 2018, 10, 1341. [Google Scholar] [CrossRef]
- Paudyal, K.; Baral, H.; Putzel, L.; Bhandari, S.; Keenan, R. Change in land use and ecosystem services delivery from community-based forest landscape restoration in the phewa lake Watershed, Nepal. Int. For. Rev. 2017, 19, 1–14. [Google Scholar] [CrossRef]
- Regmi, R.; Saha, S.; Balla, M. Geospatial analysis of land use land cover change modeling at phewa lake watershed of Nepal by using cellular automata markov model. Int. J. Curr. Eng. Technol. 2014, 4, 2617–2627. [Google Scholar]
- Paudel, B.; Gao, J.; Zhang, Y.; Wu, X.; Li, S.; Yan, J. Changes in cropland status and their driving factors in the koshi river basin of the central himalayas, Nepal. Sustainability 2016, 8, 933. [Google Scholar] [CrossRef]
- Foody, G.M. Status of land cover classification accuracy assessment. Remote Sens. Environ. 2002, 80, 185–201. [Google Scholar] [CrossRef]
- Takada, T.; Miyamoto, A.; Hasegawa, S.F. Derivation of a yearly transition probability matrix for land-use dynamics and its applications. Landsc. Ecol. 2010, 25, 561–572. [Google Scholar] [CrossRef]
- Wan, L.; Ye, X.; Lee, J.; Lu, X.; Zheng, L.; Wu, K. Effects of urbanization on ecosystem service values in a mineral resource-based city. Habitat Int. 2015, 46, 54–63. [Google Scholar] [CrossRef]
- Kreuter, U.P.; Harris, H.G.; Matlock, M.D.; Lacey, R.E. Change in ecosystem service values in the San Antonio area, Texas. Ecol. Econ. 2001, 39, 333–346. [Google Scholar] [CrossRef]
- He, F.; Li, M.; Li, S.; Xiao, R. Comparison of changes in land use and land cover in China and the USA over the past 300 years. J. Geogr. Sci. 2015, 25, 1045–1057. [Google Scholar] [CrossRef]
- Miao, L.; Zhu, F.; Sun, Z.; Moore, J.C.; Cui, X. China’s land-use changes during the past 300 years: A historical perspective. Int. J. Environ. Res. Public Health 2016, 13, 847. [Google Scholar] [CrossRef] [PubMed]
- Gilani, H.; Qamer, F.M.; Sohail, M.; Uddin, K.; Jain, A.; Ning, W. Review of ecosystem monitoring in Nepal and evolving earth observation technologies. In Land Cover Change and Its Eco-Environmental Responses in Nepal; Springer: Berlin, Germany, 2017; pp. 165–183. [Google Scholar]
- Paudel, B.; Zhang, Y.-L.; Li, S.-C.; Liu, L.-S.; Wu, X.; Khanal, N.R. Review of studies on land use and land cover change in Nepal. J. Mt. Sci. 2016, 13, 643–660. [Google Scholar] [CrossRef]
- Tian, H.; Banger, K.; Bo, T.; Dadhwal, V.K. History of land use in india during 1880–2010: Large-scale land transformations reconstructed from satellite data and historical archives. Glob. Planet. Chang. 2014, 121, 78–88. [Google Scholar] [CrossRef]
- Nagendra, H.; Sudhira, H.; Katti, M.; Tengö, M.; Schewenius, M. Urbanization and its impacts on land use, biodiversity and ecosystems in india. Interdisciplina 2014, 2, 305–313. [Google Scholar] [CrossRef]
- Cui, X.; Graf, H.-F. Recent land cover changes on the tibetan plateau: A review. Clim. Chang. 2009, 94, 47–61. [Google Scholar] [CrossRef]
- Nie, Y.; Zhang, Y.; Liu, L.; Zhang, J. Glacial change in the vicinity of mt. Qomolangma (everest), central high himalayas since 1976. J. Geogr. Sci. 2010, 20, 667–686. [Google Scholar] [CrossRef]
- Nie, Y.; Li, A. Assessment of alpine wetland dynamics from 1976–2006 in the vicinity of mount everest. Wetlands 2011, 31, 875–884. [Google Scholar] [CrossRef]
- Bajracharya, S.R.; Maharjan, S.B.; Shrestha, F.; Bajracharya, O.R.; Baidya, S. Glacier Status in Nepal and Decadal Change from 1980 to 2010 Based on Landsat Data; International Centre for Integrated Mountain Development: Kathmandu, Nepal, 2014. [Google Scholar]
- Shrestha, A.B.; Joshi, S.P. Snow cover and glacier change study in Nepalese himalaya using remote sensing and geographic information system. J. Hydrol. Meteorol. 2009, 6, 26–36. [Google Scholar] [CrossRef]
- Shrestha, M. The dynamics of mountain agriculture and land change in lamjung district, Nepal. Glob. Environ. Res. 2014, 18, 151–160. [Google Scholar]
- Zhang, W.; Zhang, Y.; Wang, Z.; Ding, M.; Yang, X.; Lin, X.; Liu, L. Vegetation change in the mt. Qomolangma nature reserve from 1981 to 2001. J. Geogr. Sci. 2007, 17, 152–164. [Google Scholar] [CrossRef]
- Chetri, M. Diet analysis of gaur (bos gaurus gaurus smith, 1827) by micro-histological analysis of fecal samples in parsa wildlife reserve, Nepal. Our Nat. 2006, 4, 20–28. [Google Scholar] [CrossRef]
- Paudel, K.P.; Andersen, P. Assessing rangeland degradation using multi temporal satellite images and grazing pressure surface model in upper mustang, trans himalaya, Nepal. Remote Sens. Environ. 2010, 114, 1845–1855. [Google Scholar] [CrossRef]
- Krakauer, N.; Panthi, J.; Kirat, N.; Dahal, P. Climate and land use change in gandaki river basin and its impacts to livestock herding. Res. Brief 2015, 22, 1–4. [Google Scholar]
- Thapa, G.B.; Weber, K.E. Natural resource degradation in a small watershed in Nepal: Complex causes and remedial measures. Nat. Resour. Forum 1995, 19, 285–296. [Google Scholar] [CrossRef]
- Koirala, S. Land use/Land Cover Change and Its Impact on Soil Erosion Process in Begnas Tal Rupa Tal Watershed Using Geospatial Tools, Kaski District, Nepal. Master’s Thesis, University of NOVA, Hannover, Germany, 2010. [Google Scholar]
- Shrestha, B.M.; Dick, Ø.B.; Singh, B. Effects of land-use change on carbon dynamics assessed by multi-temporal satellite imagery in a mountain watershed of Nepal. Acta Agric. Scand. Sect. B Soil Plant Sci. 2010, 60, 10–23. [Google Scholar] [CrossRef]
- Thapa, G.B.; Weber, K.E. Deforestation in the upper pokhara valley, Nepal. Singap. J. Trop. Geogr. 1991, 12, 52–67. [Google Scholar] [CrossRef]
- Chapagain, P.S. Changing population, landuse and environment in the Nepal himalayas. J. Hydrol. Meteorol. 2012, 8, 66–71. [Google Scholar] [CrossRef]
- Massey, D.S.; Axinn, W.G.; Ghimire, D.J. Environmental change and out-migration: Evidence from Nepal. Popul. Environ. 2010, 32, 109–136. [Google Scholar] [CrossRef] [PubMed]
- Shrestha, M. The human dimensions of land change in lamjung district of Nepal. Himal. J. Dev. Democr. 2007, 2, 27–33. [Google Scholar]
- Ministry of Agricultural Development (MoAD). Agriculture Development Strategy (ADS), 2014; Government of Nepal, Ministry of Agricultural Development, Singhdurbar: Kathmandu, Nepal, 2015.
- Joshi, K.; Conroy, C.; Witcombe, J. Agriculture, Seed, and Innovation in Nepal: Industry and Policy Issues for the Future; International Food Policy Research Institute: Washington, DC, USA, 2012. [Google Scholar]
- Deshar, B. An overview of agricultural degradation in Nepal and its impact on economy and environment. Glob. J. Econ. Soc. Dev. 2013, 3, 1–20. [Google Scholar]
- Reddy, C.S.; Pasha, S.V.; Satish, K.; Saranya, K.; Jha, C.; Murthy, Y.K. Quantifying nationwide land cover and historical changes in forests of Nepal (1930–2014): Implications on forest fragmentation. Biodivers. Conserv. 2017, 27, 91–107. [Google Scholar] [CrossRef]
- Fox, J. Forest resources in a Nepali village in 1980 and 1990: The positive influence of population growth. Mt. Res. Dev. 1993, 13, 89–98. [Google Scholar] [CrossRef]
- Bhandari, B.; Grant, M.R. Land use and population dynamics in the kalikhola watershed of Nepal. J. Rural Community Dev. 2007, 2, 100–109. [Google Scholar]
- Lamichhane, B. Dynamics and Driving Forces of Land Use/Forest Cover Change and Indicators of Climate Change in a Mountain Sub-Watershed of Gorkha. Ph.D. Thesis, Tribhuvan University/Institute of Forestry, Pokhara, Nepal, 2008. [Google Scholar]
- Neupane, K. An Assessment of Land Use Land cover Change in Barandabhar Forest Corridor, Chitwan District, Nepal. Ph.D. Thesis, Tribhuvan University, Kathmandu Forestry College, Kathmandu, Nepal, 2016. [Google Scholar]
- Awasthi, K.; Sitaula, B.; Singh, B.; Bajacharaya, R. Land-use change in two Nepalese watersheds: Gis and geomorphometric analysis. Land Degrad. Dev. 2002, 13, 495–513. [Google Scholar] [CrossRef]
- Fleming, B.; Fleming, J.P. A watershed conservation success story in Nepal: Land use changes over 30 years. Waterlines 2009, 28, 29–46. [Google Scholar] [CrossRef]
- Regmi, L.K. An overview of population growth trends of Nepal. J. Inst. Sci. Technol. 2015, 19, 57–61. [Google Scholar] [CrossRef]
- Schweik, C.M.; Adhikari, K.; Pandit, K.N. Land-cover change and forest institutions: A comparison of two sub-basins in the southern siwalik hills of Nepal. Mt. Res. Dev. 1997, 99–116. [Google Scholar] [CrossRef]
- Bhattarai, K.; Conway, D.; Yousef, M. Determinants of deforestation in Nepal’s central development region. J. Environ. Manag. 2009, 91, 471–488. [Google Scholar] [CrossRef] [PubMed]
- Panta, M.; Kim, K.; Joshi, C. Temporal mapping of deforestation and forest degradation in Nepal: Applications to forest conservation. For. Ecol. Manag. 2008, 256, 1587–1595. [Google Scholar] [CrossRef]
- Sinha, D.; Ahmad, N.; Singh, K. Shrinking Net Sown Area: An Analysis of Changing Land Use Pattern in Bihar; Munich Personal RePEc Archive (MPRA): Bihar, India, 2016. [Google Scholar]
- Dhakal, K.R. Land use change in Khageri Watershed, Chitwan. J. Geogr. Educ. 2014, 8, 51–56. [Google Scholar] [CrossRef]
- Mishra, V.N.; Rai, P.K.; Mohan, K. Prediction of land use changes based on land change modeler (lcm) using remote sensing: A case study of muzaffarpur (bihar), india. J. Geogr. Inst. 2014, 64, 111–127. [Google Scholar] [CrossRef]
- Zhao, B.; Kreuter, U.; Li, B.; Ma, Z.; Chen, J.; Nakagoshi, N. An ecosystem service value assessment of land-use change on chongming island, China. Land Use Policy 2004, 21, 139–148. [Google Scholar] [CrossRef]
- Howarth, R.B.; Farber, S. Accounting for the value of ecosystem services. Ecol. Econ. 2002, 41, 421–429. [Google Scholar] [CrossRef]
- Gashaw, T.; Tulu, T.; Argaw, M.; Worqlul, A.W.; Tolessa, T.; Kindu, M. Estimating the impacts of land use/land cover changes on ecosystem service values: The case of the andassa watershed in the upper blue nile basin of ethiopia. Ecosyst. Serv. 2018, 31, 219–228. [Google Scholar] [CrossRef]
- Temesgen, H.; Wu, W.; Shi, X.; Yirsaw, E.; Bekele, B.; Kindu, M. Variation in ecosystem service values in an agroforestry dominated landscape in ethiopia: Implications for land use and conservation policy. Sustainability 2018, 10, 1126. [Google Scholar] [CrossRef]
- Konarska, K.M.; Sutton, P.C.; Castellon, M. Evaluating scale dependence of ecosystem service valuation: A comparison of noaa-avhrr and landsat tm datasets. Ecol. Econ. 2002, 41, 491–507. [Google Scholar] [CrossRef]
- Hao, F.; Lai, X.; Ouyang, W.; Xu, Y.; Wei, X.; Song, K. Effects of land use changes on the ecosystem service values of a reclamation farm in northeast China. Environ. Manag. 2012, 50, 1–12. [Google Scholar] [CrossRef] [PubMed]
- Uddin, M.; Miah, M.; Afrad, M.; Mehraj, H.; Mandal, M. Land use change and its impact on ecosystem services, livelihood in tanguar haor wetland of bangladesh. Sci. Agric. 2015, 12, 78–88. [Google Scholar]
- Zhang, Y.; Qi, W.; Zhou, C.; Ding, M.; Liu, L.; Gao, J.; Bai, W.; Wang, Z.; Zheng, D. Spatial and temporal variability in the net primary production of alpine grassland on the tibetan plateau since 1982. J. Geogr. Sci. 2014, 24, 269–287. [Google Scholar] [CrossRef]
- Wen, L.; Dong, S.; Li, Y.; Li, X.; Shi, J.; Wang, Y.; Liu, D.; Ma, Y. Effect of degradation intensity on grassland ecosystem services in the alpine region of qinghai-tibetan plateau, China. PLoS ONE 2013, 8, e58432. [Google Scholar] [CrossRef] [PubMed]
- Arunyawat, S.; Shrestha, R.P. Assessing land use change and its impact on ecosystem services in northern thailand. Sustainability 2016, 8, 768. [Google Scholar] [CrossRef]
- Gong, J.; Li, J.; Yang, J.; Li, S.; Tang, W. Land use and land cover change in the qinghai lake region of the tibetan plateau and its impact on ecosystem services. Int. J. Environ. Res. Public Health 2017, 14, 818. [Google Scholar] [CrossRef] [PubMed]
- Tianhong, L.; Wenkai, L.; Zhenghan, Q. Variations in ecosystem service value in response to land use changes in shenzhen. Ecol. Econ. 2010, 69, 1427–1435. [Google Scholar] [CrossRef]
- Chen, J.; Sun, B.-M.; Chen, D.; Wu, X.; Guo, L.-Z.; Wang, G. Land use changes and their effects on the value of ecosystem services in the small sanjiang plain in China. Sci. World J. 2014, 2014, 1–14. [Google Scholar] [CrossRef] [PubMed]
- Yan, F.; Zhang, S.; Liu, X.; Chen, D.; Chen, J.; Bu, K.; Yang, J.; Chang, L. The effects of spatiotemporal changes in land degradation on ecosystem services values in sanjiang plain, China. Remote Sens. 2016, 8, 917. [Google Scholar] [CrossRef]
- Kindu, M.; Schneider, T.; Teketay, D.; Knoke, T. Changes of ecosystem service values in response to land use/land cover dynamics in munessa–shashemene landscape of the ethiopian highlands. Sci. Total Environ. 2016, 547, 137–147. [Google Scholar] [CrossRef] [PubMed]
- Mendoza-González, G.; Martínez, M.; Lithgow, D.; Pérez-Maqueo, O.; Simonin, P. Land use change and its effects on the value of ecosystem services along the coast of the gulf of mexico. Ecol. Econ. 2012, 82, 23–32. [Google Scholar] [CrossRef]
- Wu, K.-Y.; Ye, X.-Y.; Qi, Z.-F.; Zhang, H. Impacts of land use/land cover change and socioeconomic development on regional ecosystem services: The case of fast-growing Hangzhou metropolitan area, China. Cities 2013, 31, 276–284. [Google Scholar] [CrossRef]
- Nagendra, H.; Sudhira, H.; Katti, M.; Schewenius, M. Sub-regional assessment of india: Effects of urbanization on land use, biodiversity and ecosystem services. In Urbanization, Biodiversity and Ecosystem Services: Challenges and Opportunities; Springer: Berlin, Germany, 2013; pp. 65–74. [Google Scholar]
- Paudel, K.P.; Tamang, S.; Shrestha, K.K. Transforming land and livelihood: Analysis of agricultural land abandonment in the mid hills of Nepal. J. For. Livelihood 2014, 12, 11–19. [Google Scholar]
- Jägerskog, A. Transboundary water management—Why it is important and why it needs to be developed. In Free Flow–Reaching Water Security through Cooperation; UNESCO: Paris, France, 2013; pp. 49–52. [Google Scholar]
- Joshi, L. Protected Areas and Payment for Ecosystem Services: A Feasibility Study in Shivapuri-Nagarjun National Park, Nepal; International Center for Integrated Mountain Development: Patan, Nepal, 2011. [Google Scholar]
- Liu, Y.; Li, J.; Zhang, H. An ecosystem service valuation of land use change in taiyuan city, China. Ecol. Model. 2012, 225, 127–132. [Google Scholar] [CrossRef]
- Bhatta, L.D.; van Oort, B.E.H.; Rucevska, I.; Baral, H. Payment for ecosystem services: Possible instrument for managing ecosystem services in Nepal. Int. J. Biodivers. Sci. Ecosyst. Serv. Manag. 2014, 10, 289–299. [Google Scholar] [CrossRef]
- Dong, S.; Lassoie, J.; Shrestha, K.; Yan, Z.; Sharma, E.; Pariya, D. Institutional development for sustainable rangeland resource and ecosystem management in mountainous areas of northern Nepal. J. Environ. Manag. 2009, 90, 994–1003. [Google Scholar] [CrossRef] [PubMed]
- Maskey, N.; Wallman, P. Investing in Ecosystem Services: Opportunities and Challenges for Shivapuri National Park, Nepal; Lund University Centre for Sustainability Studies: Lund, Sweden, 2008. [Google Scholar]
- Acharya, H. Payment for ecosystem services: Protected area and biodiversity conservation. In National Workshop on Payment for Ecosystem Services: Opportunities and Challenges in Nepal; Ministry of Forest and Soil Conservation, ICIMOD, WWF, and IUCN: Kathmandu, Nepal, 2014; pp. 39–42. [Google Scholar]
- Karki, R.; Paudel, N.S.; Khatri, D.B.; Joshi, L. Payment for ecosystem services in protected areas: A case of shivapuri-nagarjun national park. In Payment for Ecosystem Services: Opportunities and Challenges in Nepal; Ministry of Forest and Soil Conservation, ICIMOD, WWF, and IUCN: Kathmandu, Nepal, 2014; pp. 25–38. [Google Scholar]
© 2018 by the authors. Licensee MDPI, Basel, Switzerland. This article is an open access article distributed under the terms and conditions of the Creative Commons Attribution (CC BY) license (http://creativecommons.org/licenses/by/4.0/).