Article

The Effects of Natural Disasters on Social Trust: Evidence from South Korea

1
Department of Policy Studies, Hanyang University, 501 Multidisciplinary Lecture Hall, Seoul 04763, Korea
2
Department of Agricultural, Food, and Resource Economics and Department of Economics, Michigan State University, 91 Agriculture Hall (Annex), East Lansing, MI 48824, USA
*
Author to whom correspondence should be addressed.
Sustainability 2018, 10(9), 2973; https://doi.org/10.3390/su10092973
Submission received: 10 July 2018 / Revised: 11 August 2018 / Accepted: 15 August 2018 / Published: 21 August 2018
(This article belongs to the Special Issue Natural Disasters and Economics)

Abstract

:
In this paper, we examine whether disasters affect social trust levels using South Korean panel data from 2014–2016. We also investigate whether the effects of disasters on social trust differ depending on the type of disaster. We consider four types of disasters: typhoons, heavy rain, heavy snow and strong winds and waves. Our findings show that although all of these disasters influence the level of generalized social trust, each type has separate impacts. In our findings, there is a statistically significant positive relationship between cumulative damage costs per capita and social trust levels for heavy rain, heavy snow and strong winds and waves but we find the opposite result for typhoons. In the disaster recovery process, it is possible for social trust to be strengthened and weakened at the same time. Social trust can develop when victims such as neighbors and firefighters interact with others. Conversely, when a local government responds slowly to a disaster, dissatisfaction and discontent toward it can increase and this could weaken social trust. Moreover, disaster-affected individuals may be more competitive over limited resources, resulting in conflicts among them. Thus, we argue that the net effects of disasters on social trust levels can differ based on the speed of government responses to disasters and on active support for the victims from people such as neighbors.

1. Introduction

Social trust is considered to be an important factor in risk management [1,2,3,4,5,6]. Earle and Cvetkovich [7,8] showed that social trust is based on cultural values, meaning that decisions about whether or not to trust or to distrust other people and institutions depend greatly on value similarity. Earle and Cvetkovich [7] make the case that communication enables people to create shared values and develop common strategies for managing environmental risks under uncertainty. It is beneficial when trust between individuals or groups is based on shared cultural values, which enables cooperation [7,8,9,10,11]. Furthermore, social trust helps to build social capital, thereby fostering economic development [12,13,14].
In the literature on natural disasters, many scholars have examined the relationship between natural disasters and social trust. The basic logic of the linkage between natural disasters and social trust is that people make a collective effort to address natural disasters and trust is reinforced in the disaster recovery process [15]. That is, interacting and sharing information among individuals provide an opportunity to enhance social trust. As individuals’ collective behaviors are repeated, social trust and social norms are developed and strengthened [16]. However, natural disasters could have negative spillover effects on social trust. Hsiang et al. [17] showed that significant climate changes such as high temperatures or extreme rainfall can lead to more human conflict. Bhavnani [18] and Brancati [19] also found evidence that natural disasters result in a high likelihood of conflict because victims compete with one another for scarce resources such as relief aid, housing and so forth. Brancati [19] showed that the effects of disasters on conflicts are stronger for higher magnitude earthquakes in developing countries and they exacerbate preexisting conflicts. These results imply that natural disasters can promote conflict because they cause a scarcity of resources. This may be why the empirical findings on the relationship between natural disasters and social trust are somewhat mixed. Although there is no clear picture of the relationship between them, based on most empirical studies we can argue that natural disasters do affect individuals’ underlying preferences and behaviors. Thus, it is important to examine the factors that influence levels of social trust and conflicts in communities facing hardships after a natural disaster. Although it is hard to quantify the effects of natural disasters on levels of social trust and conflict separately, we can observe the net effects of natural disasters on social trust [20].
In this paper, we examine the effects of disasters on generalized social trust in South Korea. In South Korea, there are four major types of climatic disaster: heavy rain, typhoons, heavy snow and strong winds and waves. Geographical disasters such as earthquakes are quite rare. Heavy rains and typhoons have had the greatest impacts on the local economy in terms of the cumulative costs of damage since 2008. The frequency of climatic disasters and the magnitude of the damage caused vary depending on the region. The spatial variations in exposure to each type of climatic disaster can help us identify the disasters’ effects on generalized social trust.

2. Literature Review

Natural disasters destroy or damage physical and human capital in the short run but scholars have noted that they also have positive spillover effects. Skidmore and Toya [21] first empirically showed that the frequency of climatic disasters is positively correlated with human capital accumulation, total factor productivity and economic growth in the long run. They argued that natural disasters generally destroy physical capital in the short run but in the disaster recovery process, Schumpeter’s creative destruction can occur, in which disasters provide an opportunity to update the capital stock and stimulate the adoption of new technologies. Creative destruction refers to the restructuring process by “incessantly destroying the old one, incessantly creating a new one” [22]. Importantly, the authors showed that climatic disasters are positively associated with economic growth but the reverse is seen in geologic disasters. While the development of observational techniques has enabled some predictions, geographic hazards are still rather uncertain. Skidmore and Toya [21] showed that disasters that can be forecasted, such as most climatic disasters, can potentially have a positive effect on economic growth. Cuaresma et al. [23] also found evidence that the intensity of climatic disasters has a statistically positive relationship with the degree of absorption of foreign technology by developing countries, in both the medium and long term after the occurrence of disasters, although this result is only applicable to relatively richer developing countries. Similar to Skidmore and Toya [21], Cuaresma, Hlouskova and Obersteiner [23] showed that the intensity of geologic disasters is negatively associated with technological transfer but this result was only statistically significant and sizable in medium-term recovery. Leiter et al. [24] showed that firms in areas where natural disasters occur tended to have more total assets and higher employment rates than those in areas where natural disasters do not occur and the latter also had larger shares of intangible assets. Firms’ productivity in areas where natural disasters occur was lower in the short run but showed an improvement as intangible assets grew.
Some studies have examined whether natural disasters influence economic growth through human capital accumulation, technological knowledge transfer and total factor productivity. Interestingly, Toya and Skidmore [15] pointed out that social capital can be an unobserved factor that positively affects economic growth. This argument was based on the work of Bjørnskov and Méon [25], who showed that social trust plays an important role in total factor productivity. This evidence implies that if natural disasters affect the formation and improvement of social trust in the long term, then they could affect economic growth through an increase in total factor productivity. Knack and Keefer [26] and Dinda [27] and Rupasingha et al. [28] also found empirical evidence that social capital plays an important role in economic growth. To test the hypothesis that natural disasters enhance societal trust, Toya and Skidmore [15] performed panel analyses using data from 146 countries. The analyses showed a positive correlation between natural disaster frequency and levels of social trust. It is interesting to note that this relationship was apparent only for storms (amongst storms, floods, earthquakes, volcanic eruptions, etc.). They suggest that unlike other natural disasters, storms affect everyone in the area of the event regardless of income level and people work together to address their challenges, thus building trust.
Recent studies provided supportive evidence for the Toya and Skidmore [15] findings. Cassar et al. [29] showed that the victims of the 2004 Indian Ocean tsunami became more trusting, risk-averse and impatient in the long term. Shupp et al. [30] found that for people who were affected by a tornado, trust in general, trust in the police and fire authorities and trust in friends increased. In addition, they showed that affected homeowners became less patient regarding financial payments than unaffected homeowners. Calo-Blanco, Kovářík, Mengel and Romero [20] found that exposure to earthquakes in Chile positively affected social cohesion. They also showed that social cohesion increased after a large-scale earthquake but slowly weakened as environmental conditions improved over time. Dussaillant and Guzmán [31] found evidence of the positive effects of the earthquake in Chile in 2010 on levels of social trust. They also showed that the relationship between the earthquake and levels of social trust was dependent on past levels of social trust. However, Miller [32], Fleming et al. [33], Papanikolaou et al. [34] and Ahsan [35] all showed that natural disasters had negative effects or no effects on social trust. Although many studies found evidence that natural disasters influence underlying preferences, the direction of the influence varies. In this paper, to better understand the relationship between natural disasters and social capital, we estimated the effects of disasters on levels of generalized social trust using socio-economic and survey panel data from South Korea.

3. Key Variables and Data

3.1. Social Trust

Earle, Siegrist and Gutscher [9] argued that general trust is most strongly associated with cooperation under uncertainty. Uslaner [36] also makes the case that people get involved in their communities and cooperate because of moralistic trust that is “faith in people we don’t know”. These arguments imply that generalized trust may play an important role in the management of environmental risks. Thus, in our analysis, we use a measure of generalized trust as a proxy for social trust.
There are several ways to measure social trust but in general, researchers have used surveys and obtained a social trust variable from the following question (for more details, see Nannestad [37]): “In general, do you think that most people can be trusted, or that you can’t be too careful in dealing with people?” The respondents have two options to answer: (1) most people can be trusted and (2) you can’t be too careful. The largest survey is the World Value Survey, which presents the responses to this question nationally and allows scholars to make cross-country comparison analyses. Uslaner [38] argues that this question generates a very good measure of moralistic trust. Following Uslaner [38], we use a similar question to measure social trust.
In South Korea, the Korea Institute of Public Finance conducts the National Survey of Tax and Benefit (NSTB), a panel data survey approved by the national government, since 2008. The NSTB sample is households and their members (aged 15 and over) in a special self-governing city, six metropolitan cities and municipal cities in eight provinces, excluding the Cheju special self-governing province. They are selected via two-stage cluster sampling using the Census of Population and Housing. The stratified sampling is based on the 2010 census data on South Korea. The NSTB survey is based on face-to-face interviews. The targeted effective sample during the first wave (2008) was 5014 households, with 620 households being added in the second wave (2009). In this paper, we used 3004 household panel samples (total samples number 4258, including household members) tracked since 2008, which is 60% of the total samples from the survey’s first wave.
This survey asks the following question: “In general, do you think that people can be trusted?” The survey question for generalized trust was first asked in 2014 and the ninth wave of survey data from 2016 are the latest available data, so our research period was set to 2014–2016. The respondents answer on a Likert scale ranging from 1 = very reliable to 5 = very unreliable. For convenience in interpretation, we generated a variable of generalized trust, taking the values from 1 to 5, with 1 meaning very unreliable and 5 meaning very reliable. Figure 1 shows the various average values of generalized trust (2014–2016 three-year average) across communities in South Korea. The average values of generalized trust in Figure 1 indicate the degree of an averaged perceived general reliability of others. In Figure 1, the region with the white color has no data for social trust. The interesting question is: Why do levels of generalized trust differ from community to community? This paper uses the variation across space and over time to determine the role exposure to climatic disasters has played in determining social trust.
As shown in Table 1, the average value for generalized trust was 2.87 and there was a little rise in generalized trust levels in 2015, but a noticeable decline in 2016. Looking more closely, as shown in Table 2, the proportion of those surveyed who answered, “very reliable” tended to decrease each year. The proportion of those who answered “reliable” sharply increased in 2015 but decreased in 2016 and the reverse was seen for those who said “unreliable.” The proportion of those who answered “neutral” gradually increased over time. The proportion of those who answered, “very unreliable” increased each year. The dramatic changes in the level of generalized trust may have resulted from other factors in addition to natural disasters. In our study, to isolate the effects of disasters on levels of generalized trust, it was particularly important to include year dummy variables in the empirical models to account for aggregate shocks that affected everyone in our sample.

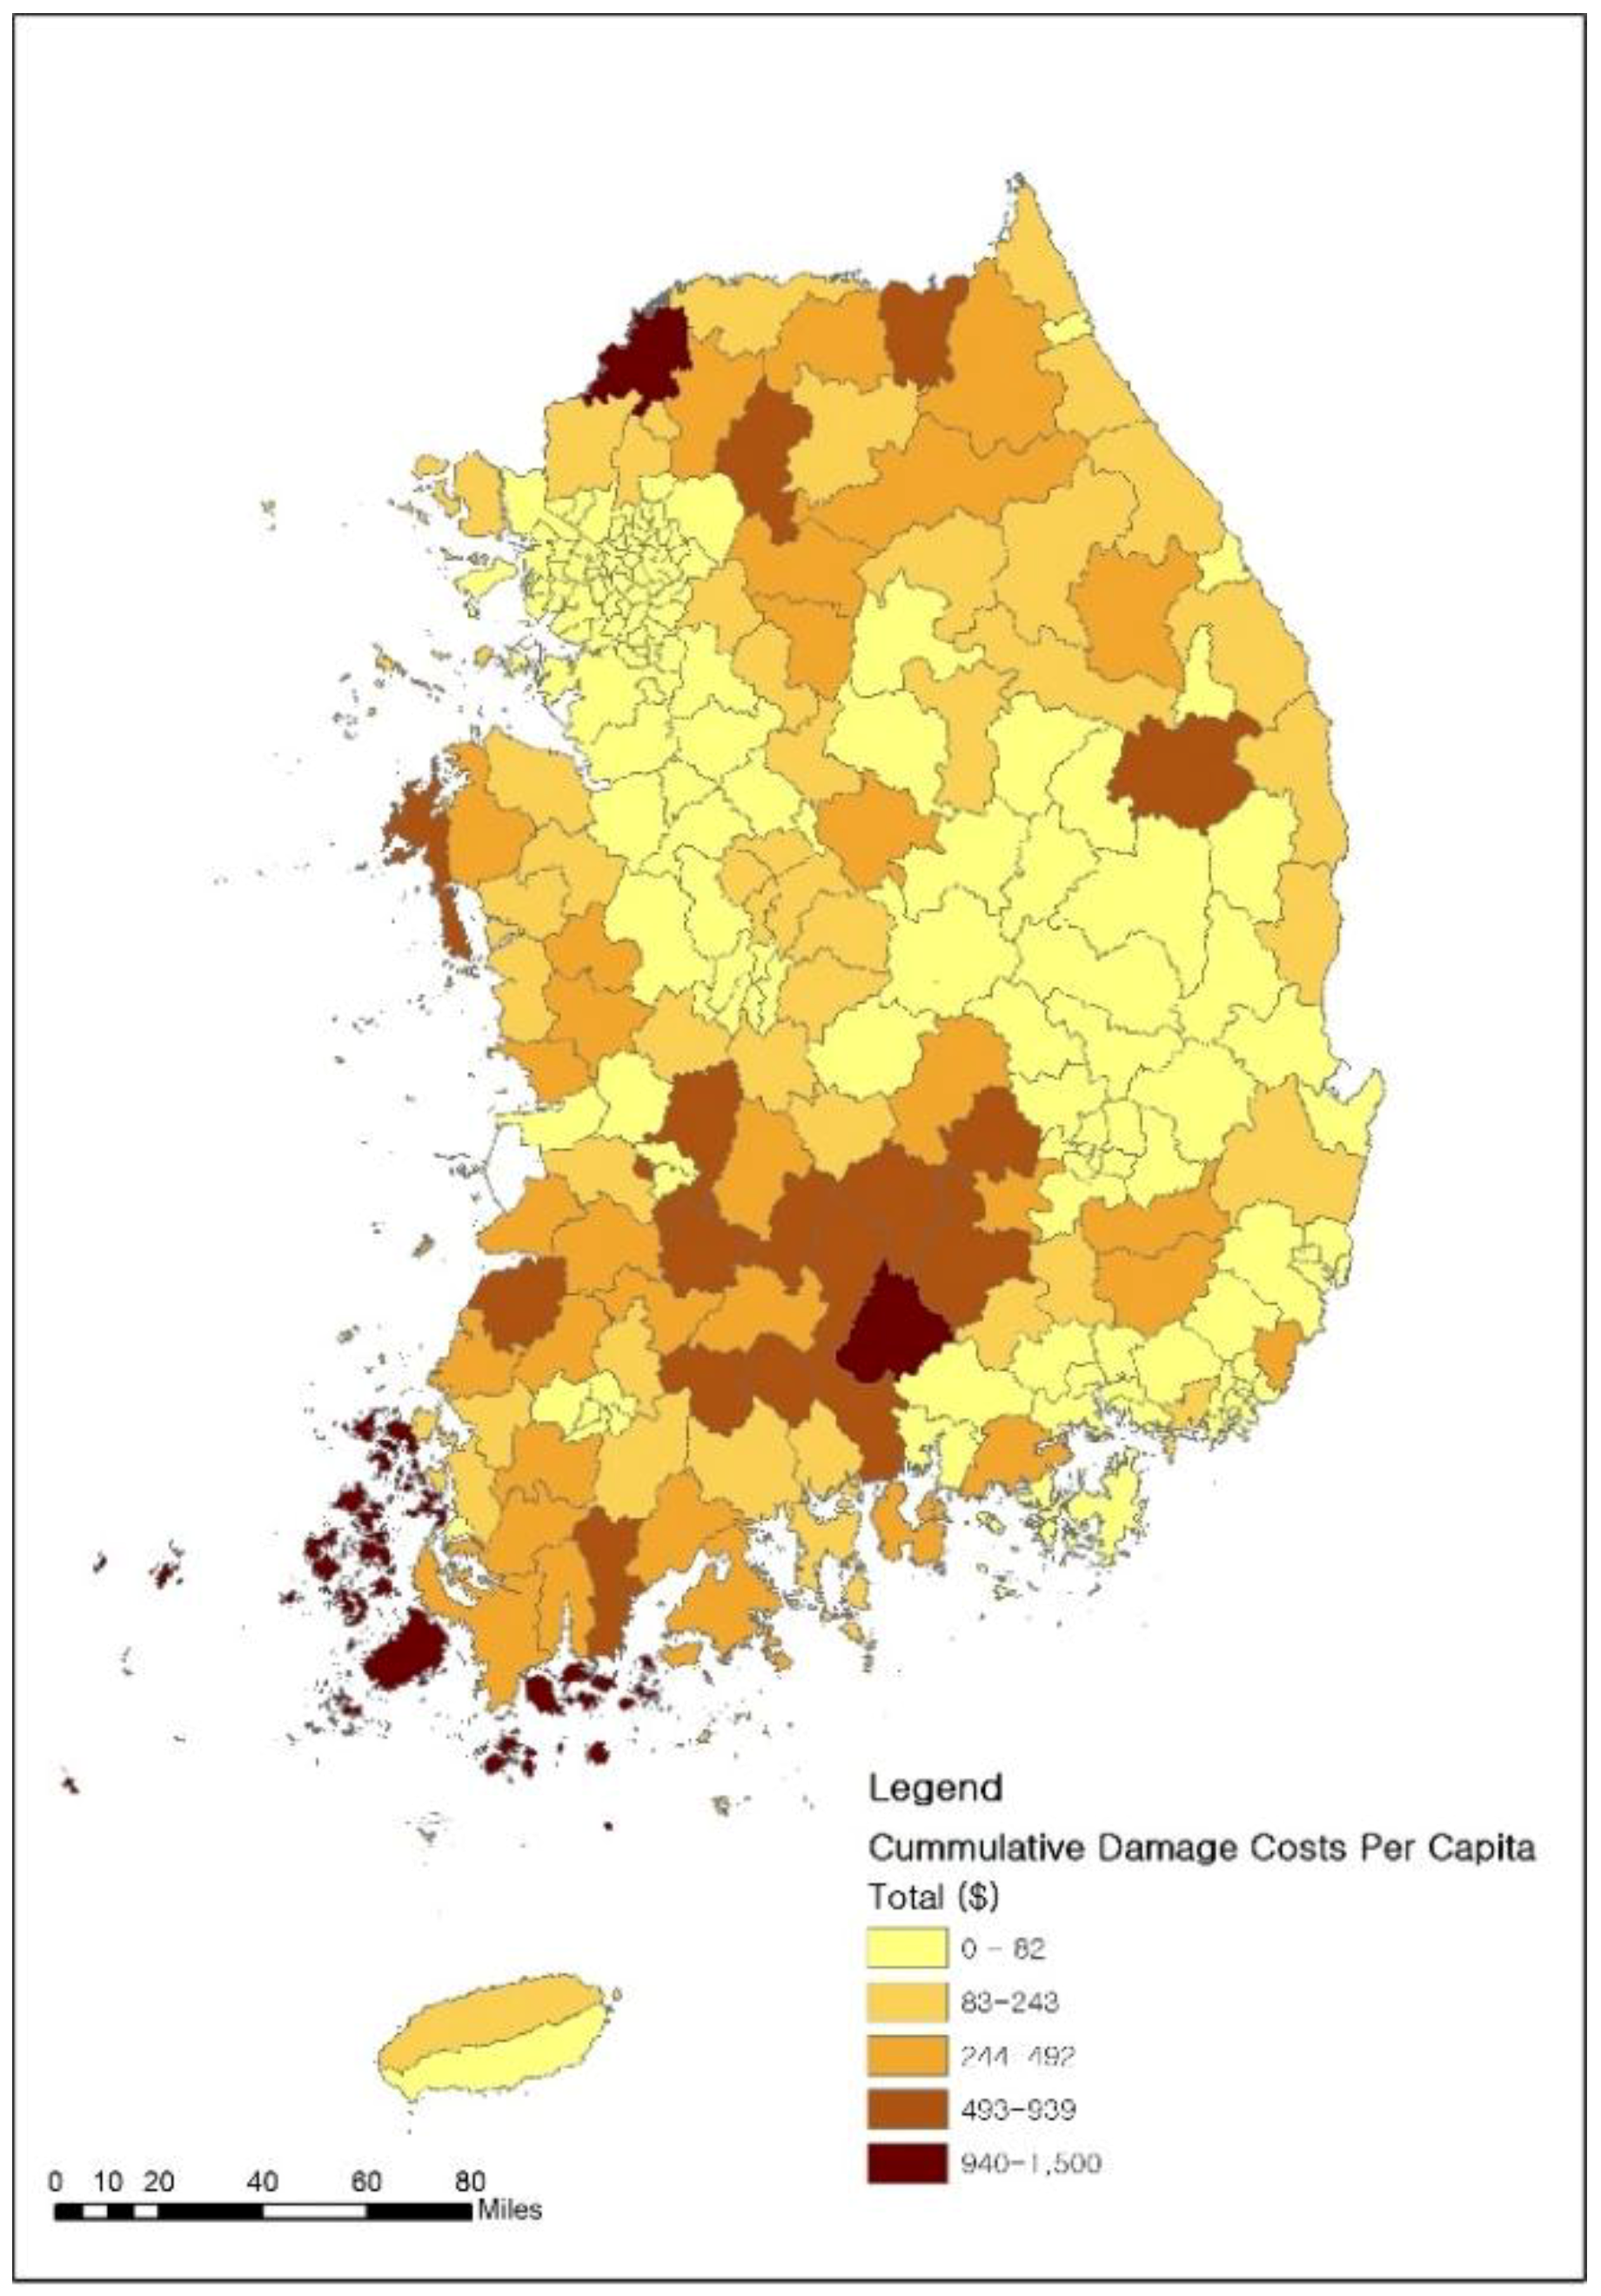
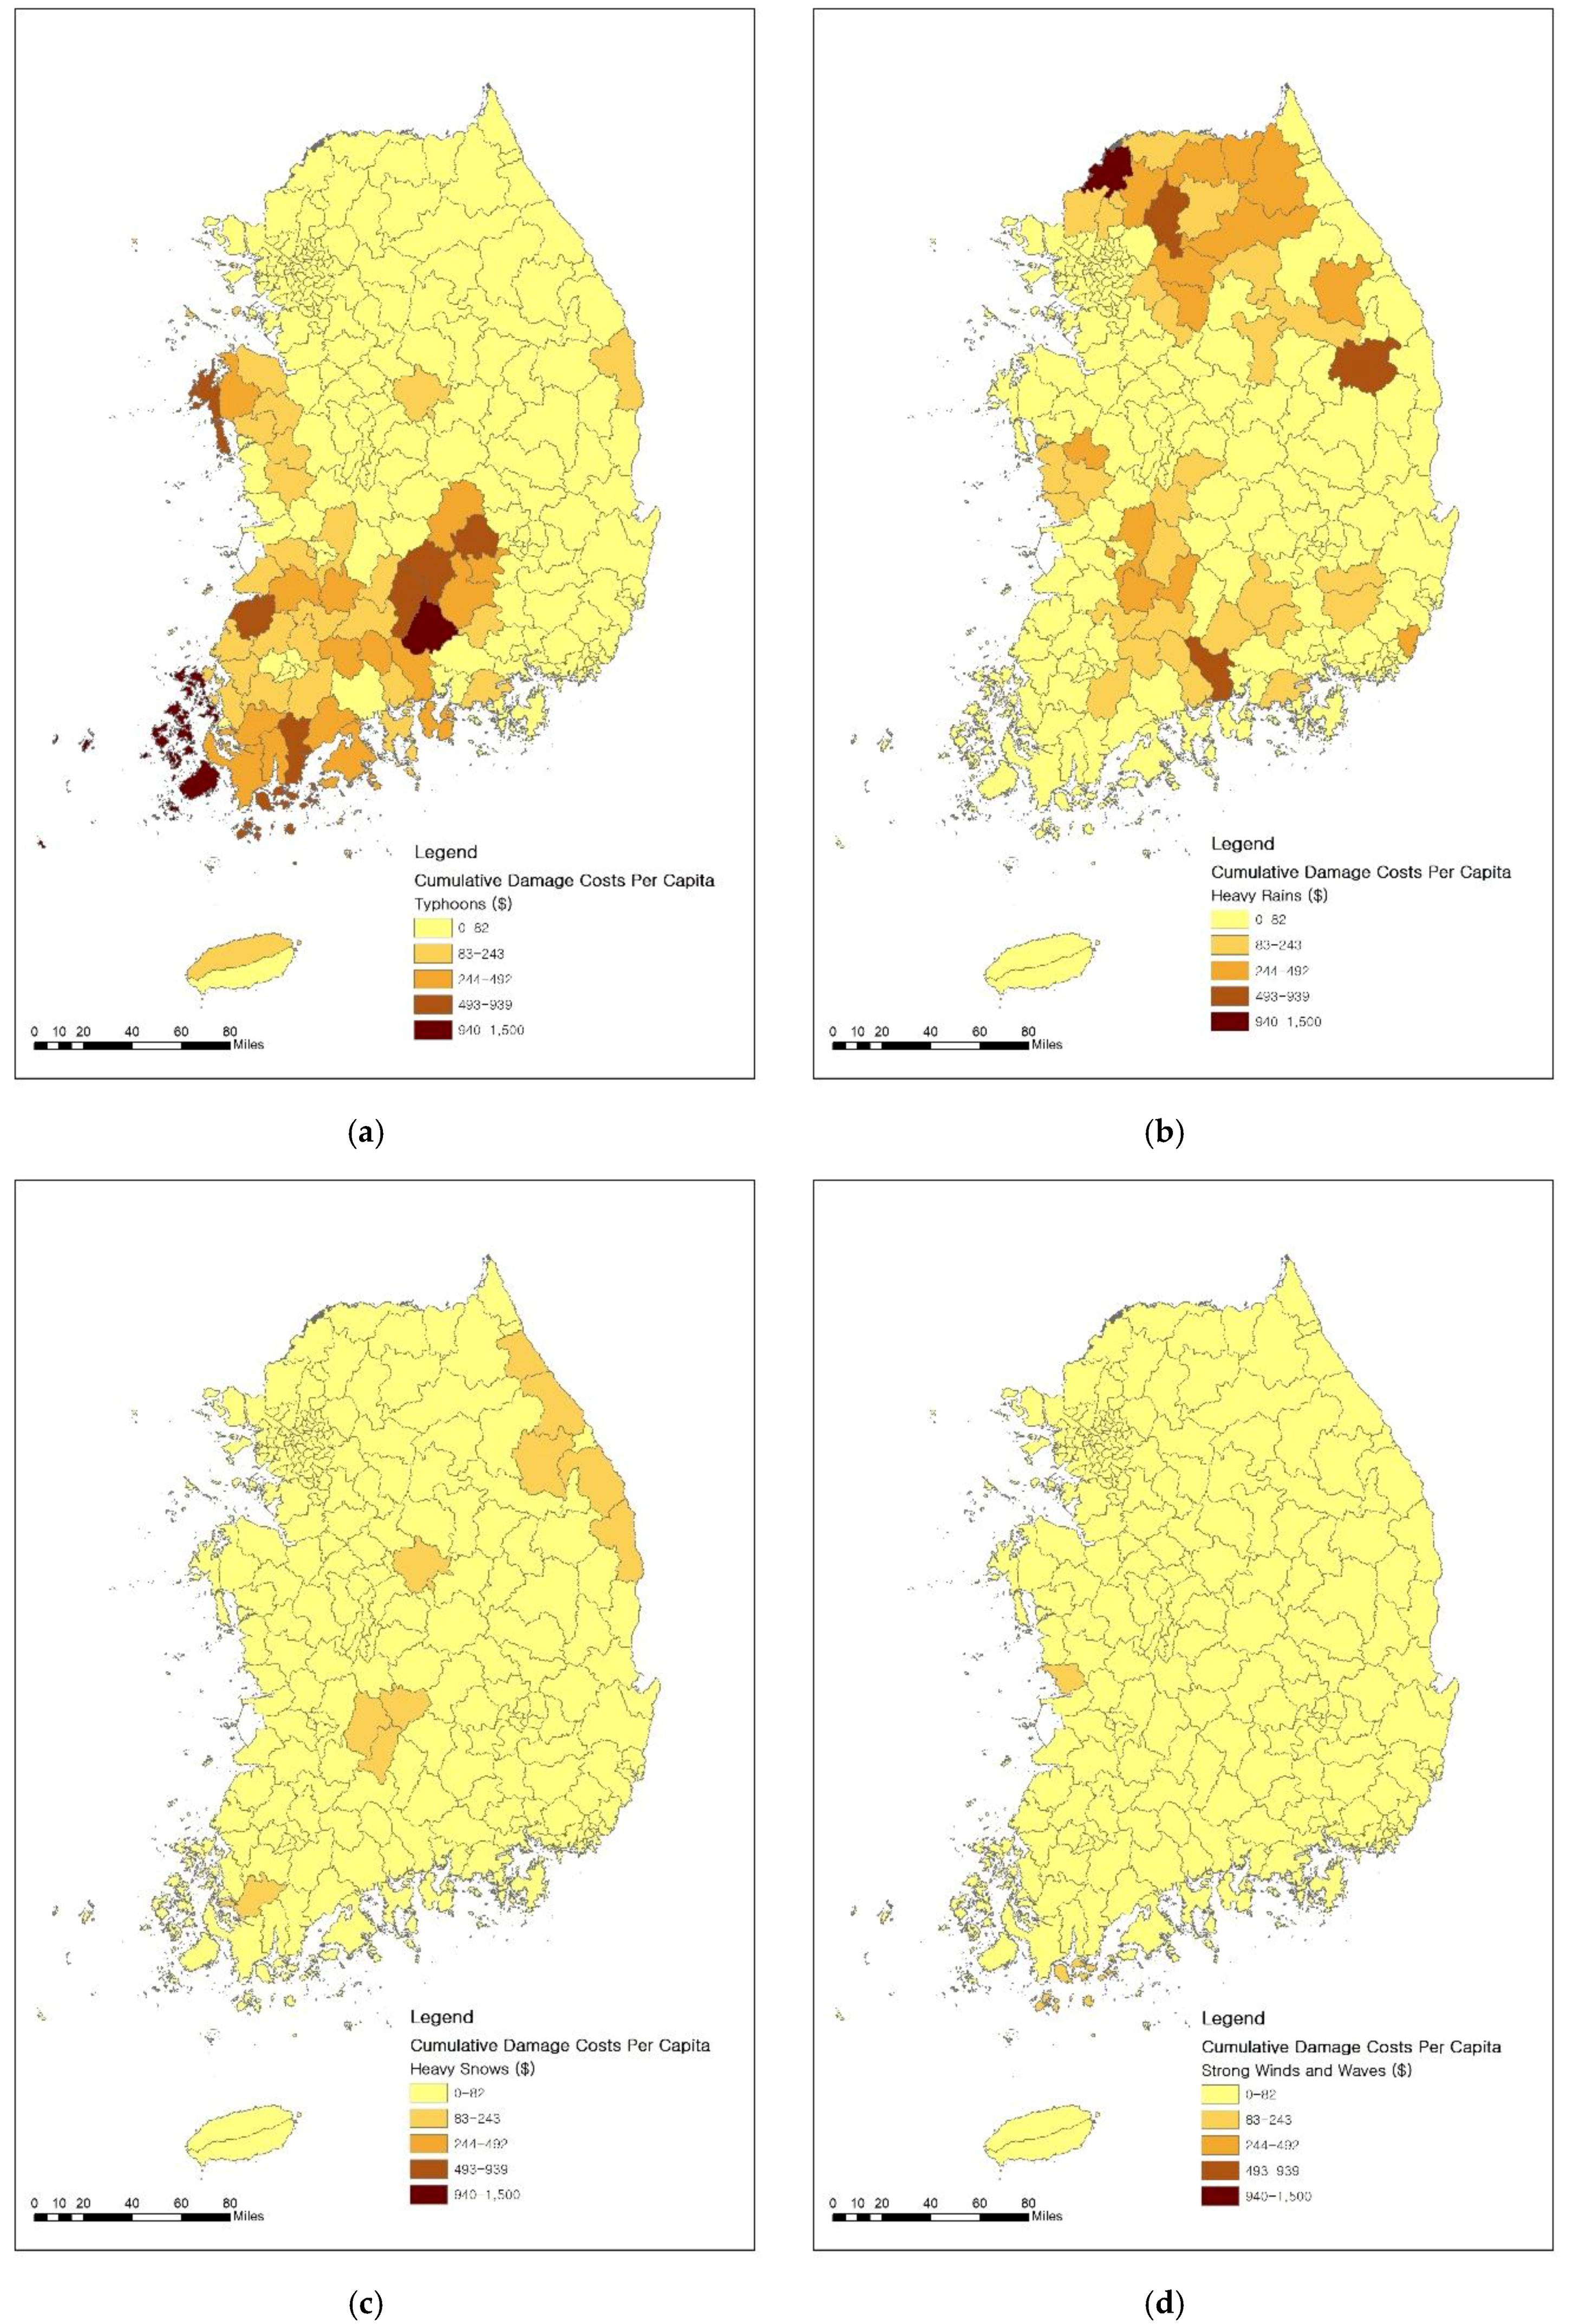
3.2. Natural Disasters

We considered four types of climatic disaster: heavy rain, typhoons, heavy snow and strong winds and waves. The Ministry of the Interior and Safety in South Korea provides information on property damage caused by natural disasters in communities (cities, counties and districts) through the Yearbook of Disasters. For the period of 2008–2015, the total property damage costs were 2612 million dollars. The monetary values in this study were converted into USD using the average market exchange rate for 2008–2015. As shown in Figure 2, the damage costs from typhoons accounted for 46% and 45% came from heavy rains. The other 9% was caused by heavy snow and strong winds.
Table 3 shows the average damage extent by disaster type in our research period. The average damage costs from heavy rains are overwhelmingly higher than other disasters. On average, typhoons and heavy rains caused a relatively large proportion of damage to public facilities, whereas heavy snow and strong winds and waves caused more damage to private property. In the case of heavy rains, there was a large number of victims and the flood damages were significantly worse than in other disasters.
We used the NSTB panel survey data as this survey has tracked the same households and their members since 2008. Since it may take time to build up social trust after natural disasters, to estimate the effects of natural disasters on levels of social trust, we created cumulative variables for the damage costs of natural disasters since 2008. We first deflated the nominal values of the cumulative property damage costs to real values using the Consumer Price Index (CPI). Then we normalized the cumulative variables by population for each year. Figure 3 shows the cumulative property damage costs per capita across communities that are classified into five groups. We define the class groupings using the Jenks natural breaks classification method provided in ArcGIS. For each group, a different color is assigned. The lighter shades indicate the lower damage costs and the darker shades indicate the higher damage costs. Figure 4 shows the cumulative property damage costs per capita by type of natural disaster. For comparison, the damage costs in Figure 4 are classified into the same five groupings as in Figure 3. As shown in Figure 3 and Figure 4, in South Korea, depending on the type of natural disaster, the damage tends to be concentrated in a specific region. Typhoons and strong winds usually cause more damage in the southern region, while heavy rains and snow usually have more of an effect on the northern region. We exploited the spatial and temporal variations in natural disasters’ damage costs to examine whether they alter levels of generalized trust.

3.3. Other Explanatory Variables

We needed to include a number of socioeconomic variables in this study that may affect social trust levels; this was based on previous studies. First, Putnam [12] argues that social networks enhance social trust. Social networks could be weakened as young people move to other regions and communities grow older. Glaeser et al. [39] and Wollebaek and Selle [40] showed that the higher level of generalized trust is found in the middle age group as compared with other age groups. However, Bjørnskov [41] and Delhey and Newton [42] failed to find the statistically significant effect of age structure, measured as a percentage of population between age 15 and 64. The Ministry of the Interior and Safety in South Korea provides resident registration demographics by age group. To address whether social trust decreases as a society grows older, we used the ratio of people aged 20–39 to those aged over 65. In addition, we considered the population size as a variable to control the size of a community. Second, de Mello Jr. [43], de Mello [44], Widmalm [45] and Dincer [46] found evidence that fiscal decentralization is positively associated with social trust. The basic idea is that fiscal decentralization provides incentives for local government officials to perform well and not engage in corruption and this can eventually lead to increased social trust. In an efficient fiscal decentralization system, local governments provide an adequate level of public good services with stable funds based on local needs. If local governments do not have adequate fiscal capacities, they may not be able to satisfy local revenue needs and this causes a decrease in both trust in government and social trust. Thus, in our study, we included the financial independence rate in the empirical models, calculated as the total of local taxes and non-tax revenues divided by the total budget for a local government. Third, Shupp, Loveridge, Skidmore, Lim and Rogers [30] argued that the impacts of disasters on social trust and patience differ based on homeownership. Their findings showed that (1) house owners are less trusting, although this is not statistically significant and (2) disaster-affected homeowners are less patient than unaffected ones. In addition to homeownership, the higher the housing prices, the greater the costs of damage resulting from disasters. Thus, in our study, property values, deflated based on the CPI at the household level, were included in the empirical models. Fourth, in previous studies, personal income were identified as important factors of social trust. Brandt et al. [47] argued that people with lower social status are less trusting and those with higher social status are more trusting. They presented evidence that a change in income positively affects generalized social trust. Delhey and Newton [42] also found a positive relationship between socioeconomic status and social trust. In our study, to account for income effects, we included personal income deflated, based on the CPI in our models.

4. Empirical Models and Results

4.1. Empirical Models

In our study, we tested the following two hypotheses: (1) disasters alter levels of generalized trust and (2) disaster effects can differ depending on the type of disaster. To test hypothesis (1), we used a random-effects ordered probit model.
S _ T i , t = β 1 l n T _ D i , t 1 + X i   o r   j , t 1 γ + m i + ε i t
ε i t | l n T _ D i ,   X i ,   m i   ~   N o r m a l ( 0 ,   1 )
Here, i indexes a survey respondent, j indexes a community and t indexes the year. S _ T i t is the ordered variable for social trust levels taking on values from 1 to 5; a higher value means a higher level of generalized trust. l n T _ D i t 1 is the natural logarithm variable of [cumulative total damage costs per capita + 1]. X i   o r   j ,   t 1 is the vector of the explanatory variables, m i is unobserved individual fixed effects and e i t is the error term. We used one-year lagged explanatory variables to rule out potential endogeneity and the explanatory variables were as follows:
  • l n I N C i t 1 : The natural logarithm variable of [income +1]
  • l n P V i t 1 : The natural logarithm variable of [housing price i + 1]
  • Y _ O r a t i o j t 1 : The ratio of people aged 20–39 to those aged over 65
  • l n P O P j t 1 : The natural logarithm variable of population
  • F i n _ I n d _ r a t e j t 1 : Financial independence rate
  • t t : Year dummy variables
To test hypothesis (2), we replaced l n T _ D i t 1 with l n H _ R a i n i t 1 , l n T y p i t 1 , l n H _ S n o w i t 1 and l n S _ W W i t 1 in Equation (1).
S _ T i t = β 1 l n H _ R a i n i t 1 + β 2 l n T y p i t 1 + β 3 l n H _ S n o w i t 1 + β 4 l n S _ W W i t 1 + X i t 1 γ + m i + ε i t
Here, l n H R i t 1 is the natural logarithm variable of [cumulative damage costs per capita of heavy rains + 1] for a community j and year t − 1. l n T y p i t 1 is the natural logarithm variable of [cumulative damage costs per capita of typhoons + 1] for a community j and year t − 1. l n H _ S n o w i t 1 is the natural logarithm variable of [cumulative damage costs per capita of heavy snows + 1] for a community j and year t − 1. l n S _ W W i t 1 is the natural logarithm variable of [cumulative damage costs per capita of strong winds and waves + 1] for a community j and year t − 1.
To account for unobserved heterogeneity that needed to be correlated with the time-varying explanatory variables, we employed the Chamberlain-Mundlak device [48,49]. That is, to handle time—invariant heterogeneity, we include time averages of all explanatory variables in the model. The Chamberlain-Mundlak device is useful to account for unobserved fixed effects in the nonlinear panel model. Summary statistics for the key variables are shown in Table 4.

4.2. Regression Results

To examine the social trust effects of changes in the damage caused by disasters, we estimated Equations (1) and (2); the estimate results are provided in Table 5. Due to the Chamberlain-Mundlak device, time averages of all explanatory variables were included in the model but we report only the estimated coefficients of the time-varying explanatory variables. The primary results of the random-effects ordered probit models are displayed in columns (3) and (4). Before moving on to the discussion of our primary results, we will first discuss the estimate results from the linear fixed-effects models displayed in columns (1) and (2). In column (1), we find evidence of a statistically significant positive relationship between disasters and social trust levels. Holding the other factors constant, a 10% increase in cumulative total disaster damage costs per capita is associated with an increase of 0.0149 or 1.49 percentage points in social trust values. In addition, the results in column (2) show that the effects of disasters on social trust levels differ depending on their type. For heavy rain, heavy snow and strong winds and waves, we found a positive relationship between damage costs and social trust levels, whereas the reverse was found for typhoons. The estimated strong winds and waves coefficient (0.599) was the largest, followed by typhoons (−0.582), heavy snow (0.291) and heavy rain (0.177), based on the absolute value.
Now, let us move on to the primary results in columns (3) and (4). The random-effects ordered probit model’s estimates were very similar in direction and significance to the linear fixed-effects model’s estimates. However, since in columns (3) and (4) the coefficients do not represent marginal effects, we need to be careful when interpreting their magnitude. To get a sense of the magnitude of the effects of cumulative total damage costs per capita on social trust levels, (1) we estimated E(S_T|X) with the average of cumulative total damage costs and their 10% increase and (2) obtained the difference. In this case, we chose the mean values for the other explanatory variables. The calculated difference was 0.013, which is very close to the effects of cumulative total damage costs on social trust values, as estimated by the linear fixed-effects model and the estimated coefficients for each type of disaster in column (4) show the same results.
When it comes to the estimate results for the explanatory variables in columns (3) and (4), we found statistically significant coefficient estimates of the values of homeowner properties, the young/old ratio and the financial independence rate. However, the coefficient estimate of the young/old ratio in column (4) is statistically significant only at the 0.10 level. There is evidence that property values, for homeowners, are negatively associated with social trust levels. Our results demonstrate that a larger share of young people is associated with higher levels of social trust. We also find evidence that an increase in the financial independence rate is associated with an increase in social trust levels. Lastly, there were the statistically significant changes in social trust levels in 2015 and 2016.
To further investigate the effects of disasters on social trust, we conducted a random-effects probit analysis. The social trust variable in the random-effects ordered probit model had values ranging from 1 to 5 for social trust: 1 meant “very unreliable” and 5 meant “very reliable”. For the random-effects probit model, the dependent variable was coded as 1 if the original response on social trust was above 4 and as 0 if otherwise. Table 6 shows the probit model estimates. Our results showed that the cumulative total damage costs per capita of disasters were positively associated with social trust. The marginal effect of the cumulative total damage costs was 0.116, implying that a 10% increase in the costs will increase the probability of trusting by 0.0116 or 1.16 percentage points. This result is very similar to previous findings. We found a statistically significant positive relationship between the cumulative damage costs per capita and social trust values for heavy rain, heavy snow and strong winds and waves. Similar to the previous results, the direction of the coefficient for typhoons was negative but not statistically significant. The coefficients for cumulative damage costs were the largest for strong winds and waves but unlike the previous results, the coefficient for heavy rain was larger than that for heavy snow. The coefficient ratio of typhoons and heavy rain was 0.860 (=0.092/0.107), which is much smaller than that seen in the previous results. For the other explanatory variables, we found a statistical significance for the young/old ratio, the values of homeowner properties and year dummy variables. However, the coefficient estimate of the values of homeowner properties are statistically significant only at the 0.10 level.

5. Discussion

Some of our results are not fully consistent with the findings of Toya and Skidmore [15]. In particular, they found that storms have a positive effect on trust, whereas floods have a negative effect. They argued that storms cause harm regardless of social class but floods tend to do great harm to areas where people with the lowest incomes usually reside [50,51]. However, our results showed that heavy rains that mainly caused flood damages had a positive effect on levels of social trust. There are three possible explanations for this. First, because of South Korea’s topographic characteristics, heavy rains often cause landslide damage regardless of social class. Second, if a private property such as a house is damaged by floods, people such as neighbors, firefighters and so forth, help the victims to recover quickly. In the process of receiving help from people, social trust can develop. Third, the more frequently flood damage occurs in an area, the more likely that the residents will participate in recovery support activities and prepare for floods together, because victims can recognize the social value of working together to recover from disasters.
Why did we find that typhoons negatively affected social trust levels, unlike the other disasters? A possible explanation is that the damage from typhoons tends to be concentrated on public facilities such as roads, bridges, rivers and water supply infrastructure and so forth in South Korea. The worse the damage, the more likely it is that the recovery will be delayed and in this process, discontentment with the local government’s performance can increase. Second, disaster-affected people may compete with one another for limited resources [18,19]. Third, typhoons that cause heavy damage are relatively less frequent and it is still difficult to accurately predict the path of a typhoon, though typhoon forecasting techniques have improved. Inaccurate predictions make it difficult for governments to prepare for and minimize potential damage and this may increase dissatisfaction and discontent in government. Lastly, typhoons may strike anywhere, while floods typically happen repeatedly in the same places. It is possible that expectations play a role in how people respond to disasters. However, in during the period of our analysis, the impacts of typhoons were concentrated in the Southwestern region.
As shown in Table 5, the coefficient ratio of typhoons and heavy rains was 3.49 (=0.789/0.226), which means that the negative effects of typhoons on social trust were relatively larger than the positive effects of heavy rains on average. The positive coefficient estimates for strong winds and waves and heavy snow were relatively larger than heavy rains, possibly because they cause more damage to private property than public facilities (see Table 3). Thus, to recover from damage to private property, the efforts of many people, as well as governments, are more likely to be required and this may result in a greater recognition of the value of cooperation, thus building trust. Heavy rains cause much damage, not only to private properties but also to public facilities. In this case, the disasters could develop or diminish the recovery process, depending on the degree of needed recovery efforts.
When it comes to the results for other explanatory variables, we first found the negative relationship between property values, for homeowners and social trust levels. Shupp, Loveridge, Skidmore, Lim and Rogers [30] argued that homeowners are more patient but disaster-affected homeowners are less patient. If a property is affected by a disaster and property values are high, then this property may have significant damage. In this case, if disaster recovery is delayed, the victims could become less trusting. Second, our results show that the relatively large share of young people is associated with higher levels of social trust. Our results are consistent with the studies of Putnam [12], Glaeser, Laibson, Scheinkman and Soutter [39] and Wollebaek and Selle [40]. In addition, this result suggests that the role of young people could be important if victims need the help of neighbors to recover from the damage to their property. If there were only elderly people in a community, it would be difficult for them to help each other recover from the damage. In this case, the victims’ discontent would grow if the government’s response was delayed. Third, we found a positive relationship between financial independence and social trust. A local government with a high level of financial independence has a high revenue capacity and can provide greater recovery assistance. Thus, residents in a region with a high level of financial independence may be more satisfied with the damage recovery.
In our analysis, the pattern of coefficient estimates on year dummy variables is also of interest. The results show that compared to 2014, holding other factors constant, social trust levels increased in 2015 but fell sharply in 2016. These changes may have resulted from exogenous shocks. In South Korea, there were big social issues in 2015 and 2016. First, there was an outbreak of the Middle East respiratory syndrome (MERS) virus in 2015. According to the 2015 MERS report by the Korea Centers for Disease Control, after the first MERS case broke out on 20 May 2015, there were 186 confirmed cases of infection and 38 deaths; 16,693 people were quarantined until South Korea declared that the outbreak was over. Fear of the MERS virus spread throughout the whole country and because there was no vaccine to treat it at the time, everyone faced the risk of exposure. Then, in 2016, there was a massive corruption scandal involving Park Geun-Hye, the first female president of South Korea. This political scandal prompted mass protests and, in the end, Park was impeached in March 2017. Previous studies show that corruption negatively affects social trust levels [52,53].

6. Conclusions

Governments and other local organizations strive to minimize the impacts caused by natural disasters. In this recovery process, depending on how authorities respond to disasters, disasters may affect social trust. From the perspective of sustainability, increasing our understanding of how the disasters affect societal trust informs the implementation process of new sustainability plans and policies that may emerge in the post-disaster environment [54].
In this paper, we estimated the effects of changes in cumulative damage costs related to various types of disaster on levels of social trust, using panel data from South Korea. Although we found evidence that disasters affect levels of social trust, our results showed that the relationship differed across disaster types. Our main findings on the relationship between disasters and social trust are:
  • An increase in cumulative total disaster damage costs per capita is associated with an increase in social trust levels.
  • In the cases of heavy rain, heavy snow and strong winds and waves, an increase in cumulative damage costs per capita is associated with an increase in social trust levels.
  • In the case of typhoons, an increase in cumulative damage costs per capita is associated with a decrease in social trust levels.
The direction and degree of disasters’ effects on social trust may differ depending on the degree of help victims can get from people during the disaster recovery process and the speed that disaster recovery can be completed. When disasters mainly damage private property, victims are usually helped by neighbors, firefighters, soldiers and so forth. The development of social trust can be positively affected by interactions with such people. Putnam [12] argued that social trust increases as a result of repeated contacts in a society. In addition, those who suffer from similar damage to private property can help each other and often share a common will to overcome their difficulties. Conversely, when disasters damage public facilities such as roads, bridges and so forth, if the recovery efforts are delayed, dissatisfaction and discontent both increase and this may weaken social trust. Since typhoons mainly damaged public facilities in 2013–2015 in South Korea, that may have resulted in the statistically negative relationship between typhoons and social trust levels. Even though typhoons damage private property and this may lead to positive effects on social trust levels, the negative effects may be more prominent. It is also possible for typhoon-affected people to become more competitive over limited resources than other disaster victims, resulting in conflicts among them. Regarding heavy rain, heavy snow and strong winds and waves, social trust may develop through face-to-face interactions with people in the disaster recovery process and this positive effect on social trust levels could overcome the negative effects of disaster damage.
In sum, our study shows that disasters influence the degree of social trust. We argue that a quick governmental response to a disaster and active support from other people such as neighbors can positively affect social trust during recovery from a disaster. In terms of policy, it is important for local governments to actively respond to disaster damage so that the recovery process is not delayed. As a population ages, it may be that neighbors are not able to assist in disaster recovery. Local governments can make accommodations for the elderly in their communities and it is also important to respond quickly to disasters in communities with older populations.
South Korea has a comprehensive disaster management system that is centralized and integrated at the national level [55,56]. Also, a central government has made an effort to enhance the roles of the governments at the local level in the system [55]. However, Bae, Joo and Won [55] argued that there is a considerable lack of local government capacity to deal with natural disasters. In this situation, to offer timely and efficient responses to natural disasters, as Bae, Joo and Won [55] and Yoon [56] suggested, it is crucial to improve the collaborative linkage among the central government, local governments and other institutions in the system. One important point here is that research suggests that governments will need long-term policy efforts in order to make successful sustainable transitions originating in disaster contexts [57].

Author Contributions

Conceptualization, S.H.K. and M.S.; Data curation, S.H.K.; Formal analysis, S.H.K. and M.S.; Funding acquisition, S.H.K.; Investigation, S.H.K. and M.S.; Methodology, S.H.K. and M.S.; Project administration, S.H.K.; Software, S.H.K.; Visualization, S.H.K.; Writing-original draft, S.H.K.; Writing-review & editing, M.S.

Funding

This research received no external funding.

Acknowledgments

This work was supported by the research fund of Hanyang University (HY-2017).

Conflicts of Interest

There are no conflict of interest to declare.

References

  1. Cvetkovich, G. Social Trust and the Management of Risk; Routledge: Abingdon, UK, 2013. [Google Scholar]
  2. Earle, T.C.; Siegrist, M.; Gutscher, H. Trust in Risk Management: Uncertainty and Scepticism in the Public Mind; Earthscan: London, UK, 2010. [Google Scholar]
  3. Slovic, P. Perceived risk, trust, and democracy. Risk Anal. 1993, 13, 675–682. [Google Scholar] [CrossRef]
  4. Bostrom, A.; Atkinson, E. Trust in Cooperative Risk management: Uncertainty and scepticism in the public mind. In Trust and Risk in Smallpox Vaccination; Routledge: Abingdon, UK, 2007; pp. 173–186. [Google Scholar]
  5. Stern, P.C.; Kalof, L.; Dietz, T.; Guagnano, G.A. Values, beliefs, and proenvironmental action: Attitude formation toward emergent attitude objects 1. J. Appl. Soc. Psychol. 1995, 25, 1611–1636. [Google Scholar] [CrossRef]
  6. Arvai, J.; Rivers, L., III. Effective Risk Communication; Routledge: Abingdon-on-Thames, UK, 2013. [Google Scholar]
  7. Earle, T.C.; Cvetkovich, G. Social Trust: Toward a Cosmopolitan Society; Greenwood Publishing Group: Santa Barbara, CA, USA, 1995. [Google Scholar]
  8. Earle, T.C.; Cvetkovich, G. Social trust and culture in risk management. In Social Trust and the Management of Risk; Cvetkovich, G., Lofstedt, R., Eds.; Routledge: London, UK, 1999; pp. 9–21. [Google Scholar]
  9. Earle, T.C.; Siegrist, M.; Gutscher, H. Trust, risk perception and the tcc model of cooperation. In Trust in risk Management: Uncertainty and Scepticism in the Public Mind; Siegrist, M., Earle, T.C., Gutscher, H., Eds.; Routledge: London, UK; New York, NK, USA, 2010; pp. 1–50. [Google Scholar]
  10. Siegrist, M.; Earle, T.C.; Gutscher, H. Test of a trust and confidence model in the applied context of electromagnetic field (EMF) risks. Risk Anal. 2003, 23, 705–716. [Google Scholar] [CrossRef] [PubMed]
  11. Uslaner, E.M. Trust and risk: Implications for management. In Trust in Risk Management; Routledge: London, UK, 2010; pp. 88–108. [Google Scholar]
  12. Putnam, R.D. Bowling alone: America’s declining social capital. J. Democr. 1995, 6, 65–78. [Google Scholar] [CrossRef]
  13. Fukuyama, F. Trust: The Social Virtues and the Creation of Prosperity; Free Press Paperbacks: New York, NY, USA, 1995. [Google Scholar]
  14. Warren, M.R.; Thompson, J.P.; Saegert, S. The role of social capital in combating poverty. Soc. Capital Poor Commun. 2001, 3, 1–28. [Google Scholar]
  15. Toya, H.; Skidmore, M. Do natural disasters enhance societal trust? Kyklos 2014, 67, 255–279. [Google Scholar] [CrossRef]
  16. Emery, M.; Flora, C. Spiraling-up: Mapping community transformation with community capitals framework. Community Dev. 2006, 37, 19–35. [Google Scholar] [CrossRef]
  17. Hsiang, S.M.; Burke, M.; Miguel, E. Quantifying the influence of climate on human conflict. Science 2013, 341, 1235367. [Google Scholar] [CrossRef] [PubMed]
  18. Bhavnani, R. Natural Disaster Conflicts; Harvard University: Cambridge, MA, USA, 2006; (Unpublished manuscript). [Google Scholar]
  19. Brancati, D. Political aftershocks: The impact of earthquakes on intrastate conflict. J. Confl. Resolut. 2007, 51, 715–743. [Google Scholar] [CrossRef]
  20. Calo-Blanco, A.; Kovářík, J.; Mengel, F.; Romero, J.G. Natural disasters and indicators of social cohesion. PLoS ONE 2017, 12, e0176885. [Google Scholar] [CrossRef] [PubMed]
  21. Skidmore, M.; Toya, H. Do natural disasters promote long-run growth? Econ. Inq. 2002, 40, 664–687. [Google Scholar] [CrossRef]
  22. Schumpeter, J. Creative destruction. Cap. Socialism Democr. 1942, 825, 82–85. [Google Scholar]
  23. Cuaresma, C.J.; Hlouskova, J.; Obersteiner, M. Natural disasters as creative destruction? Evidence from developing countries. Econ. Inq. 2008, 46, 214–226. [Google Scholar] [CrossRef]
  24. Leiter, A.M.; Oberhofer, H.; Raschky, P.A. Creative disasters? Flooding effects on capital, labour and productivity within european firms. Environ. Resour. Econ. 2009, 43, 333–350. [Google Scholar] [CrossRef]
  25. Bjørnskov, C.; Méon, P.-G. The productivity of trust. World Dev. 2015, 70, 317–331. [Google Scholar] [CrossRef]
  26. Knack, S.; Keefer, P. Does social capital have an economic payoff? A cross-country investigation. Q. J. Econ. 1997, 112, 1251–1288. [Google Scholar] [CrossRef]
  27. Dinda, S. Social capital in the creation of human capital and economic growth: A productive consumption approach. J. Socio-Econ. 2008, 37, 2020–2033. [Google Scholar] [CrossRef] [Green Version]
  28. Rupasingha, A.; Goetz, S.J.; Freshwater, D. Social capital and economic growth: A county-level analysis. J. Agric. Appl. Econ. 2000, 32, 565–572. [Google Scholar] [CrossRef]
  29. Cassar, A.; Healy, A.; Von Kessler, C. Trust, risk, and time preferences after a natural disaster: Experimental evidence from thailand. World Dev. 2017, 94, 90–105. [Google Scholar] [CrossRef]
  30. Shupp, R.; Loveridge, S.; Skidmore, M.; Lim, J.; Rogers, C. Trust and patience after a tornado. Weather Clim. Soc. 2017, 9, 659–668. [Google Scholar] [CrossRef]
  31. Dussaillant, F.; Guzmán, E. Trust via disasters: The case of chile’s 2010 earthquake. Disasters 2014, 38, 808–832. [Google Scholar] [CrossRef] [PubMed]
  32. Miller, D.S. Visualizing the corrosive community: Looting in the aftermath of hurricane katrina. Space Cult. 2006, 9, 71–73. [Google Scholar] [CrossRef]
  33. Fleming, D.A.; Chong, A.; Bejarano, H.D. Trust and reciprocity in the aftermath of natural disasters. J. Dev. Stud. 2014, 50, 1482–1493. [Google Scholar] [CrossRef]
  34. Papanikolaou, V.; Adamis, D.; Mellon, R.C.; Prodromitis, G.; Kyriopoulos, J. Trust, social and personal attitudes after wildfires in a rural region of greece. Sociol. Mind 2012, 2, 87–94. [Google Scholar] [CrossRef]
  35. Ahsan, D.A. Does natural disaster influence people’s risk preference and trust? An experiment from cyclone prone coast of bangladesh. Int. J. Disaster Risk Reduct. 2014, 9, 48–57. [Google Scholar] [CrossRef]
  36. Uslaner, E.M. Trust as a moral value. In The Handbook of Social Capital; Castiglione, D., Deth Van, J.W., Wolleb, G., Eds.; Oxford University Press: Oxford, UK, 2008; pp. 101–121. [Google Scholar]
  37. Nannestad, P. What have we learned about generalized trust, if anything? Annu. Rev. Political Sci. 2008, 11, 413–436. [Google Scholar] [CrossRef]
  38. Uslaner, E.M. Measuring generalized trust: In defense of the ‘standard’question. In Handbook of Research Methods on Trust; Lyon, F., Mšllering, G., Saunders, M.N., Eds.; Edward Elgar Publishing: Cheltenham, UK, 2012; Volume 72. [Google Scholar]
  39. Glaeser, E.L.; Laibson, D.I.; Scheinkman, J.A.; Soutter, C.L. Measuring trust. Q. J. Econ. 2000, 115, 811–846. [Google Scholar] [CrossRef]
  40. Wollebaek, D.; Selle, P. Does participation in voluntary associations contribute to social capital? The impact of intensity, scope, and type. Nonprofit Volunt. Sect. Q. 2002, 31, 32–61. [Google Scholar] [CrossRef]
  41. Bjørnskov, C. Determinants of generalized trust: A cross-country comparison. Public Choice 2007, 130, 1–21. [Google Scholar] [CrossRef]
  42. Delhey, J.; Newton, K. Who trusts? The origins of social trust in seven societies. Eur. Soc. 2003, 5, 93–137. [Google Scholar] [CrossRef]
  43. De Mello, L.R., Jr. Can fiscal decentralization strengthen social capital? Public Financ. Rev. 2004, 32, 4–35. [Google Scholar] [CrossRef]
  44. De Mello, L. Does fiscal decentralisation strengthen social capital? Cross-country evidence and the experiences of brazil and indonesia. Environ. Plan. C Gov. Policy 2011, 29, 281–296. [Google Scholar] [CrossRef]
  45. Widmalm, S. Decentralisation, Corruption and Social Capital: From India to the West; SAGE Publications India: New Delhi, India, 2008. [Google Scholar]
  46. Dincer, O. Fiscal decentralization and trust. Public Financ. Rev. 2010, 38, 178–192. [Google Scholar] [CrossRef]
  47. Brandt, M.J.; Wetherell, G.; Henry, P. Changes in income predict change in social trust: A longitudinal analysis. Polit. Psychol. 2015, 36, 761–768. [Google Scholar] [CrossRef]
  48. Mundlak, Y. On the pooling of time series and cross section data. Econom. J. Econom. Soc. 1978, 46, 69–85. [Google Scholar] [CrossRef]
  49. Chamberlain, G. Analysis of covariance with qualitative data. Rev. Econ. Stud. 1980, 47, 225–238. [Google Scholar] [CrossRef]
  50. Pelling, M. What determines vulnerability to floods; a case study in georgetown, guyana. Environ. Urban 1997, 9, 203–226. [Google Scholar] [CrossRef]
  51. Few, R. Flooding, vulnerability and coping strategies: Local responses to a global threat. Prog. Dev. Stud. 2003, 3, 43–58. [Google Scholar] [CrossRef]
  52. Rothstein, B.; Uslaner, E.M. All for all: Equality, corruption, and social trust. World Politics. 2005, 58, 41–72. [Google Scholar] [CrossRef]
  53. Levi, M.; Stoker, L. Political trust and trustworthiness. Annu. Rev. Politics. Sci. 2000, 3, 475–507. [Google Scholar] [CrossRef]
  54. Pierce, J.; Lovrich, N.; Johnson, B.; Reames, T.; Budd, W. Social capital and longitudinal change in sustainability plans and policies: Us cities from 2000 to 2010. Sustainability 2014, 6, 136–157. [Google Scholar] [CrossRef]
  55. Bae, Y.; Joo, Y.-M.; Won, S.-Y. Decentralization and collaborative disaster governance: Evidence from south korea. Habitat Int. 2016, 52, 50–56. [Google Scholar] [CrossRef]
  56. Yoon, D.K. Disaster policies and emergency management in korea. In Disaster and Development; Springer: Berlin, Germany, 2014; pp. 149–164. [Google Scholar]
  57. Brundiers, K.; Eakin, H.C. Leveraging post-disaster windows of opportunities for change towards sustainability: A framework. Sustainability 2018, 10, 1390. [Google Scholar] [CrossRef]
Figure 1. Social Trust Values (2014–2016 three-year average).
Sustainability 10 02973 g001
Figure 2. Cumulative Damage Costs: 2008–2015 (millions of dollars). Source: Author’s calculations based on the Yearbook of Disasters from 2008–2015.
Sustainability 10 02973 g002
Figure 3. Cumulative Total Damage Costs Per Capita: 2008–2015.
Sustainability 10 02973 g003
Figure 4. Cumulative Damage Costs Per Capita by Type of Natural Disaster: (a) Typhoons, (b) Heavy Rains, (c) Heavy Snows, (d) Strong Winds and Waves.
Sustainability 10 02973 g004
Table 1. Summary Statistics of the Social Trust Variable.
YearObs.MeanStd. Dev.
201442583.0230.951
201542583.1940.877
201642582.4090.876
Table 2. Percentage of Respondents in Each Response Category by Year.
Values201420152016Average across the Three Years
5: Very reliable4.34%0.89%0.63%1.95%
4: Reliable29.85%43.00%7.61%26.82%
3: Neutral33.02%35.09%40.61%36.24%
2: Unreliable29.29%16.65%34.36%26.77%
1: Very unreliable3.05%4.37%16.79%8.07%
Table 3. Average Damage Extent for Each Type of Disaster: 2013–2015.
DisastersPrivate PropertiesPublic FacilitiesTotal
Unit1000$%1000$%1000$
AC/A × 100BB/C × 100C = A + B
Total23,014.330.7890,155.369.22113,169.7
Heavy Rains5228.724.9883,639.075.0588,867.7
Heavy Snows15,574.395.951160.04.0516,734.0
Typhoons1151.016.894856.783.126007.3
Strong Winds and Waves1060.768.00500.032.401560.3
Note: In this table, “private property” means housing, ships, agricultural lands and others (e.g., livestock barn facilities). Source: Author’s calculations based on the Yearbook of Disasters from 2013–2015.
Table 4. Summary Statistics and Sources of the Dependent and Independent Variables.
VariablesObs.MeanS. E.Source
Social Trust (S_T)12,6872.870.96The survey conducted by KIPF
Cumulative Damage Costs per Capita ($)
Total (T_D)12,68768.33139.55Yearbook of Disasters published by the NEMA
Heavy Rains (H_Rain)12,68733.23100.83
Typhoons (Typh)12,68727.4972.28
Heavy Snows (H_Snow)12,6875.6817.31
Strong Winds and Waves (St_WW)12,6871.9213.29
Personal Income ($) (INC)12,68724882974The survey conducted by KIPF
Housing Values (H_V)12,687138,678208,474The survey conducted by KIPF
The Ratio of People Aged 20–39 to Those Aged Over 65 (%) (Y_ORatio)12,6872.390.98Resident registration demographics, MOI
Population (POP)12,687390,462270,479Resident registration demographics, MOI
Financial Independence Rate (%) (Fin_Indp_Rate)12,68732.8613.99Local finance open system, MOI
Table 5. Estimation Results of Fixed-Effects Model and Random-Effects Ordered Probit Model.
Models(1) FE(2) FE(3) RE Ordered Probit(4) RE Ordered Probit
Dependent VariablesS_TS_TS_TS_T
ln[T_D] t − 10.149 *** 0.190 ***
(0.042) (0.053)
ln[H_Rain] t − 1 0.177 *** 0.226 ***
(0.042) (0.053)
ln[H_Snow] t − 1 0.291 *** 0.353 ***
(0.056) (0.068)
ln[Typ] t − 1 −0.582 *** −0.789 ***
(0.105) (0.156)
ln[St_WW] t − 1 0.599 *** 0.765 ***
(0.132) (0.166)
ln[INC] t − 1−0.007−0.007−0.010−0.010
(0.014)(0.014)(0.018)(0.018)
ln[H_V] t − 1−0.011 **−0.011 **−0.014 **−0.014 **
(0.005)(0.005)(0.007)(0.007)
Y_ORatio t − 10.451 ***0.293 *0.589 ***0.390 *
(0.163)(0.165)(0.205)(0.209)
Fin_Ind_Rate t − 10.013 ***0.013 ***0.015 **0.015 **
(0.005)(0.005)(0.006)(0.006)
ln[POP] t − 1−0.221−0.163−0.328−0.252
(0.510)(0.517)(0.631)(0.644)
2015 dummy0.238 ***0.196 ***0.279 ***0.228 ***
(0.031)(0.032)(0.039)(0.040)
2016 dummy−0.488 ***−0.553 ***−0.605 ***−0.688 ***
(0.049)(0.050)(0.061)(0.064)
Constant3.9784.196
(6.207)(6.315)
Cut1 −0.753 ***−0.374
(0.250)(0.254)
Cut2 0.3900.775 ***
(0.250)(0.254)
Cut3 1.481 ***1.871 ***
(0.250)(0.254)
Cut4 3.172 ***3.566 ***
−0.253(0.257)
Obs.12,68712,68712,68712,687
R-squared or Pseudo R-squared0.1940.2000.0540.057
Notes: 1. Robust standard errors are in parentheses. 2. *** p < 0.01, ** p < 0.05, * p < 0.1.
Table 6. Random-Effects Probit Model Estimation Results.
Models(1) RE Probit(2) RE Probit(3) RE Probit(4) RE Probit
Dependent VariablesBinary Variable of S_TBinary Variable of S_TBinary Variable of S_TBinary Variable of S_T
RE Probit EstimationRE Probit EstimationMarginal EffectsMarginal Effects
ln[T_D] t − 10.418 *** 0.116 ***
(0.083) (0.023)
ln[H_Rain] t − 1 0.386 *** 0.107 ***
(0.083) (0.023)
ln[H_Snow] t − 1 0.336 *** 0.093 ***
(0.091) (0.025)
ln[Typ] t − 1 −0.332 −0.092
(0.214) (0.059)
ln[St_WW] t − 1 0.646 *** 0.179 ***
(0.238) (0.066)
ln[INC] t − 1−0.007−0.008−0.002−0.002
(0.023)(0.023)0.006(0.006)
ln[H_V]−0.017 *−0.016 *−0.005 *−0.004 *
(0.010)(0.010)0.003(0.003)
Y_ORatio t − 10.914 ***0.705 **0.254 ***0.196 ***
(0.310)(0.315)0.086(0.087)
Fin_Ind_Rate t − 10.0020.0020.0010.001
(0.008)(0.008)0.002(0.002)
ln[POP] t − 1−0.433−0.437−0.120−0.121
(0.960)(0.994)0.267(0.276)
2015 dummy0.383 ***0.338 ***0.106 ***0.094 ***
(0.053)(0.055)(0.015)(0.015)
2016 dummy−0.864 ***−0.947 ***−0.240 ***−0.263 ***
(0.089)(0.094)(0.025)(0.026)
Constant−0.862 ***−1.275 ***
(0.328)(0.339)
Obs.12,68712,68712,68712,687
Pseudo R-squared0.1150.118
Notes: 1. Robust standard errors are in parentheses. 2. *** p < 0.01, ** p < 0.05, * p < 0.10.

