1. Introduction
The labour market is an example of the market developed in the course of a historical process, the importance of which is essential for the proper functioning of economy in national, regional, and local dimensions. It should also be observed that since the market functions as the regulator of economic processes, its sustainability remains crucial from the perspective of broader development processes taking place in economy [
1], including the aspect of providing population with appropriate living standards or preventing excessive migration processes. The subject literature is dominated by the opinion that administrative changes exert large impact on the labour market. This problem was discussed by e.g., P. Śleszyński [
2], or J. Potocki and A. Babczuk [
3], whereas the resulting disorders in the relationships between cities were covered by T. Komornicki and P. Siłka [
4]. It translates a dominating opinion, among researchers, about the negative impact of administrative functions’ loss by cities and the development of political debate in the country.
Until 1998, Poland was divided into 49 voivodships constituting field government administration. The perspective of accessing the European Union structures and assigning regions with the task of regional policy implementation required introducing corrections in this division and establishing larger, economically stronger voivodships. Following the administrative reform, which came into force on 1 January 1999 [
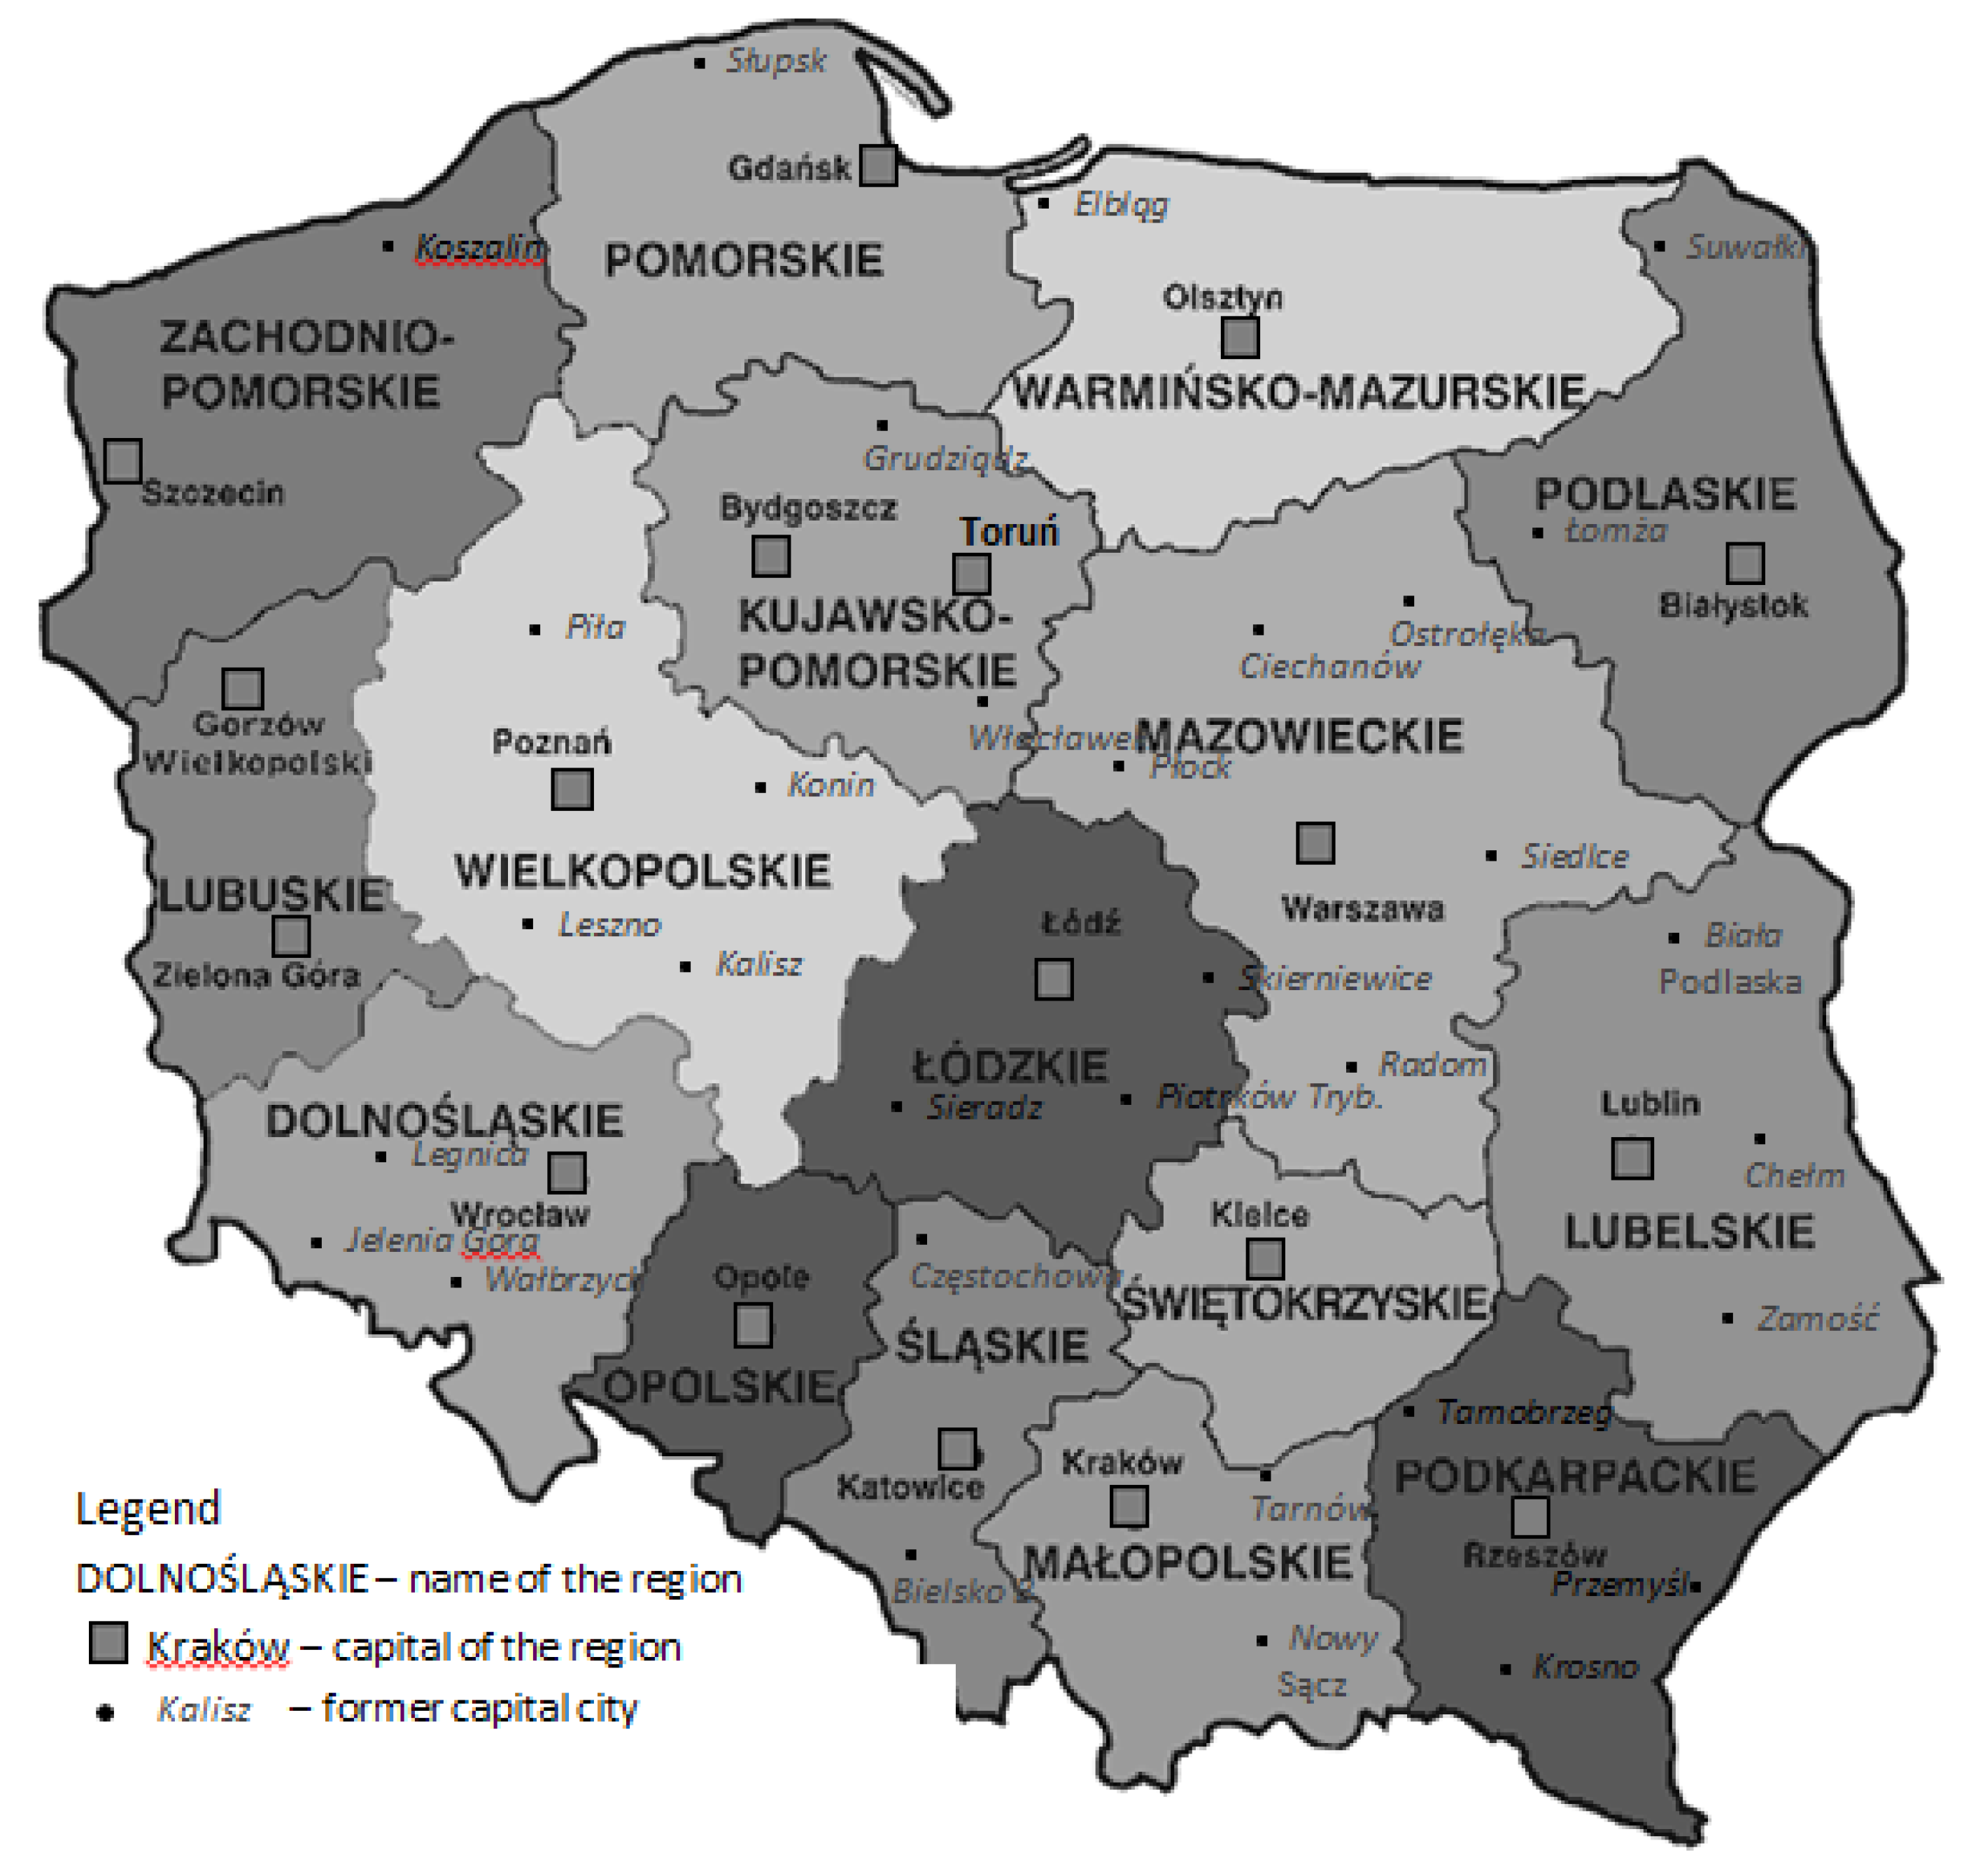
5], sixteen new voivodships were established in Poland, corresponding in size to the similar regional divisions of the European Union Member States. Simultaneously, in place of the existing forty nine voivodship capitals, only eighteen cities retained the capital functions as the voivodship cities. Fourteen of them, i.e., Białystok, Gdańsk, Katowice, Kielce, Kraków, Lublin, Łódź, Olsztyn, Opole, Poznań, Rzeszów, Szczecin, Warsaw, and Wrocław, also remain the seats of the voivodship governor and the headquarters of the voivodship local government. In two voivodships, these functions were separated. In Kujawsko-Pomorskie the voivodship city—Bydgoszcz is the seat of the voivodship governor, whereas Toruń hosts the headquarters of the voivodship parliament and the marshal’s office. A similar situation is true for Lubuskie voivodship: Gorzów Wielkopolski is the seat of the voivodship governor, while Zielona Góra hosts the headquarters of the local government bodies [
6]. In most cases, the new capitals had already played the functions of regional centres, hence the administrative changes justified such situation. In four cases, the establishment of voivodships resulted from a political consensus (Lubuskie, Kujawsko-Pomorskie voivodship, Świętokrzyskie voivodship, and Opolskie voivodship) (
Figure 1).
The purpose of the article is to determine the dynamics and to evaluate changes occurring in the labour market structure of larger Polish cities, including the division into voivodship cities (regional capitals) and the ones which lost this function as a result of the aforementioned reform covering the system of public administration. The conducted analysis is based on the hypothesis that the administrative transformations have a significant impact on the dynamics of changes in employment structure.
Such a formulated thesis is justified by a deep conviction followed in Poland that the administrative reform has contributed to significant changes in the labour market. The prevailing opinion presented in scientific studies and, above all, in the public debate is that the cities which have become the capitals of new voivodships strengthened their position at the expense of the centres which lost such functions. It is emphasized that these changes refer not only to the administrative services’ sector and the related migration of elites to the regional government centres. In the Polish model of development (investment) funds’ distribution, both political and administrative factors play a relatively large role at the regional level. The comparative advantage, resulting from the regional capital function, can, therefore, be manifested by a greater political power of these centres in competing for such funds. The characteristic feature of the analysed period is the fact that almost half of the investments carried out in cities were based on grants from the European Union funds [
7]. The volume of these funds was significant enough to have an extensive impact on the process of cities’ modernization and their economic changes. This, in turn, should be reflected in the labour market transformations.
The authors are trying to demonstrate, in the presented below subject literature review, that the aforementioned cause and effect relationship is well established in the literature (and even considered a dogma in socio-political debates). Despite that, however, the authors have made an attempt to verify this thesis. In our opinion, strengthening the position of new voivodship capitals is more the result of an unbalanced and polarizing development of the country, in which larger economic centres play an increasingly important role, at the expense of smaller cities’ peripheralisation. This trend coincides with the European-wide processes and keeps advancing in spite of the administrative changes. It should be highlighted that in the Polish tradition the capital functions are always played by the largest city in the region (as opposed to, for example, state capitals in the U.S.).
The study takes into account all current and 28 out of 31 former regional capitals. Former voivodship capitals, which did not receive the status of cities with county rights (Ciechanów, Piła, and Sieradz), were excluded from the study. Therefore, the scope of statistical data, collected for them by the Central Statistical Office [
8], referring to the labour markets is much narrower.
The data from 2005 and 2016 were used in the research, which allowed determining changes in this period of time interval. The choice of this time range is justified by the date of Poland’s accession to the EU (1 May 2004) followed by the dynamic economic growth of the country. In 2016, Polish GDP based on the estimates of the World Bank amounted to USD 4695 billion against USD 3061 billion in 2005. The value of export more than doubled, from USD 893,881 million in 2005 to USD 2,050,477 million in 2016. At the same time, gross real disposable income in the household sector in 2016 accounted for 143.9% of the value in 2005 [
9]. It seems that the ongoing development processes should be accompanied by the adjustment processes taking place on the labour market. The study was carried out using the Bray-Curtis measure. An attempt was also made to determine the relationship between the level of salaries increase in the analysed cities and the transformations occurring on the labour market measured by the Bray-Curtis measure.
2. Theoretical Background and the Outline of Existing Research
The role of capital centres is emphasized in many classical theories of regional development. The problem of the rank of cities in a hierarchical system occupies the central position in the classical Christaller’s central place theory. According to this concept central cities have administrative and political goods at their disposal, which determine their higher position in the structure of the settlement system. These external functions are manifested through their higher dynamics of development [
10]. Also the economic base theory emphasizes the role of administrative functions, primarily at higher hierarchical levels. They are included among the exogenous components of urban economy, constituting an element of the economic base influencing a city’s position in relation to its environment, thus determining its development potential [
11]. A. Markusen, by developing A. Marshall’s theory of industrial districts, points to the model based on the dominant role of public administration. It is based on the regional political functions, resulting e.g., from the location of numerous state institutions (offices, military bases, universities, etc.). They generate public fund streams, which stimulate local economic situation. Among the examples of such regions the following may be listed: capital areas, e.g., Washington, military industry centres located around Santa Fe, San Diego and Colorado Springs in the United States [
12]. Finally, the influence of administrative functions on the economic development of cities is explained on the basis of growth poles theory. The subsequent modifications of Perroux’s concept on motor units polarizing space and stimulating development processes included e.g., administration and management centres [
13]. All the aforementioned concepts highlight the importance of the administrative function in the processes of economic development.
Against this background it is worth paying attention to the slightly different concepts which indicate that capital functions derive from the higher dynamics of urban development and not vice versa. In this sense, the city’s centrality usually results from the achieved socio-economic position [
14]. Finally, there are also studies which question the causative nature of public administration influencing the dynamics of regional development [
15].
A good summary of the potential factors having impact on the competitive advantage of capital cities was presented, in Polish subject literature, by A. Kurniewicz and P. Swianiewicz [
16]. Attention was paid to direct factors (jobs in voivodship institutions, higher availability and quality of administrative services, and decision-making centre) and also to indirect ones (prestige of the capital city and symbolic attractiveness of the city). Therefore, the voivodship rank may affect the investment attractiveness and constitute the factor of urban development.
The subject literature offers many examples of research covering impacts of city status changes on the trajectories of economic development. It is worth quoting the research conducted by R.G. Caroll and J. Meyer [
17]. On the capitals of American states (which were usually located in small, peripheral cities—e.g., Albany, NY or Sacramento, CA). The research carried out by L. Ma [
18] focused on the impact of administrative changes in Chinese conditions, whereas the case of changes in political functions of German cities was analysed by K. Dascher [
19].
In Poland, as it has already been mentioned in the introduction, the 1999 administrative reform resulted in the relatively large literature discussing the functioning and development of former voivodship cities. This phenomenon was analysed both in terms of quality, from the perspective of residents’ and decision-makers’ opinions, and in quantitative terms, taking into account socio-economic characteristics. The problem was discussed by many authors [
17,
20,
21,
22,
23,
24,
25,
26,
27].
The research results generally present two different pictures of the analysed phenomenon. The first is the high degree of degradation in the cities which lost their voivodship status (in the subjective opinions expressed by the respondents). As mentioned earlier, these views have gained the leading status in Polish scientific debate (as well as public debate). A different picture is, however, developed by the research based on objective economic characteristics. It confirms the image of changes resulting from non-administrative reasons. In turn, unlike the previous approach, this point of view is not popular in the carried out scientific discussions. It should also be emphasized that quantitative analyses of the relationship: the loss of the city status—changes in the employment structure have been not conducted in Poland as yet, despite the fact that in social studies the loss of jobs is indicated as the main result of changes in the city function. Our study follows the trend of analyses based on statistical characteristics covering the objective changes in employment structure. From this perspective it is the first approach to the problem which may supplement the ongoing debates in this respect.
3. Research Method
The presented study adopts that the employment structure is illustrated by the percentage of employment in five groups of sections according to Polish Statistical Classification of Economic Activities (PKD 2007 Section A covers employment in agriculture, forestry, hunting and fishing and can stand for the entire agricultural sector. The group of Sections B–F refers to industry and construction—industry sector. According to the data collection system of the Central Statistical Office the service sector was divided into three components. The grouped Sections G–J represent trade; repair of motor vehicles; transport and storage management; accommodation and catering; information and communication (Services I). Sections K–L cover financial and insurance activities; real estate market services (Services II), while the group M–U includes other services, covering e.g., education, health care and social aid, public administration and national defence; obligatory social security (Services III). It is noticeable that in Polish conditions the latter group includes the majority of non-market services [
1].
The research does not include shadow economy workers. On the basis of the Central Statistical Office studies it was established that for the majority of the employed, an informal employment was of short-term nature: a statistical employee of this labour market segment worked there, in 2010, for only 47 days, i.e., about two months. According to B. Gawrońska-Nowak, J. Konieczna-Sałamatin [
28] also J. Fundowicz et al. [
29], in the light of these data it is difficult to approach the grey zone as a viable alternative to the registered employment. This explains, to an extent, the methodology adopted in the study and does not distort the obtained research results.
The Bray-Curtis measure was used to analyse transformations in employment structure.
The comparative analyses of structure similarity measures, carried out by E. Wędrowska [
30] show that the selected coefficient, due to the data set double standardization, remains one of the most resistant to high and low-value components’ hypersensitivity. High usefulness of the Bray-Curtis measure to assess changes in employment structure was more extensively justified by M. Markowska [
31].
If it is adopted that the numerical form of employment structure in a given object, in line with the groups of PKD 2007 sections, takes the form of a vector:
where:
—employment share in the first section grouping in t moment (years), in k-th object k = 1, …, K,
—employment share in the second section grouping in t moment (years), in k-th object k = 1, …, K,
—employment share in the third section grouping in t moment (years), in k-th object k = 1, …, K,
—employment share in the fourth section grouping in t moment (years), in k-th object k = 1, …, K,
—employment share in the fifth section grouping in t moment (years), in k-th object k = 1, …, K,
the elements of which meet the dependence:
the Bray-Curtis measure evaluating changes of vector elements’ value (1) in
k-th object (city) at two different moments
t = 1.2 takes the following form:
then:
Close to zero values of the Bray-Curtis measure can be evaluated as slight transformations in employment structure in the grouped sections of PKD 2007 in a given object, in two compared periods (years). Measure values close to one reflect significant changes in employment structure [
32].
Four groups of cities, characterised by a similar level of the analysed transformations, were separated using two parameters of the Bray-Curtis measure, i.e., the arithmetic mean and the standard deviation. The following class intervals (groups) were distinguished:
class A (the highest level of changes):
class B (medium higher level of changes):
class C (medium lower level of changes):
class D (lower level of changes):
where:
—Bray-Curtis measure value in k-th object (city),
—arithmetic mean of Bray-Curtis measures for objects,
—standard deviation of Bray-Curtis measures for objects.
In the course of the research procedure the following hypotheses were verified using Mann-Whitney U test:
Hypotheses 0 (H0). The level of changes in employment structure is the same in voivodship cities and in former voivodship cities.
Hypotheses 1 (H1). The level of changes in employment structure is different for the group of voivodship cities and former voivodship cities.
Mann-Whitney U test is used to verify the hypothesis about the irrelevance of differences between mean values of the studied variable in two populations, having adopted that the variable distributions remain close [
33,
34].
The sectoral structure of employment was adopted as the key dependent variable in the study. Therefore, it was checked whether there were any cause-and-effect relationships of this variable and other possible factors. It was verified how the dynamics of salaries, changes in employment levels and also the dynamics of residents’ occupational activity affect its course. The correlation strengths of these relationships were examined using the Spearman’s rank correlation coefficient. This correlation takes numerical values in the closed interval from −1 to +1. If rS = 0, then the ranks are linearly uncorrelated (no correlation of characteristics). If rS = 1 then for the measurable characteristics a full positive functional linear correlation occurs, rS = −1 stands for full negative linear function correlation. The following scale was used to evaluate the strength of correlations between variables:
|0.00–0.3|—weak correlation,
|0.31–0.6|—moderate correlation,
|0.61–1.0|—strong correlation [
35].
4. Research Results
Table 1 presents the shares of employment in the grouped sections of PKD 2007 in Polish voivodship cities and former voivodship cities in the years 2005–2016. The centres which retained the status of regional capitals are marked in grey. It can be noticed that both in 2005 and in 2016 the service sector was better developed than the industry sector, its share in both groups of cities was growing and the dynamics of this process was higher than in the entire Poland. It is worth highlighting the significant and growing importance of Services III dominated, as already mentioned, by non-market services. In the group of regional capitals these shares were, on average, higher and their growth was more dynamic than in the cities deprived of the capital status. It may result from accumulating the central functions in regional capitals (sucking out their former voivodship cities) and the associated extension of the bureaucratic apparatus. In the analysed time cross-section (2005–2016), in the group of voivodship cities, Services I gained importance against the industry sector. In 2005, in eight out of 18 voivodship cities, the industry sector dominated over Services I, in 2016 such situation was observed in three cities only (Bydgoszcz, Gorzów Wlkp., and Kielce). The situation was completely different in the group of former voivodship cities. In 2005, the importance of industry against Services I was lower only in two cities—to a very small extent in Biała Podlaska and Zamość. In 2016, in Biała Podlaska, Zamość and additionally in Chełm, Łomża, and Przemyśl (five out of 28 cities). The group K-L (Services II) supplemented the economic landscape of cities, however, in none of the cities it had any significant importance. Its rank was most visible in Warsaw, where in 2016 they almost balanced the importance of industry sector.
Based on the data from
Table 1, using the Equation (3), the changes occurring in employment structures in the analysed cities were measured. The values of calculated Bray-Curtis measures are presented in
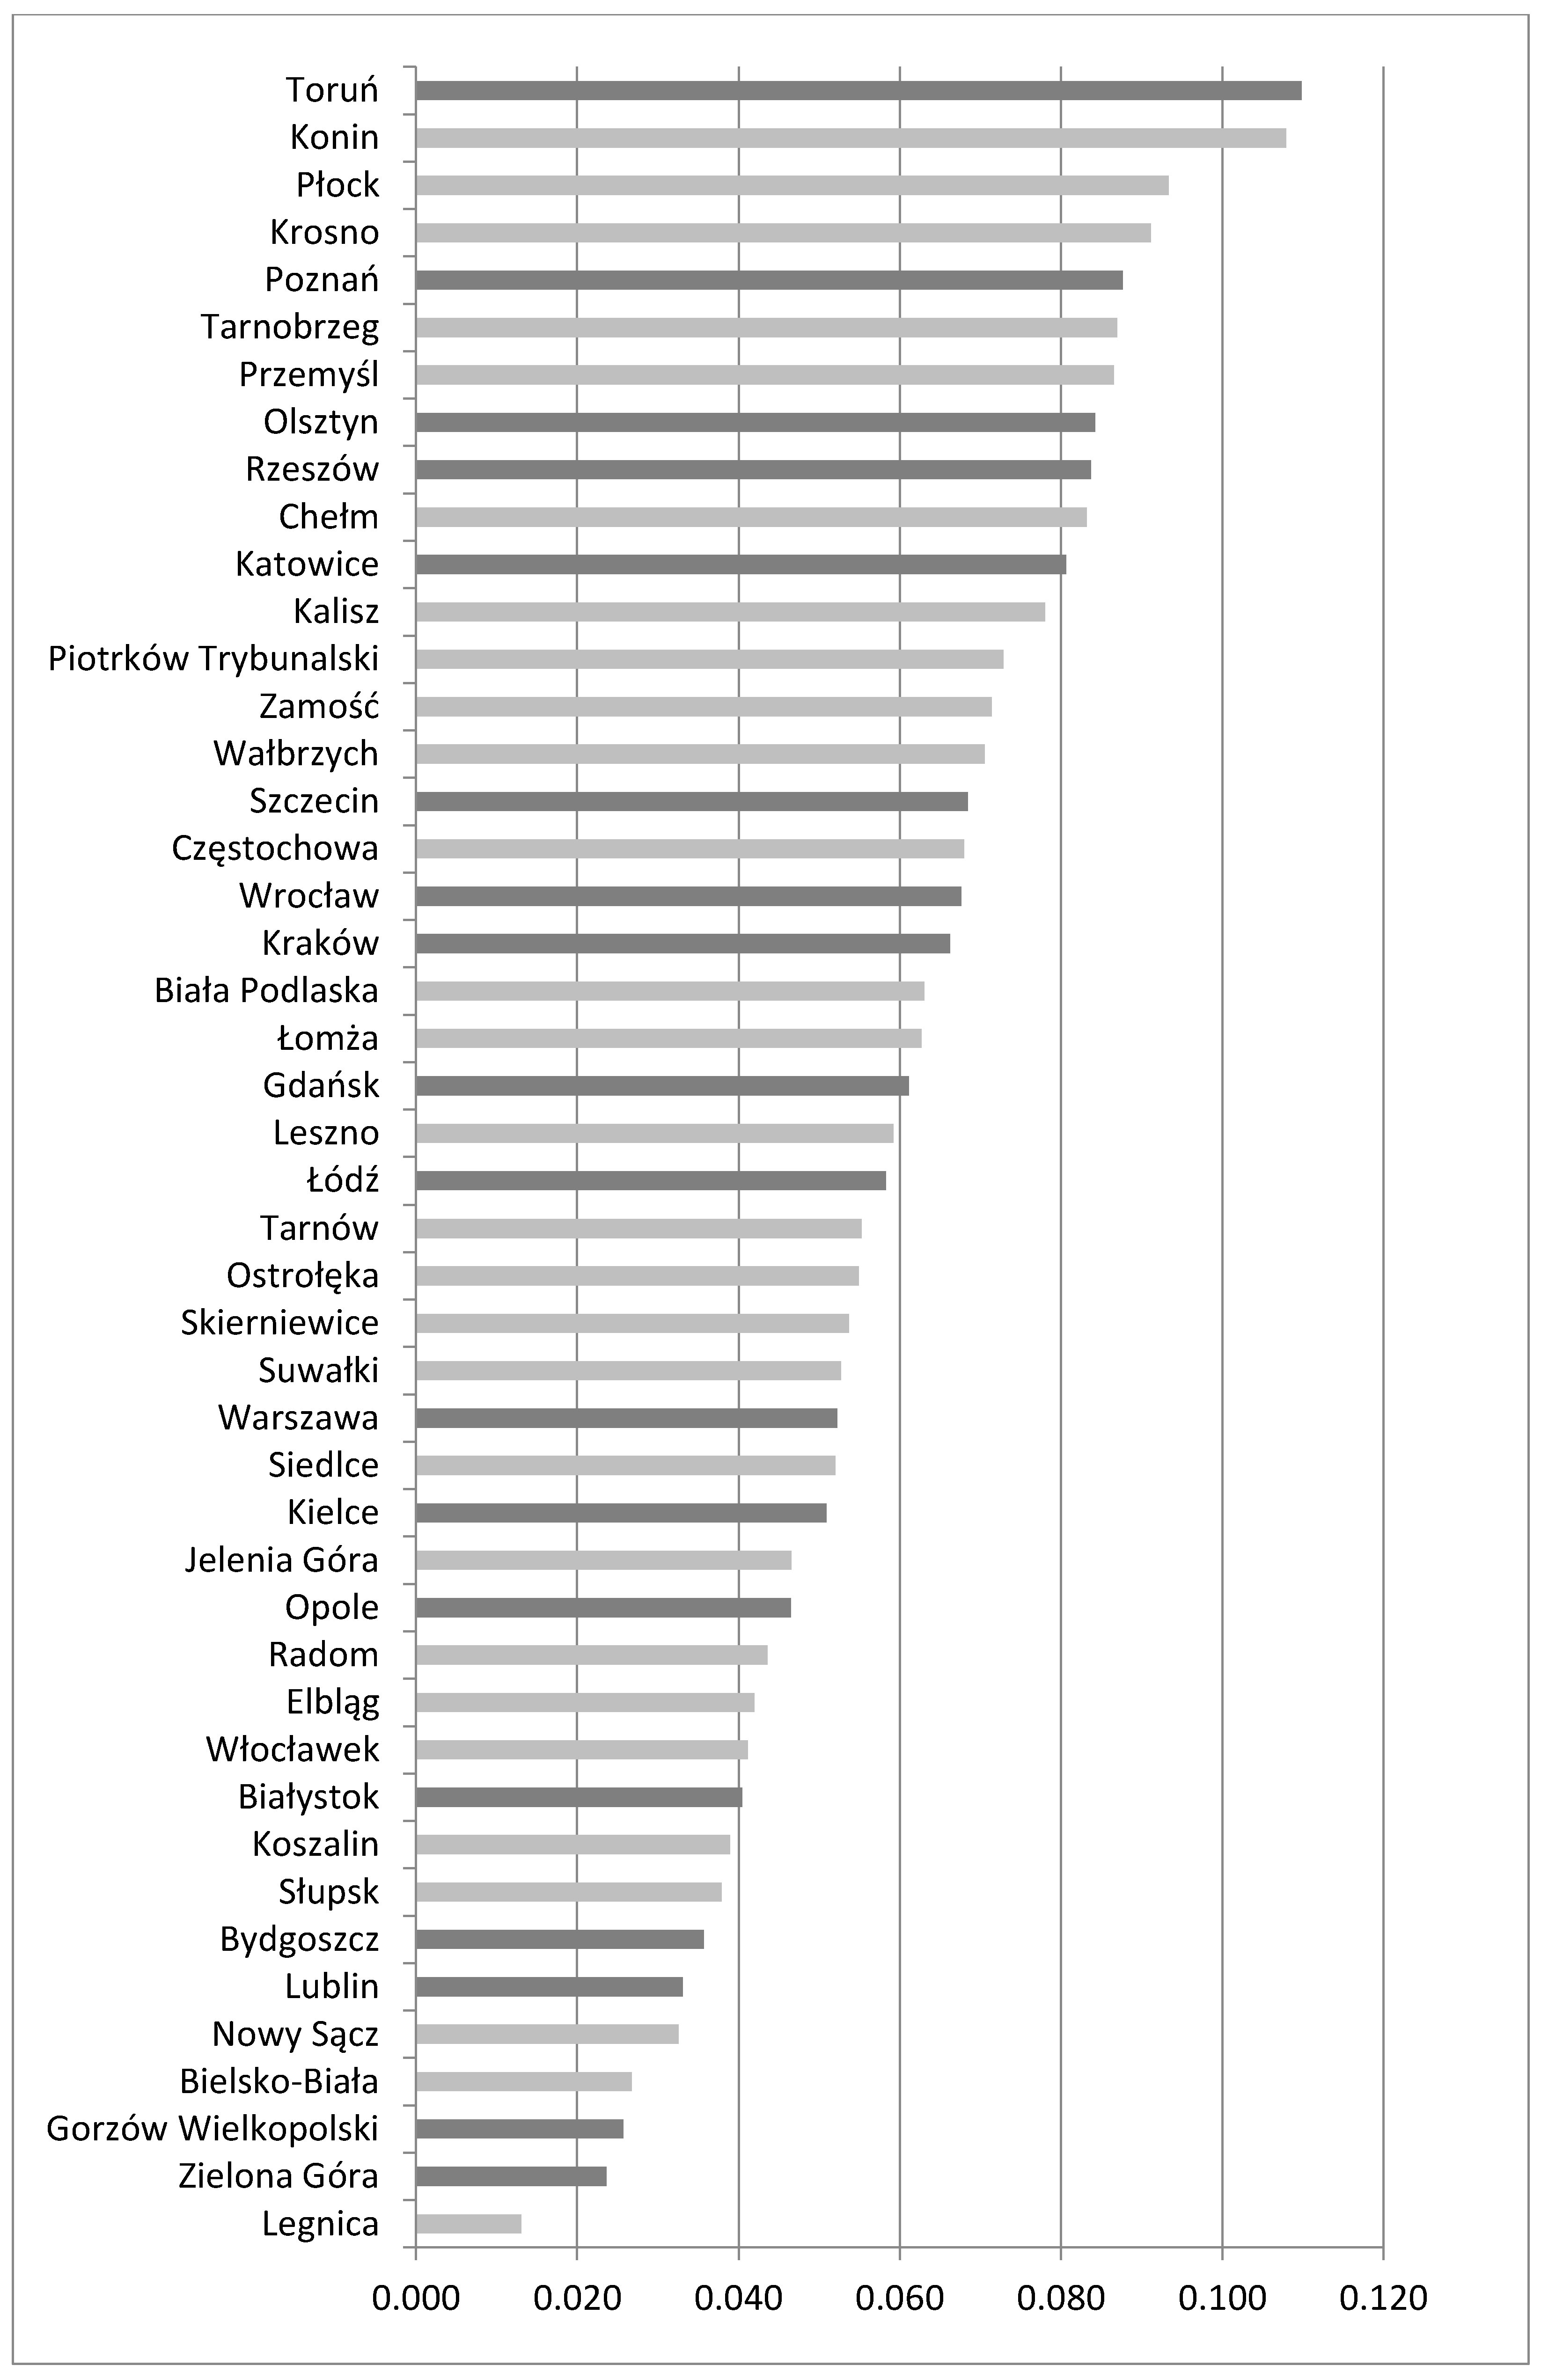
Table 2. The value for Poland was 0.037. In addition, four groups of cities, characterised by the similar structural changes, were separated. A graphical presentation was used to illustrate better the values of Bray-Curtis measures (
Figure 2). The darker colour distinguishes these cities which retained the function of voivodship capitals, whereas bright columns stand for cities which lost this function.
The significant diversification is well visible—the measure value for Toruń is 0.110, whereas for Legnica 0.013 (
Figure 2).
It is worth emphasizing that the majority of analysed cities were characterised by a higher value of the Bray-Curtis measure, and thus more dynamic transformations of the labour market structure, than the average value characteristics for the entire country, which amounted to 0.037. Only the cities qualified for group D (7 out of 46) were characterised by a lower value than the one for Poland.
Class A, relatively small (Toruń, Konin, Płock, Krosno, Poznań, Tarnobrzeg, Przemyśl, Olsztyn, Rzeszów, and Chełm), includes cities characterised by the highest range of employment structure changes (arithmetic mean of the measures in this class was 0.092, with the variation of 10.1%).
Class B—the measure value ranging from 0.061 to 0.081, the variation at the level of 8.3%—is formed by 12 cities (Katowice, Kalisz, Piotrków Trybunalski, Zamość, Wałbrzych, Szczecin, Częstochowa, Wrocław, Kraków, Biała Podlaska Łomża, and Gdańsk). The cities qualified for this group were dispersed throughout the country and not characterised by any clear territorial rule.
The third and the most numerous class C is formed by 17 cities, for which the average level of structural changes measure was lower than in group A and B and amounted to 0.049. The coefficient of variation presented the level of 13.8%.
A separate and the least numerous class D consists of Bydgoszcz, Lublin, Nowy Sącz, Bielsko-Biała, Gorzów Wielkopolski, Zielona Góra, and Legnica. In these cities, in the analysed years, the smallest changes were recorded in the form of the analysed structures, this group is also characterised by the highest intra-group diversification—variation at the level of 26.1%.
Group A, featuring the most extensive changes in employment structure, covers both the cities which retained the functions of regional capitals (4) and the ones which lost it (6). It may indicate that the reason for structural changes does not result from the administrative reform only. A deeper analysis leads to the conclusion that the basic reason was the relatively rapid deindustrialization process in these cities. While in the entire Poland the percentage of employment in industry and construction declined in the discussed period (2005–2016) by 2.5 percentage points, in the cities from group A the dynamics was significantly higher, reaching in the case of Toruń and Konin its maximum values for all analysed cities (decrease by 11 and 10.6 percentage points, respectively). In Toruń it resulted from the significant reduction in employment or even closing the light and chemical industry enterprises. In Konin, it was the effect of changes in the leading industry sectors (metallurgical and fuel-energy industries) and the liquidation of light industry factories. In both of these cities, the incurred losses were offset by the increased importance of service sector.
Interestingly, in the case of such cities as Tarnobrzeg, Chełm, and Przemyśl the decline in the share of industry occurred at the expense of the growing importance of sector I. This shift means the return of these centres, after the years of industrialization, to the role of serving the areas where agriculture and forestry constitute the basis of economy. This is a good example of the wider environment impact on the city structure development.
The two most numerous groups of cities (B and C), making up 63% of their total number, represent the group of centres and characterised by the relatively small changes. Attention should be paid to the internal diversification of these units—they cover both the largest Polish cities (Warsaw, Łódź, Kraków, Wrocław, and Gdańsk) and the smaller centres (Zamość, Biała Podlaska, and Piotrków Trybunalski). In both groups, the scope of changes was determined by their share decline in industry sector. However, a significant difference can be noticed in these industries which expanded their role in the employment structure. While in the largest cities it was the service sector which gained importance, in the case of smaller centres, this shift was also true for agriculture sector. In such cities as Zamość, Suwałki, Siedlce, Łomża, and Biała Podlaska it was even the main beneficiary of the occurred changes. All these units are located in eastern part of Poland, where the share of agriculture sector in economy structure is relatively larger. It can, therefore, be adopted that the nature of changes in employment structure of the analysed cities results from a more extensive economic context of a given region.
The final group of cities (D) is characterised by the highest stability of employment structure. It includes seven cities, of which only Bydgoszcz and Lublin can be classified in the group of large cities (355 and 340 thousand residents respectively), the remaining ones have less than 200,000 residents (the smallest Nowy Sącz: 84,000). Their common feature is their peripheral location of both the intensive modernization processes (visible in the largest metropolises) and the problem areas resulting from the transformation of old industry sectors. Thus, it seems that neither maintaining the status of the voivodship capital (four cities) nor its loss (three cities) was as significant in their case as the aforementioned geographic rent.
An attempt can be made to identify certain regularities in the spatial distribution of the discussed group of cities characterised by the largest transformations [
36,
37]. In some cities, located in eastern Poland, usually less developed, large changes in the employment structure have been observed, which may be caused by the EU funds allocated to the development of this part of the country. Cities usually take advantage of their opportunities differently, hence such diversity in this group of cities. The researched objects, presenting no significant changes, are located in southern and western Poland. Here, the dynamic changes in employment structure took place in the 90s and resulted from the systemic transformations. Since accessing the European Union structures the observed changes have been small, these cities have actually achieved a certain level of development and present a sufficient capacity to implement the extended administrative functions.
Based on the adopted significance level α = 0.05 and the Mann-Whitney U test result (p = 0.225), the hypothesis H0 stating that the level of changes in employment structure is the same in voivodship cities and former voivodship cities was verified positively. Even at the low level of error significance α = 0.01 there is no reason to reject the null hypothesis. The overall dynamics of changes in employment structure is the same in voivodship cities and in former voivodship cities. The average value of the Bray-Curtis measure is 0.0598 for the current voivodship cities and 0.0602 for the second group of cities.
In order to check whether the employment structure changes do not have any other cause-and-effect relationships, the correlations between changes in employment structure and the dynamics of salaries, the trajectory of employment level and changes in residents’ occupational activity were analysed.
To determine the strength of these relationships Spearman’s rank correlation coefficient between the listed characteristics and the Bray-Curtis measure value was used. Prior to that, the normality of variable distributions was negatively verified using the Shapiro-Wilk test, which determined the selection of the indicated correlation coefficient. As mentioned above, the Spearman’s rank correlation coefficient takes numeric values in the closed interval from −1 to +1. Since for the level of salaries the value rS = 0.13, it can be concluded that only a very weak, but positive relationship between these values does occur. Hence, the dynamics of changes taking place in the structure of labour market was not significantly related to the increase in salaries. It should be emphasized that the mean gross salary in the group of former voivodship cities was, in 2016, much lower than in the current voivodship capitals (PLN 3769 and PLN 4435 respectively, which corresponds to USD 1101.6 and USD 1229.3 at the average exchange rate of the National Bank of Poland as of 2018-03-16). Simultaneously, in the period 2005–2016 in both groups, mean gross salaries increased significantly, however, to a lesser extent in the group of former voivodship cities (by PLN 1596 and PLN 1822, which corresponds to USD 466.5 and USD 532.5). It may be assumed that other factors apart from the studied changes in the labour market structure were responsible for the occurred phenomenon (e.g., size, location, economic base, and economy structure of the analysed cities).
The Spearman’s rank correlation coefficient between the total employment dynamics and the Bray-Curtis measure value is −0.373, so there is a moderate negative correlation between these values. Thus, the dynamics of employment cannot explain the changes occurring in economic structure and the correlations between these variables are different than in the case of salary increase. Also the relationship between the dynamics of workplaces and the status of cities is different than in the case of employment structure dynamics.
The analyses indicating that the growth of total employment is strongly correlated with the increase in the economic activity coefficient (rS = 0.75) are an interesting supplement to the study. This relationship is primarily developed by the jobs generated in services (rS = 0.80). A reverse situation occurs in the cities characterised by the highest dynamics of jobs in the agricultural sector (Section A), where it is insignificantly related to the decline in occupational activity (rS = −0.16). Therefore, it can be cautiously assumed that the reagrarisation of cities is of defensive nature, resulting primarily from deindustrialisation rather than the loss of the voivodship capital status (and the related deservitization).
5. Conclusions
In numerous studies and documents the territorial organization reform of Poland carried out in 1998 is perceived, on the one hand, as the stimulant for the development of these cities which retained the status of voivodship centres and become the capitals of much larger regions, and on the other as a destimulant of these cities development which lost this status.
The hypothesis built on this basis, i.e., administrative changes have a significant impact on the dynamics of transformations in employment structure, has, however, not been confirmed in our research. The results presented in this article did not show any significant differences in the dynamics and nature of changes in labour market structure between the group of cities functioning as regional capitals and those which, as a result of the public administration system reform, lost this function. The conducted classification of the dynamics of changes in employment structure has shown that the capital cities and those deprived of this function jointly fill all distinguished categories. Meanwhile, contrary to expectations, it essentially was not determined by employment changes in the non-market services sector (most vulnerable to administrative changes), but the declining share of employment in industry (deindustrialisation). It results from both the systemic transformations initiated in 1989 and the accession to the European Union in 2004. The process of moving industry outside cities is a common phenomenon, which had already been observed before in Western European countries.
In general terms, the sector of market services benefited the most from such situation in the nationwide scale. While in the largest agglomerations the service sector was the only beneficiary of structural changes, in the case of medium-sized cities these changes were more balanced. All sectors, other than industry, gained importance. In more in-depth analyses the regional context significance was also demonstrated in the conducted research. An example here is the specific process of cities reagrarisation in eastern regions, where agriculture and forestry remain relatively important in economy structure. It can be hypothesized that the impact of the location context (and the regional background) on the trajectory and dynamics of city development is more significant than the administrative status changes. The verification of this assumption seems to be an interesting research direction. The authors intend to develop these analyses using methods of spatial data analysis (more about it in Explanations and Future Research at the end of the article).
In the light of our results, it seems that the opinions about major importance of administrative reform in the trajectory of cities’ economic development may have the nature of a typical folk hypothesis. Attributing the experienced difficulties to the voivodship status loss, so strongly formulated in qualitative research, remains a may be a subjective feeling, having no strong confirmation in changing the values of objective social and economic indicators.
It is worth emphasizing that our results go along with the effects of other research based on quantitative characteristics. In particular, the ones carried out by D. Krysiński [
25] and A. Kurniewicz and P. Swianiewicz [
16]. They also showed that, contrary to the prevailing social perception, the administrative reform did not contribute to the significant changes in economic indicators of the cities which lost their capital functions. In the authors’ opinion, the “sense of injustice” in these cities, confirmed by social research, may be approached as the equivalent of the medical phenomenon referred to as “phantom pain”. It turns out that the current capitals, already before the reform, were characterised by the evidently higher dynamics of development than the cities similar in size, which lost this status.
To sum up, it seems that for the significant part of voivodship cities, the 1998 administrative reform did not constitute an obstacle for further development. In Polish conditions and at the voivodship level, the role of public sector in market economy does not seem as large as it is commonly attributed. It may result from the inertia of views going back to the socialist era, when the public sector created economic reality at every level. The actual reasons underlying economic difficulties in some former voivodship cities cannot be reduced to the effects of the reform itself. They may result, to a much greater extent, from deindustrialisation processes primarily attributed to the regression of the declining industry sectors [
38]. It, in turn, results in the process of economic polarization caused by the attracting power of the most powerful economic centres. This leads to the effect of the main metropolises “pulling off” from the less developed areas. The effect of the increasing development gap between the regional centres and their peripheries has been diagnosed in many regional studies and does not appear to be just the Polish or European specificity [
39]. These phenomena can be explained based on G. Myrdal’s regional polarization theory, or the core-periphery concept by J. Friedmann [
5].


