Estimating the Blue Water Footprint of In-Field Crop Losses: A Case Study of U.S. Potato Cultivation


Abstract
1. Introduction
2. Materials and Methods
2.1. System Boundary and Definitions
2.2. Data Sources and Limitations
2.2.1. USDA NASS Survey Data
- = Average pre-harvest agricultural potato losses (tonnes) based on NASS loss estimate by state (s), 2012–2016
- = Acres planted estimate from NASS by state (s), average value 2012–2016
- = Acres harvested estimate from NASS by state (s), average value 2012–2016
- = Yield per acre estimate from NASS by state (s), average value 2012–2016
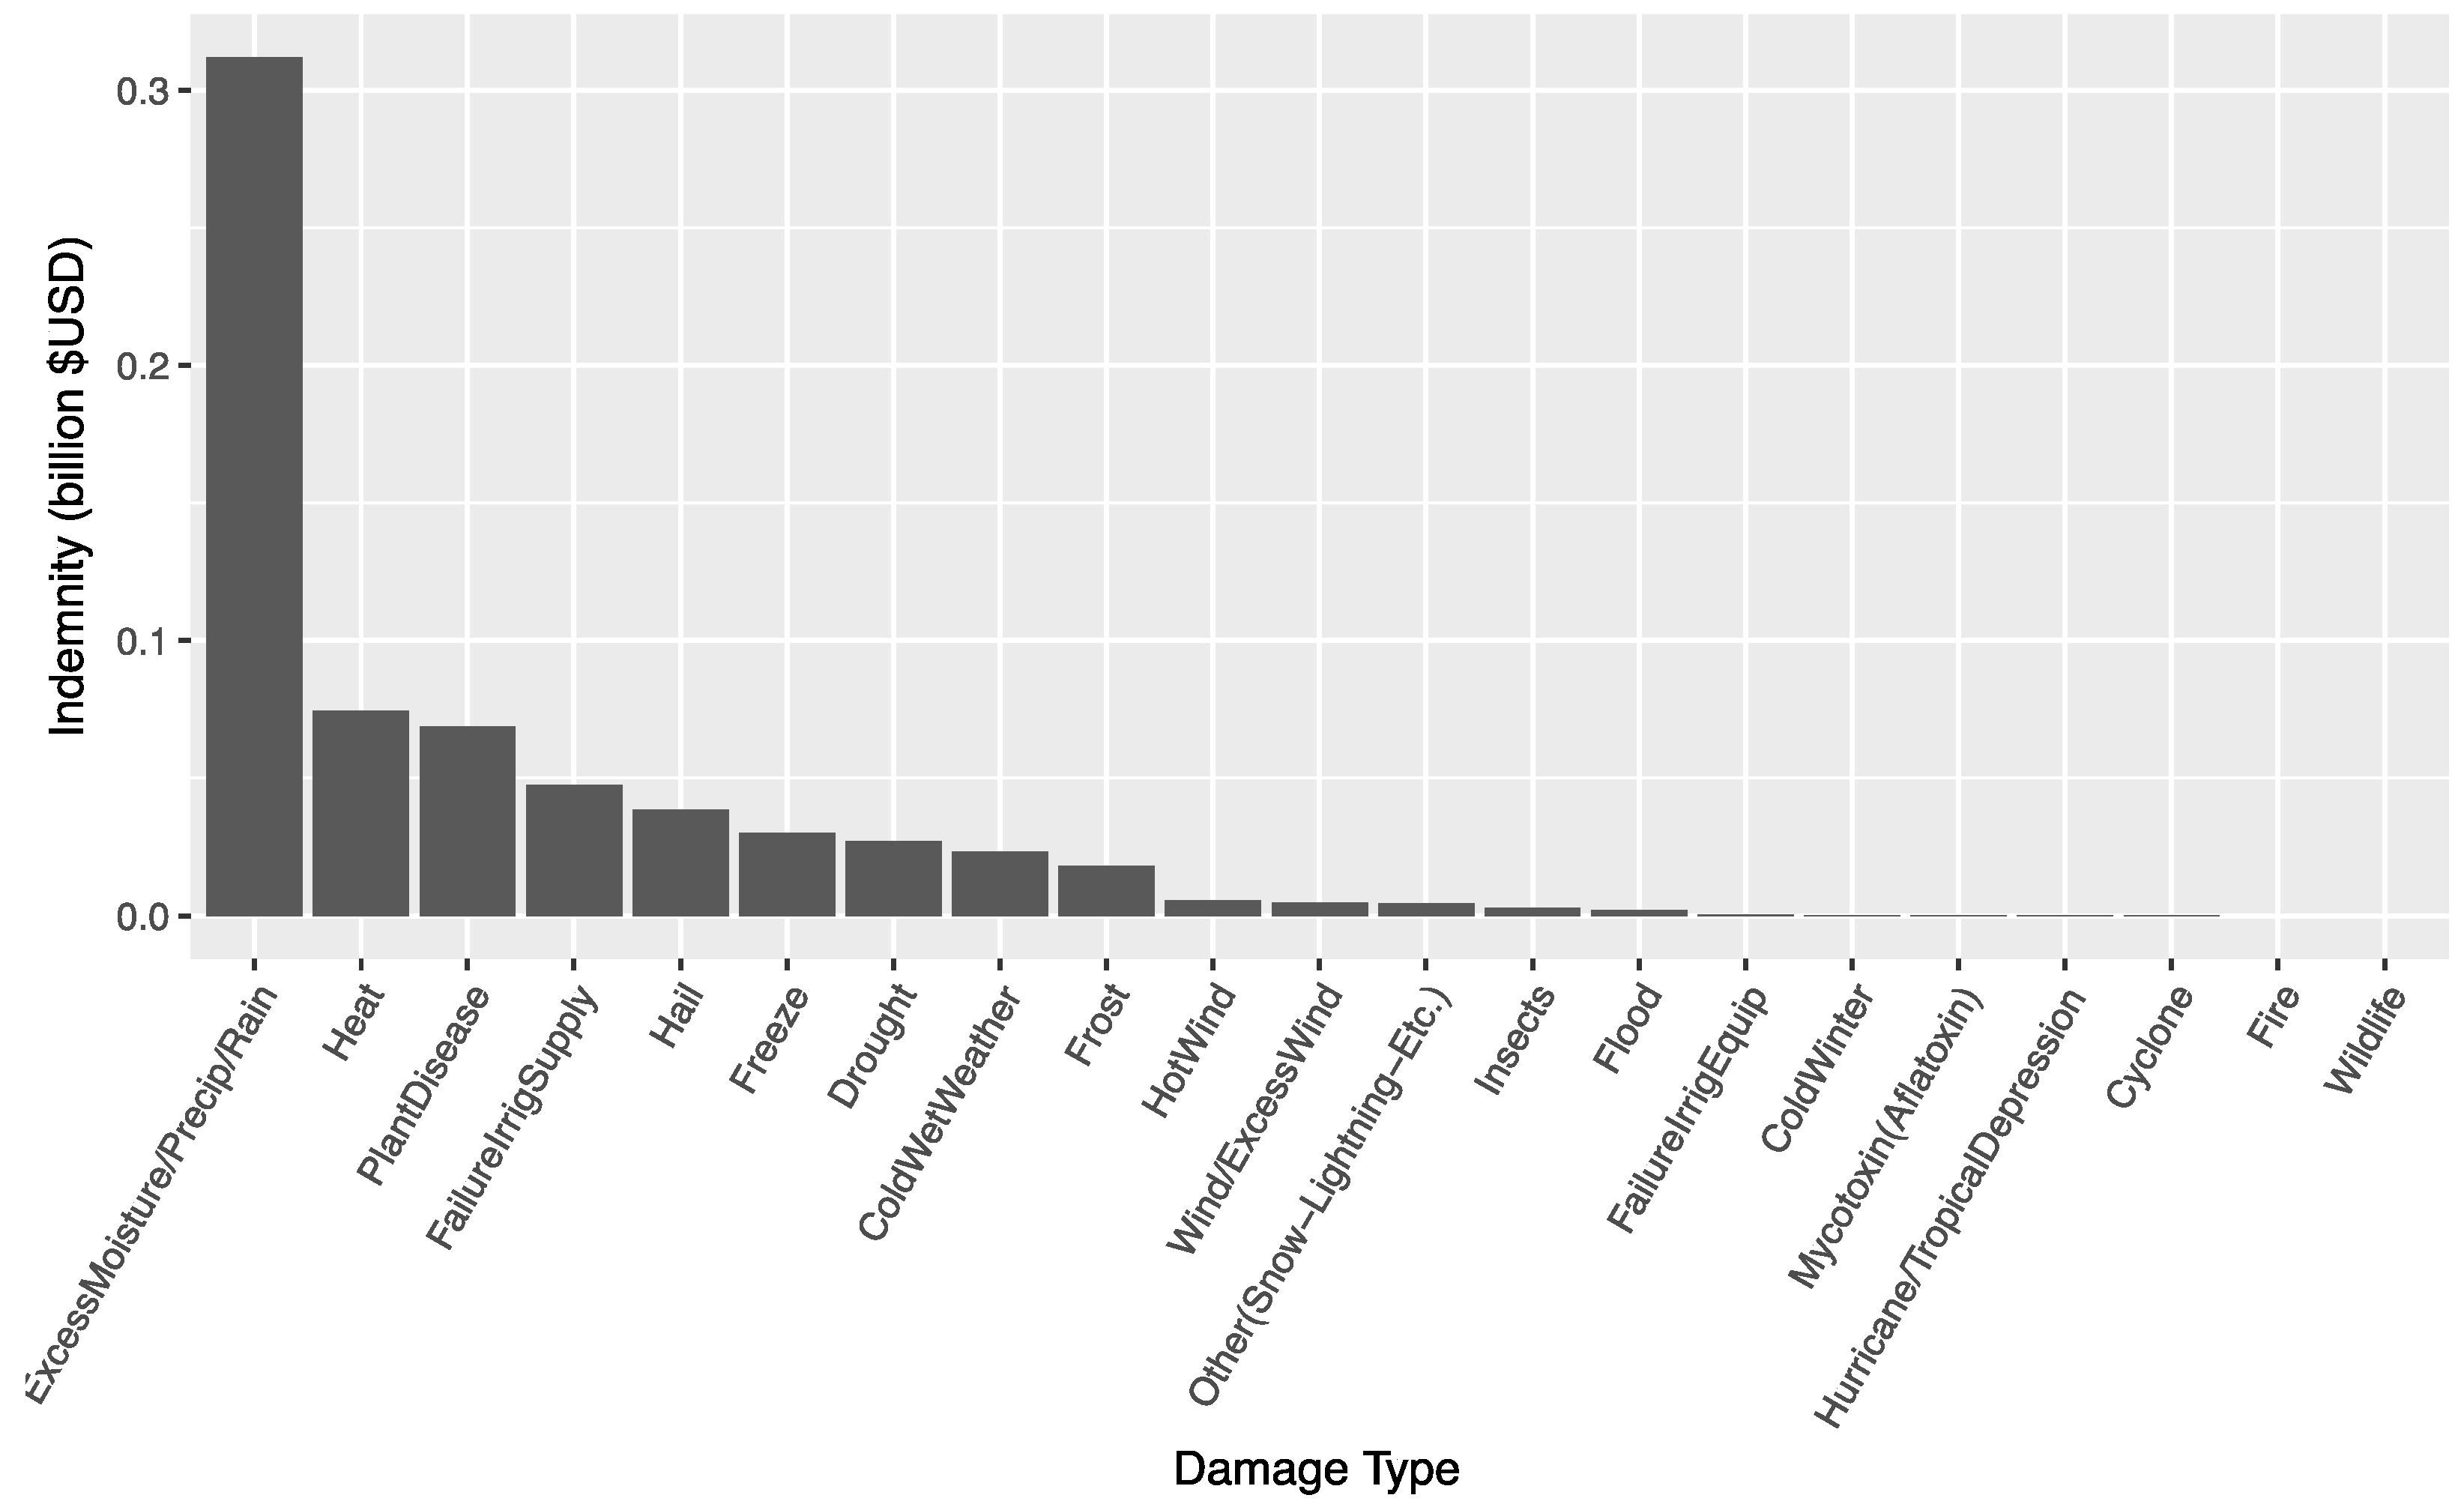
2.2.2. USDA RMA Data
- = Average relative agricultural potato losses based on RMA losses estimate by state (s) and damage type (d), 2012–2016
- = Average acreage of potato losses from the RMA data, 2012–2016, by state (s) and damage type (d)
- = Average potato acreage harvested from RMA-insured farms, 2012–2016, by state (s)
- = Imputed average acreage of potato losses by state (s) and damage type (d), 2012–2016
2.2.3. NASS Objective Yield Survey
- = Average total potato losses (tonnes) at harvest by state (s), 2012–2016
- = Average measured losses (tonnes/acre) at harvest from the NASS OY survey by state (s), 2012–2016
2.2.4. Water Use Data: USDA NASS
2.3. Estimating the Blue Water Footprint of Potato Losses
- = Average blue water footprint of pre-harvest potato losses (tonnes) by state (s), 2012–2016
- = Water applied per tonne of potatoes produced on irrigated acres, 2012
- = Irrigated acres harvested by state (s), 2012
- = Average blue water footprint of harvest potato losses (tonnes) by state (s), 2012–2016
3. Results and Discussion
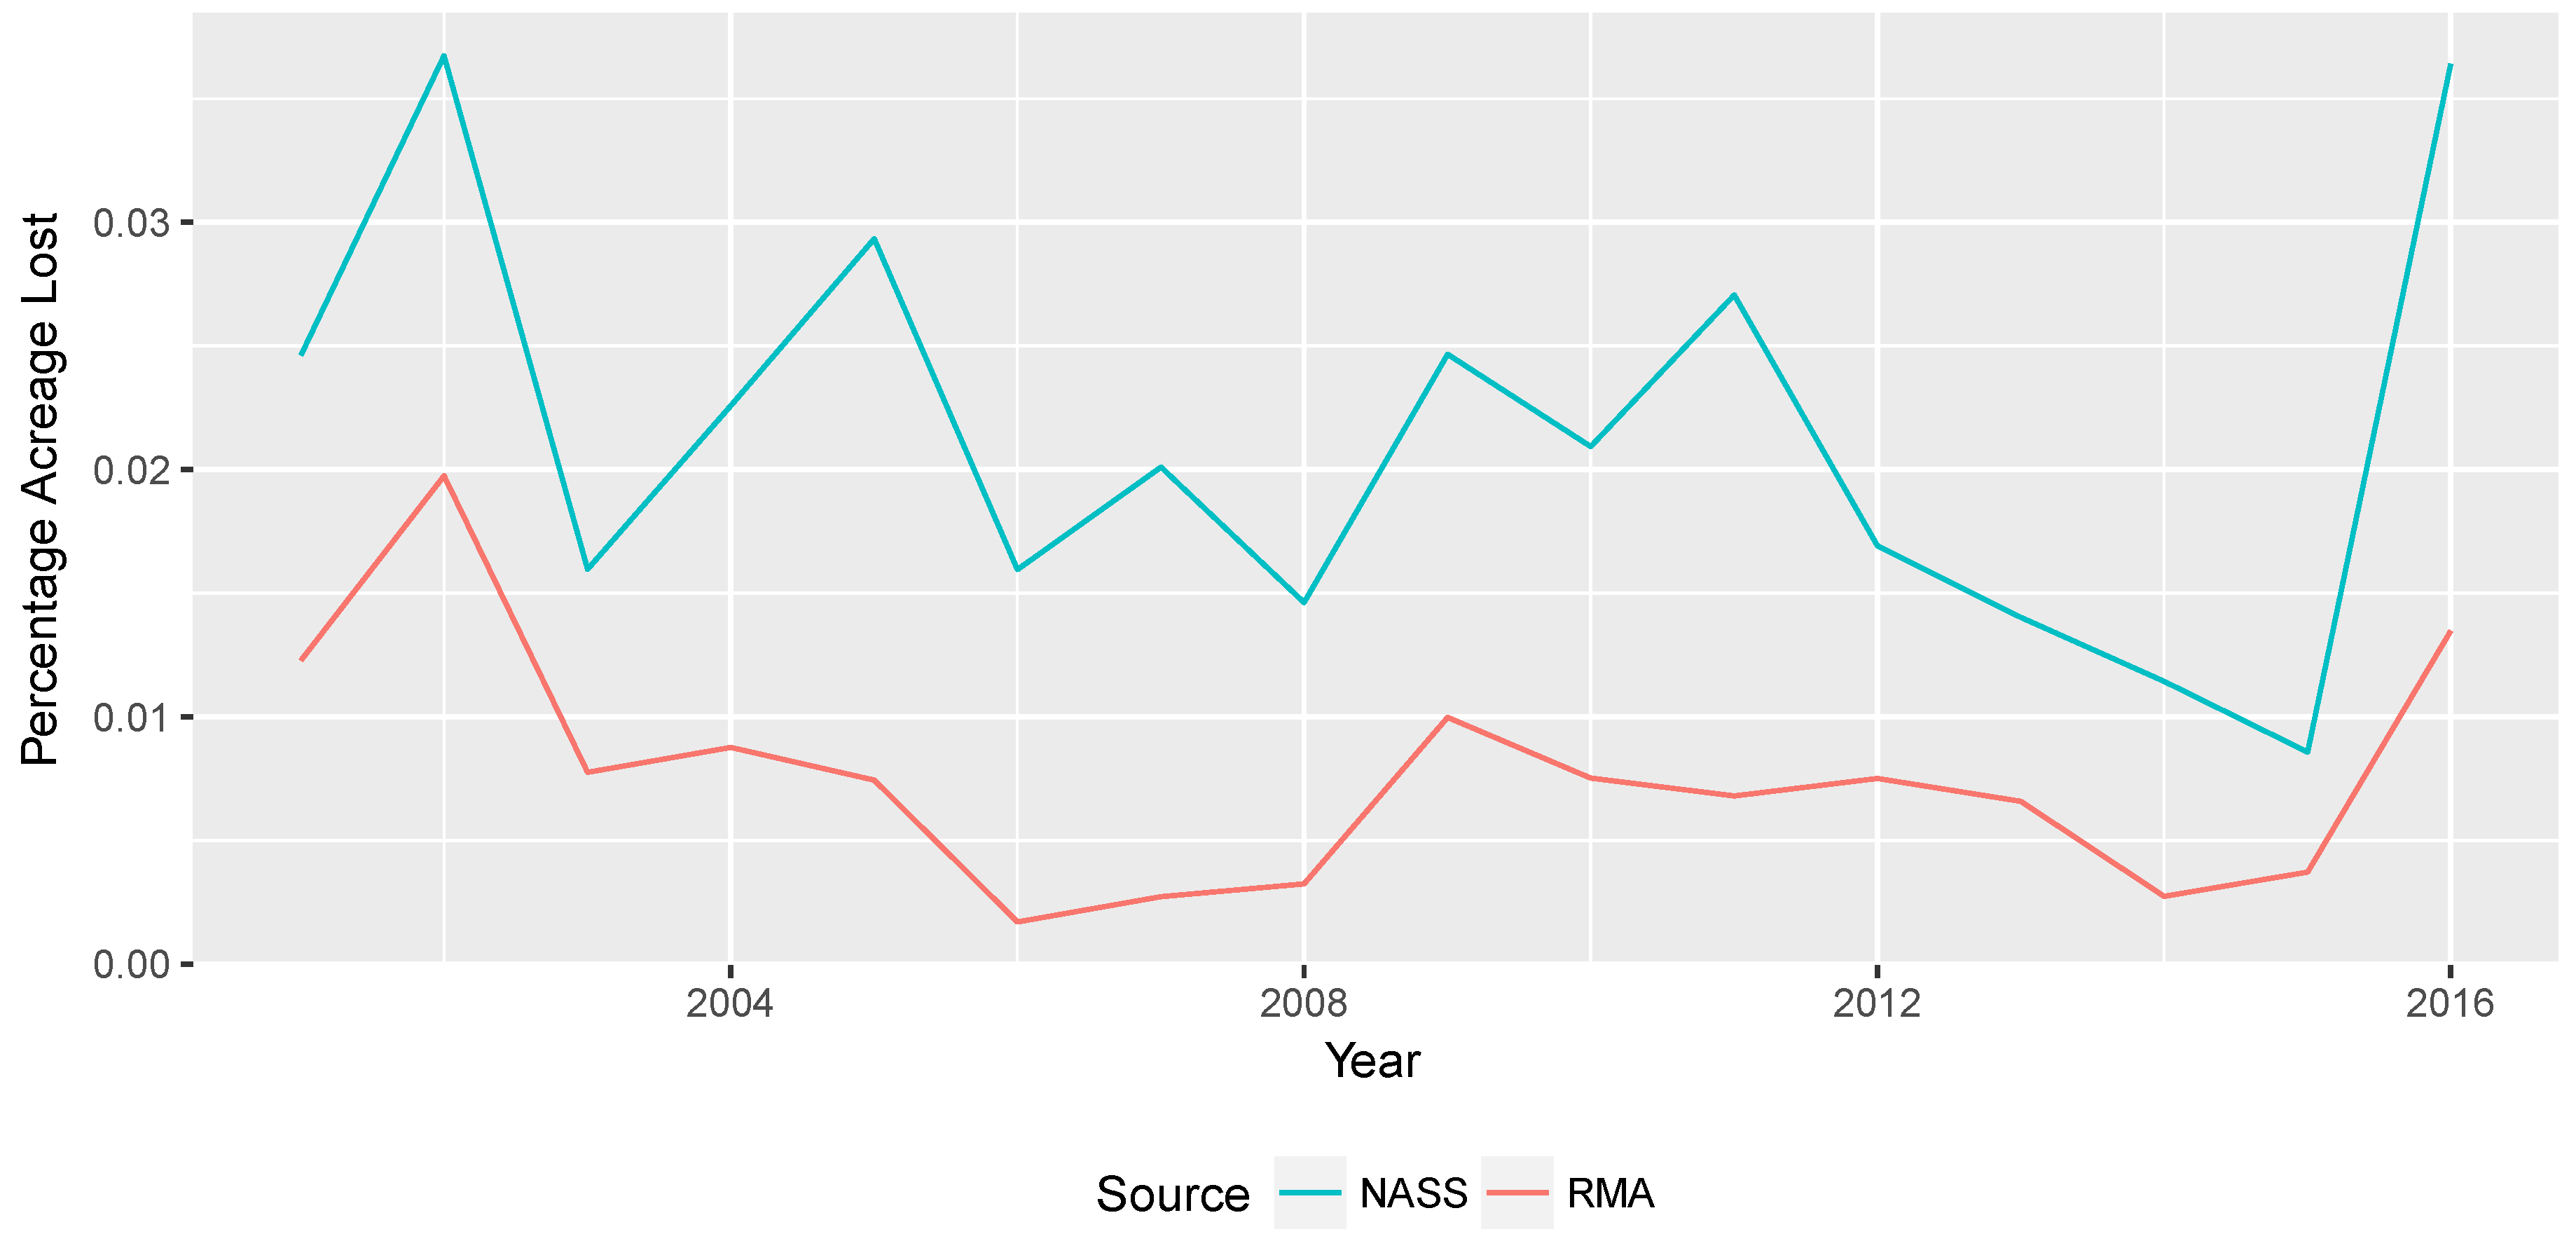
3.1. Comparison of Pre-Harvest Potato Loss Estimation: NASS and RMA
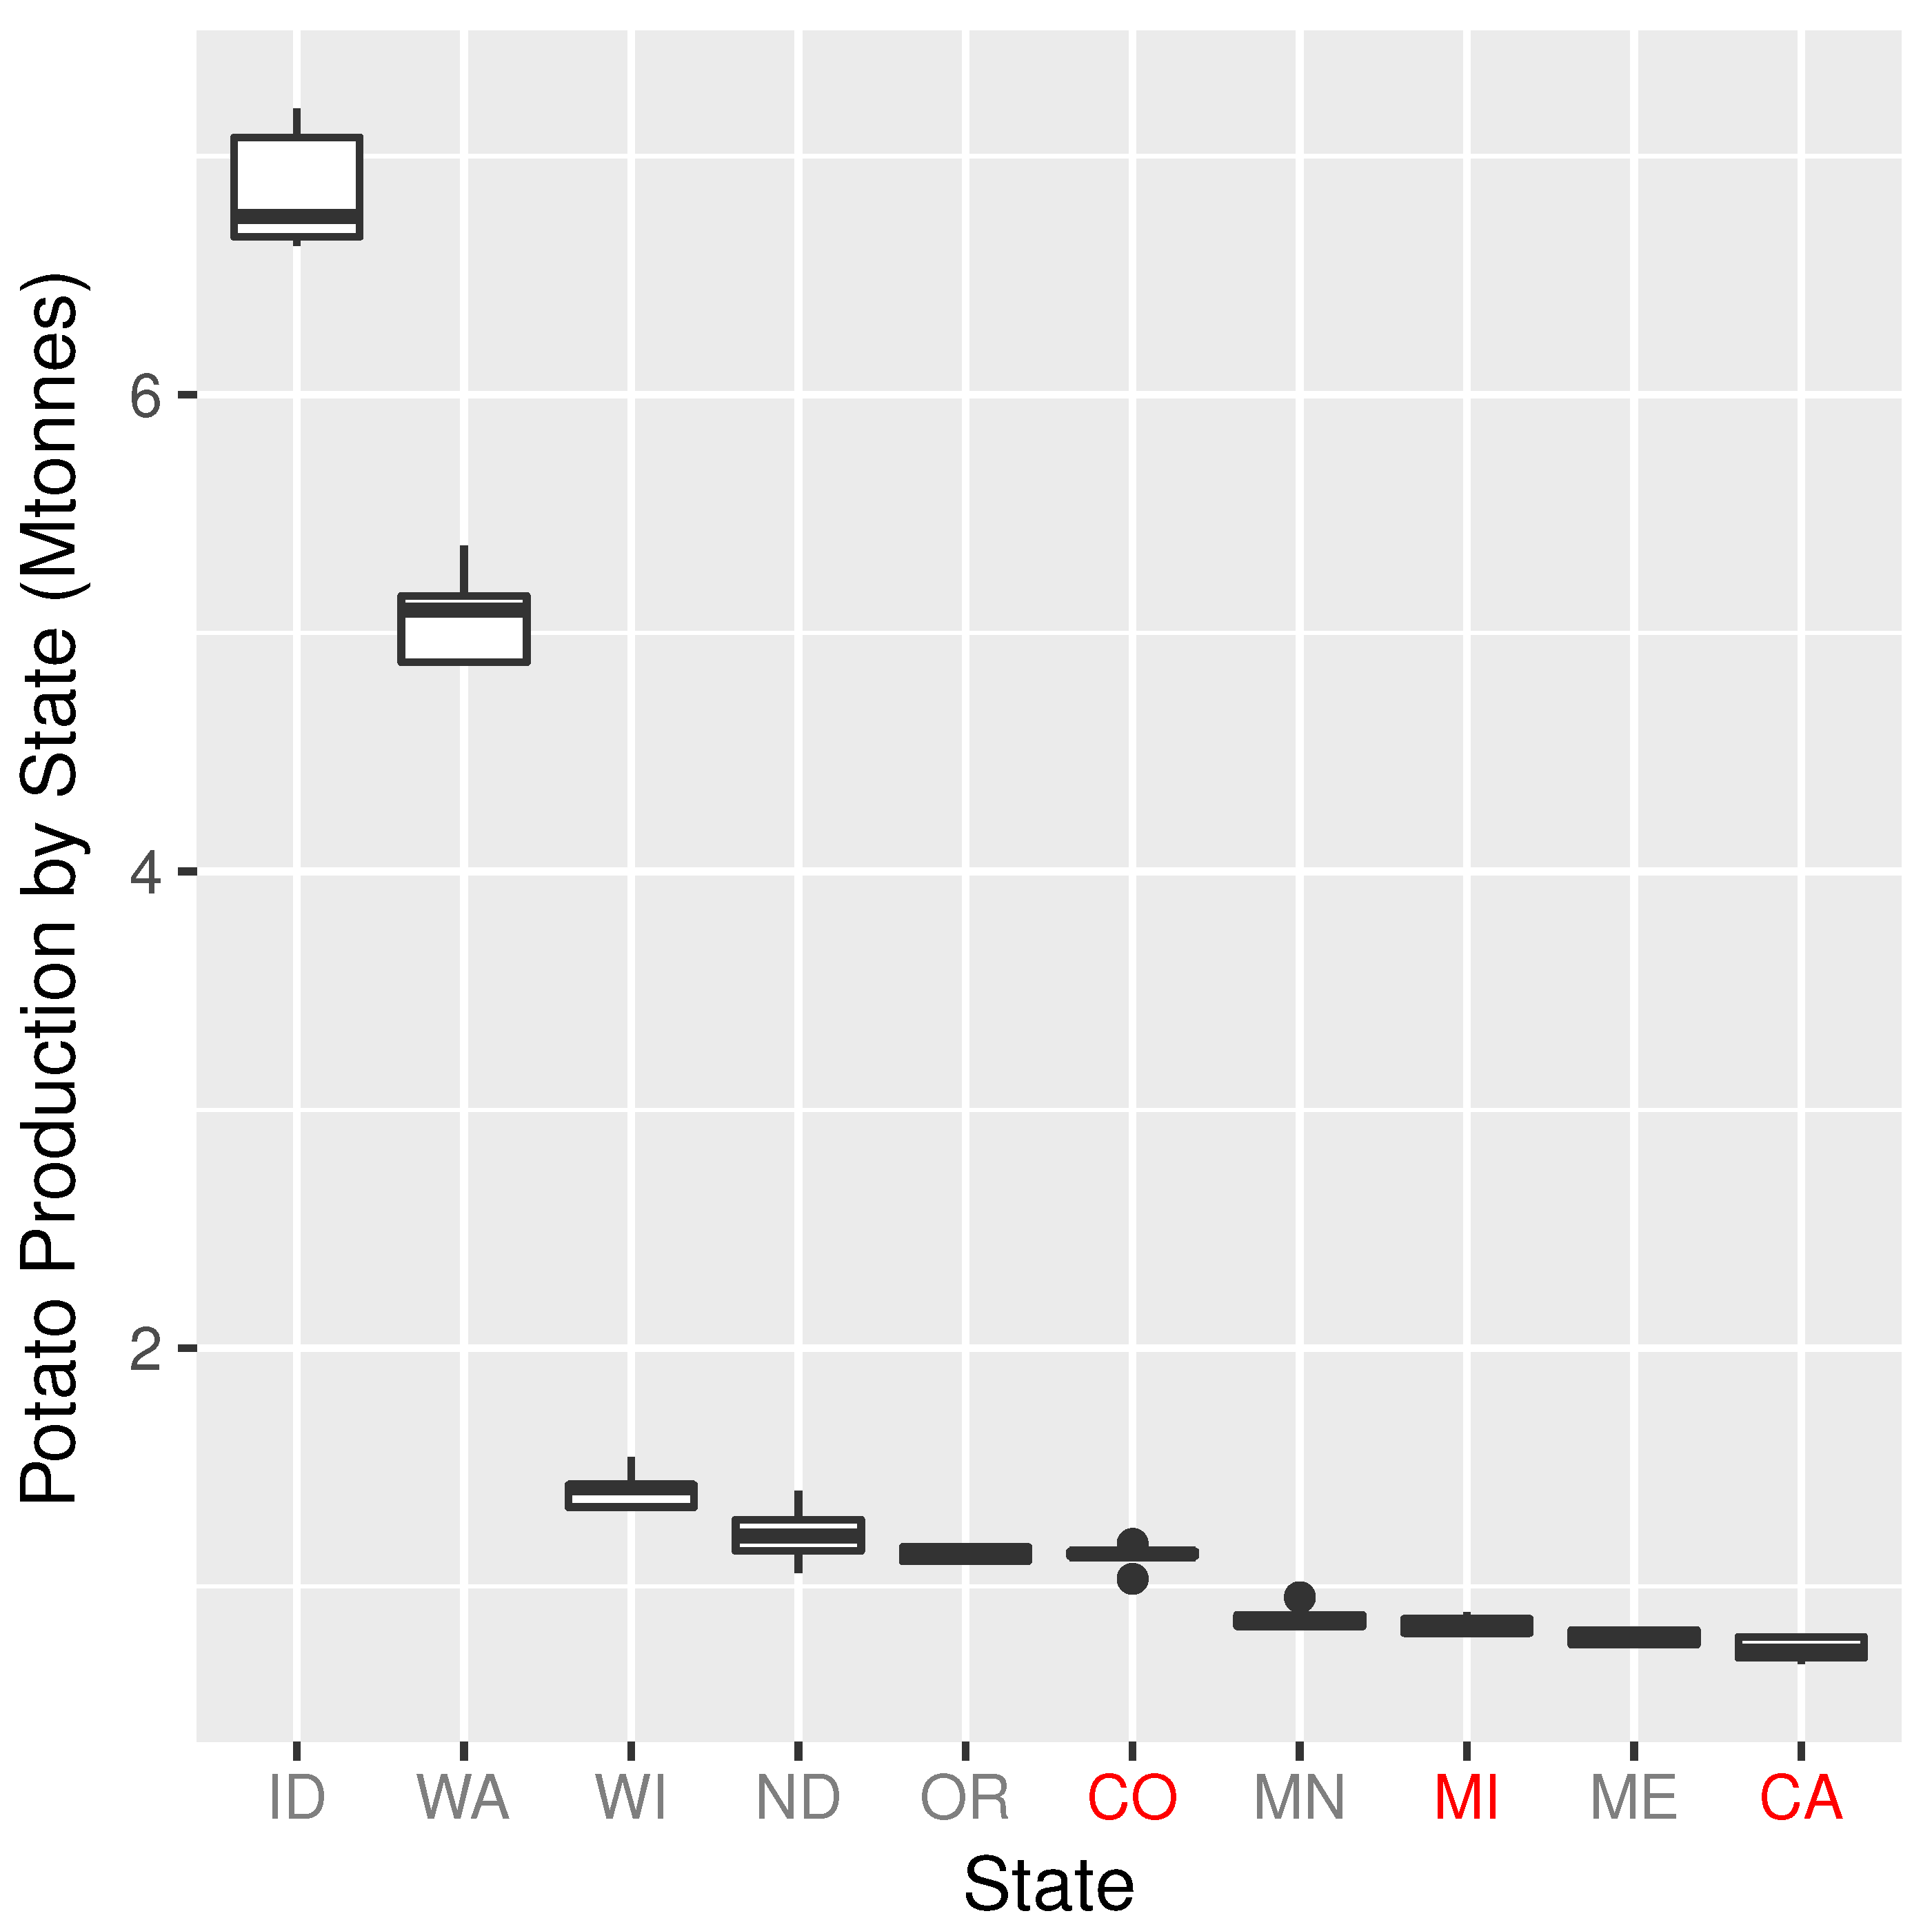
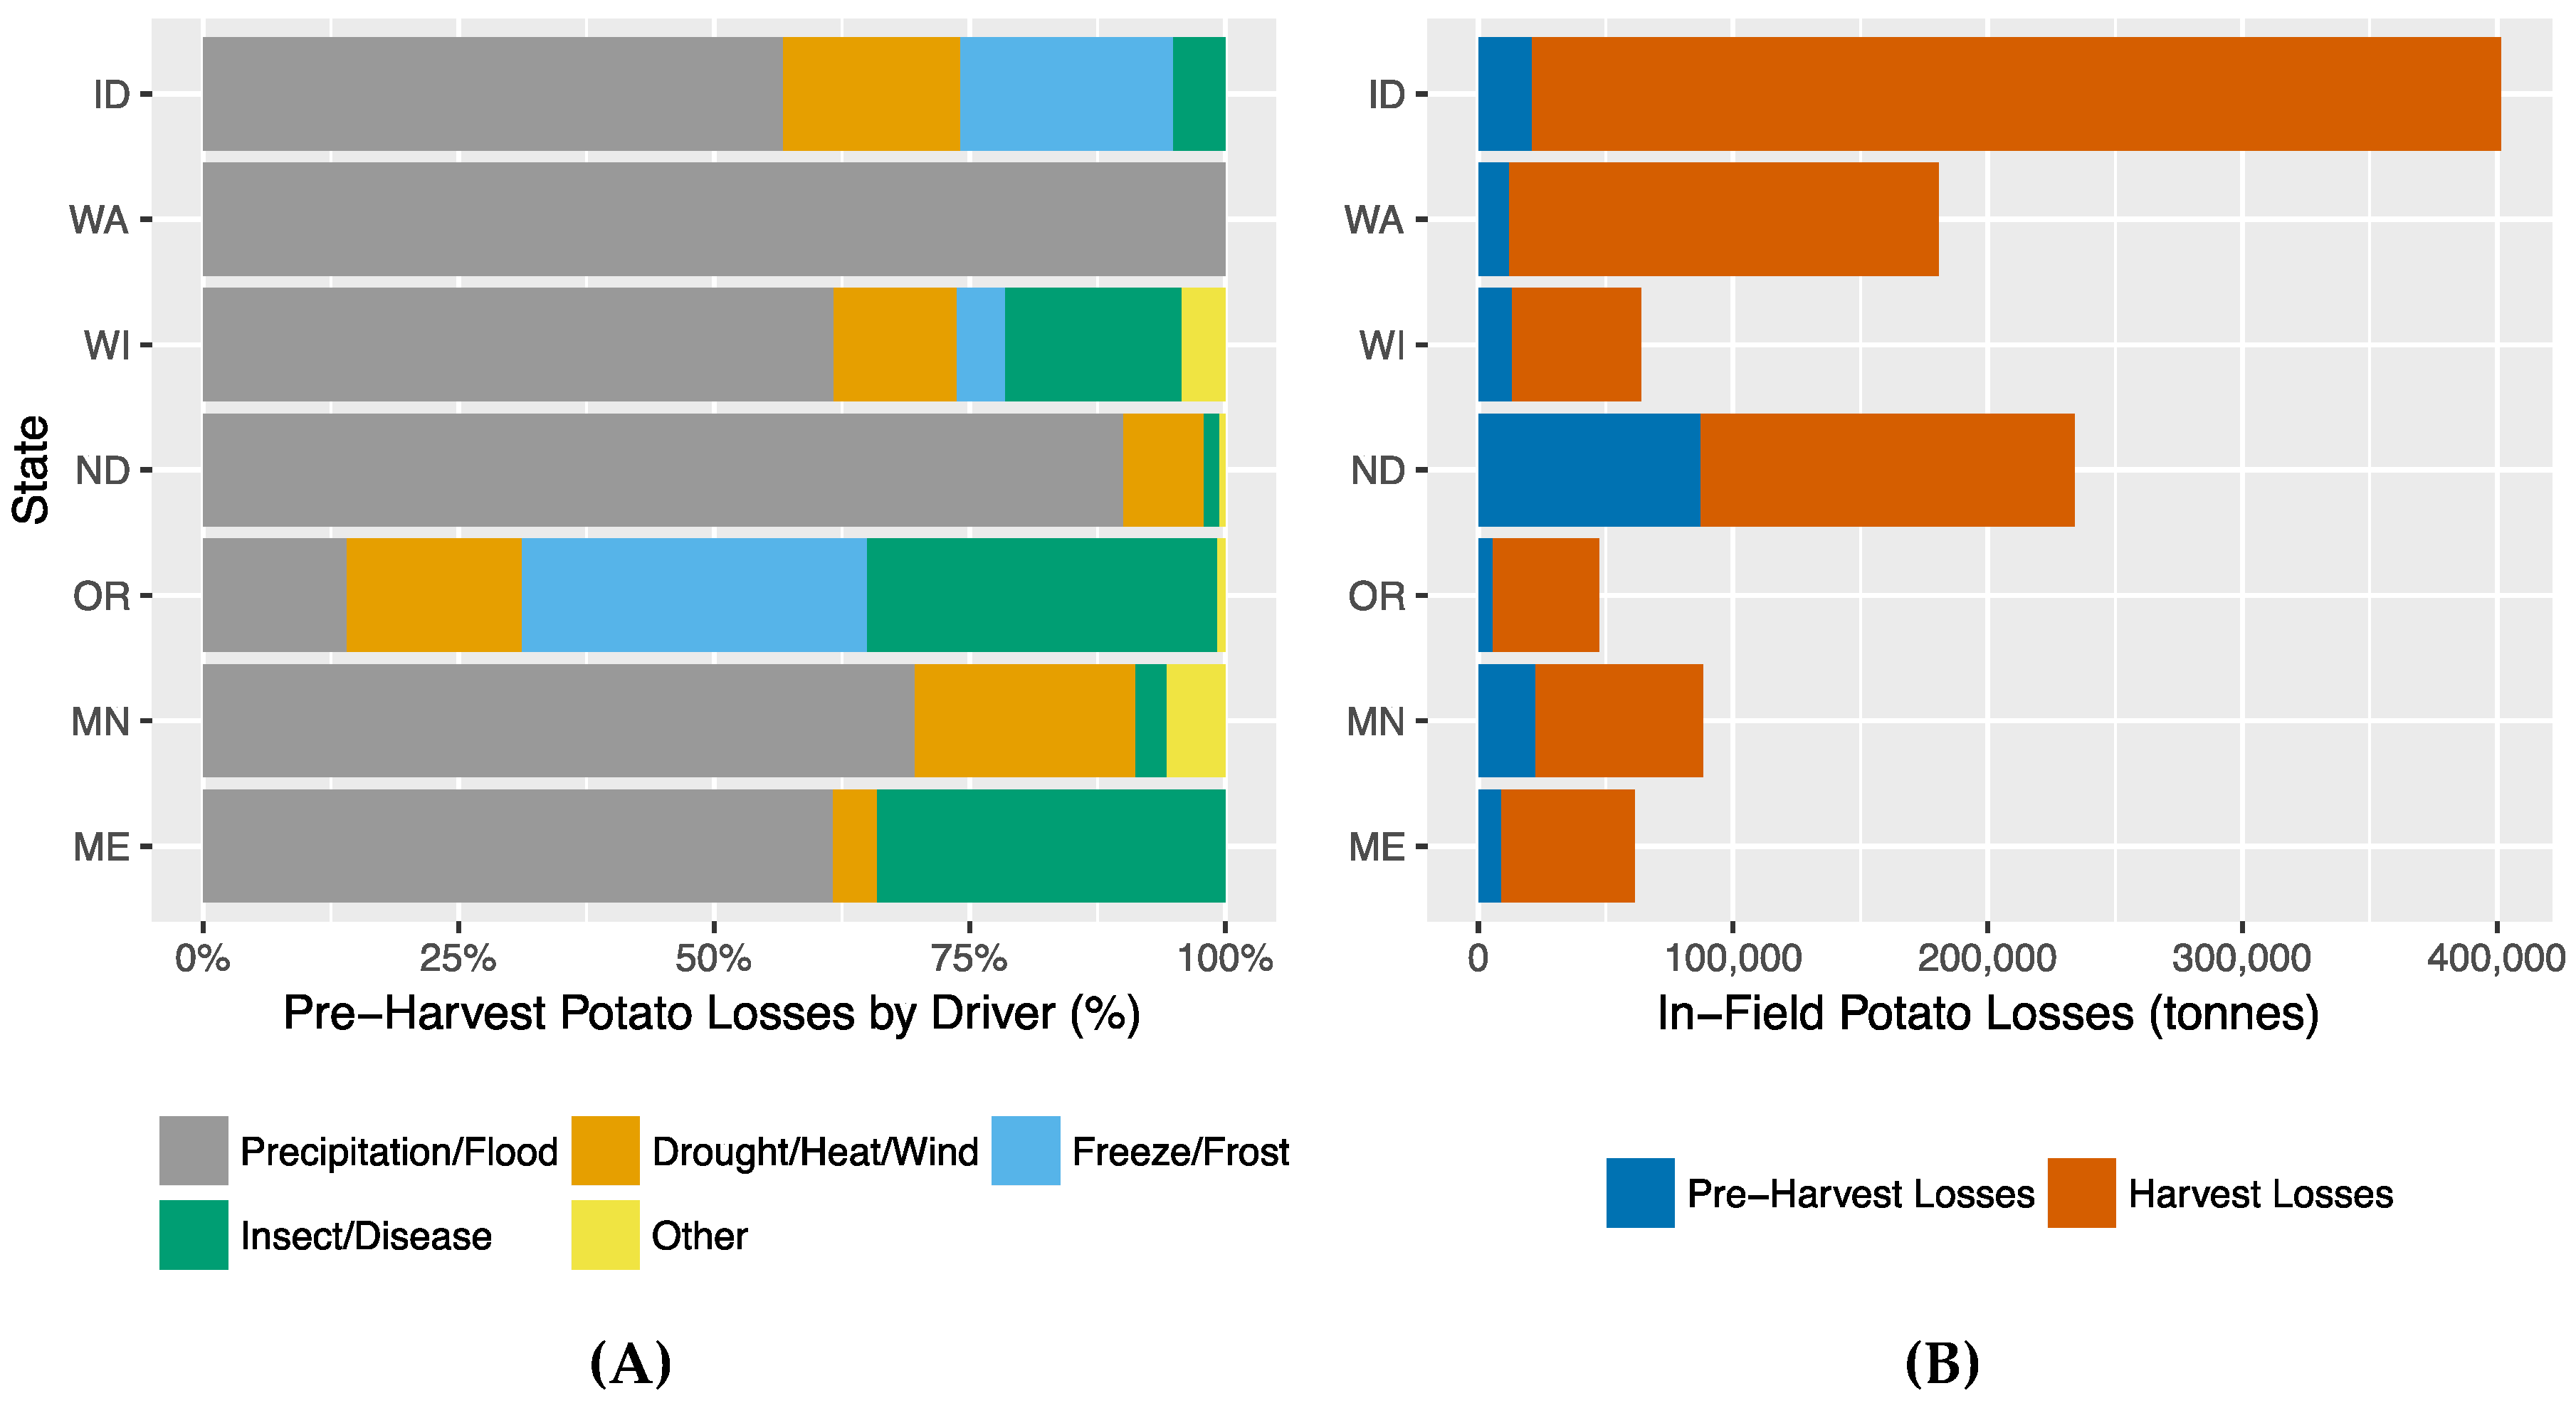
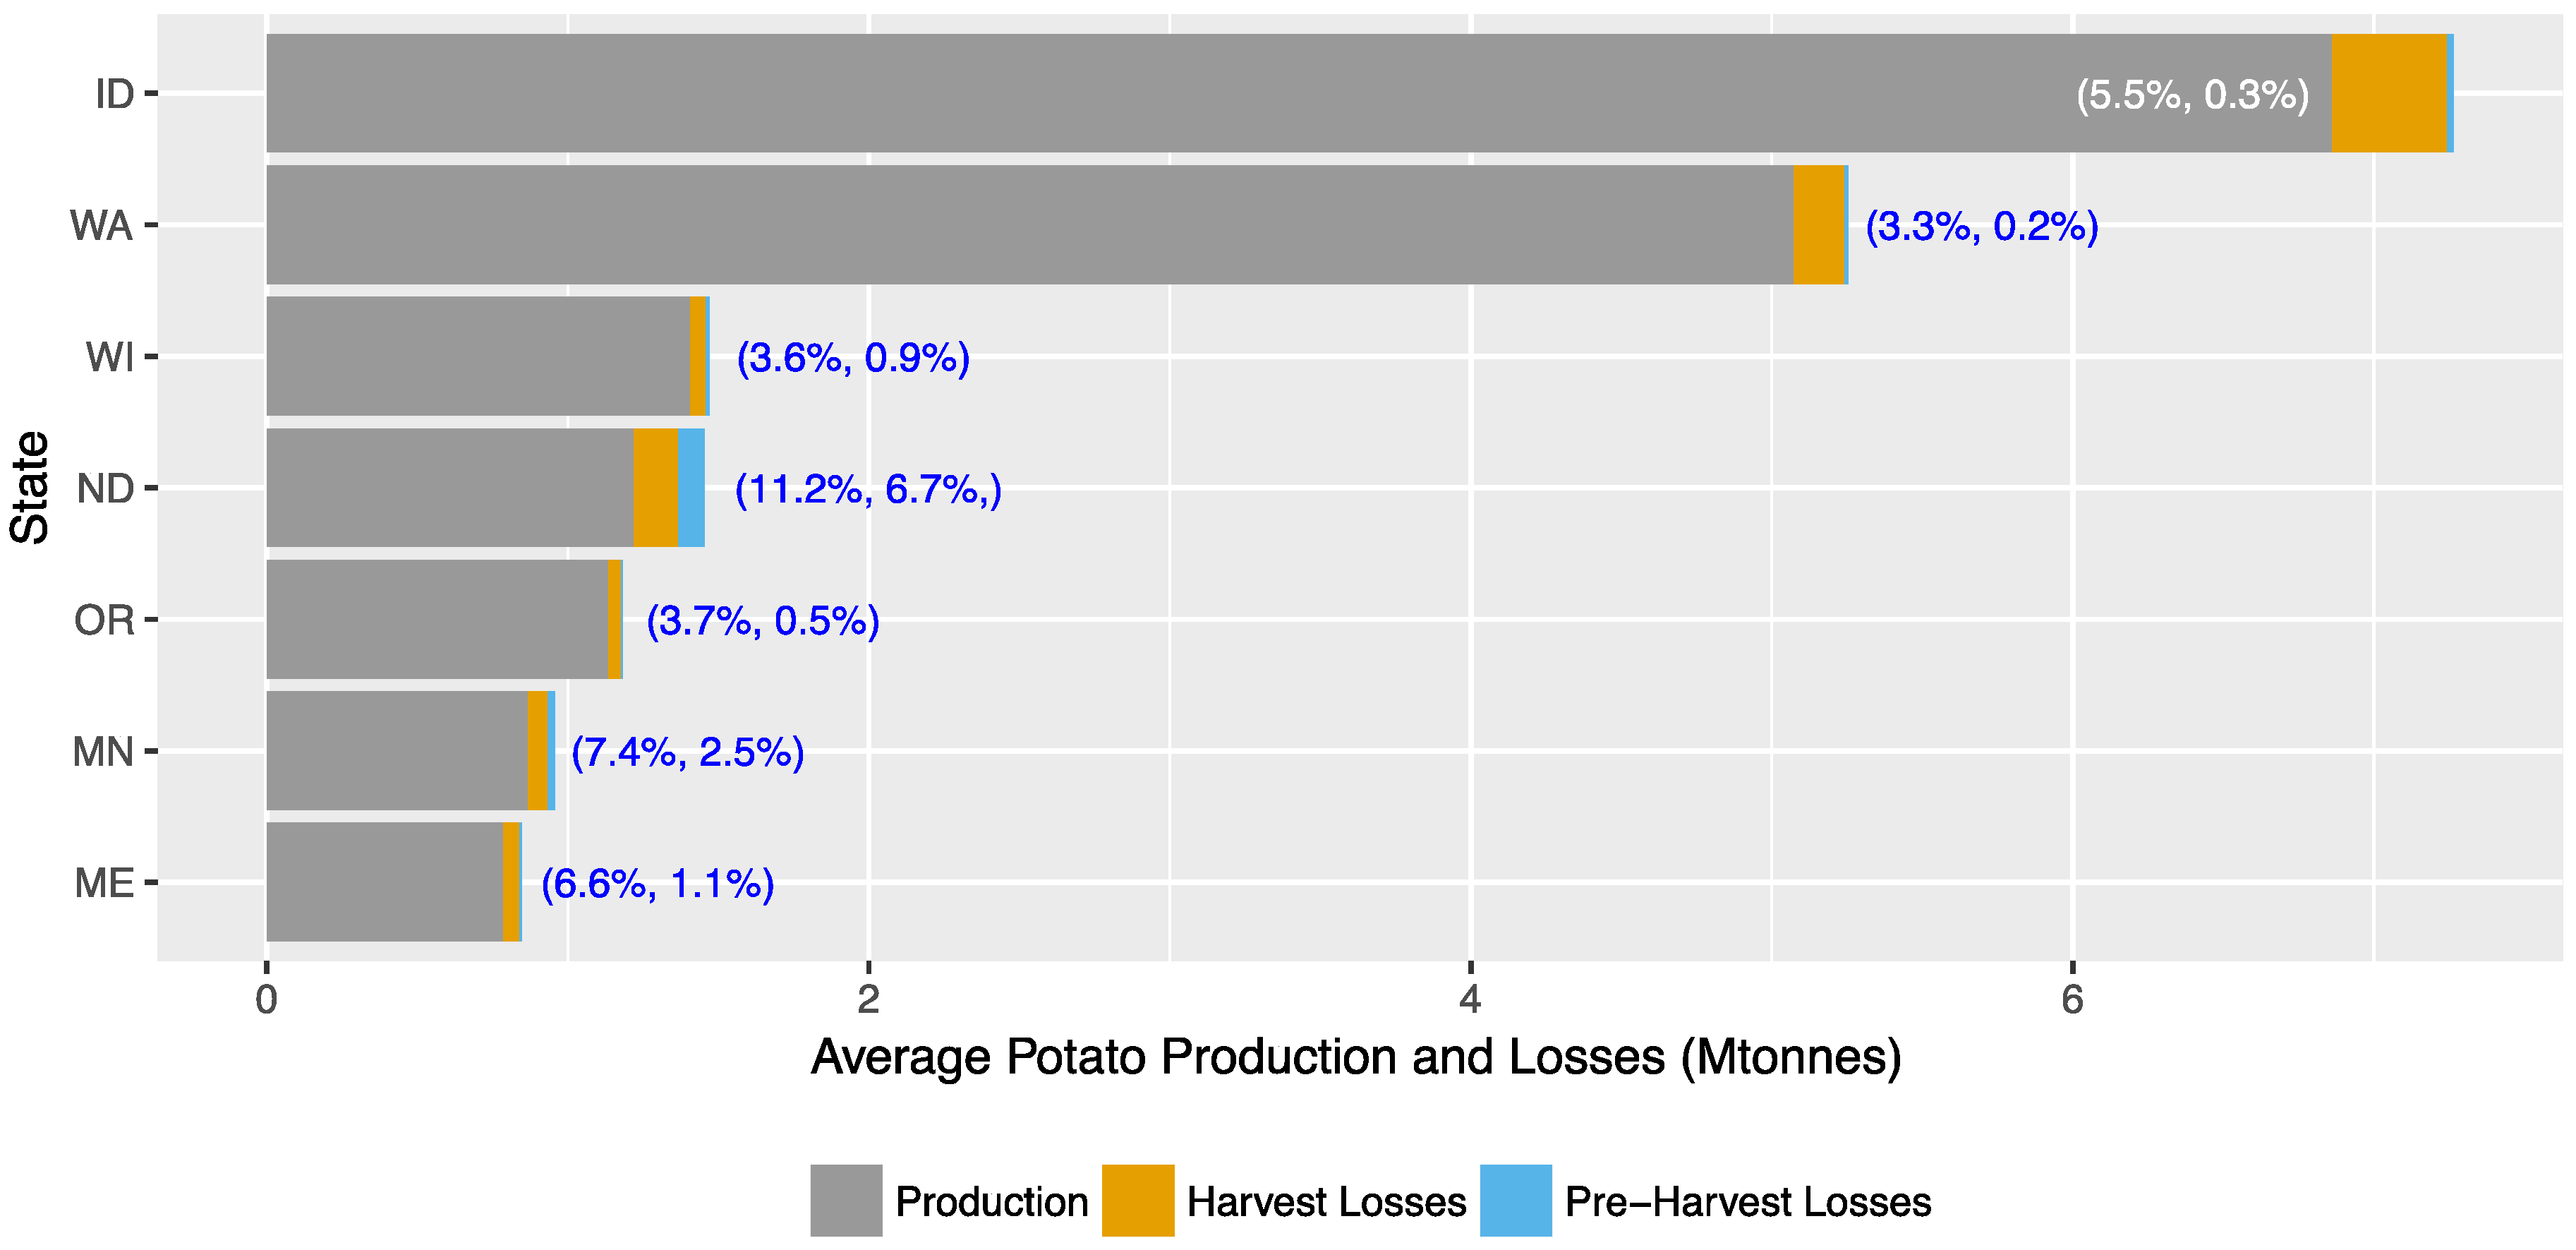
3.2. Pre-Harvest and Harvest Potato Losses
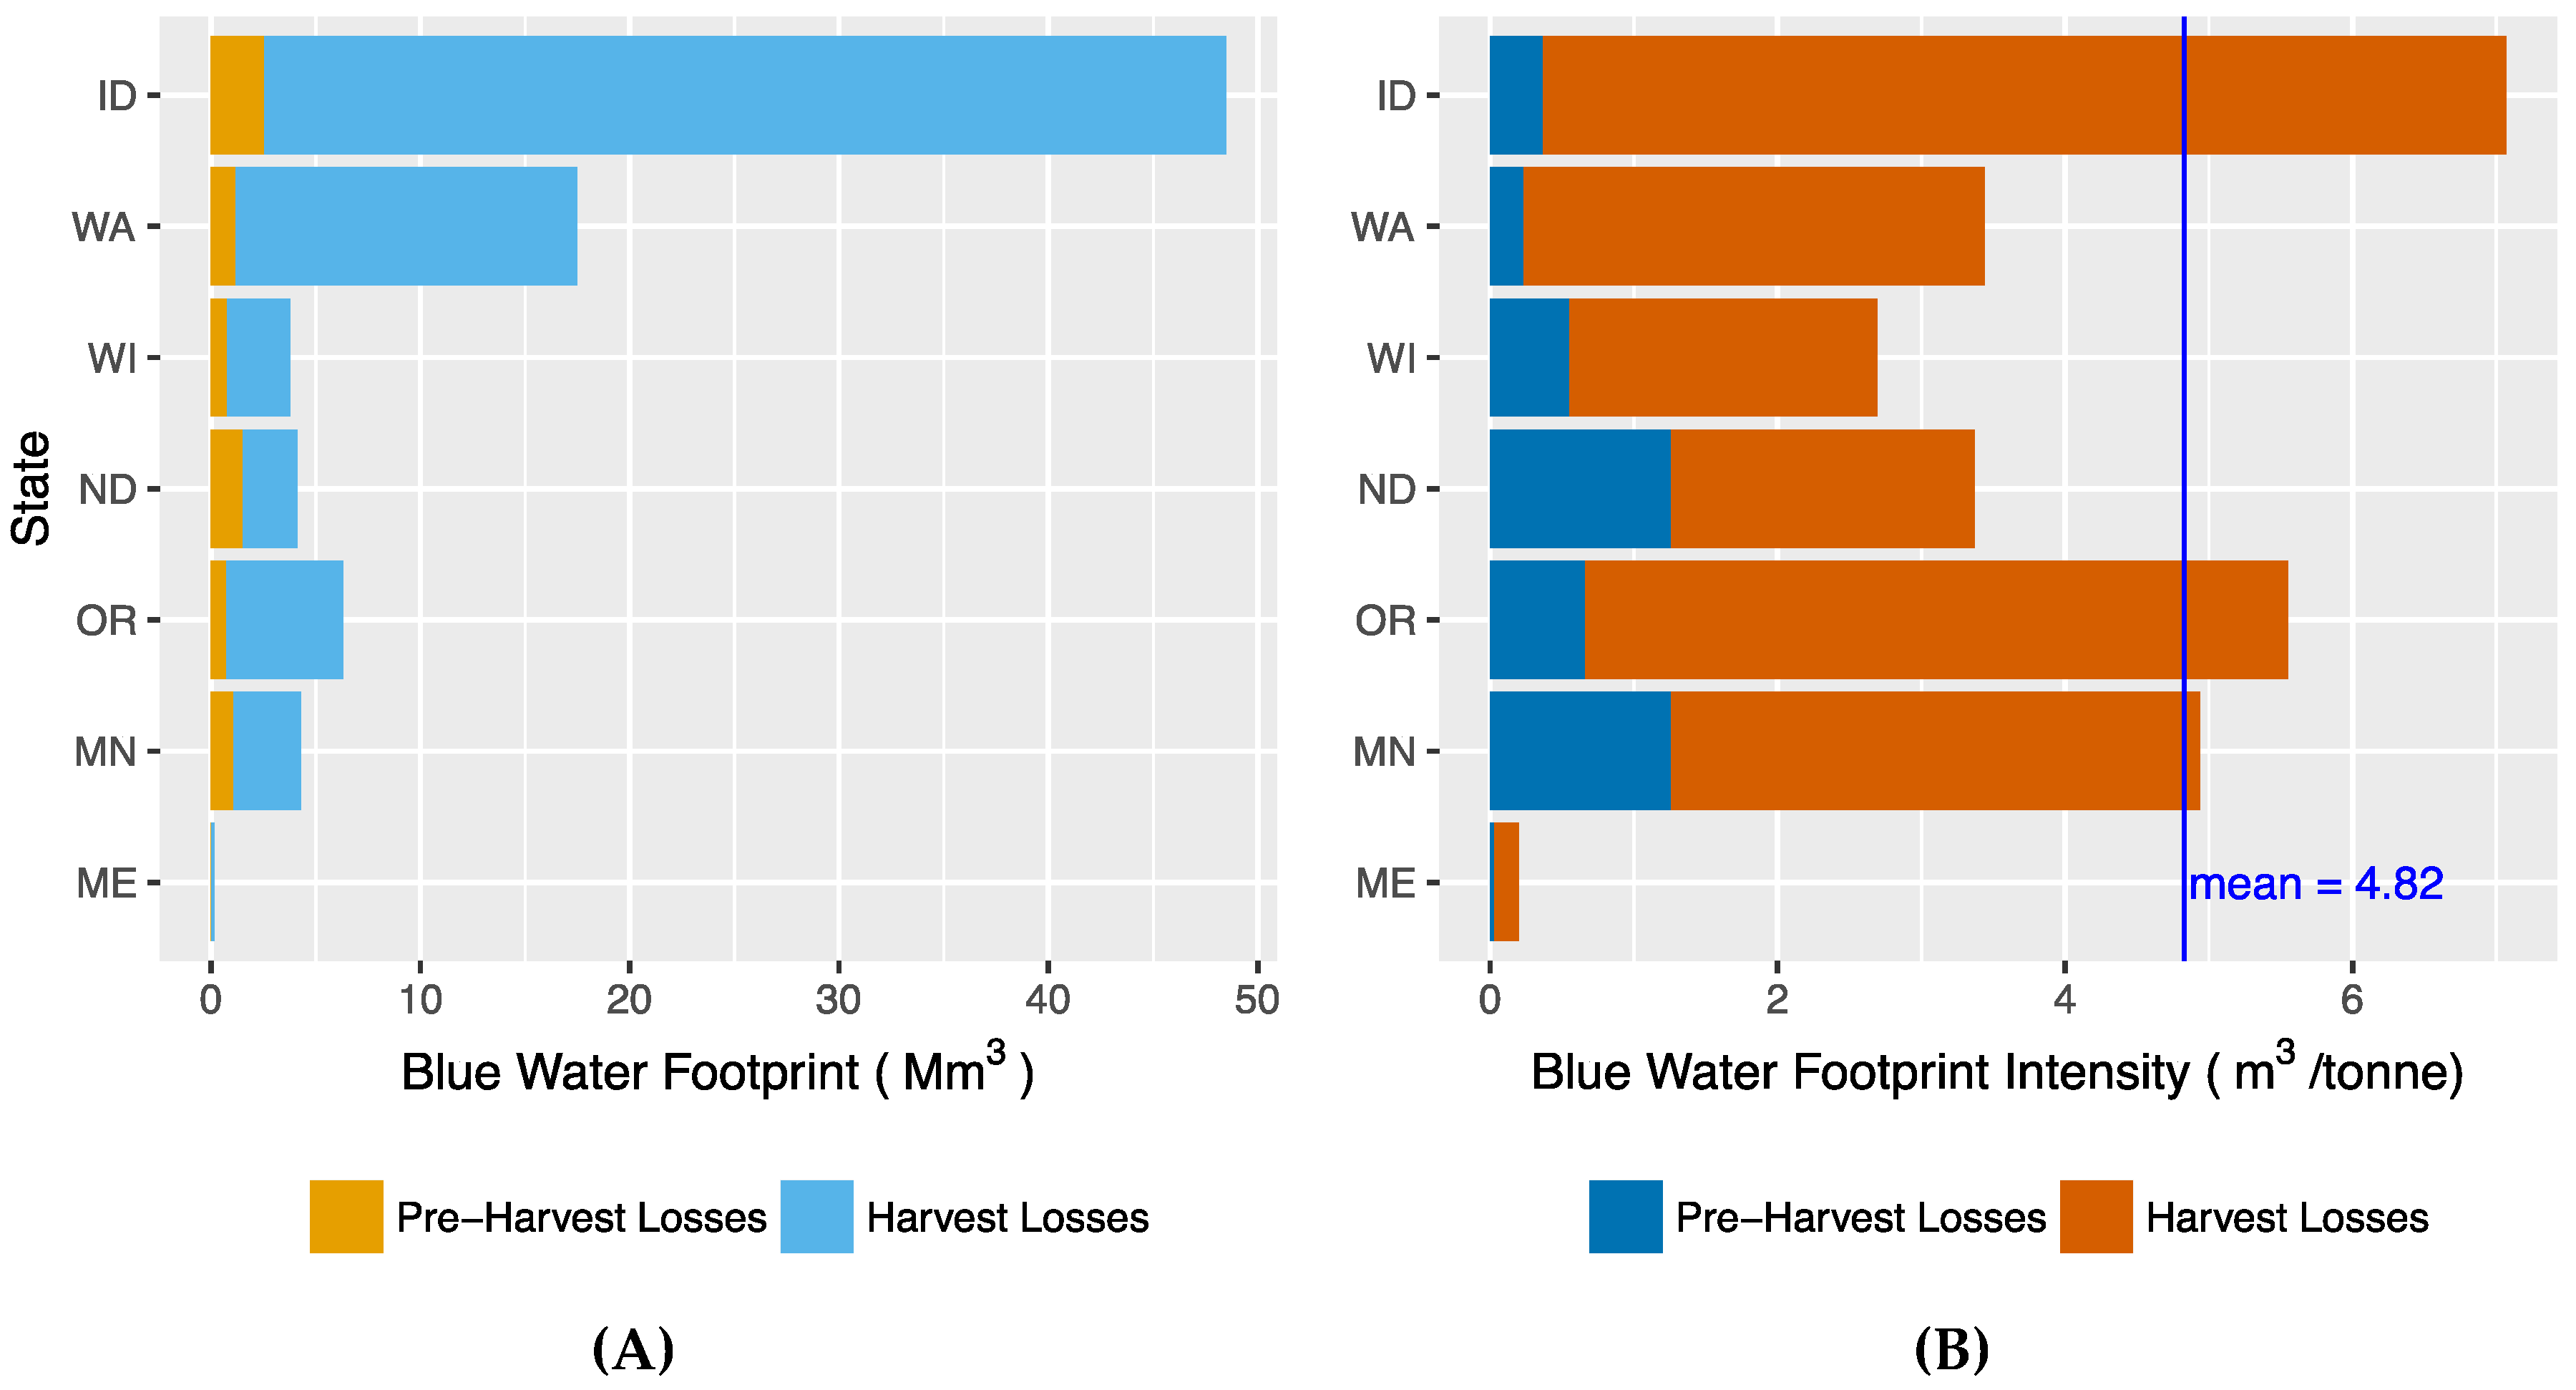
3.3. Blue Water Footprint Results
4. Conclusions
Author Contributions
Funding
Acknowledgments
Conflicts of Interest
Appendix A

| Loss Category | Idaho | Washington | Wisconsin | North Dakota | Oregon | Minnesota | Maine |
|---|---|---|---|---|---|---|---|
| Excess Rain | 9600 | 9163 | 8094 | 71,849 | 575 | 13,047 | 5564 |
| Cold Wet Weather | 387 | 3131 | 0 | 3101 | 185 | 0 | 0 |
| Hail | 1640 | 0 | 0 | 3094 | 37 | 0 | 27 |
| Flood | 348 | 0 | 0 | 439 | 0 | 2628 | 0 |
| Precipitation/Flood | 11,975 | 12,294 | 8094 | 78,482 | 796 | 15,675 | 5590 |
| Drought | 0 | 0 | 0 | 6223 | 0 | 4858 | 381 |
| Heat | 3039 | 0 | 1575 | 669 | 966 | 0 | 12 |
| Hot Wind | 242 | 0 | 0 | 0 | 0 | 0 | 0 |
| Excess Wind | 383 | 0 | 0 | 0 | 0 | 0 | 0 |
| Drought/Heat/Wind | 3665 | 0 | 1575 | 6892 | 966 | 4858 | 393 |
| Freeze | 1373 | 0 | 0 | 0 | 1676 | 0 | 0 |
| Frost | 3020 | 0 | 619 | 0 | 234 | 0 | 0 |
| Freeze/Frost | 4393 | 0 | 619 | 0 | 1910 | 0 | 0 |
| Insect | 0 | 0 | 0 | 0 | 13 | 0 | 504 |
| Disease | 1071 | 0 | 2261 | 1290 | 1922 | 688 | 2581 |
| Insect/Disease | 1071 | 0 | 2261 | 1290 | 1936 | 688 | 3085 |
| Other | 0 | 0 | 559 | 513 | 41 | 1284 | 0 |
| Pre-Harvest Losses | 21,103 | 12,294 | 13,107 | 87,177 | 5649 | 22,505 | 9068 |
| Harvest Losses | 380,387 | 168,298 | 50,751 | 146,788 | 41,816 | 65,667 | 52,159 |
| Total Losses | 401,491 | 180,592 | 63,858 | 233,965 | 47,466 | 88,172 | 61,227 |
| Production/Loss Category | Idaho | Washington | Wisconsin | North Dakota | Oregon | Minnesota | Maine |
|---|---|---|---|---|---|---|---|
| Potential Production (tonnes) | 6,883,458 | 5,085,819 | 1,420,432 | 1,307,346 | 1,141,731 | 891,174 | 795,818 |
| Pre-Harvest Losses (tonnes) | 21,103 | 12,294 | 13,107 | 87,177 | 5649 | 22,505 | 9068 |
| Harvest Losses (tonnes) | 38,0387 | 168,298 | 50,751 | 146,788 | 41,816 | 65,667 | 52,159 |
| Total Losses (tonnes) | 401,491 | 180,592 | 63,858 | 233,965 | 47,466 | 88,172 | 61,227 |
| Pre-Harvest Losses (%) | 0.3% | 0.2% | 0.9% | 6.7% | 0.5% | 2.5% | 1.1% |
| Harvest Losses (%) | 5.5% | 3.3% | 3.6% | 11.2% | 3.7% | 7.4% | 6.6% |
| Total Losses (%) | 5.8% | 3.5% | 4.5% | 17.9% | 4.2% | 9.9% | 7.7% |
| Indicator | Idaho | Washington | Wisconsin | North Dakota | Oregon | Minnesota | Maine |
|---|---|---|---|---|---|---|---|
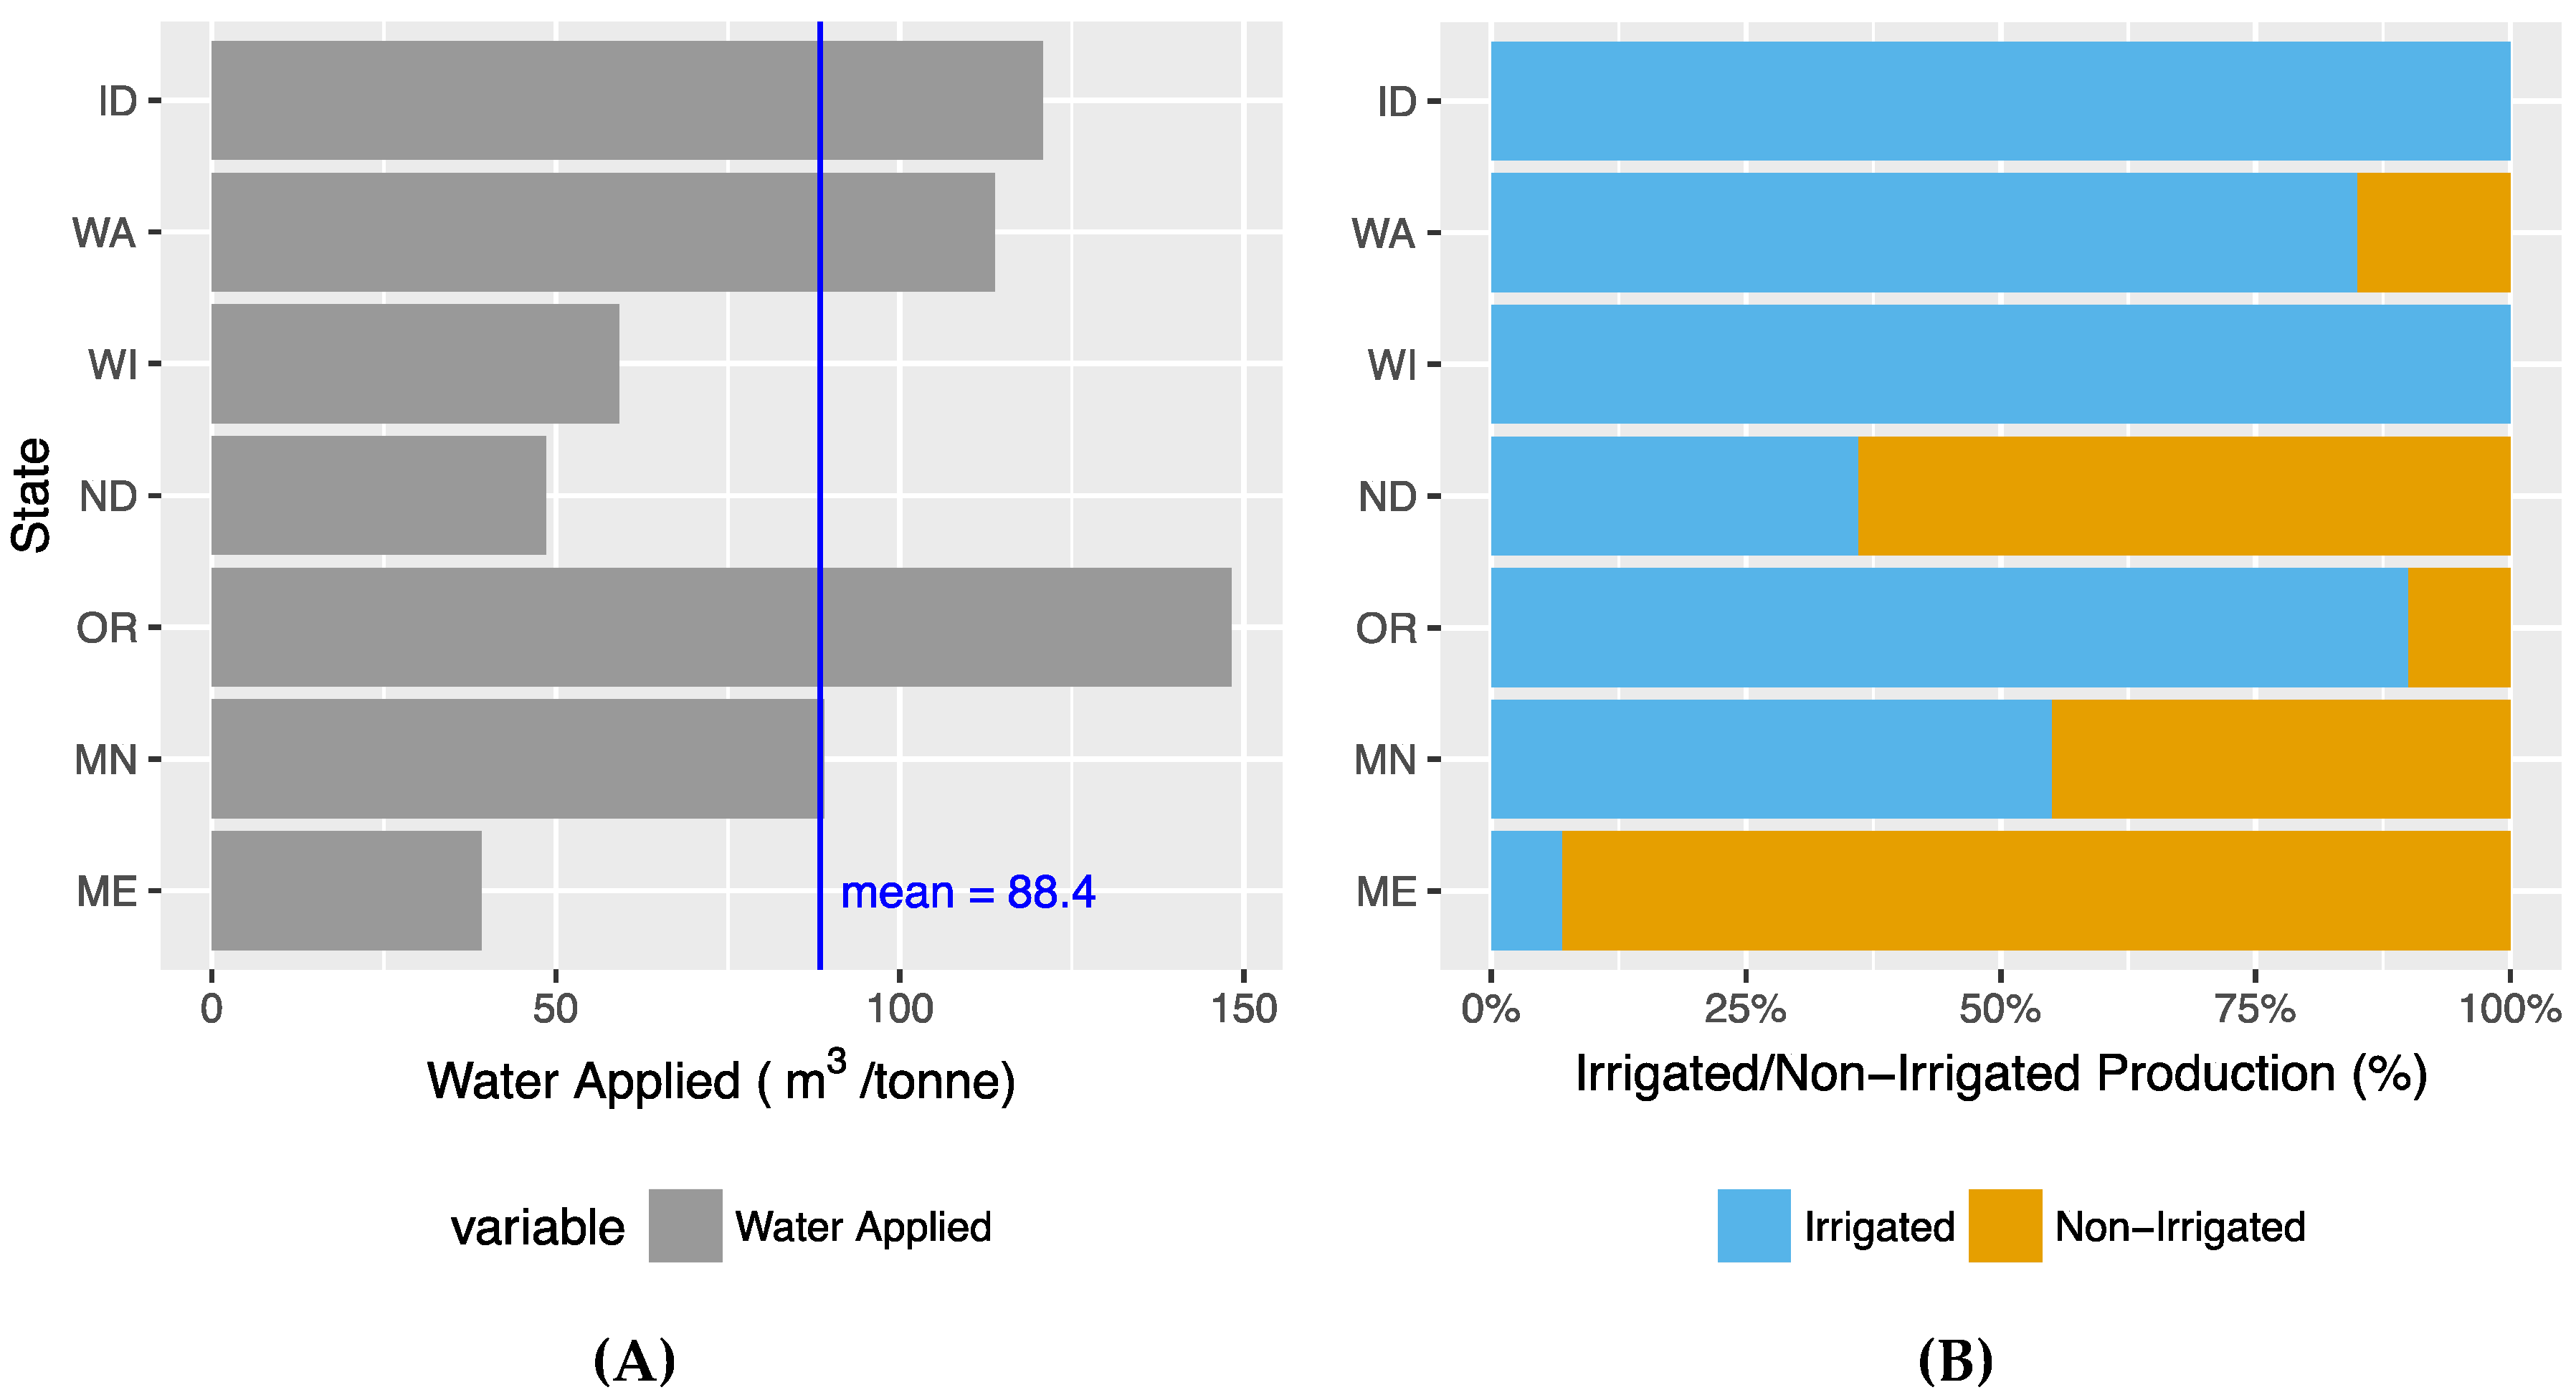
| Irrigated Water Applied (m3/tonne) | 121 | 114 | 59 | 49 | 148 | 89 | 39 |
| Percent Irrigated Acreage (%) | 100% | 85% | 100% | 36% | 90% | 55% | 7% |
| Blue Water Footprint (Mm3) | 48.50 | 17.49 | 3.78 | 4.11 | 6.31 | 4.29 | 0.16 |
| Pre-Harvest | 2.55 | 1.19 | 0.78 | 1.53 | 0.75 | 1.09 | 0.02 |
| Harvest | 45.95 | 16.30 | 3.01 | 2.58 | 5.56 | 3.19 | 0.14 |
| Blue Water Footprint Intensity (m3/tonne) | 7.07 | 3.45 | 2.69 | 3.37 | 5.28 | 4.94 | 0.21 |
| Pre-Harvest | 0.37 | 0.23 | 0.55 | 1.26 | 0.63 | 1.26 | 0.03 |
| Harvest | 6.70 | 3.21 | 2.14 | 2.11 | 4.65 | 3.68 | 0.17 |
References
- United States Department of Energy (DOE). The Water-Energy Nexus: Challenges and Opportunities; United States Department of Energy: Washington, DC, USA, 2014.
- Hall, K.D.; Guo, J.; Dore, M.; Chow, C.C. The Progressive Increase of Food Waste in America and Its Environmental Impact. PLoS ONE 2009, 4, e7940. [Google Scholar] [CrossRef] [PubMed]
- Xue, L.; Liu, G.; Par, J.; Liu, X.; Van Herpen, E.; Stenmarck, Å.; Connor, C.O.; Karin, O.; Cheng, S. Missing Food, Missing Data? A Critical Review of Global Food Losses and Food Waste Data. Environ. Sci. Technol. 2017, 51, 6618–6633. [Google Scholar] [CrossRef] [PubMed]
- Gustavsson, J.; Cederberg, C.; Sonesson, U.; van Otterdijk, R.; Meybeck, A. Global Food Losses and Food Waste-Extent, Causes and Prevention; Food and Agriculture Organization: Rome, Italy, 2011; ISBN 9789251072059. [Google Scholar]
- Bellemare, M.F.; Akır, M.Ç.; Peterson, H.H.; Novak, L.; Rudi, J. On the Measurement of Food Waste. Am. J. Agric. Econ. 2017, 99, 1148–1158. [Google Scholar] [CrossRef]
- Food and Agriculture Organization (FAO). Food Loss Prevention in Perishable Crops; Food and Agriculture Organization: Rome, Italy, 1981. [Google Scholar]
- Parfitt, J.; Barthel, M.; Macnaughton, S. Food waste within food supply chains: Quantification and potential for change to 2050. Philos. Trans. R. Soc. B Biol. Sci. 2010, 365, 3065–3081. [Google Scholar] [CrossRef] [PubMed]
- Stenmark, Å.; Jensen, C.; Quested, T.; Moates, G. Estimates of European Food Waste Levels; EU FUSIONS: Wageningen, The Netherlands, 2016; ISBN 9789188319012. [Google Scholar]
- Gunders, D.; Bloom, J. Wasted: How America is Losing up to 40 Percent of Its Food from Farm to Fork to Landfill, 2nd ed.; National Resource Defense Council (NRDC): San Francisco, CA, USA, 2017. [Google Scholar]
- USDA Risk Management Agency. Cause of Loss Historical Data Files. Available online: https://www.rma.usda.gov/data/cause.html (accessed on 2 May 2018).
- Beausang, C.; Hall, C.; Toma, L. Food waste and losses in primary production: Qualitative insights from horticulture. Resour. Conserv. Recycl. 2017, 126, 177–185. [Google Scholar] [CrossRef]
- Hoekstra, A.Y.; Chapagain, A.K. Water footprints of nations: Water use by people as a function of their consumption pattern. Water Resour. Manag. 2007, 21, 35–48. [Google Scholar] [CrossRef]
- Mekonnen, M.M.; Hoekstra, A.Y. The Green, Blue and Grey Water Footprint of Crops and Derived Crop Products; UNESCO-IHE Institute for Water Education: Delft, The Netherlands, 2010; Volume 1. [Google Scholar]
- Hoekstra, A.Y.; Mekonnen, M.M. The water footprint of humanity. Proc. Natl. Acad. Sci. USA 2012, 109, 3232–3237. [Google Scholar] [CrossRef] [PubMed]
- Steen-Olsen, K.; Weinzettel, J.; Cranston, G.; Ercin, A.E.; Hertwich, E.G. Carbon, land, and water footprint accounts for the european union: Consumption, production, and displacements through international trade. Environ. Sci. Technol. 2012, 46, 10883–10891. [Google Scholar] [CrossRef] [PubMed]
- Schyns, J.F.; Hoekstra, A.Y. The added value of Water Footprint Assessment for national water policy: A case study for Morocco. PLoS ONE 2014, 9. [Google Scholar] [CrossRef] [PubMed]
- Ahams, I.C.; Paterson, W.; Garcia, S.; Rushforth, R.; Ruddell, B.L.; Mejia, A. Water Footprint of 65 Mid- to Large-Sized U.S. Cities and Their Metropolitan Areas. J. Am. Water Resour. Assoc. 2017, 53, 1147–1163. [Google Scholar] [CrossRef]
- Gerbens-Leenes, P.W.; Hoekstra, A.Y.; Van der Meer, T. The water footprint of energy from biomass: A quantitative assessment and consequences of an increasing share of bio-energy in energy supply. Ecol. Econ. 2009, 68, 1052–1060. [Google Scholar] [CrossRef]
- Cazcarro, I.; Hoekstra, A.Y.; Sánchez Chóliz, J. The water footprint of tourism in Spain. Tour. Manag. 2014, 40, 90–101. [Google Scholar] [CrossRef]
- Vanham, D.; Bidoglio, G. The water footprint of agricultural products in European river basins. Environ. Res. Lett. 2014, 9. [Google Scholar] [CrossRef]
- Ruini, L.; Marino, M.; Pignatelli, S.; Laio, F.; Ridolfi, L. Water footprint of a large-sized food company: The case of Barilla pasta production. Water Resour. Ind. 2013, 1–2, 7–24. [Google Scholar] [CrossRef]
- Linneman, M.H.; Hoekstra, A.Y.; Berkhout, W. Ranking water transparency of dutch stock-listed companies. Sustainability 2015, 7, 4341–4359. [Google Scholar] [CrossRef]
- Gerbens-Leenes, P.W.; Mekonnen, M.M.; Hoekstra, A.Y. The water footprint of poultry, pork and beef: A comparative study in different countries and production systems. Water Resour. Ind. 2013, 1, 25–36. [Google Scholar] [CrossRef]
- Francke, I.C.M.; Castro, J.F.W. Carbon and water footprint analysis of a soap bar produced in Brazil by Natura Cosmetics. Water Resour. Ind. 2013, 1, 37–48. [Google Scholar] [CrossRef]
- Kummu, M.; de Moel, H.; Porkka, M.; Siebert, S.; Varis, O.; Ward, P.J. Lost food, wasted resources: Global food supply chain losses and their impacts on freshwater, cropland, and fertiliser use. Sci. Total Environ. 2012, 438, 477–489. [Google Scholar] [CrossRef] [PubMed]
- Chapagain, A.; James, K. The Water and Carbon Footprint of Household Food and Drink Waste in the UK: A Report Containing Quantification and Analysis of the Water and Carbon; WRAP UK: Banbury, UK, 2011; ISBN 1844054446. [Google Scholar]
- Vanham, D.; Bouraoui, F.; Leip, A.; Grizzetti, B.; Bidoglio, G. Lost water and nitrogen resources due to EU consumer food waste. Environ. Res. Lett. 2015, 10. [Google Scholar] [CrossRef]
- United States Department of Agriculture (USDA). 2012 Census of Agriculture Highlights: Vegetable Production; United States Department of Agriculture: Washington, DC, USA, 2015.
- United States Department of Agriculture (USDA). USDA Census of Agriculture. Available online: https://www.agcensus.usda.gov (accessed on 15 June 2018).
- United States Department of Agriculture (USDA). USDA Surveys. Available online: https://www.nass.usda.gov/Surveys/ (accessed on 15 June 2018).
- United States Department of Agriculture (USDA). USDA Surveys: Objective Yield. Available online: https://www.nass.usda.gov/Surveys/Guide_to_NASS_Surveys/Objective_Yield/index.php (accessed on 6 July 2018).
- United States Department of Agriculture (USDA). 2013 Farm and Ranch Irrigation Survey. Available online: https://www.agcensus.usda.gov/Publications/2012/Online_Resources/Farm_and_Ranch_Irrigation_Survey/ (accessed on 4 August 2018).
- United States Department of Agriculture (USDA). USDA National Agricultural Statistical Service Quick Stats. Available online: https://quickstats.nass.usda.gov (accessed on 2 January 2018).
- United States Department of Agriculture (USDA). USDA Risk Management Agency 2016 State Profiles. Available online: https://www.rma.usda.gov/pubs/2017/stateprofiles/ (accessed on 10 August 2018).
- United States Department of Agriculture (USDA). 2018 Potato Objective Yield Survey Interviewer’s Manual; United States Department of Agriculture: Washington, DC, USA, 2018.
- WRAP UK; French-Brooks, J. Reducing Supply Chain and Consumer Potato Waste; WRAP UK: Banbury, UK, 2012. [Google Scholar]
- Zavislan, K. Personal Communication with Katrina Zavislan, Extension Specialist. Michigan State University: East Lansing, MI, USA, 2018. [Google Scholar]
- 3A Business Consulting. The Global Market For Plant Proteins—Competition With Dairy 2017–2021; 3A Business Consulting: Aarhus, Denmark, 2018. [Google Scholar]


© 2018 by the authors. Licensee MDPI, Basel, Switzerland. This article is an open access article distributed under the terms and conditions of the Creative Commons Attribution (CC BY) license (http://creativecommons.org/licenses/by/4.0/).
Share and Cite
Spang, E.S.; Stevens, B.D. Estimating the Blue Water Footprint of In-Field Crop Losses: A Case Study of U.S. Potato Cultivation. Sustainability 2018, 10, 2854. https://doi.org/10.3390/su10082854
Spang ES, Stevens BD. Estimating the Blue Water Footprint of In-Field Crop Losses: A Case Study of U.S. Potato Cultivation. Sustainability. 2018; 10(8):2854. https://doi.org/10.3390/su10082854
Chicago/Turabian StyleSpang, Edward S., and Bret D. Stevens. 2018. "Estimating the Blue Water Footprint of In-Field Crop Losses: A Case Study of U.S. Potato Cultivation" Sustainability 10, no. 8: 2854. https://doi.org/10.3390/su10082854
APA StyleSpang, E. S., & Stevens, B. D. (2018). Estimating the Blue Water Footprint of In-Field Crop Losses: A Case Study of U.S. Potato Cultivation. Sustainability, 10(8), 2854. https://doi.org/10.3390/su10082854