Article

Coordinated Control Model of Main-Signal and Pre-Signal for Intersections with Dynamic Waiting Lanes

School of Automotive and Traffic Engineering, Jiangsu University, Zhenjiang 212000, China
*
Author to whom correspondence should be addressed.
Sustainability 2018, 10(8), 2849; https://doi.org/10.3390/su10082849
Submission received: 18 July 2018 / Revised: 5 August 2018 / Accepted: 8 August 2018 / Published: 10 August 2018
(This article belongs to the Section Sustainable Transportation)

Abstract

:
In order to alleviate the problem of the oversaturation of intersections, a traffic control method using a main-signal and pre-signals to periodically control the direction of dynamic waiting lanes was proposed in this paper. Based on the research on vehicle delay at intersections with dynamic waiting lanes and constraint relationships among a set of timing elements of the main-signal and pre-signal, a coordinated control model of a main-signal and pre-signal was built to minimize the average delay. Finally, a case study was performed to show that the proposed model is feasible. The objective optimization was performed by using a genetic algorithm to determine the main-signal and pre-signal timing scheme of the case study intersection, and then the average delay before and after installing dynamic waiting lanes was calculated and analyzed. The proposed method was found to be effective in reducing the intersection delay by 31.8% compared with the present situation of the intersection. Subsequently, the traffic volumes in the directions with dynamic waiting lanes installed were changed. It was demonstrated that with increasing traffic volumes, the effectiveness of the model to reduce intersection delay would be significant.

1. Introduction

In recent years, the vehicle population of some developing countries like China has been increasing, and frequent traffic jams have spread from large cities to small and medium-sized cities. Intersections are the key nodes of traffic jams. Signal control [1,2] and the optimization of lane assignment [3,4] are crucial for intersection control. In order to alleviate the problem of intersection congestions caused by oversaturated traffic flow, as well as increase the utilization ratio of the entrance lanes at intersections, in this paper a traffic control method called dynamic waiting lane is proposed, combining the traffic control methods of both variable lanes [5,6] and comprehensive waiting area [7]. The pre-signal control was introduced into the dynamic waiting lane. Vehicles traveling in different directions could alternately use the dynamic waiting lanes in a signal cycle with the coordinated control of the main-signal and pre-signal. Figure 1 shows the channelization forms of dynamic waiting lanes in an intersection entrance with pre-signals.
The pre-signal control method was originally used for bus priority control to ensure that buses receive priority in the intersection, proposed by the British Transport Authority in 1991 [8]. Recently, some scholars have studied pre-signal control methods for social vehicles in intersections. Xuan proposed the optimization of a pre-signal system that employs sorting strategies for generic intersections, and illustrated the potential benefits of the proposed system in 2011 [9]. He also demonstrated that the pre-signal control method can increase intersection capacity effectively by a natural experiment in 2012 [10]. On the basis of the strategy proposed by Xuan in 2012, Zhou et al. [11] developed an optimization model to minimize the delay and Yan et al. [12] established an optimization model to maximize the capacity. In addition, Ma et al. [13,14] established a signal control model for an intersection entrance with a double-stop line. However, the model considered only the area between the double-stop lines as the waiting area (except the exclusive right-turn lane), which requires large volumes of traffic in both the left turn and through lanes. Also, some scholars applied pre-signal control into variable lanes. For example, Li et al. [15] and Chen et al. [16] studied the method of setting the pre-signal at an intersection of variable lanes, with the aim of solving the problem of traffic jams and idle lanes caused by the uneven distribution of traffic flow. This method could not, however, mitigate traffic congestion problems produced by intersection oversaturation.
The rest of this paper is organized as follows. Section 2 analyzes of the coordinated control method of the main-signal and pre-signal. Section 3 proposes the coordinated control model of the main-signal and pre-signal based on the analysis of the computing method used to determine vehicle delay and interrelations of timing parameters between the main-signal and pre-signal. Section 4 validates the proposed model and analyzes the results. Concluding remarks are given in Section 5.
The discussion in this paper is based on the following default conditions:
(1)
The object of discussion is the traditional crossroad, which adopts the traditional four-phase traffic signal control method;
(2)
The impact of right-turn traffic is not considered in this paper;
(3)
The drivers follow the driving rules of the dynamic waiting lane;
(4)
The vehicles arrive at and leave the intersection evenly according to the linear law.

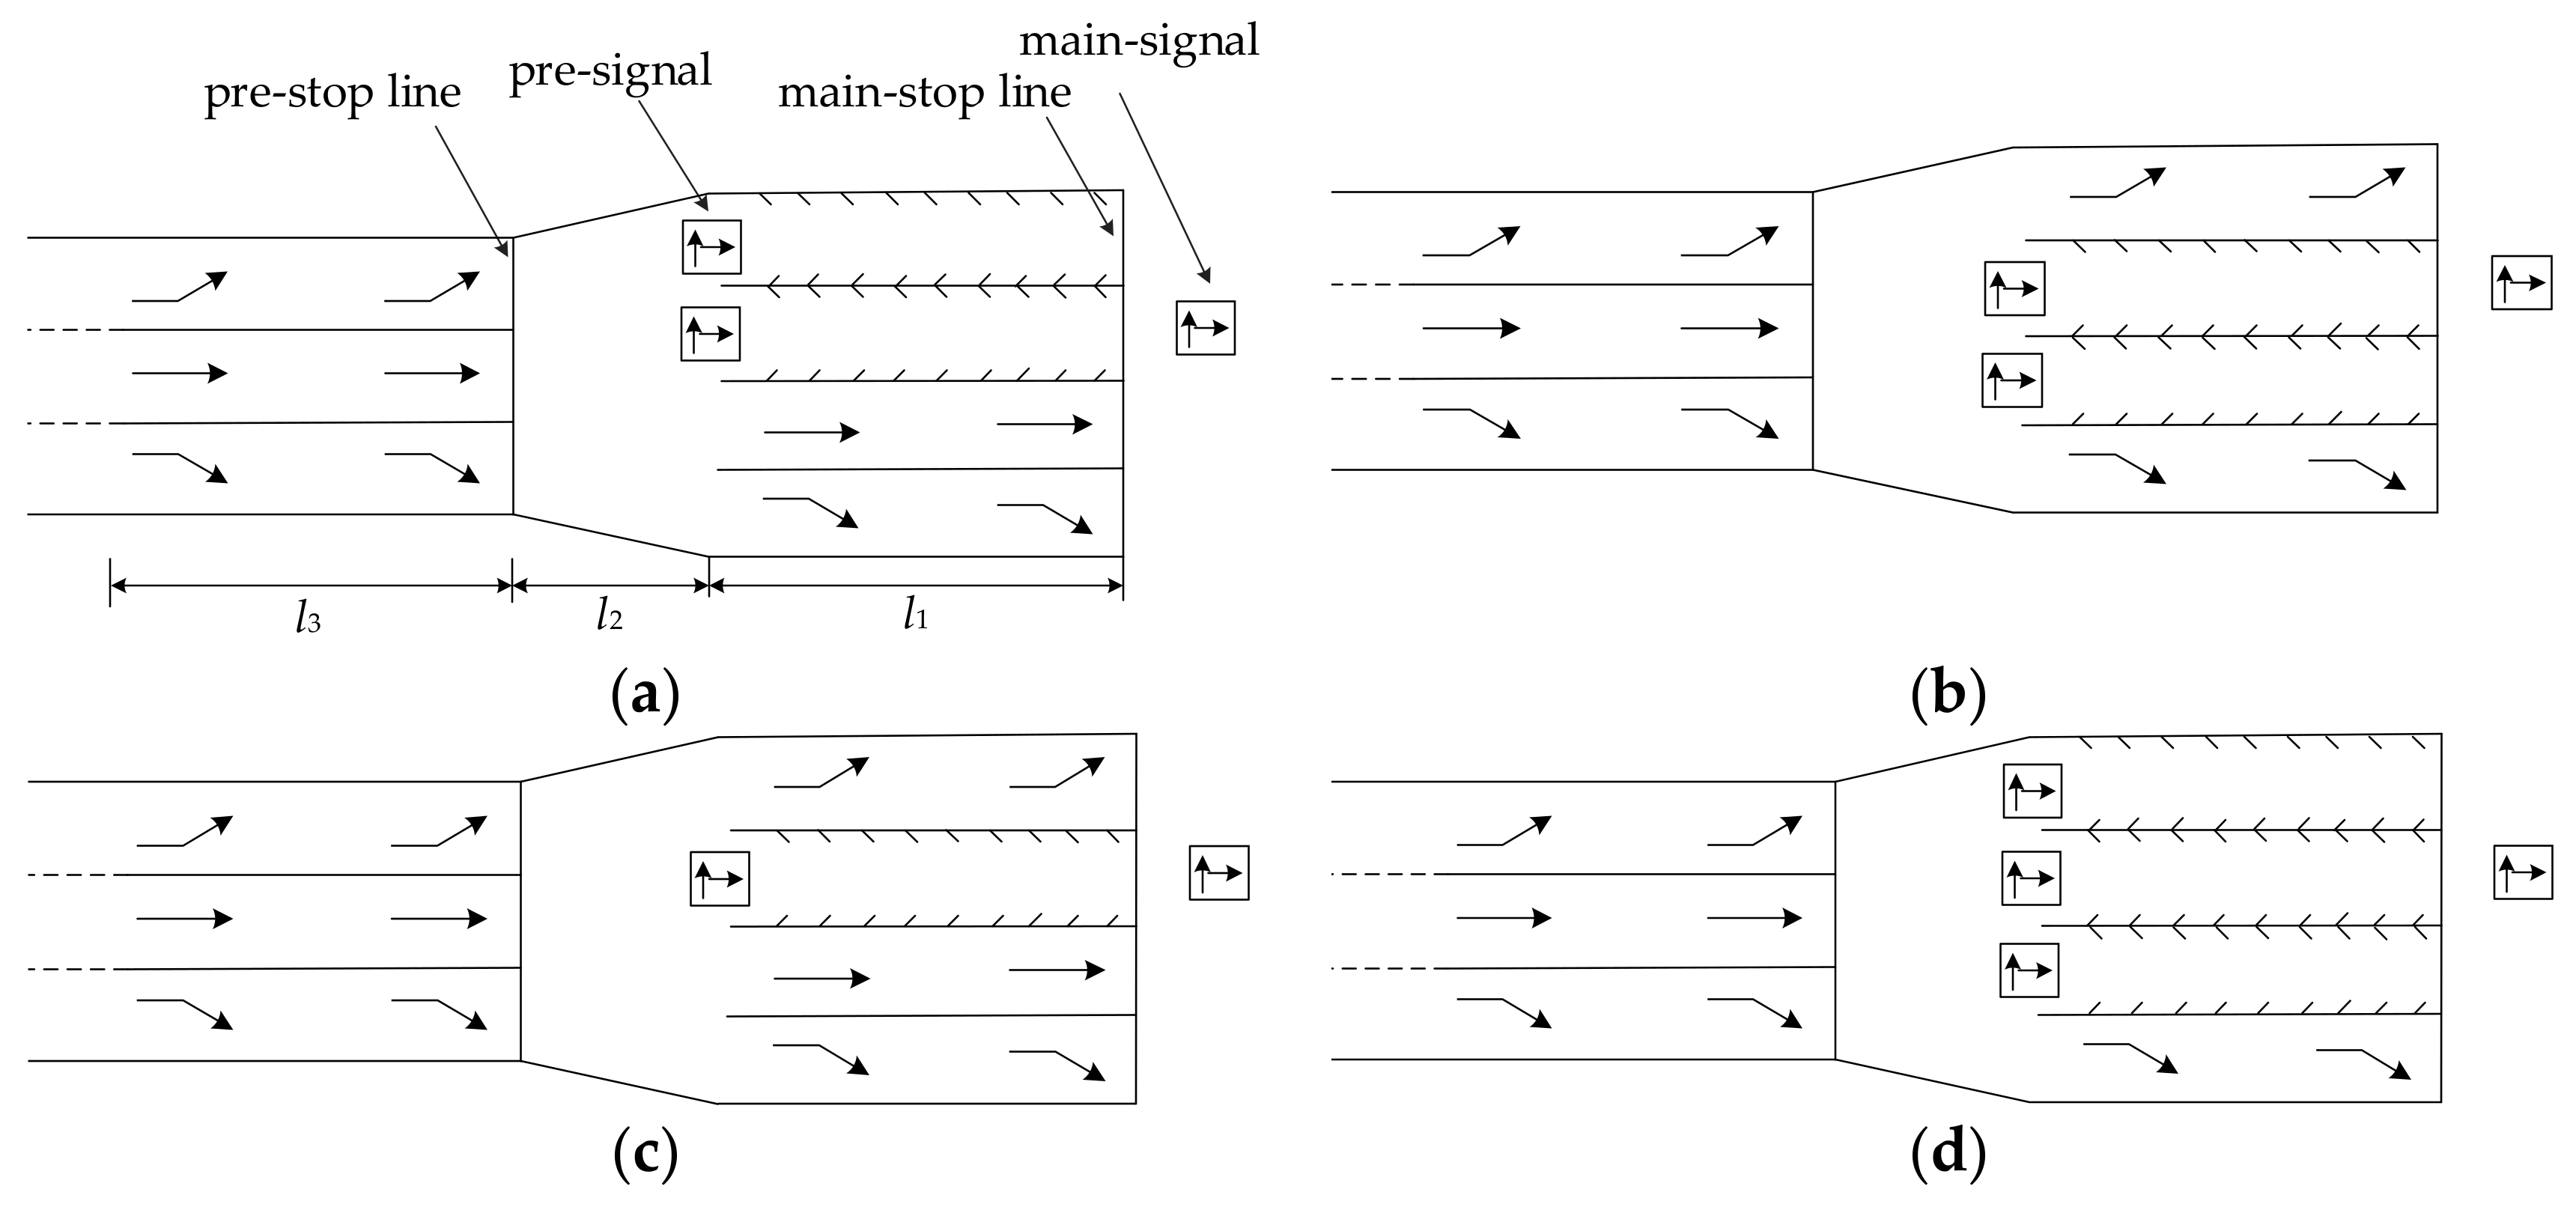
2. Coordinated Control Method Analysis of the Main-Signal and Pre-Signal

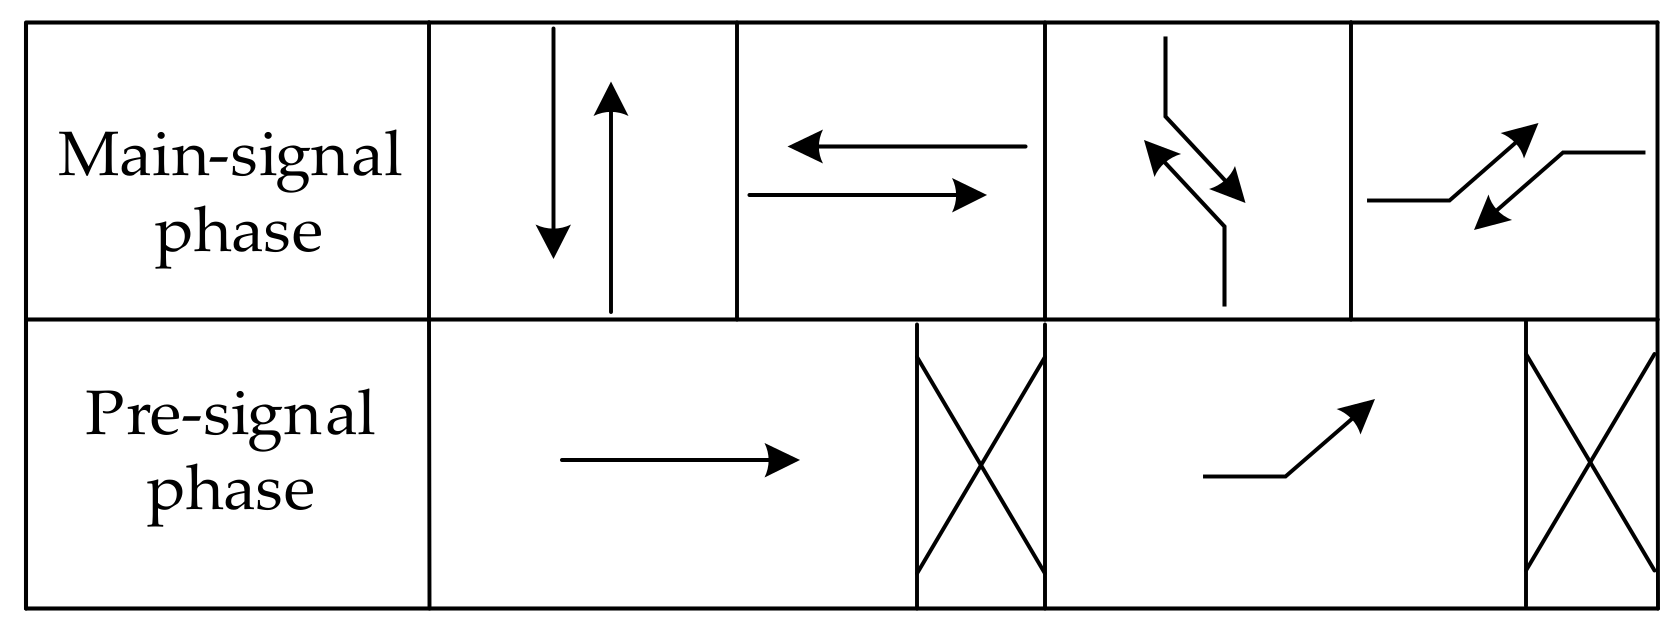
2.1. Coordination of Phase Sequence between the Main-Signal and Pre-Signal

The main-signal adopts a four-phase control method. The phases of intersecting roads are staggered to ensure that the dynamic waiting lane has enough storage time. Taking the entrances presented by Figure 1 as an example, it is shown that the dynamic waiting lanes can serve through and left-turn traffic. The phase sequence of the main-signal and pre-signal is shown in Figure 2.

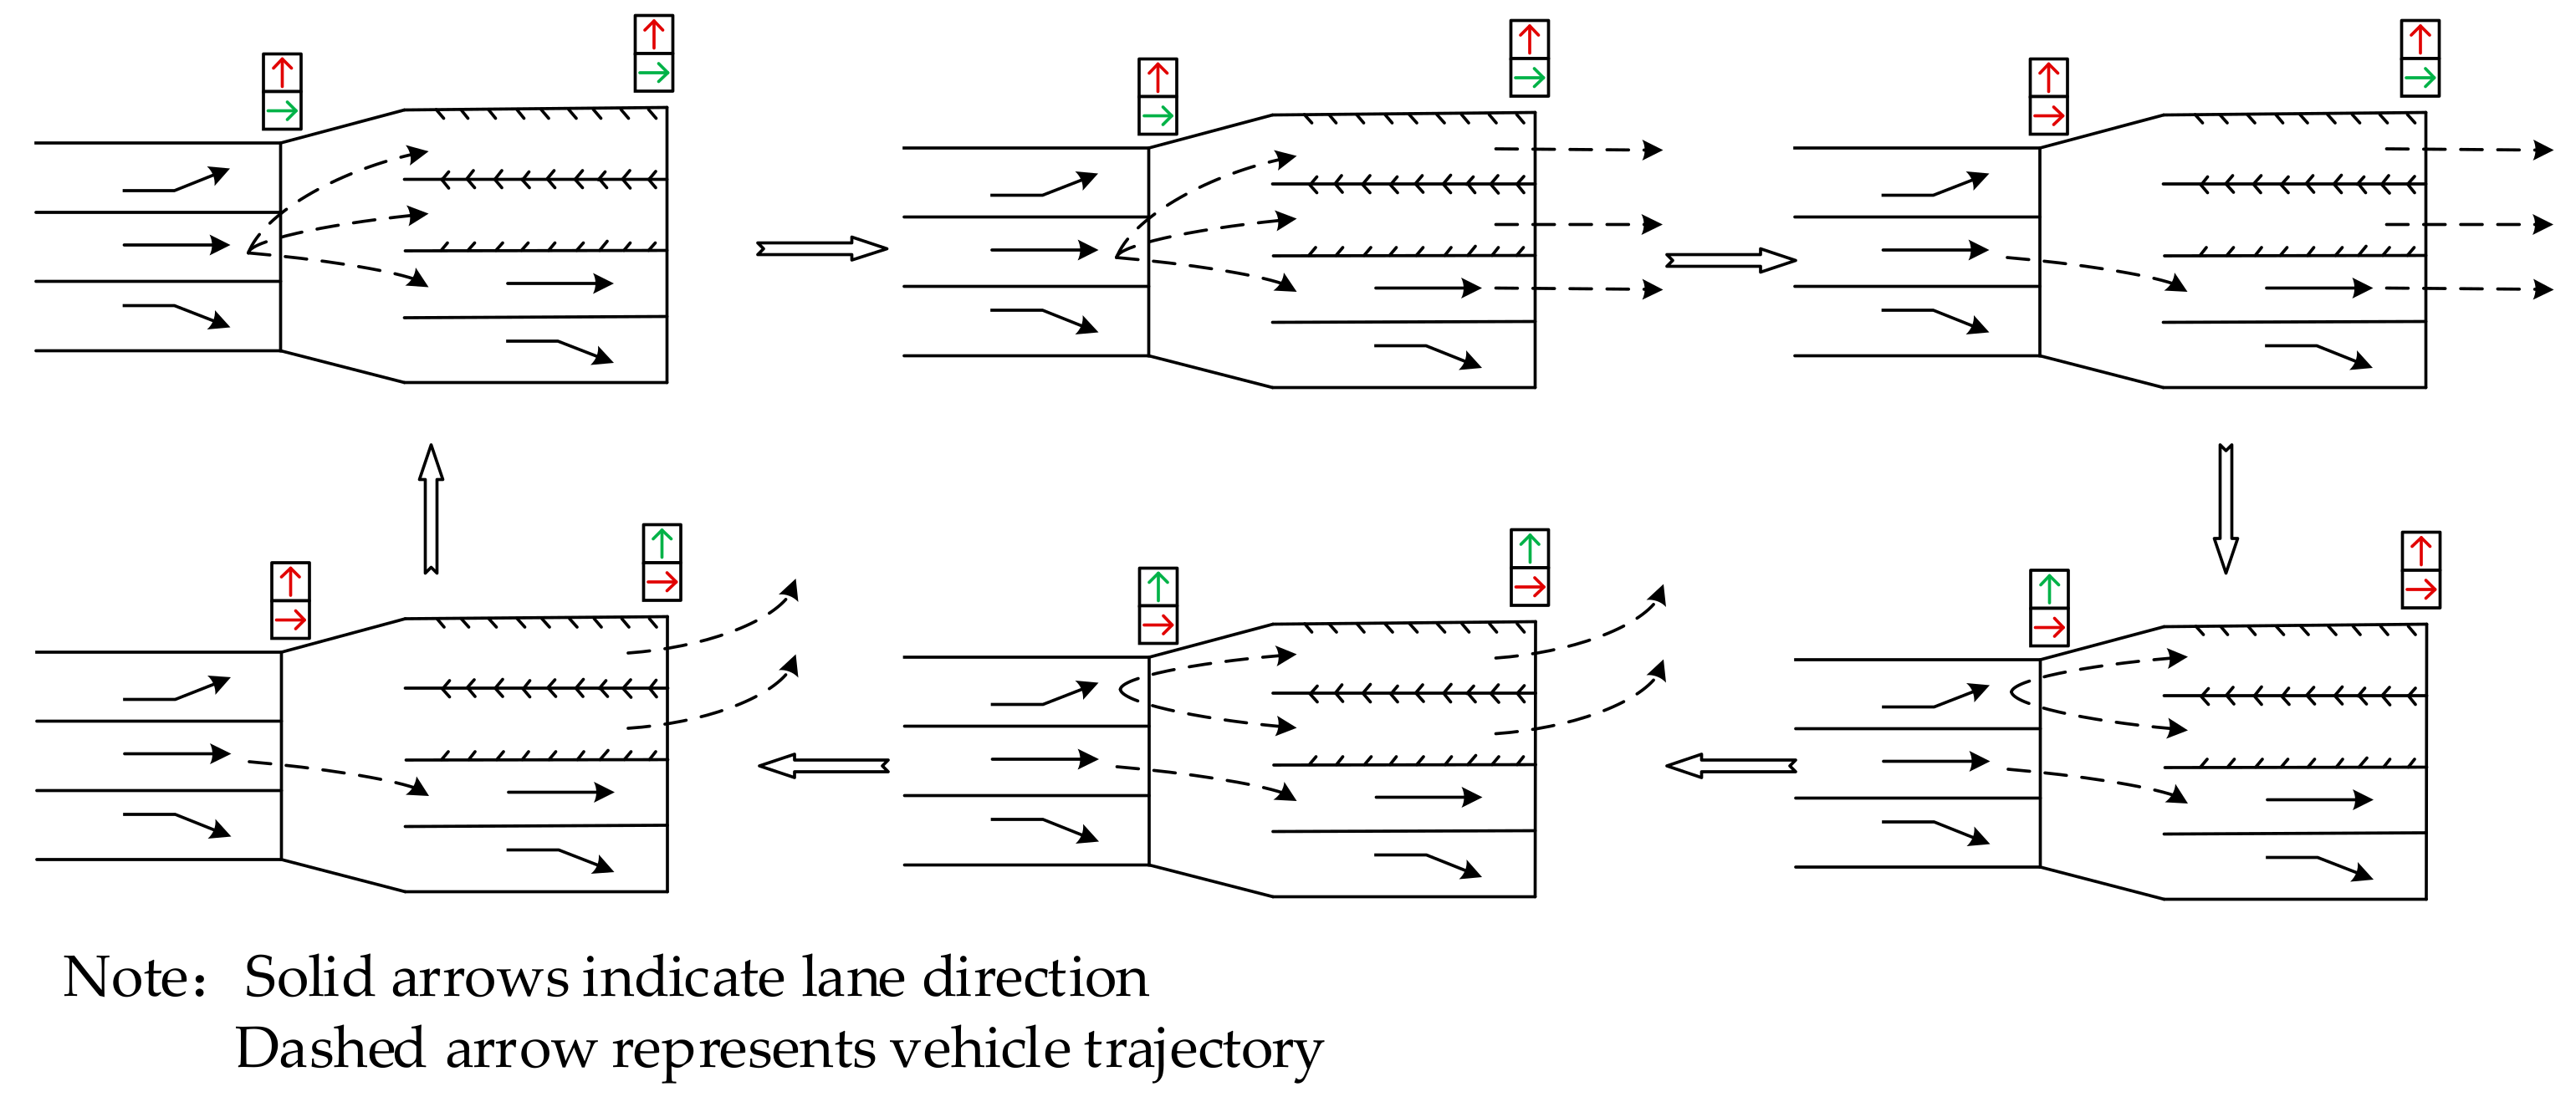
2.2. Coordinated Control Process of the Main-Signal and Pre-Signal

Taking Figure 1a as an example, the two inner lanes of the entrance are set as dynamic waiting lanes and the other two lanes are set as exclusive right-turn and through lanes, respectively. There are not exclusive lanes for left-turn traffic in the main-signal area. The pre-signal is used to control the direction of the dynamic waiting lanes. The dynamic waiting lanes serve through and left-turn traffic alternately in a signal cycle.
The rules of pre-signal control are as follows:
The arrived right-turn vehicles are not controlled by the pre-signal.
The arrived through vehicles drive into the exclusive lane in the main-signal area directly. When the queue of the exclusive through lane is oversaturated, the arrived through vehicles must wait at the pre-stop line. When the green light of the through-phase of the pre-signal is turned on, the through vehicles are permitted drive into dynamic waiting lanes.
The arrived left-turn vehicles should stop and wait in line at the pre-stop line. When the left-turn phase of the pre-signal turns green, the vehicles enter the dynamic waiting lane.
The process of the main-signal and pre-signal coordinately controlling the direction of the dynamic waiting lane is shown in Figure 3.
Based on the above analysis, it is apparent that the timing parameters of the main-signal and pre-signal are the important factors ensuring the smooth operation of dynamic waiting lanes. The coordinated control model of the main-signal and pre-signal to minimize the average delay at the intersection is built in the next section.

3. Coordinated Control Model of the Main-Signal and Pre-Signal

3.1. Vehicle Delay Analysis

The signalized intersection delay is an evaluation indicator that reflects the vehicles’ resistance and the loss of travel time at signalized intersections. Therefore, the objective function of the coordinated control model is to achieve the minimum average delay.
In this section, the computing method of vehicle delay is analyzed based on the study of the arrival and departure process of vehicles at the main-signal and pre-signals.

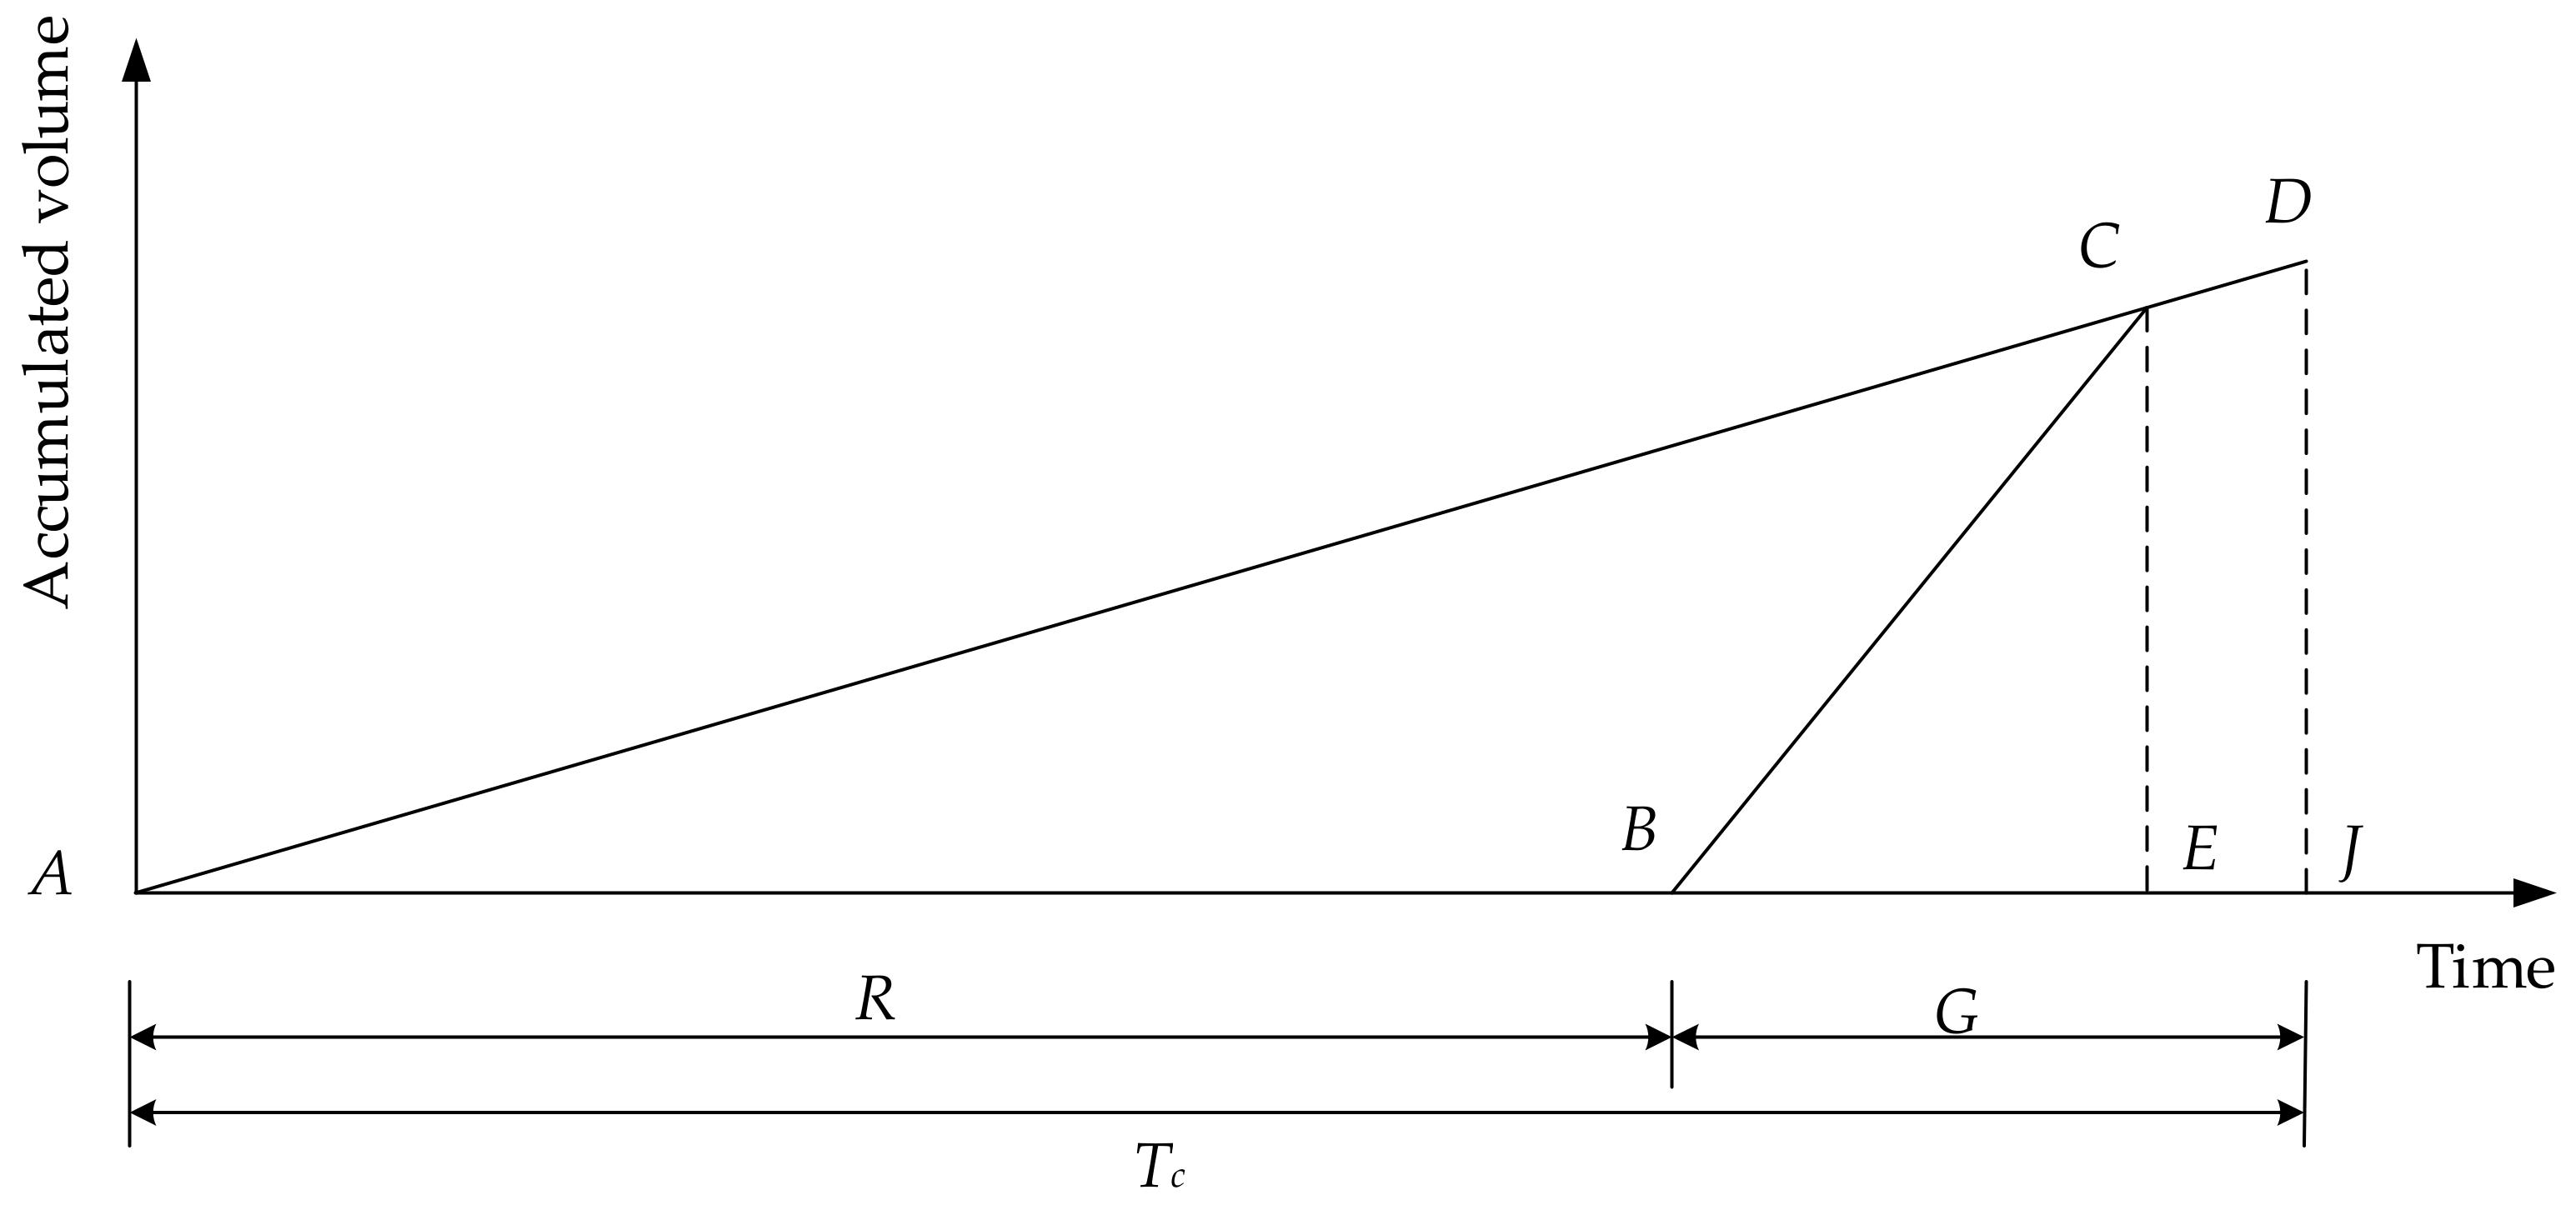
3.1.1. Vehicle Delay Analysis in a Traditional Intersection Entrance (without Pre-Signal)

The computational process of vehicle delay in traditional intersection entrances can be found in Reference [17]. Additionally, Figure 4 shows the arrival and departure process of vehicles at the signal under the traditional traffic control method. The area of the triangle ABC is the delay of all arriving vehicles during a cycle. The formulas of D j k and d j k are as follows.
D j k = S A B C = q j k N j k R j k 2 7200 h t ( N j k h t q j k 3600 )  
d j k = N j k R j k 2 2 h t T c ( N j k h t q j k 3600 )  

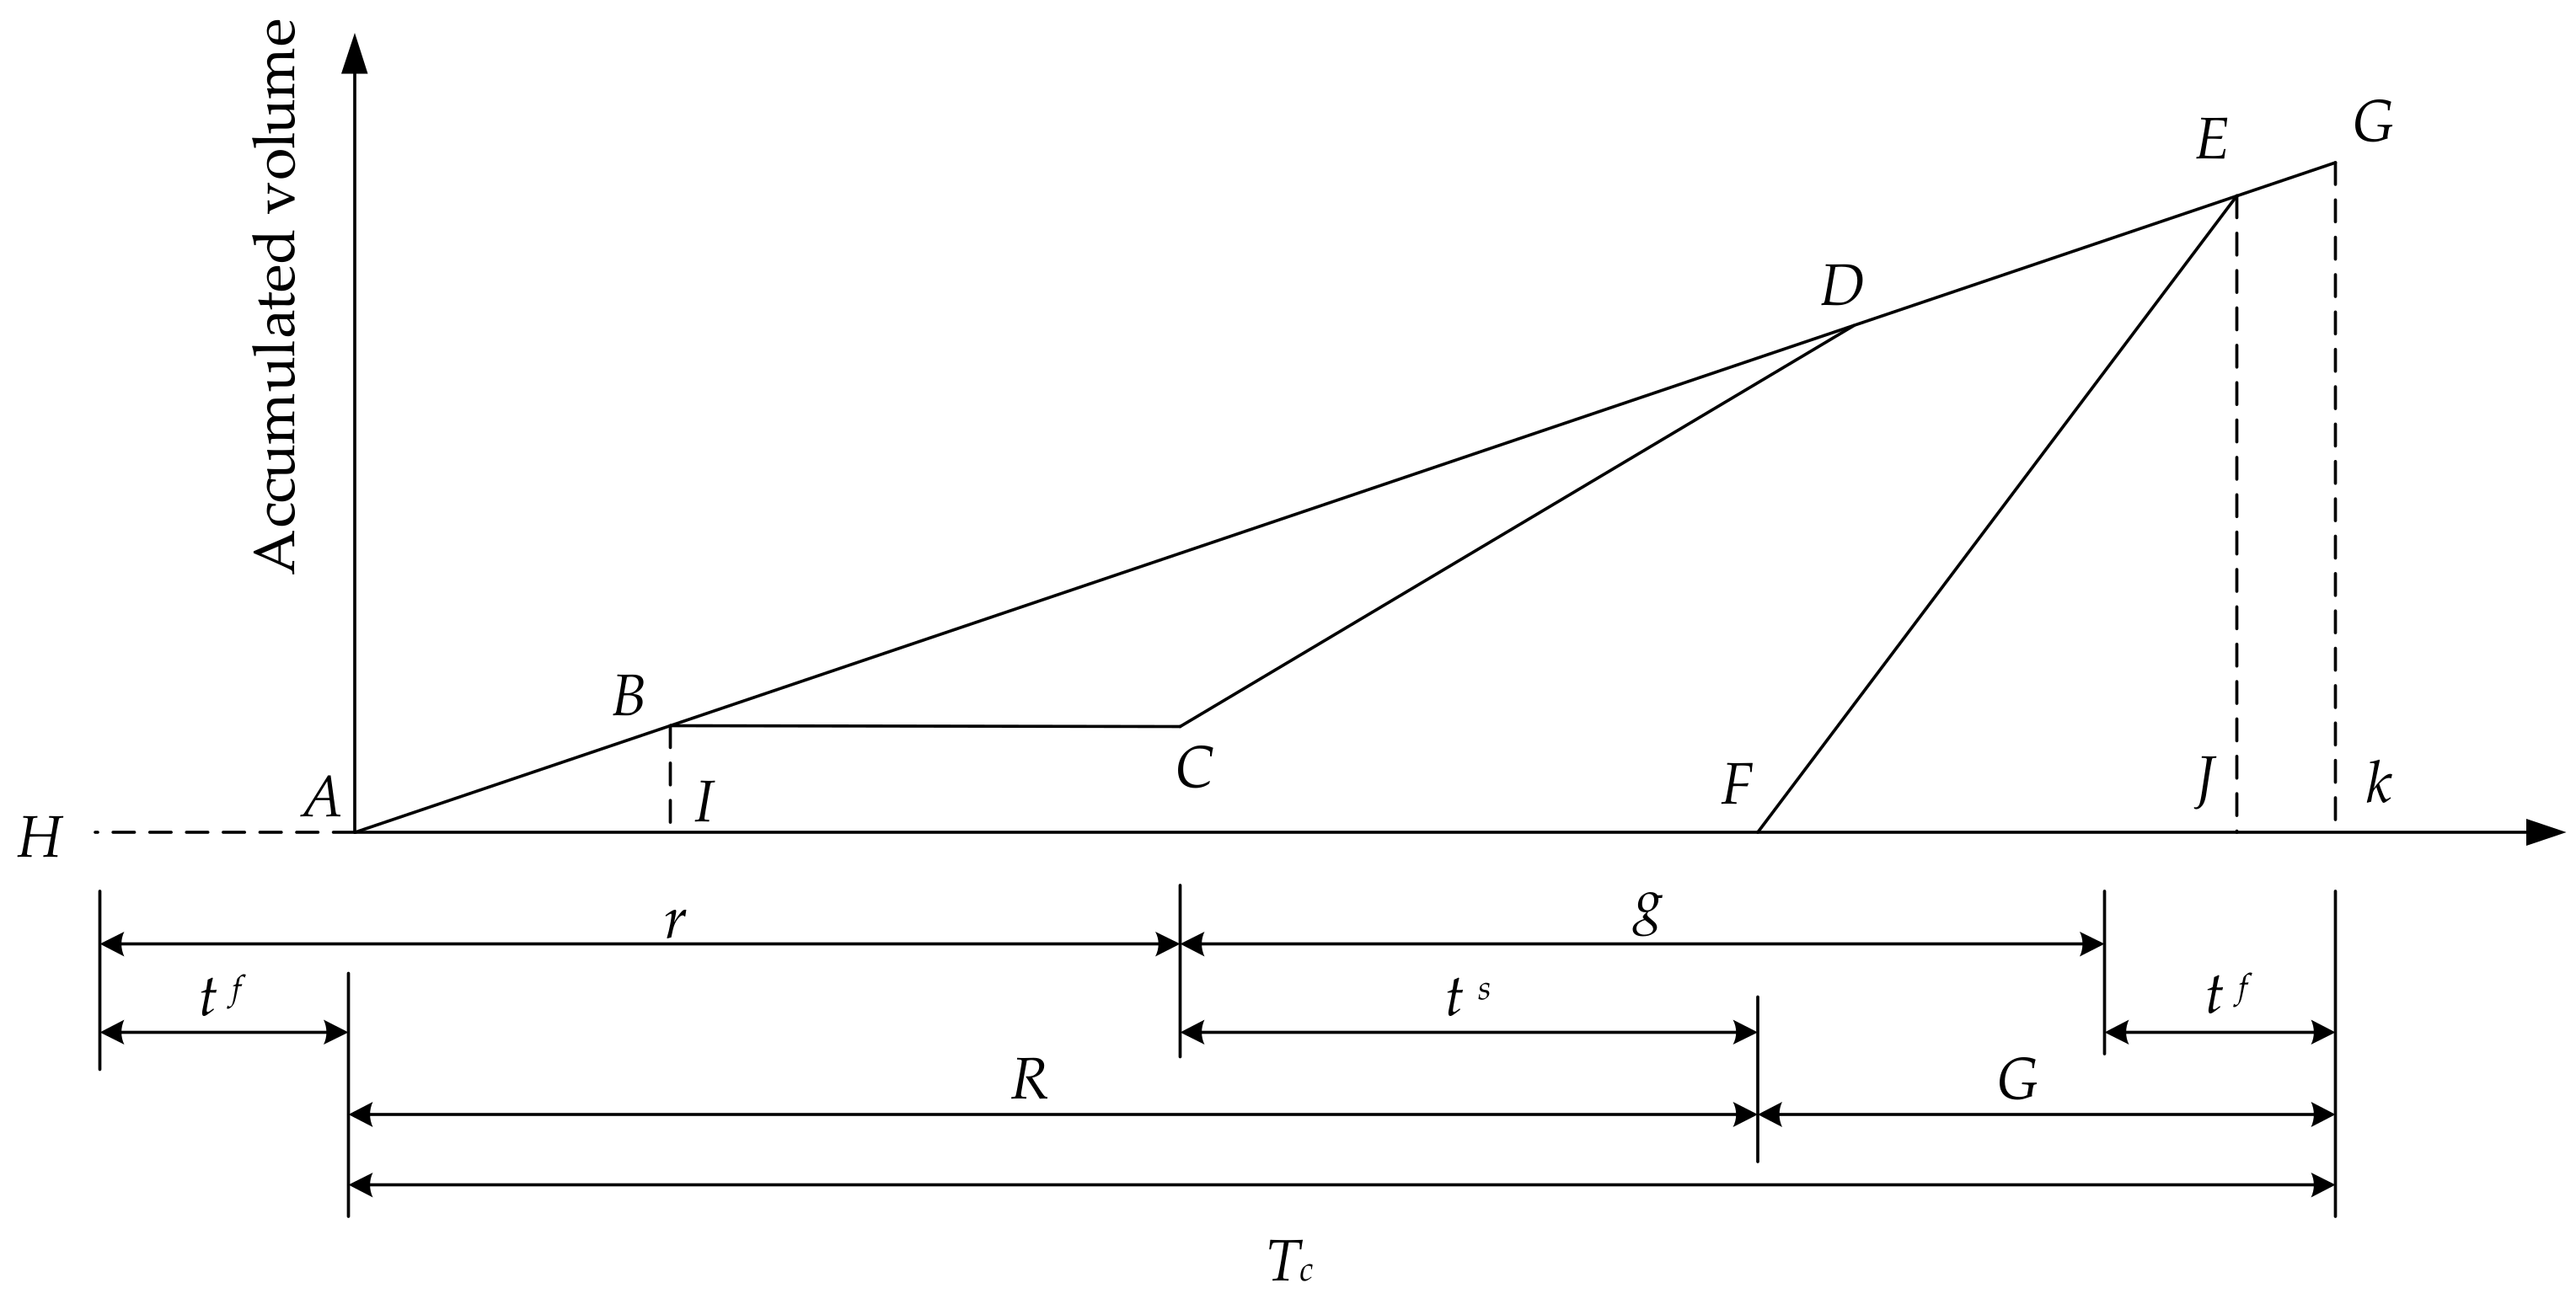
3.1.2. Vehicle Delay at an Intersection Entrance with Pre-Signal Analysis

In order to study the vehicle delay at an entrance with a pre-signal installed, it is necessary to analyze the driving processes of vehicles at the pre-signal and main-signal. In addition, the different forms of canalization of dynamic waiting lanes result in different driving rules for vehicles at the pre-signal and main-signal. Generally, there are two canalization modes. One of the modes involves exclusive lanes for through or left-turn vehicles in the main-signal area (such as the through phase in Figure 1a), and the other does not have exclusive lanes in the main-signal area (such as the left-turn phase in Figure 1a).
(1)
With exclusive lanes in the main-signal area
Figure 5 shows the arrival and departure process of vehicles at the main-signal and pre-signal in the situation with exclusive lanes in the main-signal area. The fold line ABCDG represents both the arrival curve of vehicles at the main-signal and the departure curve of vehicles at the pre-signal. The fold line FEG represents the departure curve of vehicles at the main-signal. The area of the triangle BCD is the total delay of all arriving vehicles at the pre-signal during a cycle. The area of the polygon ABCDEF is the total delay of all arriving vehicles at the main-signal during a cycle.
Based on the above analysis, the area of the triangle AFE is the total delay of all vehicles arriving at the entrance during a cycle.
D j k = D j k p + D j k m = S B C D + S A B C D E F = S A F E = 1 2 R j k Y j k  
Y j k can be obtained by Formula (4) which is equal to the length of segment EJ in Figure 5.
Y j k = N j k + N j k h t q j k R j k 3600 N j k + N j k h t q j k 3600  
The formulas of D j k and d j k are as follows.
D j k = q j k ( N j k + N j k ) R j k 2 7200 h t ( N j k + N j k h t q j k 3600 )  
d j k = D j k q j k 3600 T c = = ( N j k + N j k ) R j k 2 2 T c h t ( N j k + N j k h t q j k 3600 )  
(2)
Without exclusive lanes in the main-signal area
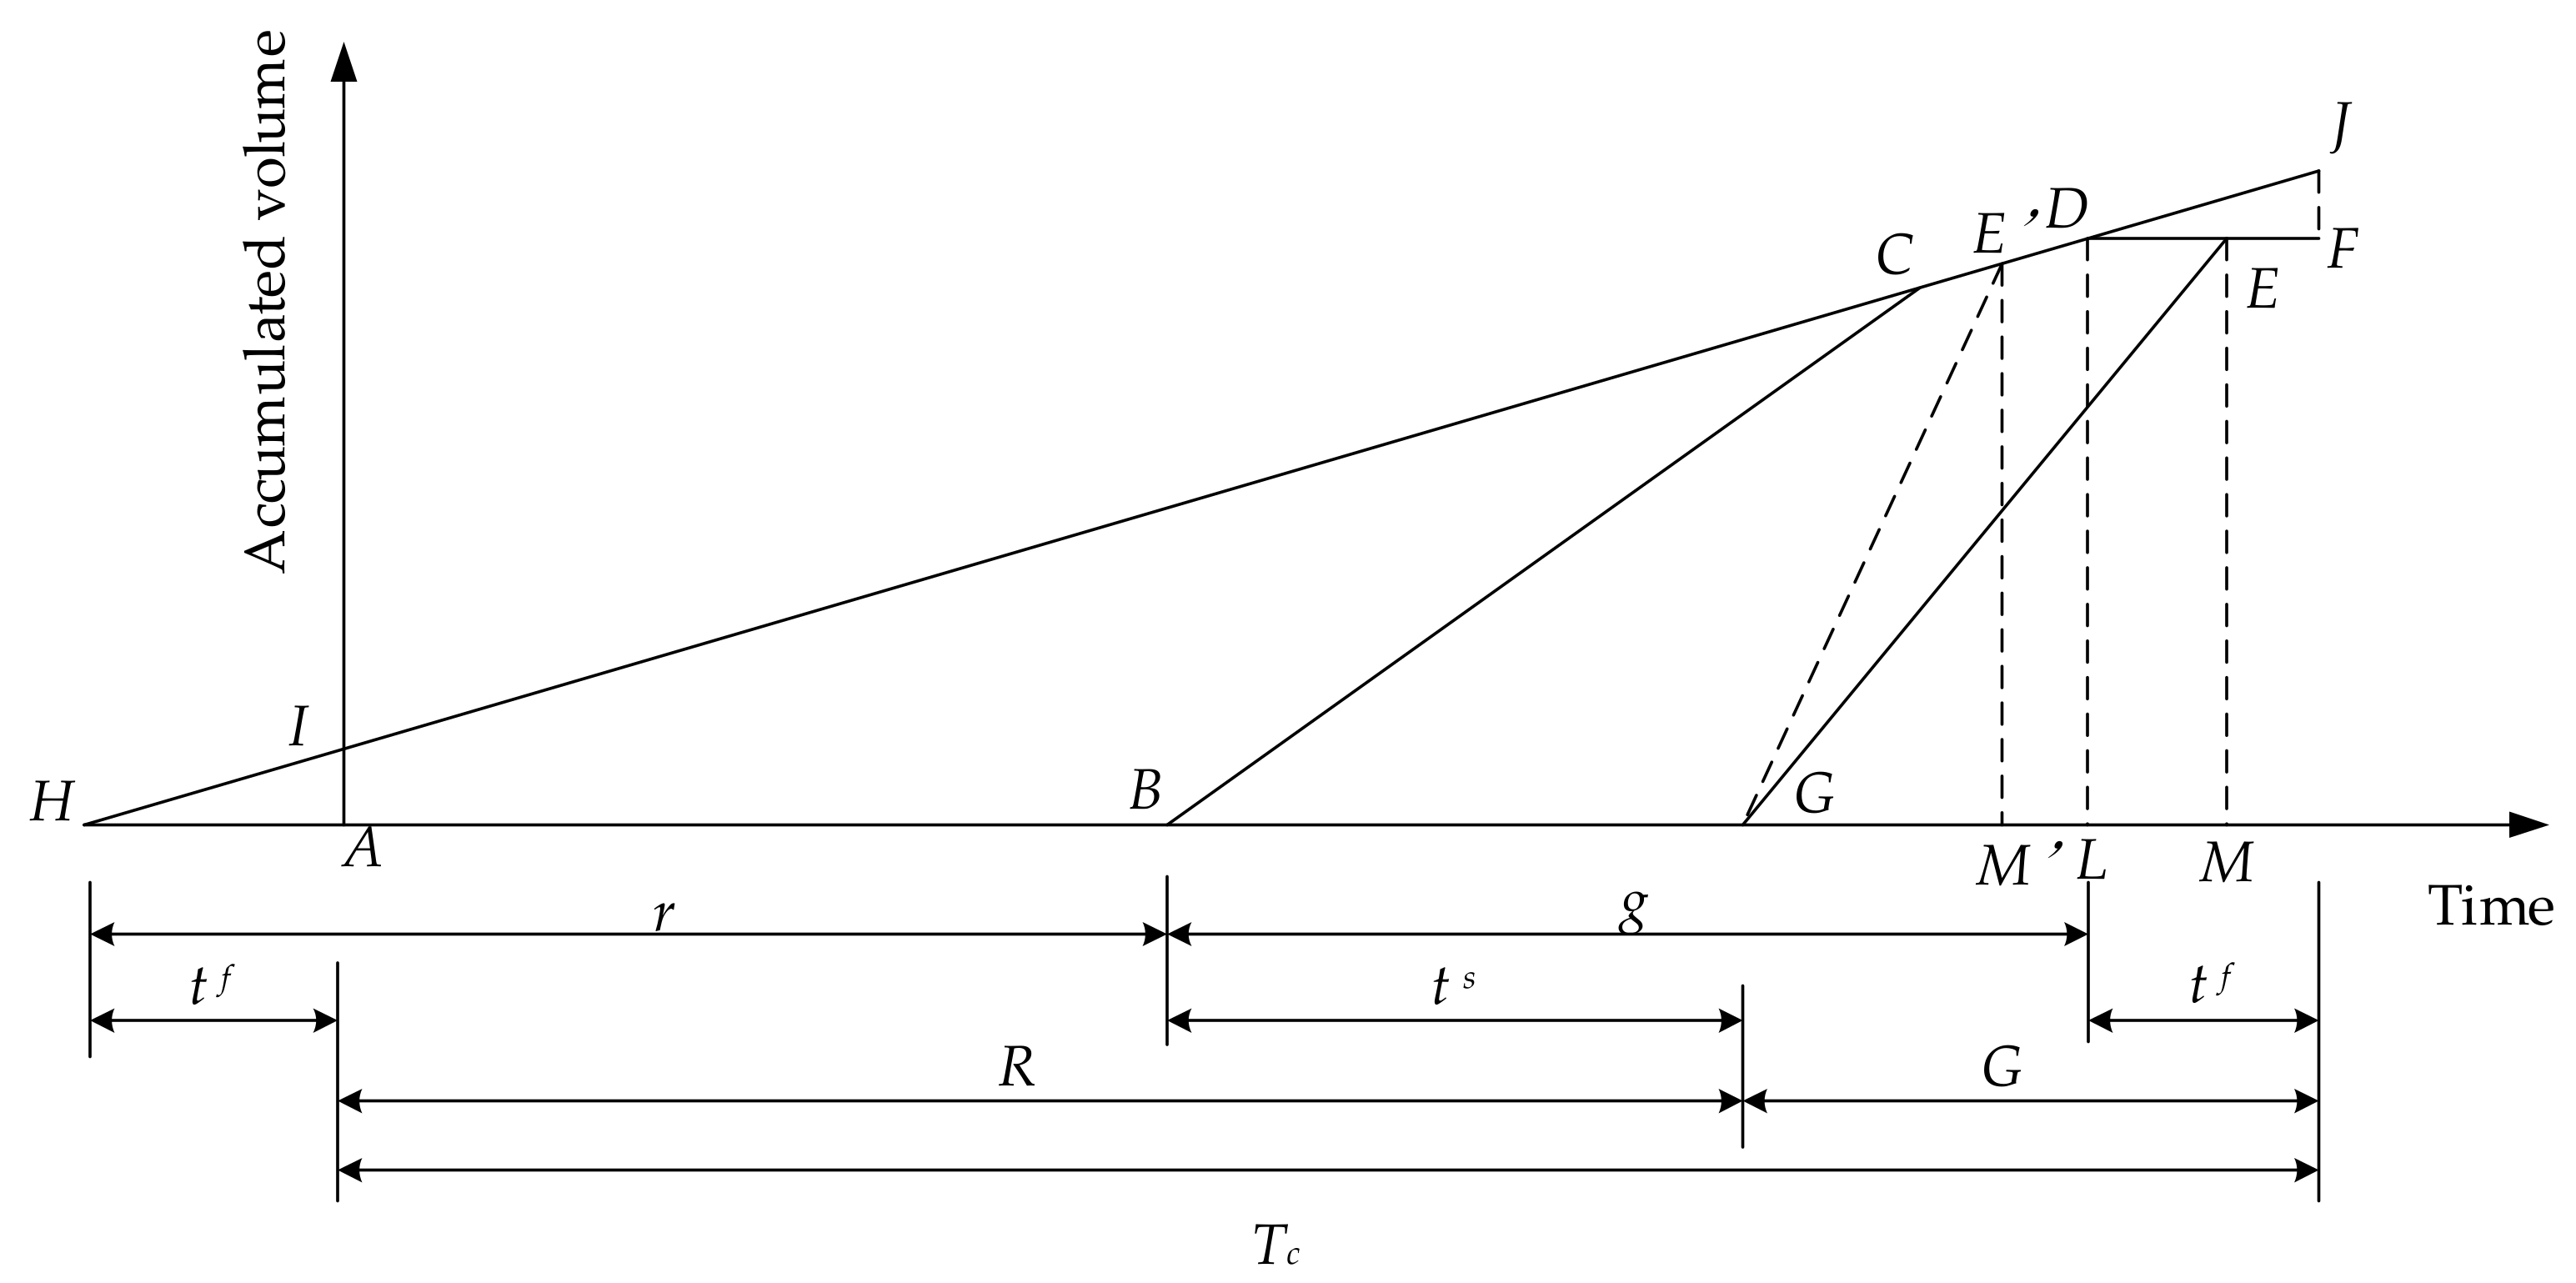
Figure 6 shows the arrival and departure process of vehicles at the main-signal and pre-signal in the situation without exclusive lanes (except right-turn lanes) in the main-signal area. The fold line BCDF represents both the arrival curve of vehicles at the main-signal and the departure curve of vehicles at the pre-signal. If the queue of the main-signal has dissipated at the end of the green light of the pre-signal, the fold line GE’DF represents the departure curve of vehicles at the main-signal. However, if not, the fold line GEF represents the departure curve of vehicles at the main-signal. The line segment AI represents the total number of queued vehicles arriving at the pre-stop line during the period of t f in the previous cycle. The area of quadrilateral ABCI and triangle DFJ is the total delay of all arriving vehicles at the pre-signal during a signal cycle. It can be noted that the area of the triangle DFJ is equal to the area of triangle HAI, based on the knowledge of similar triangles.
Based on the above, the delay analysis below is divided into two conditions.
(1)
Condition 1: The queue of the main-signal has not dissipated at the end of the pre-signal green light.
Condition 1 can be represented by Formula (7).
G j k t j k f < q j k T c h t 3600 N j k  
The area of the polygon BGEDC is the total delay of all arrived vehicles at the main-signal during a signal cycle. It can be known that the area of the quadrangle HGED is the total delay per cycle.
D j k = D j k p + D j k m = S H B C + S B G E D C = S H G E D = 1 2 ( Z j k + t j k f + R j k ) Y j k  
Here Z j k is equal to the length of the segment DE in Figure 6. Y j k is equal to the accumulated volume in a signal cycle as well as equal to the length of the segment EM.
Y j k = q j k 3600 T c  
The computational process of Z j k is as shown in Formula (10).
Z j k = q j k T c 3600 h t N j k + t f G j k  
The formulas of D j k and d j k are as follows.
D j k = 1 2 ( q j k T c h t 3600 N j k G j k + R j k + 2 t f ) q j k T c 3600  
d j k = D j k q j k T c 3600 = 1 2 ( q j k T c h t 3600 N j k G j k + R j k + 2 t f )  
(2)
Condition 2: the queue at the main signal has dissipated at the end of the pre-signal green light.
Condition 2 can be represented by Formula (13).
G j k t j k f q j k T c h t 3600 N j k  
The area of the quadrilateral BGE’C is the delay of all arrived vehicles at the main-signal during a cycle. The area of the triangle HGE’ is the total delay per cycle.
D j k = D j k p + D j k m = S H B C + S B G E C = S H G E = 1 2 ( t j k f + R j k ) Y j k  
The result of Y j k was determined by Formula (15), which is equal to the length of the segment E’M’ in Figure 6.
Y j k = q j k 3600 N j k h t ( R j k + t f ) N j k h t q j k 3600  
The formulas of D j k and d j k are as follows.
D j k = q j k 3600 N j k h t ( R j k + t f ) 2 2 ( N j k h t q j k 3600 )  
d j k = D j k q j k 3600 T c = N j k h t ( R j k + t f ) 2 2 T c ( N j k h t q j k 3600 )  

3.1.3. Average Delay at the Intersection

The expression of the average delay is expressed by Formula (18).
d = j k D j k j k q j k  

3.2. Analysis of the Interrelations of Timing Parameters between the Main-Signal and Pre-Signal

3.2.1. The Signal Cycle

(1) In order to coordinate the main-signal and pre-signals, the cycle lengths of the main signal and pre-signals must be equal.
i ( G i + t y ) = T c  
k ( g j k + t y + t j k f ) = T c  
(2) The mathematical expression of the signal cycle period limit [18] is:
20 n T c 60 n  

3.2.2. The Minimum Green Time

The length of the green time should satisfy the constraints of the minimum green time:
G i G i min  
g j k g j k min  

3.2.3. The Maximum Saturation

The saturation of intersection lanes should be below the maximum saturation:
X j k X j k max  
x j k x j k max  

3.2.4. Early Finishing Time of the Green Phase of the Pre-Signal

In order to ensure that vehicles in the dynamic waiting lanes can drive away from the intersections before the end of the green phase of the main-signal, the green phase of the pre-signal should end early enough to allow the dynamic waiting lane to empty.
t j k f l 1 j + l 2 j v l  

3.2.5. Early Starting Time of the Green Phase of the Pre-Signal

The function of an early starting time of the green phase of the pre-signal is to provide time for vehicles to enter the dynamic waiting lanes before the green light of the main-signal turns on.
t j k s = G i 1 + t y  
The direction “jk” corresponds to the phase i of the main-signal. The phase (i1) is phase directly preceding phase i. Thus, if i − 1 = 0, G i 1 = G 4 .

3.2.6. The Capacity

The relationship between the main-signal capacity and pre-signals capacity is expressed by Formula (28).
CAP j k cap j k + l 1 j h d N j k  

3.3. Coordinated Control Model of the Main-Signal and Pre-Signal

Based on the above analysis, the coordinated control model is proposed, taking the minimum average delay (Formula (18)) as the objective function and Formulas (19)–(28) as the constraint conditions. The model is described below:
min d
s.t. Formulas (19)–(28)

4. Case Study

In order to verify the feasibility of the control model, the intersection of Jiaoshan Road and Xuefu Road in Zhenjiang City located in Jiangsu Province, China was selected as an example. The survey data was applied to the proposed model and optimized using MATLAB.

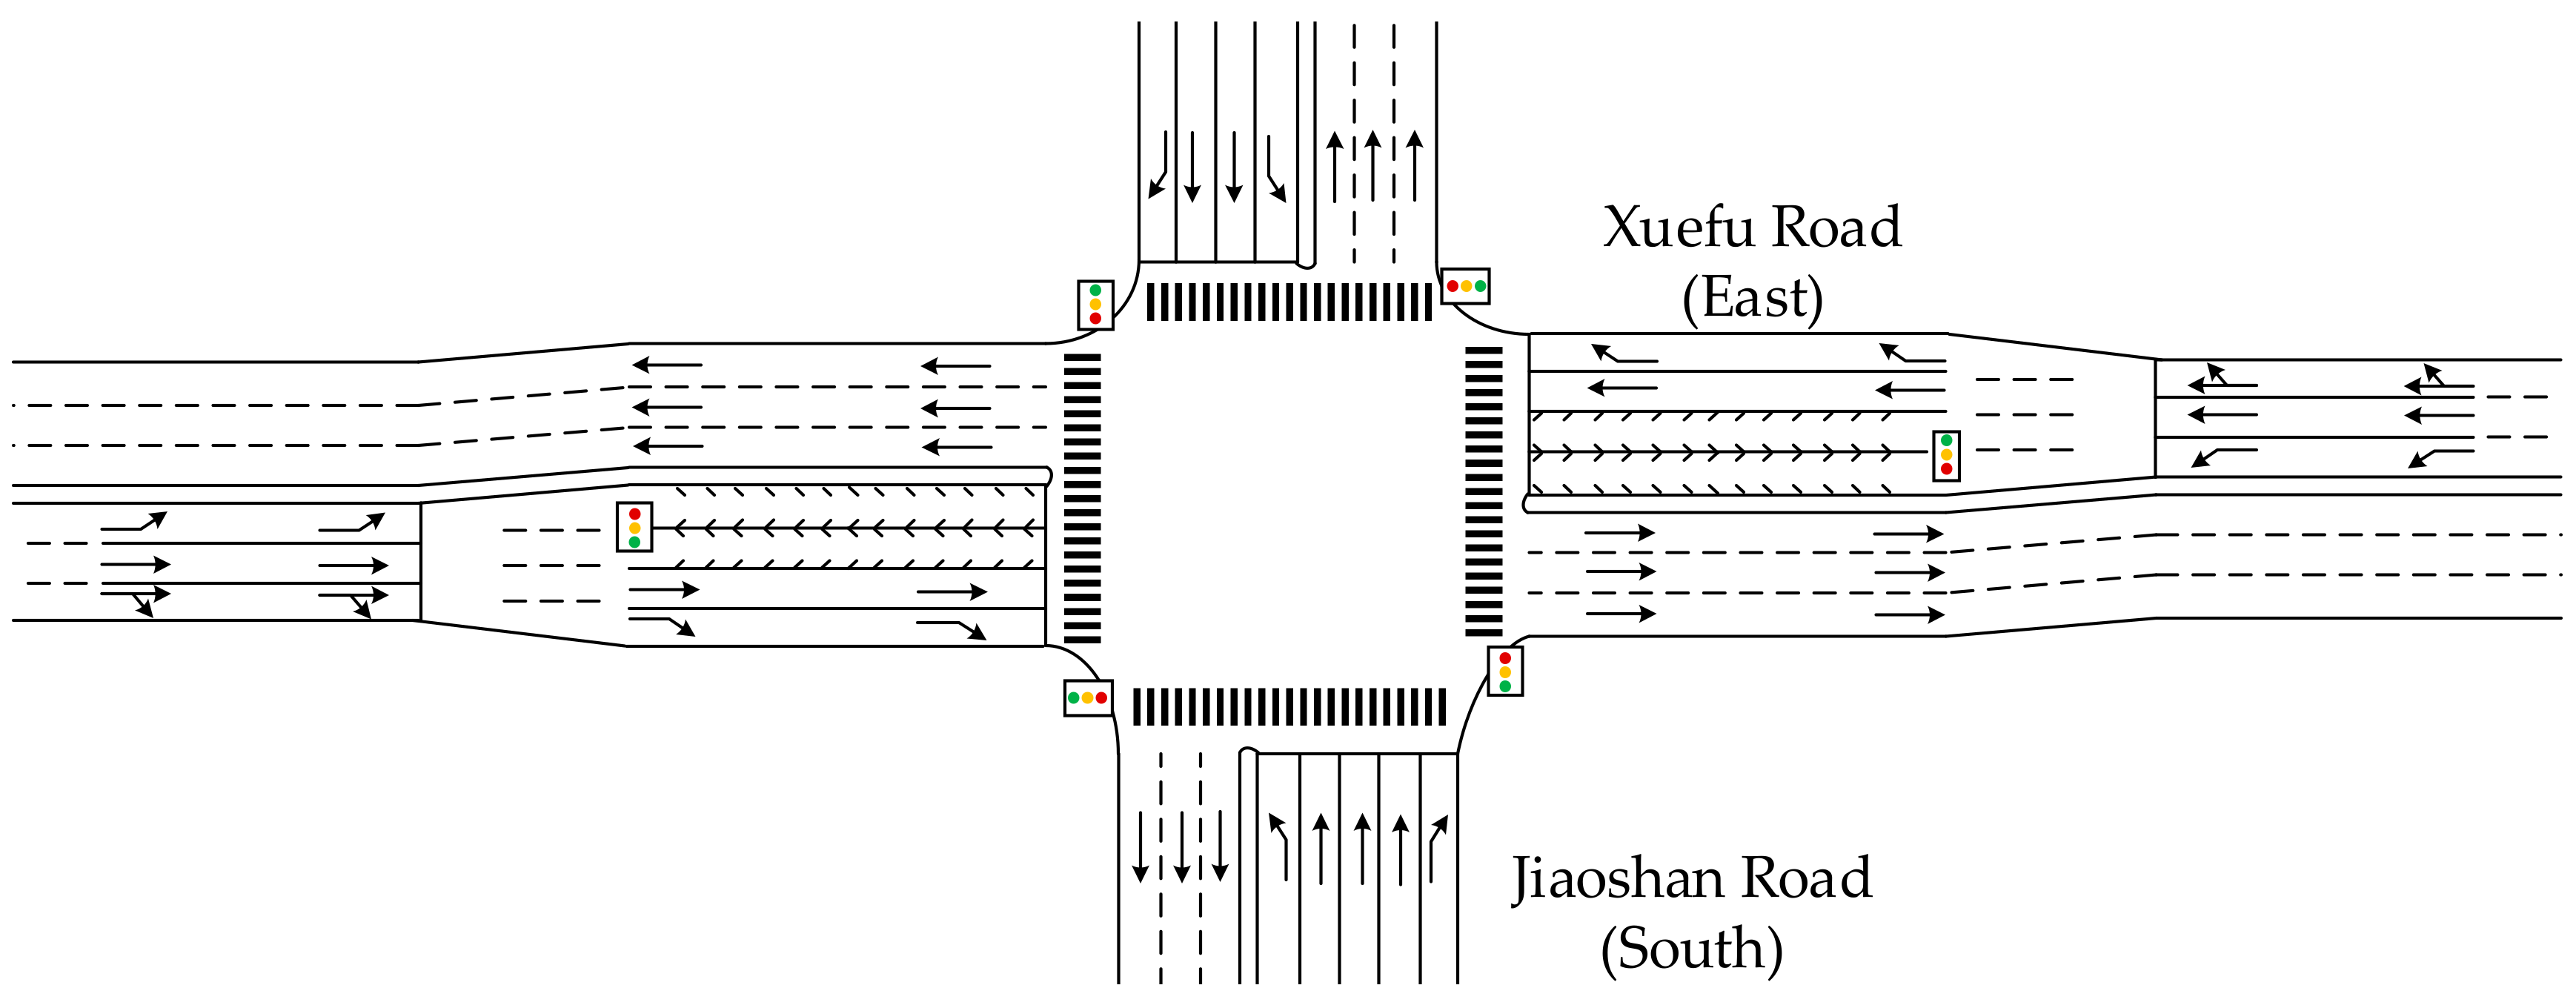
4.1. Example Intersection

The intersection analyzed in this case study is a typical four-phase signal-controlled intersection. The current number of intersection lanes, traffic volume, and signal timing scheme of the intersection are shown in Table 1, Table 2 and Table 3.

4.2. The Application of the Proposed Model

According to the current channelization and traffic volumes, the two inner lanes of the east and west entrances were set as dynamic waiting lanes for through and left-turn traffic. The canalization length of lanes [19] and plane diagram of the intersection after the reorganization are shown in Table 4 and Figure 7.
The genetic algorithm is used to optimize the target. T c is set as the optimization target. The range of T c should be set according to Formulas (21) and (22). The minimum average delay at the intersection is the fitness function. Formulas (24), (25), and (28) are penalty functions. The population size is set to 100 and the number of elites is 10. The ratio of cross descendants is 0.5. The maximum purification algebra and stop algebra are set to 30 generations. The fitness function value deviation is 1 × 10−100.
Figure 8 shows the optimized timing scheme of the main-signal and pre-signal that resulted from the proposed model. The length of the signal cycle is 105 s. The length of the yellow time for all phases is 3 s.

4.3. Average Delay Analysis

The delays of the intersection are obtained from the proposed delay calculation method. The average delay at the intersection under traditional canalization (before setting dynamic waiting lanes) is 70.4 s per vehicle and the average delay at the intersection under the proposed model (after setting dynamic waiting lanes) is 48.0 s per vehicle. Table 5 shows the delay of all directions of the intersection. It was found that the proposed control model could reduce the traffic delay effectively under the current traffic volume condition.

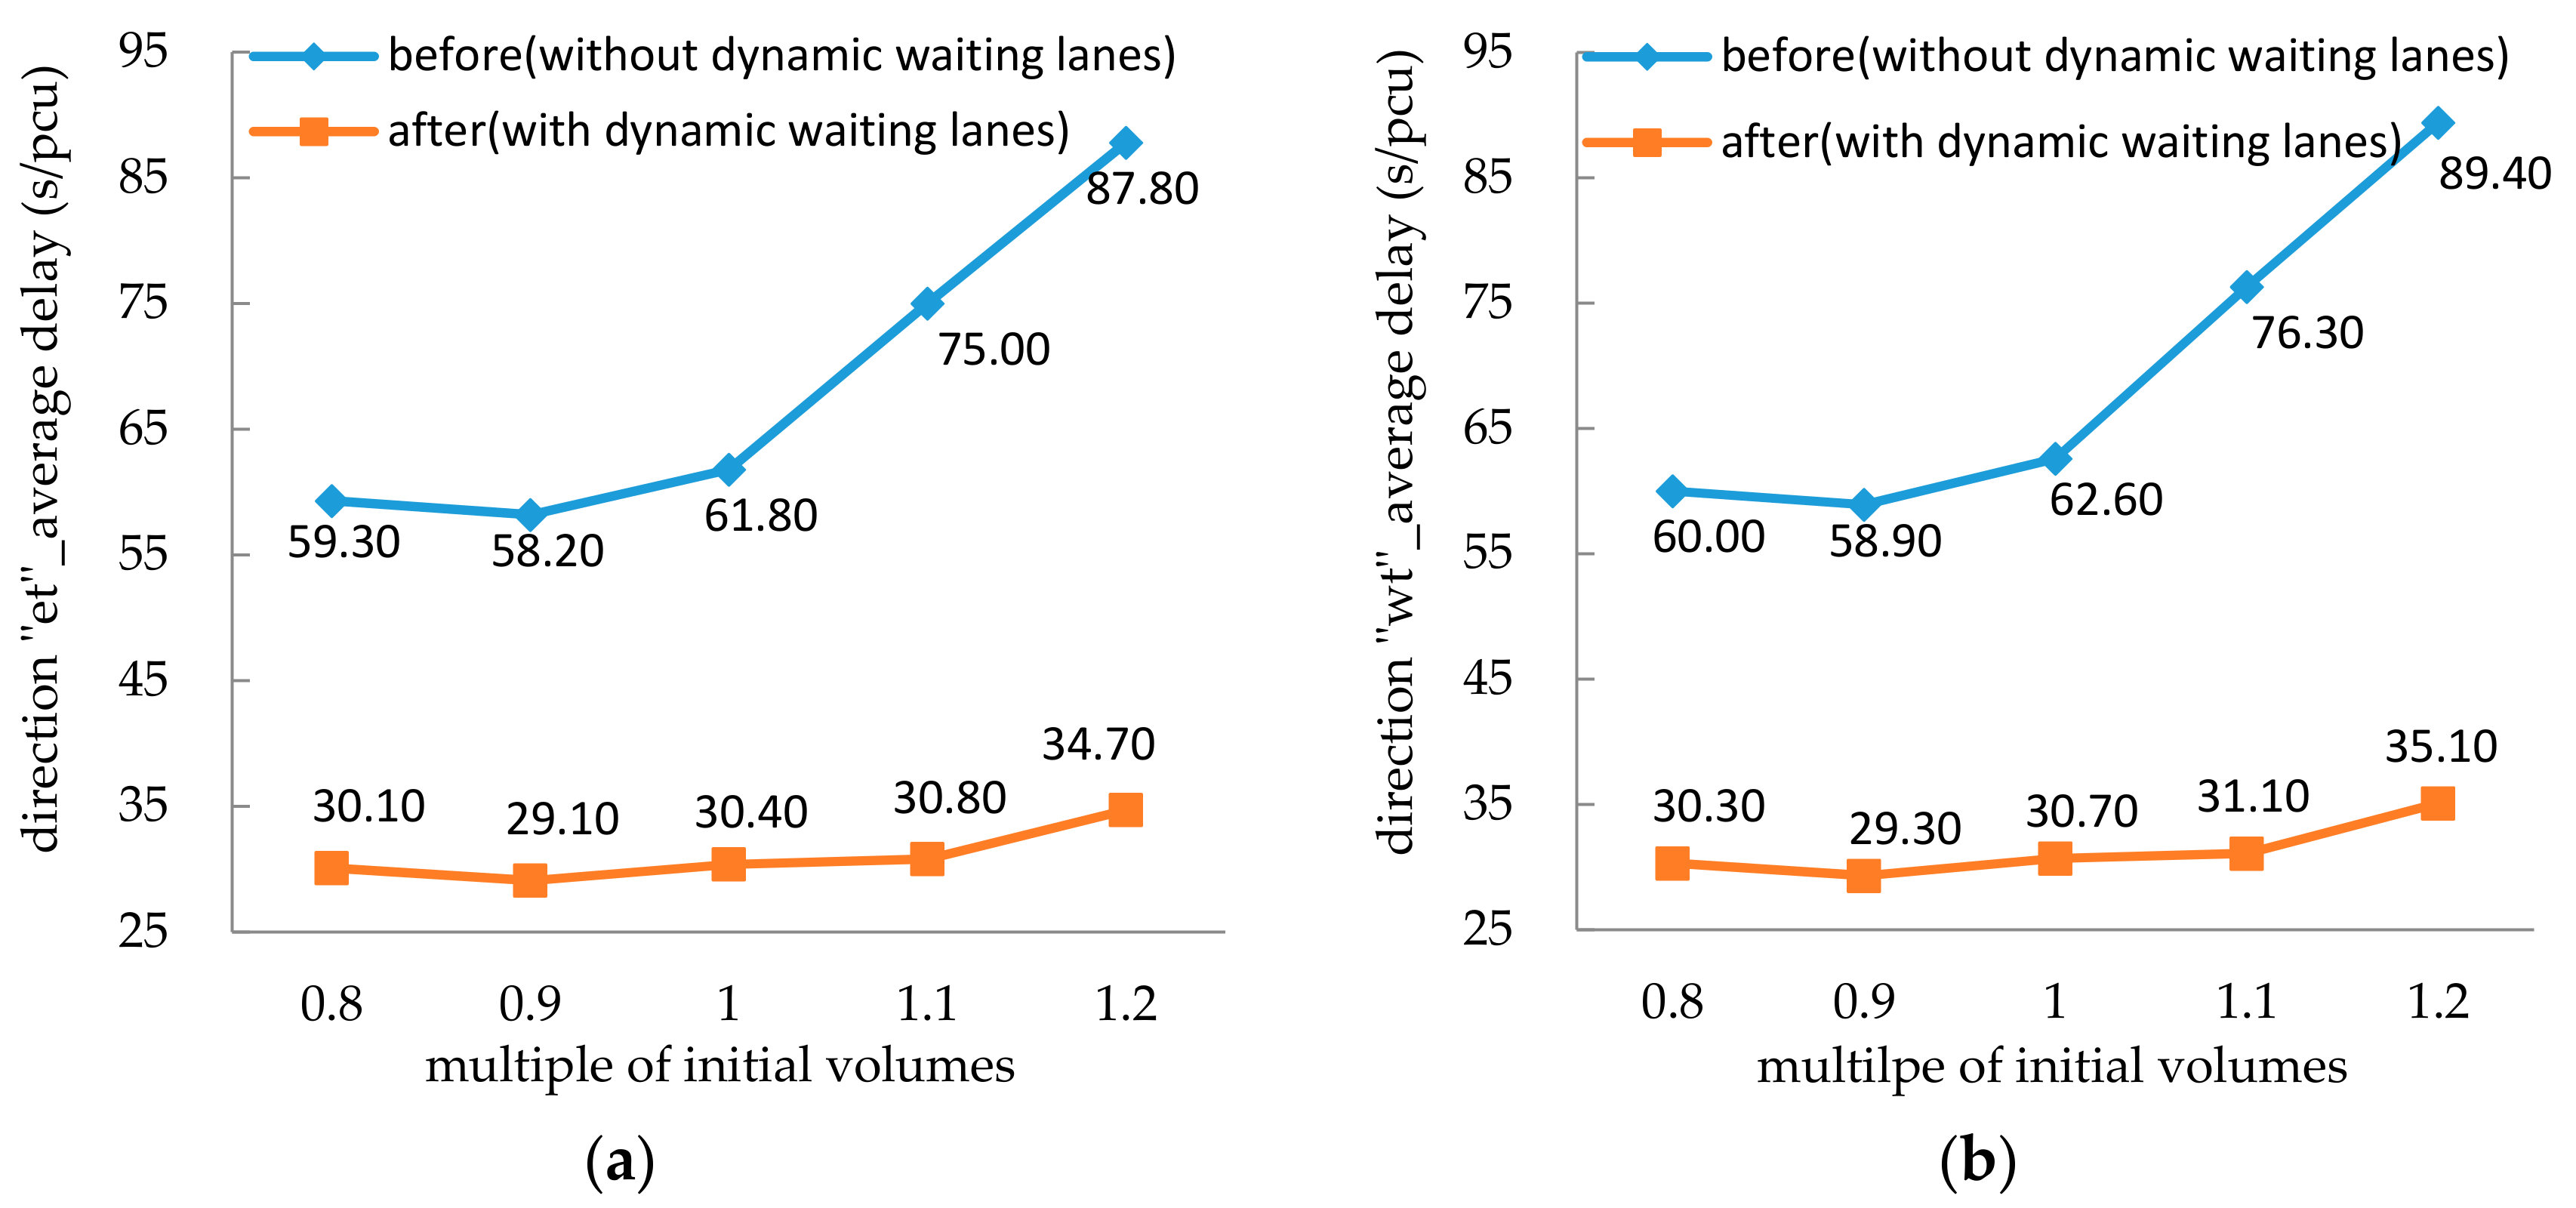
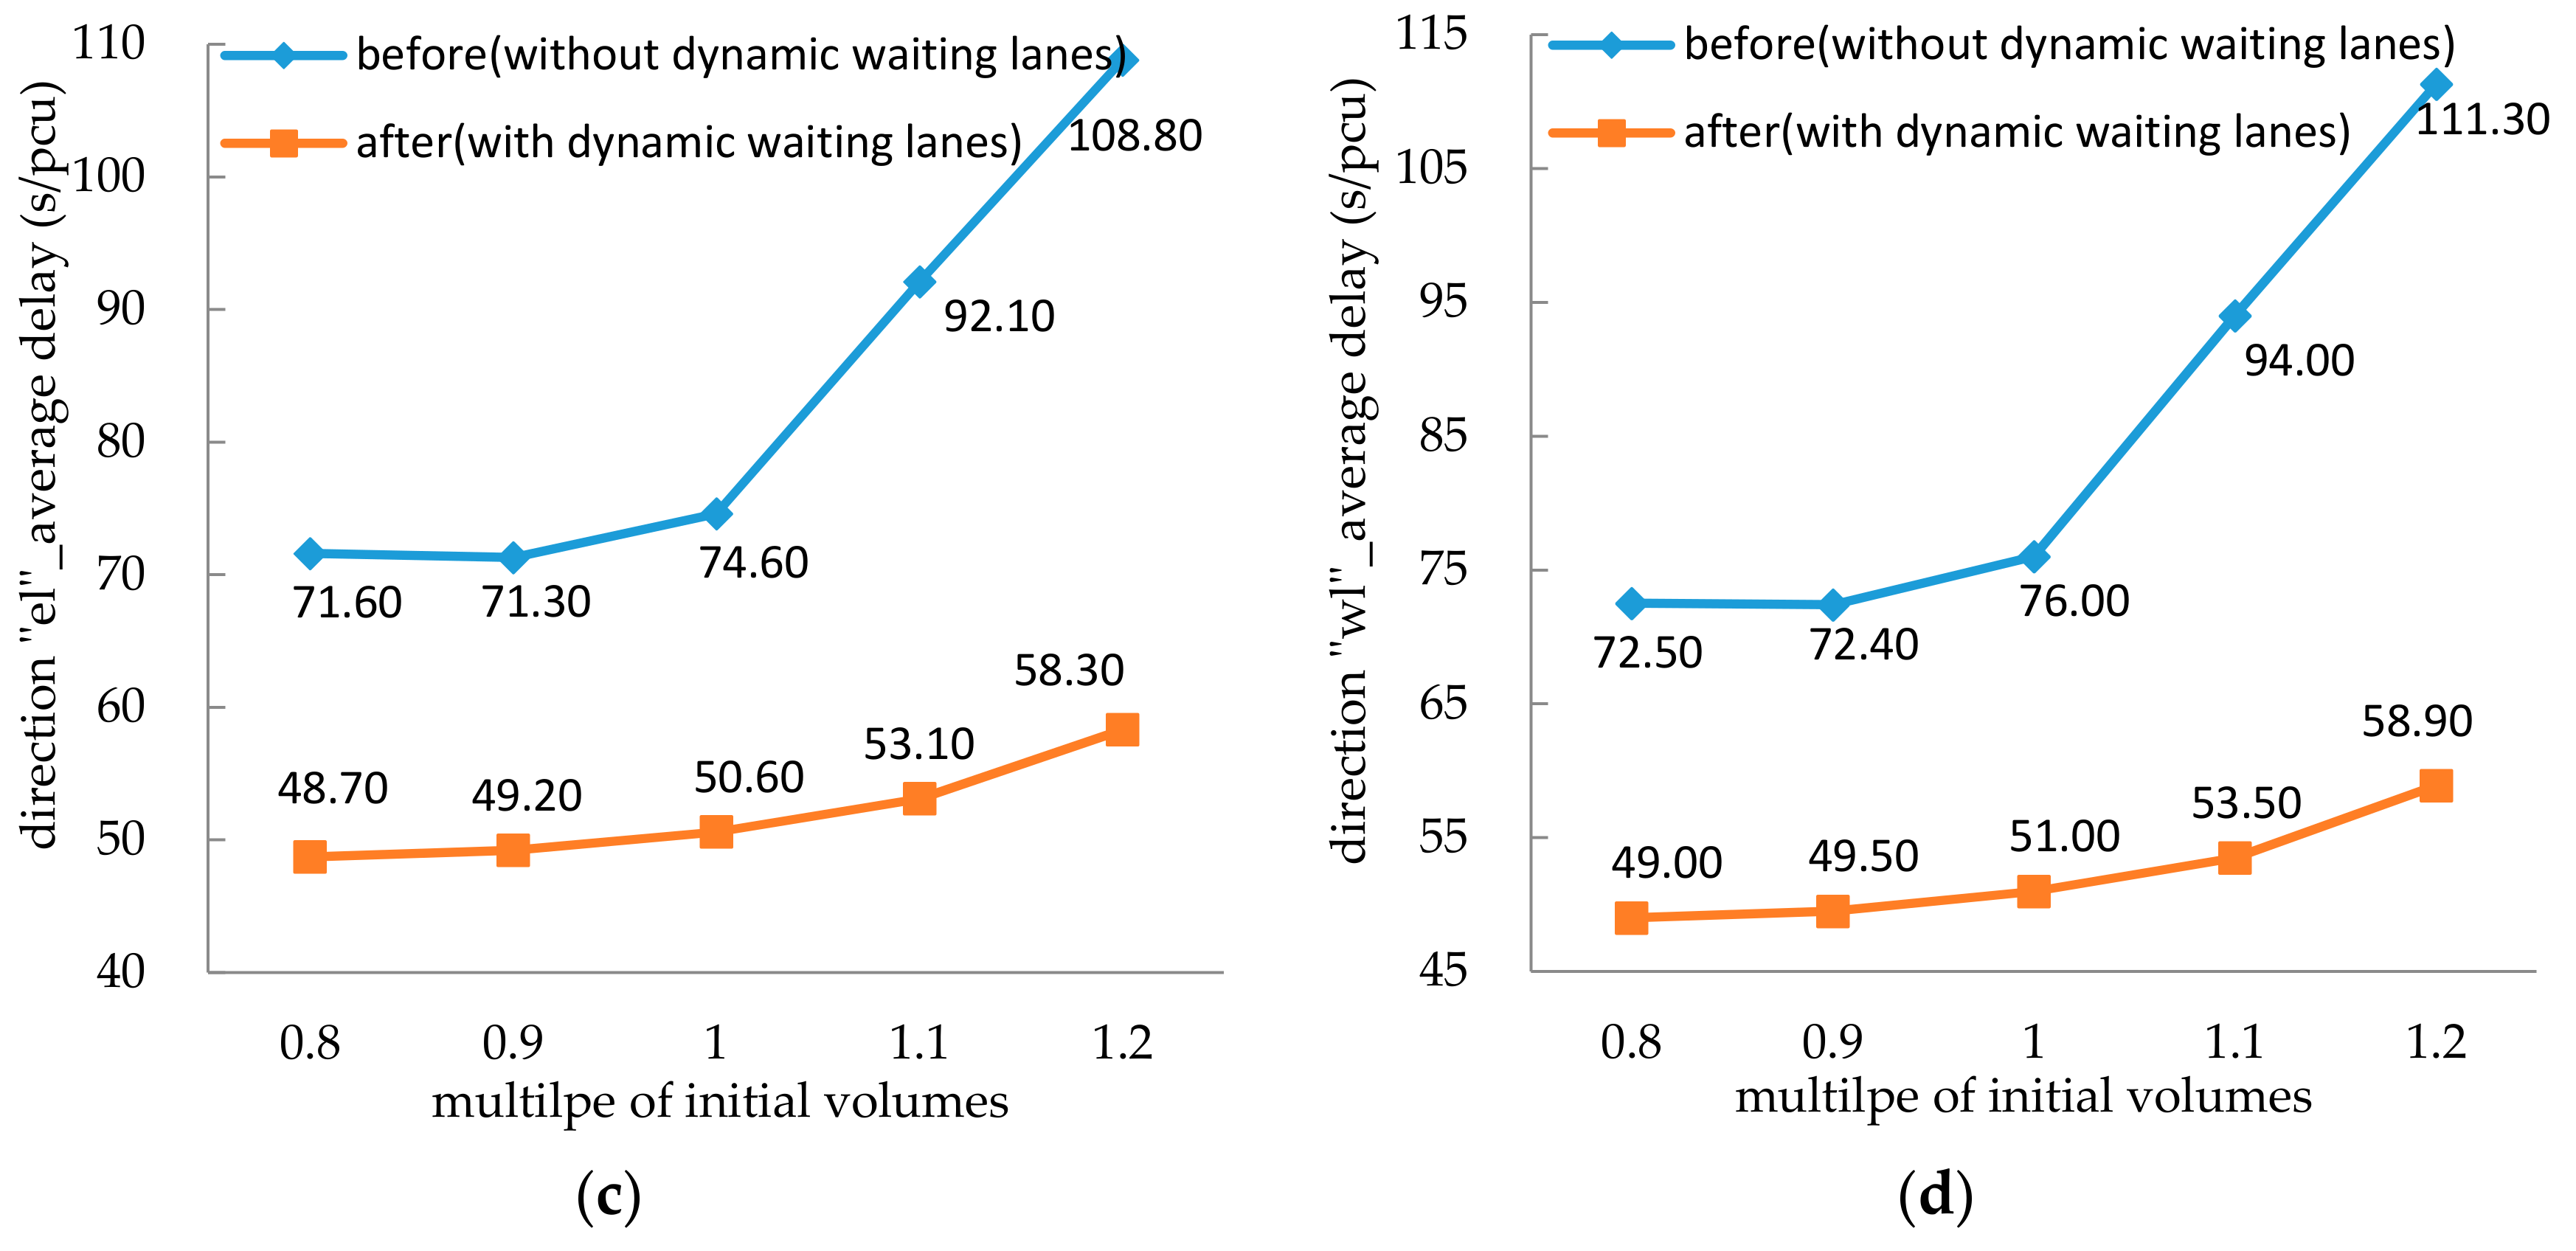
4.4. Average Delay Analysis with Different Traffic Volumes

Based on the model application in Section 4.2 and Section 4.3, this section will analyze the effect of the traffic volume on vehicle delay. The traffic volumes of the directions with dynamic waiting lanes (direction of “et”,”el”,”wt”, and “wl”) were increased or decreased by 10% uniformly. The other (direction of “st”,”sl”,”nt”, and “nl”) remained unchanged. Table 6 provides the explanation for the variation of the volumes.
The results of the average delay at the entire intersection and the direction with dynamic waiting lanes can be seen in Figure 9 and Figure 10. These figures show that the proposed model could decrease vehicle delay in the intersection effectively in both low-volume and high-volume situations, in comparison to the conventional control method. In addition, it was found that, when the traffic volume is increased by 10% and 20%, the saturation of the intersection is greater than 0.9 when using traditional control method. However, the saturation is decreased to less than 0.9 when the proposed control model is applied to the intersection. Meanwhile, the effectiveness of reducing the average delay at the intersection is more outstanding.

5. Conclusions

This paper has proposed a main-signal and pre-signal coordinated control model for minimizing the vehicle delay at an intersection. To calculate the vehicle delay, a vehicle delay model with pre-signals with different channelization setups in the form of dynamic waiting lanes was built. The experiment calculation results showed that the proposed method exceeds the conventional control methods in terms of decreasing the vehicle delay at the case study intersection under the current traffic volumes. Furthermore, the traffic volumes of the directions with dynamic waiting lanes were changed. The delay analysis results show that, as the traffic volume increases, the effect of the model on decreasing the intersection delay will be even greater. It verified that the proposed model can effectively reduce the vehicle delay and improve the traffic efficiency of oversaturated intersections.

Author Contributions

C.Z. and Y.C. designed and analyzed the control model; C.Z. and P.Z. survey traffic data; C.Z. and Y.C. conceived the case study and analyzed the results; C.Z. and P.Z. wrote the paper.

Funding

This research was funded by [the University Natural Science Foundation of Jiangsu Provincial of China] under grant number [13KJB580003] and [the Key Laboratory of Urban Intelligent Transportation of Jiangsu Province Open Research Funding Project of China] under grant number [JTKF2014004].

Conflicts of Interest

The authors declare no conflict of interest.

Nomenclature

D the total delay of all arriving vehicles during a cycle, s
D p the total delay of all arriving vehicles at the pre-signal during a cycle, s
D m the total delay of all arriving vehicles at the main-signal during a cycle, s
S the area of a polygon which indicates time in this paper, s
Y the number of accumulated vehicles between the start of the green light of the main-signal and the dissipation of the queue
Z the accumulated time from the end of the green light of the pre-signal to the dissipation of the queue of the main-signal, s
T c the length of the signal cycle, s
R the red time of the main-signal, s
G the green time of the main-signal, s
r the red time of the pre-signal, s
g the green time of the pre-signal, s
t y the yellow time, s
n the number of signal phases
t s the early start time of the green phase of the pre-signal, s
t f the early finish time of the green phase of the pre-signal, s
N the number of exclusive lanes in the main-signal area
N the number of dynamic waiting lanes in the main-signal area
v l the mean speed of the last car from the pre-stop line to the main-stop line, m/s
h t the saturated time headway, s/pcu
h d the space headway in the queue, m/pcu
q the volume per hour, pcu/h
CAP the capacity of the main-signal per cycle, pcu/Tc
cap the capacity of the pre-signal per cycle, pcu/Tc
l 1 j h d N j k the storing capacity of the exclusive lanes in the main-signal area
PCUPassenger Car Unit
These variables may have the addition of subscript “jk”, which refers to the direction “jk”. The direction “jk” represents the direction “k” (including right-turn, through, and left-turn) of the entrance “j” (including south, north, east, and west) in this paper. Meanwhile, subscript “i” represents the phase sequence of the main-signal.

References

  1. Zhou, Z.H.; Cai, M. Intersection signal control multi-objective optimization based on genetic algorithm. J. Traffic Transp. Eng. (Engl. Ed.) 2014, 1, 153–158. [Google Scholar] [CrossRef]
  2. Wei, Y.; Shao, Q.; Han, Y.; Fan, B.Q. Intersection Signal Control Approach Based on PSO and Simulation. In Proceedings of the 2008 Second International Conference on Genetic & Evolutionary Computing, Hubei, China, 25–26 September 2008; IEEE Computer Society: Washington, DC, USA, 2008; pp. 277–280. [Google Scholar]
  3. Wong, C.K.; Wong, S.C. Lane-based optimization of signal timings for isolated junctions. Transp. Res. Part B 2003, 37, 63–84. [Google Scholar] [CrossRef]
  4. Zhao, J.; Fu, J.Y.; Yang, X.G. Optimization Model of Dynamic Lane Assignment for Isolated Signalized Intersections. J. Tongji Univ. (Nat. Sci.) 2013, 41, 996–1001. [Google Scholar] [CrossRef]
  5. Li, L.L.; Qu, Z.W.; Song, M.M.; Wang, D.H. Control strategy of variable lane. J. Jilin Univ. (Eng. Technol. Ed.) 2009, 39, 98–103. [Google Scholar]
  6. Li, L.L.; Qu, Z.W.; Chen, Y.H.; Wang, D.H. Research on Variable Lane Signalized Control Method. In Proceedings of the 2009 International Conference on Measuring Technology and Mechatronics Automation, Zhangjiajie, China, 11–12 April 2009; pp. 575–578. [Google Scholar]
  7. Xia, X.; He, Z.C.; Sun, W.B.; Chen, Z.Q.; Gong, J.F. Traffic impact analysis of urban intersections with comprehensive waiting area on urban intersection based on PARAMICS. Procedia Soc. Behav. Sci. 2013, 96, 1910–1920. [Google Scholar] [CrossRef]
  8. Wu, J.; Hounsell, N. Bus Priority Using pre-signals. Transp. Res. Part A Policy Pract. 1998, 32, 563–583. [Google Scholar] [CrossRef]
  9. Xuan, Y.G.; Daganzo, C.F.; Cassidy, M.J. Increasing the capacity of signalized intersections with separate left turn phases. Transp. Res. Part B 2011, 45, 769–781. [Google Scholar] [CrossRef] [Green Version]
  10. Xuan, Y.G.; Cassidy, M.J.; Daganzo, C.F. Using a pre-signal to increase bus-and car-carrying capacity at intersections: Theory and experiment. Transp. Res. Rec. J. Transp. Res. Board 2012, 24, 191–196. [Google Scholar] [CrossRef]
  11. Zhou, Y.P.; Zhuang, H. The optimization of lane assignment and signal timing at the tandem intersection with pre-signal. J. Adv. Transp. 2014, 48, 362–376. [Google Scholar] [CrossRef]
  12. Yan, C.W.; Jiang, H.; Xie, S.Y. Capacity optimization of an isolated intersection under the phase swap sorting strategy. Transp. Res. Part B 2014, 60, 85–106. [Google Scholar] [CrossRef]
  13. Ma, W.J.; Xie, H.Z.; Liu, Y.; Luo, Z.K. Coordinated optimization of signal timings for intersection approach with presignals. Transp. Res. Rec. J. Transp. Res. Board 2013, 2355, 93–104. [Google Scholar] [CrossRef]
  14. Ma, W.J.; Xie, H.Z. Integrated control of main-signal and pre-signal on approach of intersection with double stop line. J. Jilin Univ. (Eng. Ed.) 2013, 43, 633–639. [Google Scholar]
  15. Li, L.L.; Qu, Z.W.; Wang, D.H. Guidance Method of the Variable Lane. Traffic Inf. Secur. 2008, 26, 53–56. [Google Scholar]
  16. Dongjing, C.; Linbo, L.; Rui, Z.; Bing, W. Coordinate relationship between main signals and pre-signals of the variable lane at signalized intersection. J. Chongqing Jiaotong Univ. (Nat. Sci. Ed.) 2013, 32, 252–257. [Google Scholar]
  17. Zhang, W.H.; Lu, H.P. Analysis of vehicle delay of intersections with pre-signals based on bus priority. China J. Highw. Transp. 2005, 18, 78–82. [Google Scholar]
  18. Yin, H.B.; Xu, J.M.; Zhou, Q.J. A knowledge based system for the design of signalized intersections. J. South China Univ. Technol. (Nat. Sci.) 1999, 27, 112–115. [Google Scholar]
  19. Department of the People’s Republic of China Ministry of Housing and Urban-Rural Development. National Standards of People’s Republic of China GB 50647-2011: Urban Road Intersection Planning Specification; China Planning Press: Beijing, China, 2011.
Figure 1. Distribution of dynamic waiting lanes with pre-signals: (a) with exclusive through lanes in the main-signal area; (b) with exclusive left-turn lanes in the main-signal area; (c) with exclusive through and left-turn lanes in the main-signal area; (d) without exclusive lanes in the main-signal area.
Sustainability 10 02849 g001
Figure 2. Coordination of the main-signal and pre-signal phase sequence.
Sustainability 10 02849 g002
Figure 3. Coordination control strategy of the main-signal and pre-signal.
Sustainability 10 02849 g003
Figure 4. Arrival and departure process of vehicles at the signal.
Sustainability 10 02849 g004
Figure 5. Arrival and departure process of vehicles at the main-signals and pre-signals (a).
Sustainability 10 02849 g005
Figure 6. Arrival and departure process of vehicles at the main-signal and pre-signal (b).
Sustainability 10 02849 g006
Figure 7. The plane of dynamic waiting lanes in the case study intersection.
Sustainability 10 02849 g007
Figure 8. Timing scheme of the main-signal and pre-signal.
Sustainability 10 02849 g008
Figure 9. Average intersection delays under different traffic volumes.
Sustainability 10 02849 g009
Figure 10. Average delays of the traffic directions with dynamic waiting lanes under different traffic volumes: (a) direction of through traffic from the east entrance; (b) direction of through traffic from the west entrance; (c) direction of left-turn traffic from the east entrance; (d) direction of left-turn traffic from the west entrance.
Sustainability 10 02849 g010aSustainability 10 02849 g010b
Table 1. Intersection lanes.
EntranceNumber of Entrance LanesNumber of Exit Lanes
south53
north43
east43
west43
Table 2. Traffic volume of the intersection pcu/h.
DirectionSouthNorthEastWest
right-turn13492134102
through9845699941025
left-turn212222306330
Table 3. Signal timing scheme of the case study intersection.
Gst/nt/sGsl/nl/sGet/wt/sGel/wl/sTc/s
25381725105
Table 4. Channelization length of lanes.
Entrancel1/ml2/ml3/m
east502550
west502550
Table 5. Average delay at the intersection before and after installing dynamic waiting lanes.
DelaySouthNorthEastWest
ThroughLeft-TurnThroughLeft-TurnThroughLeft-TurnThroughLeft-Turn
before (s/pcu)60.770.151.475.045.255.347.661.28
after (s/pcu)38.847.336.048.537.451.838.253.94
reduction rate36.0%32.6%30.0%35.3%17.1%6.3%19.7%12.0%
Table 6. The variation of the volumes.
MultipleSouthNorthEastWest
Through
(pcu/h)
Left-Turn
(pcu/h)
Through
(pcu/h)
Left-Turn
(pcu/h)
Through
(pcu/h)
Left-Turn
(pcu/h)
Through
(pcu/h)
Left-Turn
(pcu/h)
0.8984212569222795820820264
0.9984212569222895923923297
19842125692229943061025330
1.198421256922210933371128363
1.298421256922211933671230396

