Indicators for Promising Accessibility and Mobility Services


Abstract
1. Introduction
- (1)
- Is it more environmentally sustainable? Does it reduce negative impacts on the environment?
- (2)
- Is it rewardable? Is value created for an organization? Does it make use of new sustainable business models?
- (3)
- Is it attractive from a user perspective? How big is the spread among users?
- Is using this approach and the suggested indicators feasible?
- To what extent does this approach support the identification of the most interesting services?
- What are the major benefits and challenges of using this approach and the suggested indicators?
- How could the approach and its indicators be improved to better fulfill its purpose?
2. Indicators for Sustainable Accessibility in Urban Areas
2.1. Indicators for Environmental Impact
2.2. Indicators for Viability and Business Value
- (1)
- Value creation—What type of value the service creates. Here, a type of business that creates only technological value by introducing new environmental technology is not as sustainable as one that also creates social and economic value.
- (2)
- Value capture—Realization of societal and economic profits. Profit models that are based on subscription are seen as more sustainable both for business and for the environment because they utilize resources better.
- (3)
- Customer value offer—Value proposed for the customer. A customer value offer that is based on use rather than being product-oriented is more sustainable.
- (4)
- Uniqueness—Competitive advantage enabled through a differentiation strategy. A business with high differentiation can have long-term effects on the transition industry. If it is based on focus or segmentation, it can just create more markets, which is not necessarily sustainable.Newness to the market/Innovativeness—The degree of familiarity that organizations, users, and industry have with a product or service [32] and distinguishing between different degrees of innovations is evidenced as critical [32,33]. A radical innovation is very interesting in the long run. An incremental innovation will take longer to shift industry and make a big impact.
2.3. Indicators for Use and Spread
3. Materials and Methods
3.1. Data Collection
3.2. Using the Indicators
- Does it reduce negative impacts on the environment?
- Is it rewardable? Is value created for an organization?
- How widely is the service spread? How many users are there, what is the geographic distribution, and what level of societal transition has occurred?
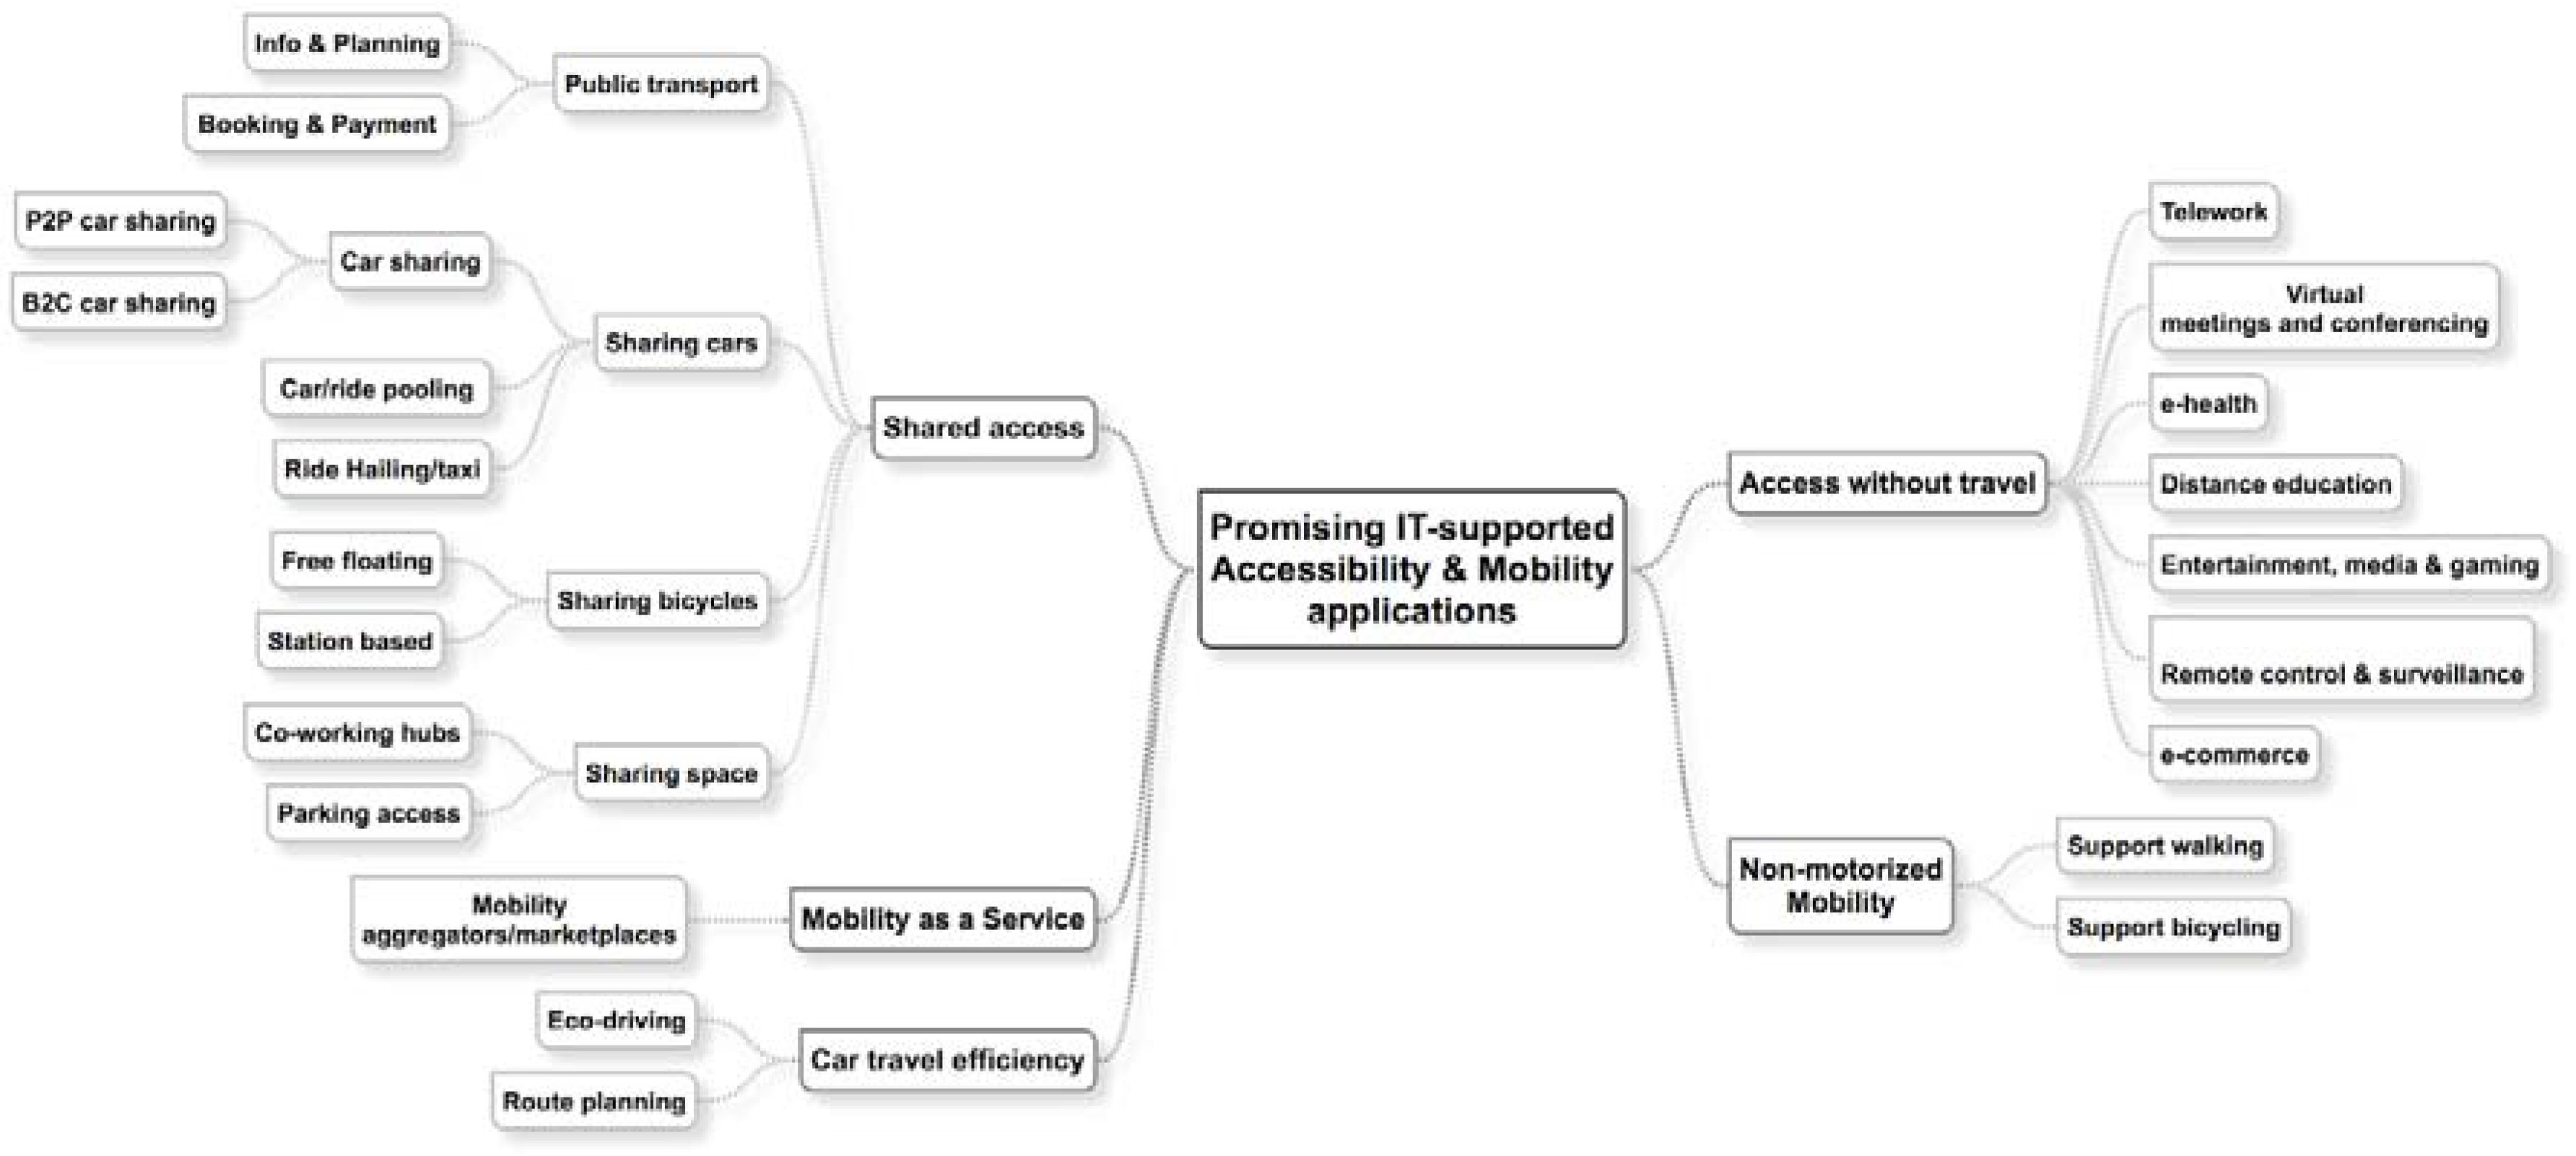
4. ICT Services for Improved Sustainability in Accessibility
- Access without travel
- Non-motorized travel modes
- Shared access
- Mobility as a service
- Car travel efficiency
- Access without travel—Virtual meetings
- Shared access—Sharing spaces—Co-working hubs
- Shared access—Sharing cars—Transportation network services
- Shared access—Sharing bicycles—Free-floating bicycle sharing systems
4.1. ICT Services Supporting Access without Traveling
Virtual Meetings
4.2. ICT to Support Shared Access
4.2.1. Sharing Spaces—Shared workspace/Co-working hub
4.2.2. Sharing Cars—Transportation Network Services
4.2.3. Sharing Bicycles—Free-Floating/Dockless Bicycles
5. Applying the Indicators on the Different Service Categories
6. Revising the Indicators
6.1. Revising the Environmental Impact Indicators
6.2. Revising the Indicators for a Business Model
6.3. Revising the Indicators for Use and Spread
7. Discussion
8. Conclusions and Recommendation
Author Contributions
Funding
Conflicts of Interest
References
- UN-Habitat. Urbanization and Development: Emerging Futures; UN-Habitat: Nairobi, Kenya, 2016; Available online: https://www.unhabitat.org/wp-content/uploads/2014/03/WCR-%20Full-Report-2016.pdf (accessed on 1 June 2018).
- McCormick, K.; Anderberg, S.; Coenen, L.; Neij, L. Advancing sustainable urban transformation. J. Clean. Prod. 2013, 50, 1–11. [Google Scholar] [CrossRef]
- European Environment Agency (EEA). Transitions towards a More Sustainable Mobility System; EEA: Brussels, Belgium, 2016. [Google Scholar]
- Finnveden, G.; Åkerman, J. Not planning a sustainable transport system. Environ. Impact Assess. Rev. 2014, 46, 53–57. [Google Scholar] [CrossRef]
- Geels, F.W.; Schwanen, T.; Sorrell, S.; Jenkins, K.; Sovacool, B.K. Reducing energy demand through low carbon innovation: A sociotechnical transitions perspective and thirteen research debates. Energy Res. Soc. Sci. 2018, 40, 23–35. [Google Scholar] [CrossRef]
- Kramers, A.; Höjer, M.; Lövehagen, N.; Wangel, J. Smart sustainable cities—Exploring ICT solutions for reduced energy use in cities. Environ. Model. Softw. 2014, 56, 52–62. [Google Scholar] [CrossRef]
- Malmodin, J.; Lundén, D.; Moberg, Å.; Andersson, G.; Nilsson, M. Life cycle assessment of ICT. J. Ind. Ecol. 2014, 18, 829–845. [Google Scholar] [CrossRef]
- Umair, S.; Björklund, A.; Petersen, E.E. Social impact assessment of informal recycling of electronic ICT waste in Pakistan using UNEP SETAC guidelines. Resour. Conserv. Recycl. 2015, 95, 46–57. [Google Scholar] [CrossRef]
- Börjesson Rivera, M.; Håkansson, C.; Svenfelt, Å.; Finnveden, G. Including second order effects in environmental assessments of ICT. Environ. Model. Softw. 2014, 56, 105–115. [Google Scholar] [CrossRef]
- Höjer, M.; Moberg, Å.; Henriksson, G. Digitalisering och Hållbar Konsumtion: Underlagsrapport till Fördjupad Utvärdering av Miljömålsarbetet; Naturvårdsverket: Stockholm, Sweden, 2015; Available online: https://www.naturvardsverket.se/Documents/publikationer6400/978-91-620-6675-8.pdf?pid=15239 (accessed on 1 June 2018).
- Carrillo-Hermosilla, J.; Del Río, P.; Könnölä, T. Diversity of eco-innovations: Reflections from selected case studies. J. Clean. Prod. 2010, 18, 1073–1083. [Google Scholar] [CrossRef]
- SOU. Fossilfrihet På Väg, del 2; 2013:84; SOU: Stockholm, Sweden, 2013; Available online: https://www.regeringen.se/49bbab/contentassets/7bb237f0adf546daa36aaf044922f473/fossilfrihet-pa-vag-sou-201384-del-22 (accessed on 1 June 2018).
- Kramers, A.; Ringenson, T.; Sopjani, L.; Arnfalk, P. AaaS and MaaS for reduced environmental and climate impact of transport. EPiC Ser. Comput. 2018, 52, 137–152. [Google Scholar] [CrossRef]
- Arnfalk, P.; Pilerot, U.; Schillander, P.; Grönvall, P. Green IT in practice: Virtual meetings in Swedish public agencies. J. Clean. Prod. 2016, 123, 101–112. [Google Scholar] [CrossRef]
- Waters, J. Accessible cities; from urban density to multidimensional accessibility. In Rethinking Sustainable Cities: Accessible, Green and Fair; Simon, D., Ed.; Policy Press: Bristol, UK, 2016. [Google Scholar]
- Sochor, J.; Karlsson, M.; Strömberg, H. Trying out mobility as a service. Experiences from a field trial and implications for understanding demand. Transp. Res. Rec. J. Transp. Res. Board 2016. [Google Scholar] [CrossRef]
- Holmberg, P.-E.; Collado, M.; Sarasini, S.; Williander, M. Mobility as a Service: Describing the Framework; Trivector: Lund, Sweden, 2015; Available online: https://www.viktoria.se/sites/default/files/pub/www.viktoria.se/upload/publications/final_report_maas_framework_v_1_0.pdf (accessed on 1 June 2018).
- Jittrapirom, P.; Caiati, V.; Feneri, A.-M.; Ebrahimigharehbaghi, S.; González, M.J.A.; Narayan, J. Mobility as a service: A critical review of definitions, assessments of schemes, and key challenges. Urban Plan. 2017, 2. [Google Scholar] [CrossRef]
- Kamargianni, M.; Matyas, M. The business ecosystem of mobility-as-a-service. In Proceedings of the 96th Transportation Research Board Annual Meeting, Washington, DC, USA, 8–12 January 2017. [Google Scholar]
- Cohen, B.; Kietzmann, J. Ride on! Mobility business models for the sharing economy. Organ. Environ. 2014, 27, 279–296. [Google Scholar] [CrossRef]
- Castillo, H.; Pitfield, D.E. ELASTIC—A methodological framework for identifying and selecting sustainable transport indicators. Transp. Res. Part D 2010, 15, 179–188. [Google Scholar] [CrossRef]
- Kamargianni, M.; Matyas, M.; Li, W.; Schäfer, A. Feasibility study for “mobility as a service” concept in london. UCL Energy Inst. Dep. Transp. 2015, 84. [Google Scholar] [CrossRef]
- Banister, D. Unsustainable Transport: City Transport in the New Century; Giger Verlag GmbH: Altendorf, Switzerland, 2005. [Google Scholar]
- Banister, D. Cities, mobility and climate change. J. Transp. Geogr. 2011, 19, 1538–1546. [Google Scholar] [CrossRef]
- United Nations. Mobilizing Sustainable Transport for Development: Analysis and Policy Recommendations from the United Nations Secretary-General’s High Level Advisory Group on Sustainable Transport; New York City, NY, USA, 2016. Available online: https://sustainabledevelopment.un.org/content/documents/2375Mobilizing%20Sustainable%20Transport.pdf (accessed on 1 June 2018).
- Black, J.A.; Paez, A.; Suthanaya, P.A. Sustainable urban transportation: Performance indicators and some analytical approaches. J. Urban Plan. Dev. 2002, 128, 184–209. [Google Scholar] [CrossRef]
- Richardson, B.C. Sustainable transport: Analysis frameworks. J. Transp. Geogr. 2005, 13, 29–39. [Google Scholar] [CrossRef]
- Katzeff, C.; Nyblom, Å.; Tunheden, S.; Torstensson, C. User-centred design and evaluation of EnergyCoach—An interactive energy service for households. Behav. Inf. Technol. 2012, 31, 305–324. [Google Scholar] [CrossRef]
- Nykvist, B.; Whitmarsh, L. A multi-level analysis of sustainable mobility transitions: Niche development in the UK and Sweden. Technol. Forecast. Soc. Chang. 2008, 75, 1373–1387. [Google Scholar] [CrossRef]
- Kerttu, J.; Smidfelt Rosqvist, L.; Wendle, B. Konsekvenser av Mobility as a Service; Trivector: Lund, Sweden, 2016; Available online: https://www.trafa.se/globalassets/rapporter/underlagsrapporter/2016/trivector-rapport_2016_112-konsekvenser-av-mobility-as-a-service.pdf (accessed on 1 June 2018).
- Bocken, N.M.P.; Short, S.W.; Rana, P.; Evans, S. A literature and practice review to develop sustainable business model archetypes. J. Clean. Prod. 2014, 65, 42–56. [Google Scholar] [CrossRef]
- Garcia, R.; Calantone, R. A critical look at technological innovation typology and innovativeness terminology: A literature review. J. Prod. Innov. Manag. 2002. [Google Scholar] [CrossRef]
- De Brentani, U. Innovative versus incremental new business services: Different keys for achieving success. J. Prod. Innov. Manag. 2001. [Google Scholar] [CrossRef]
- Thompson, A. Understanding the proof of business concept. Underst. Proof Bus. Concept. Perth, Best Entrepeneur. 2003. Available online: https://archive.org/stream/bplans_Understand_a_proof_of_business/Understand_a_proof_of_business_djvu.txt (accessed on 1 June 2018).
- Rogers, E.M. Diffusion of Innovations; The Free Press: New York, NY, USA, 1995. [Google Scholar]
- Geels, F.W. A socio-technical analysis of low-carbon transitions: Introducing the multi-level perspective into transport studies. J. Transp. Geogr. 2012. [Google Scholar] [CrossRef]
- TeliaSonera. Corporate Responsibility Report 2010, 2010.
- Arnfalk, P. Hur Påverkas Resandet? Delrapport 1: Distansarbete & Flexibla Arbetsformer; Lund University: Lund, Sweden, 2013; pp. 1–39. [Google Scholar]
- Mokhtarian, P.L. Telecommunications and Travel. The Case for Complementarity. J. Ind. Ecol. 2003, 6, 43–57. [Google Scholar] [CrossRef]
- Heinrichs, H. Sharing economy: A potential new pathway to sustainability. GAIA 2013, 22, 228–231. [Google Scholar] [CrossRef]
- Martin, C.J. The sharing economy: A pathway to sustainability or a nightmarish form of neoliberal capitalism? Ecol. Econ. 2016. [Google Scholar] [CrossRef]
- Spaces. Spaces. Available online: http://www.spacesworks.com (accessed on 31 May 2018).
- United Spaces. United Spaces. Available online: http://www.unitedspaces.com/sv (accessed on 31 May 2018).
- WeWork. WeWork. Available online: http://www.wework.com (accessed on 31 May 2018).
- Kramers, A.; Höjer, M.; Nyberg, M.; Söderholm, M. Work hubs: Location considerations and opportunities for reduced travel. In Proceedings of the Enviroinfo and ICT for Sustainability 2015; Atlantis Press: Paris, France, 2015; pp. 126–135. Available online: https://www.atlantis-press.com/proceedings/ict4s-env-15/25836159 (accessed on 1 June 2018).
- Ferguson, E. The rise and fall of the American carpool: 1970–1990. Transportation 1997, 24, 349–376. [Google Scholar] [CrossRef]
- Shaheen, S.; Cohen, A.; Zohdy, I. Shared Mobility: Current Practices and Guiding Principles; Fhwa-Hop-16-022 2; 2016; 120p. Available online: https://ops.fhwa.dot.gov/publications/fhwahop16022/ch1.htm (accessed on 1 June 2018).
- Uber. Uber. Available online: http://www.uber.com (accessed on 31 May 2018).
- Lyft. Lyft. Available online: http://www.lyft.com (accessed on 31 May 2018).
- Cetin, T.; Deakin, E. Regulation of taxis and the rise of ridesharing. Transp. Policy 2017. [Google Scholar] [CrossRef]
- Li, Z.; Hong, Y.; ZHang, Z. An empirical analysis of on-demand ride sharing and traffic congestion. In Proceedings of the 2017 Hawaii International Conference on System Sciences, Waikoloa Beach, HI, USA, 4–7 January 2017. [Google Scholar]
- O’Brien, O.; Cheshire, J.; Batty, M. Mining bicycle sharing data for generating insights into sustainable transport systems. J. Transp. Geogr. 2014. [Google Scholar] [CrossRef]
- NextBike. NextBike. Available online: http://www.nextbike.de/en (accessed on 31 May 2018).
- Ofo. Ofo. Available online: http://www.ofo.com/us/en (accessed on 31 May 2018).
- Murphy, E.; Usher, J. The Role of Bicycle-sharing in the City: Analysis of the Irish Experience. Int. J. Sustain. Transp. 2015. [Google Scholar] [CrossRef]
- Du, M.; Cheng, L. Better Understanding the Characteristics and Influencing Factors of Different Travel Patterns in Free-floating Bike Sharing: Evidence from Nanjing, China. Sustainability 2018, 10, 1244. [Google Scholar] [CrossRef]
- Qiu, L.-Y.; He, L.-Y. Bike Sharing and the Economy, the Environment, and Health-Related Externalities. Sustainability 2018, 10, 1145. [Google Scholar] [CrossRef]
- Daxue Consulting. Mobike and Ofo: Reinventing the Bike-Sharing Business Model in China. Available online: http://daxueconsulting.com/mobike-and-ofo-bike-sharing/ (accessed on 1 June 2018).
- MS Power User. Skype Has More than 300 Million Monthly Active Users, Will Get Bots. Available online: https://mspoweruser.com/skype-300-million-monthly-active-users/ (accessed on 1 June 2018).
- Statista. Number of Coworking Spaces Worldwide 2017. Available online: https://www.statista.com/statistics/554273/number-of-coworking-spaces-worldwide/ (accessed on 1 June 2018).
- Wainhouse Research. Analyst Day 28 February 2017. 2017. Available online: files.shareholder.com/downloads/WTSC/0x0x930157/80E4E9CE-A4A4-4C5A-85F5-7191E390BE41/Analyst_Day_final_website.pdf (accessed on 1 June 2018).
- Statista. Ride Sharing—Worldwide. Available online: https://www.statista.com/outlook/368/100/ride-sharing/worldwide# (accessed on 1 June 2018).
- Richter, F. Chart: The Global Rise of Bike-Sharing. Available online: https://www.statista.com/chart/13483/bike-sharing-programs/ (accessed on 1 June 2018).


| Category | Indicator | Values |
|---|---|---|
| 1. Reduce traveling overall | 1.1. Number of trips | 1.1.a. Digital accessibility—Yes/No |
| 1.1.b. Encourages “batching” activities—Yes/No | ||
| 1.2. Distance of trips | 1.2.a. Encourages neighborhood-based activities—Yes/No | |
| 2. Reduce environmental impact per traveled kilometer | 2.1. Better modes of transport | 2.1.a. Encourages shift to walking—Yes/Possibly/No |
| 2.1.b. Encourages shift to biking—Yes/Possibly/No | ||
| 2.1.c. Encourages shift to public transportation—Yes/Possibly/No | ||
| 2.2. Vehicles with lower emissions per kilometer traveled, including from a life cycle perspective | 2.2.a. Number of users per car | |
| 2.2.b. Vehicle emissions during the use phase | ||
| 2.2.c. Vehicle emissions during the production phase |
| Category | Indicator | Value |
|---|---|---|
| 1. Value creation | 1.1. Business model archetype | 1.1.a. Technological (introduce new environmental technology) (Yes/No) |
| 1.1.b. Social (Address social issues, low-income groups contexts, behavior change, value for stakeholders) (Yes/No) | ||
| 1.1.c. Economic (change dominant organizational and economic paradigms underlying business activities) (Yes/No) | ||
| 2. Value capture | 2.1. Profit models | 2.1.a. Selling (Yes/No) |
| 2.1.b. Leasing (Yes/No) | ||
| 2.1.c. Subscription (Yes/No) | ||
| 2.1.d. Pay per use (Yes/No) | ||
| 2.1.e. Non-profit (Yes/No) | ||
| 3. Customer value offer (value proposition) | 3.1. Mix of product/service (Hardware/software) | 3.1.a. Product-oriented (Yes/No) |
| 3.1.b. Use-oriented (Yes/No) | ||
| 3.1.c. Result-oriented (Yes/No) | ||
| 4. Uniqueness (competitive advantage) | 4.1. Strategy | 4.1.a. Cost leadership (Yes/No) |
| 4.1.b. Differentiation (Yes/No) | ||
| 4.1.c. Focus/Segmentation (Yes/No) | ||
| 5. Type of innovation | 5.1. Newness to the market | 5.1.a. Radical innovation (Yes/No) |
| 5.1.b. Really new innovation (Yes/No) | ||
| 5.1.c. Discontinuous innovation (Yes/No) | ||
| 5.1.d. Incremental innovation (Yes/No) | ||
| 5.1.e. Imitative innovation (Yes/No) |
| Category | Indicator | Value |
|---|---|---|
| 1. Geographic distribution | 1. In what countries/cities/municipalities is the service available? | Name of country/city/municipality |
| 1.2. Type of city | 1.2.a. Rising megacity (Yes/No) | |
| 1.2.b. Established megacity (Yes/No) | ||
| 1.2.c. Car-dominated mature city (Yes/No) | ||
| 1.2.d. Mature advanced city (Yes/No) | ||
| 1.3. Urban spread/localization—in which zones is the service available? | 1.3.a. Zone 1—Central urban (Yes/No) | |
| 1.3.b. Zone 2—Inner suburbs (Yes/No) | ||
| 1.3.c. Zone 3—Rural and outer suburbs (Yes/No) | ||
| 1.3.d. Zone 3—Remote (Yes/No) | ||
| 2. Adoption | 2.1. How many registered users are there? | Number of registered users (quantity) |
| 2.2. How many actual users are there? | Total revenues (amount) | |
| Average revenue per user (ARPU) (amount) | ||
| 3. Level of societal transition | 3. What level of societal transition has occurred because of this service? | 3.a. Niche |
| 3.b. Regime | ||
| 3.c. Landscape |
| Environmental Performance Indicators | Services | |||||
| Category | Indicator | Values | Virtual Meetings | Co-Working Hub | Transportation Network Service | Dockless Bike-Sharing System |
| 1. Reduce traveling overall | 1.1. Number of trips | 1.1.a. Digital Accessibility—Yes/No | Yes, virtual meetings can and do reduce the number of mainly business trips. The extent of the impact depends on organizational conditions and prevalent meeting culture. Travel substitution exceeds the generating effects. Similar effects on travel for e.g., health care and education/training. | No, co-working hubs are not better than other workplaces to reduce the number of trips. | No | No |
| 1.1.b. Encourages “batching” activities—Yes/No | No, virtual meetings allow the participants to meet without traveling, | Yes, the number of trips can be saved if the co-working hub is located in close proximity to other services or household activities. | No | Not directly | ||
| 1.2. Distance of trips | 1.2.a. Encourages neighborhood-based activities—Yes/No | Yes, in some occasions, participants from one city meet at one location/studio and jointly participate in a virtual meeting there. In this way, only local and shorter trips are needed. | No, the co-working hubs found in the data collection are mainly found in city centers and not in residential areas. | Not specifically | Not directly | |
| 2. Reduce environmental impact per traveled kilometer | 2.1. Better modes of transport | 2.1.a. Encourages shift to walking—Yes/Possibly/No | Possibly, in the 1.2 case, the trips to a local gathering may be suitable for walking. | Possibly, if co-working hubs are located in close proximity to public transportation and if it’s located close to residential areas. | Not directly, but may with decreased car ownership | Not directly |
| 2.1.b. Encourages shift to biking—Yes/Possibly/No | Possibly, in the 1.2 case, the trips to a local gathering may be suitable for biking. | Possibly, if the co-working hub is located close to bicycle lanes and also if it’s located close to residential areas. | Not directly, but may with decreased car ownership | Yes, both directly through providing easy-access bikes and indirectly through improving attitudes toward bicycling | ||
| 2.2. Vehicles with lower emissions per kilometer traveled, including from a life cycle perspective | 2.1.c. Encourages shift to public transportation—Yes/Possibly/No | Possibly, in the 1.2 case, the trips to a local gathering may be suitable for public transportation. | Possibly, if it’s located close to public transportation, it can encourage a shift to public transportation. | Not directly, but may with decreased car ownership | Not directly | |
| 2.2.a. Number of users per car | No, no car needed. | No impact | Yes | N/A | ||
| 2.2.b. Vehicle emissions during the use phase | No, no vehicle emissions. However, the equivalent climate impact of the information and communication technology (ICT) equipment use during virtual meetings is, from a life cycle perspective, orders of magnitudes less than the impact from the travel replaced. | No direct impact. Currently, vehicles using electricity as the only source of power have a very short range, and would therefore be useful in a scenario where co-working hubs serve the local neighborhood where people live. | Potentially, dependent on the fuel used. | N/A | ||
| 2.2.c. Vehicle emissions during production phase | No vehicle emissions. See 2.2.b. | No impact | No | N/A | ||
| Business Value Indicators | Services | |||||
| Category | Indicator | Value | Web-Conferencing | Co-Working Hub | Transportation Network Service | Dockless Bike Sharing System |
| 1.Value creation | 1.1. Business model archetype | 1.1.a. Technological (introduce new environmental technology) (Yes/No) | No | No, co-working hubs make use of existing technologies, which means it is not a new environmental technology | No, built using existing technology: the business model is the innovation | Yes. The companies use the dockless bike-sharing system as a platform to launch other services. The dockless bike-sharing service itself has a traditional business model. |
| 1.1.b. Social (address social issues, low-income groups contexts, behavior change, value for stakeholders) (Yes/No) | No | Yes, a co-working hub can create value for both the users of the hub and society, e.g., the creation of stronger local communities and the integration of citizens living under different economic conditions. | Yes | Yes, it delivers functionality instead of ownership. | ||
| 1.1.c. Economic (change dominant organizational and economic paradigms underlying business activities) (Yes/No) | 1.1.c. Yes, there is evidence that companies benefit economically by introducing web-conferencing solutions on a large scale in the company. | Yes, it will change the dominant organizational norm that people need to be at a specific workplace. | Yes | No, according to Daxue consulting [58]. However, it could also be argued that bike sharing could have a big impact on urban transportation if more infrastructure and ICT is integrated to make their access easy and simple. | ||
| 2. Value capture | 2.1. Profit models | 2.1.a. Selling (Yes/No) | 2.1.a. Yes, for businesses, but no for private persons | No, there’s nothing to sell, since it’s a sharing model. | No | No |
| 2.1.b. Leasing (Yes/No) | 2.1.b. Yes | No | No | No | ||
| 2.1.c. Subscription (Yes/No) | 2.1.c. Yes | Yes, there are different subscription models used in the different co-working hubs. | No | Sometimes | ||
| 2.1.d. Pay per use (Yes/No) | 2.1.d. Yes | Yes, for some of the services in a co-working hub, a pay-per-use model is used. | Yes | Sometimes | ||
| 2.1.e. Non-profit (Yes/No) | 2.1.e. No | Yes, co-working hubs are sometimes housed in a café or a library, where there are no fees charged for the use. | No | No | ||
| 3. Customer value offer (value proposition) | 3.1. Mix of Product/service (hardware/software) | 3.1.a. Product-oriented (Yes/No) | 3.1.a Yes, if the web-conferencing equipment is a shared resource. | No | No | No |
| 3.1.b. Use-oriented (Yes/No) | 3.1.b. Yes, web-conferencing services are often offered as a service. | Yes | Yes | Yes | ||
| 3.1.c. Result-oriented (Yes/No) | 3.1.c. Yes | No | No | No | ||
| 4. Uniqueness (competitive advantage) | 4.1. Strategy | 4.1.a. Cost leadership (Yes/No) | 4.1.a. Yes, if web conferencing is compared to travel, and especially long-distance travel. | No, currently it’s not the price that is the main selling point for co-working hubs. | Not officially, but in practice | Yes |
| 4.1.b. Differentiation (Yes/No) | 4.1.b. Yes, web conferencing solutions are targeting different customers; e.g., Adobe Connect is commonly used in universities and education, while Skype for Business is targeted towards businesses and public institutions (remm.se). | Yes, it’s the community that comes with the hub. | Yes | Yes, it is a differentiation strategy with a type of ICT inbuilt technology for tracking and booking, inbuilt technology for locking, etc. | ||
| 4.1.c. Focus/Segmentation (Yes/No) | 4.1.c. Yes, see above 4.1.b. | Yes, the focus is currently on small to medium-sized enterprises (SMEs) and startups. | No | No | ||
| 5. Type of innovation | 5.1. Newness to the market | 5.1.a. Radical innovation (Yes/No) | 5.1.a. No | No | Potentially | Yes, it uses platform technology to create network effects. |
| 5.1.b. Really new innovation (Yes/No) | 5.1.b. No | No-except if it’s localized in the outer regions of the residential areas. | Potentially | No | ||
| 5.1.c. Discontinuous innovation (Yes/No) | 5.1.c. No as an ICT innovation, but yes when it leads to a shift from using different means of transportation to using ICT technologies. | No, not really a game-changer at first sight. | Potentially | Yes | ||
| Use/Spread Indicators | Services | |||||
| Category | Indicator | Value | Web-Conferencing | Co-Working Hub | Transportation Network Service | Dockless Bike Sharing System |
| 1. Geographic distribution | 1. In what countries/cities/municipalities is the service available? | Name of country/city/municipality | It is available globally, although not in locations without network access. | Co-working hubs are available globally in most cities of the world. | Many cities all over the world, although some cities and countries are re-formulating their laws to prevent these types of services. There are more in the United States (USA). | Bike-sharing is available in many parts of the world. However, the dockless bikes have launched relatively recently (2014) and therefore, there are still many cities without them. |
| 1.2. Type of city | 1.2.a. Rising megacity (Yes/No) | 1.2.a Yes | Yes, available in Nairobi, Kampala, and Jakarta. | Yes, available in e.g., Dhaka, Bangladesh | Yes | |
| 1.2.b. Established megacity (Yes/No) | 1.2.b Yes | Yes, cities such as New York. | Yes, available in e.g., Tokyo, Japan | Yes | ||
| 1.2.c. Car-dominated mature city (Yes/No) | 1.2.c. Yes | Yes, in cities such as Detroit and Atlanta | Yes, strong in e.g., Los Angeles | Yes | ||
| 1.2.d. Mature advanced city (Yes/No) | 1.2.d Yes | Yes, in cities such as Amsterdam and Stockholm | Yes, available in e.g., Amsterdam | Yes | ||
| 1.3. Urban spread/localization: in which zones are the service available? | 1.3.a. Zone 1—Central Urban (Yes/No) | 1.3.a. Yes | Yes, they are localized in city centers and hot tech spaces alike. | Yes | Yes | |
| 1.3.b. Zone 2—Inner suburbs (Yes/No) | 1.3.b. Yes | No, this type of service is currently not available in local nodes. | Yes | Yes | ||
| 1.3.c. Zone 3—Rural and outer suburbs (Yes/No) | 1.3.c. Yes | No | Not always | No | ||
| 1.3.d. Zone 3—Remote (Yes/No) | 1.3.d. Yes | Yes, ski resorts are one example of a remote place where co-working hubs currently are available. | Not normally, tends to be focused on cities and their surrounding areas | No | ||
| 2. Adoption | 2.1. How many registered users are there? | Number of registered users (quantity) | Skype has 300 million users monthly [59] | Approx. 1.27 million people worked in co-working hubs worldwide in 2017 [60]. | For Uber alone, there are 75 million riders and three million drivers registered [48] | One example: Ofo (200 million users) [54] |
| 2.2. How many actual users are there? | Total revenues (amount) | Web conferencing market is USD 3.3 billion, growing at 6% annually [61]. | In this particular case, the lowest level of subscription requires a payment, which means that the registered number of users is identical to the actual number of users. | According to Statista.com [62], ride-sharing, including online carpooling platforms, online platforms that let user book rides, and taxi companies that offer services through an app had a revenue of USD 60 billion in 2018. | The number of public-use bicycles available around the world has more than tripled between 2013–2016. By the end of 2016, nearly 2.3 million bikes were available to the public around the world, with 1.9 million of these located in China alone. With 430 bike-sharing programs, China is the clear frontrunner in terms of bike-sharing [63]. | |
| Average revenue per user (ARPU) (amount) | The web conferencing market is projected to grow at an approximate Compound Annual Growth Rate of 10 percent annually from 2016 to 2024 [61]. | Worldwide, there are an average of 129 members per co-working hub, and there are 15,500 co-working hubs globally [60]. | ||||
| 3. Level of societal transition | 3. What level of societal transition has occurred because of this service? | 3.a. Niche | 3.1.a. Yes | Yes | Yes | Yes |
| 3.b. Regime | 3.1.b. Partly, but there are still many cultural and organizational barriers before it can be used to its full potential. | No | No | No, for cities, there are a number of problems with the dockless bikes. Thousands of bikes are parked everywhere around the city, and many are not working because nobody takes care of them. | ||
| 3.c. Landscape | 3.1.c. Yes, it is used to cut travel cost in many organizations, and also as an argument to reduce environmental impact. | No. There are still many institutional problems with a co-working hub for people employed in organizations other than smaller firms up to seven persons. Letting people work from where they want is not accepted by many larger firms. Many types of insurance do not cater to this type of solution. Also, who should pay for the extra cost that a service such as this will lead to? | Yes | No | ||
| Category | Indicator | Values | Direct Effects, Including Conditions | Indirect Effects, Including Conditions |
|---|---|---|---|---|
| 1. Reduce traveling overall | 1.1. Number of trips | 1.1.a. AaaS—Yes/No | 1.1.a. | 1.1.a. |
| 1.1.b. Encourages “batching” activities—Yes/No | 1.1.b. | 1.1.b. | ||
| 1.2. Distance of trips | 1.2.a. Encourages neighborhood-based activities—Yes/No | 1.2.a. | 1.2.a. | |
| 2. Mobility: reduce environmental impact per kilometer traveled | 2.1. Better modes of transport | 2.1.a. Encourages shift to walking—Yes/No | 2.1.a. | 2.1.a. |
| 2.1.b. Encourages shift to biking—Yes/Possibly/No | 2.1.b. | 2.1.b. | ||
| 2.1.c. Encourages shift to public transportation—Yes/Possibly/No | 2.1.c. | 2.1.c. | ||
| 2.2. Vehicle emissions | 2.2.a. Number of users per vehicle when in use | 2.2.a. | 2.2.a. | |
| 2.2.b. Number of users per vehicle overall | 2.2.b. | 2.2.b. | ||
| 2.2.c. Vehicle emissions during the use phase | 2.2.c. | 2.2.c. | ||
| 2.2.d. Vehicle emissions during the production phase | 2.2.d. | 2.2.d. |
| Category | Indicator | Value |
|---|---|---|
| 1. Geographic distribution | 1. In what country/city/municipality is the service available? | Name of country/city/municipality |
| 1.2. Type of city | 1.2.a. Rising megacity (Yes/No) | |
| 1.2.b. Established megacity (Yes/No) | ||
| 1.2.c. Car-dominated mature city (Yes/No) | ||
| 1.2.d. Mature advanced city (Yes/No) | ||
| 1.3. Urban spread/localization: in which zones is the service available? | 1.3.a. Zone 1—Central Urban (Yes/No) | |
| 1.3.b. Zone 2—Inner Suburbs (Yes/No) | ||
| 1.3.c. Zone 3—Rural and Outer Suburbs (Yes/No) | ||
| 1.3.d. Zone 3—Remote (Yes/No) | ||
| 2. Market/Adoption | 2.1. How many registered users are there? | Number of registered users (quantity) |
| 2.2. How many actual users are there? | Total revenues (amount) | |
| Average revenue per user (ARPU) (amount) | ||
| 3. Policy | 3.1. Law | 3.1.a. Is there a need for new laws because of the service? (Yes/No) |
| 3.1.b Has the law changed because of the service? (Yes/No) | ||
| 3.2 Regulation | 3.2.a. Is there a need for new regulation because of the service? (Yes/No) | |
| 3.2.b. Has regulations changed because of the service? (Yes/No) | ||
| 4. Technology | 4. Newness to the households | 4.1.a. Is it an existing technology (Yes/No) |
| 4.1.b. Is the technology new for households in the city (Yes/No) | ||
| 5. Culture | 5.1 Use of individuals | 5.1.a. Is it an existing service concept(Yes/No) |
| 5.2.b. Is the service concept new for households in the city (Yes/No) |
© 2018 by the authors. Licensee MDPI, Basel, Switzerland. This article is an open access article distributed under the terms and conditions of the Creative Commons Attribution (CC BY) license (http://creativecommons.org/licenses/by/4.0/).
Share and Cite
Ringenson, T.; Arnfalk, P.; Kramers, A.; Sopjani, L. Indicators for Promising Accessibility and Mobility Services. Sustainability 2018, 10, 2836. https://doi.org/10.3390/su10082836
Ringenson T, Arnfalk P, Kramers A, Sopjani L. Indicators for Promising Accessibility and Mobility Services. Sustainability. 2018; 10(8):2836. https://doi.org/10.3390/su10082836
Chicago/Turabian StyleRingenson, Tina, Peter Arnfalk, Anna Kramers, and Liridona Sopjani. 2018. "Indicators for Promising Accessibility and Mobility Services" Sustainability 10, no. 8: 2836. https://doi.org/10.3390/su10082836
APA StyleRingenson, T., Arnfalk, P., Kramers, A., & Sopjani, L. (2018). Indicators for Promising Accessibility and Mobility Services. Sustainability, 10(8), 2836. https://doi.org/10.3390/su10082836