Article

The Cause and Evolution of Urban Street Vitality under the Time Dimension: Nine Cases of Streets in Nanjing City, China

1
School of Architecture, Southeast University, 2 Sipailou, Nanjing 210000, Jiangsu, China
2
Department of Architecture and Civil Engineering, City University of Hong Kong, Y6621, AC1, TatChee Ave, Kowloon, Hong Kong 999077, China
3
Building Technology and Urban Systems Division, Lawrence Berkeley National Laboratory, 1 Cyclotron Road, Berkeley, CA 94720, USA
*
Authors to whom correspondence should be addressed.
Sustainability 2018, 10(8), 2797; https://doi.org/10.3390/su10082797
Submission received: 1 July 2018 / Revised: 1 August 2018 / Accepted: 2 August 2018 / Published: 7 August 2018

Abstract

:
Street vitality is associated with a comfortable human-based public environment and urban sustainability. In most current studies, street vitality is assessed considering single or multi factors; however, the impact of time dimension is ignored. This study selects nine different year-built streets in old, main, and new urban areas, in Nanjing, China, proposes a framework to assess street vitality considering the different time dimensions and selects the following factors: street form, including building density, continuity, and height-width; street business type, including store density, function density, and permeation rate; and street accessibility, including location, the number of entrances/exits, transportation, and walkability. After calculating the values of the subfactors, a ranking method was applied to assign the ranking of impact of all factors for a comprehensive analysis. The results showed that Pipa Street, Wufu Street in a main urban area, and Hongmiao Street had the highest street vitality and the highest rankings of almost all the factors. Street vitality in different periods demonstrated that street vitality in new urban areas is lower compared with old and main urban areas.

1. Introduction

An urban built environment can be understood as a system that covers many interconnected spaces supported by social progress and technological capabilities [1]. Urban public spaces give a sense of visibility to buildings and public life, as a precondition for the development of open space, and are highly related to urban sustainable development [2,3]. As one of the largest urban public spaces, streets bear a profound social and humanistic connotation [4]. Street vitality is a key issue in studying urban public space and providing a sustainable human-based public environment [4]. Street vitality is broadly categorized as the continuing force of urban streets [5], the diversity of urban life [6], or the activity of the people in streets [7]. After 30 years of rapid urbanization, Chinese urban construction has started to emphasize the “human first” and “the urbanization of people”, paying attention to the quality of the urban space. Whyte [8] thought that cities should be regarded as the domiciles of people, rather than as economic machines, transportation hubs, or huge platforms of building exhibition. Alexander [9] thought researchers should examine the inherent properties of urban morphological features to present the vitality of urban streets. Jacobs [10] also attempted to find desirable street forms to provide a reference for the design of such urban spaces.
Extensive research studies have investigated the correlations between transportation, road type, car parking, pedestrian environment, and street vitality, respectively. It is vital to design suitable streets by creating a safe and comfortable environment [11,12,13]. Boer [14] suggested reducing the speed limit of cars to give pedestrians priority. Ikioda [15] explored the impact of road construction on market and street traders in urban environments, and Calanis et al. [16] analyzed the road safety of people on the street while considering urban road types and traffic. For street car parking, Ajeng and Gim [17] studied on-street car parking issues and analyzed the differentiation between car parking duration and demand on streets in Yogyakarta City, Indonesia. Park et al. [18] analyzed the impact of on-street car parking on the thermal environment of streets for pedestrians according to Korea’s green parking project. For the pedestrian environment, Kang also applied multilevel regression models to identify the positive effects of street facilities, such as stores, cultural issues, local street networks on walking volume, and so forth [19].
The built environment is also important for street vitality [20,21]. Park et al. [22] applied a multilayer mean radiant temperature model for pedestrians on streets according to the built environment. Sung et al. [23] identified the association of the physical environment with the activity on streets in Seoul City. Lee et al. [24] investigated urban heat island environment cooling with the use of water spray systems in urban street canyons. Lee [25] analyzed the thermal characteristics of streets using a thermal imaging camera on commercial streets in Seoul, Korea. Wojnicki and Kotulski [26] studied how the parameter of traffic intensity detectors influences the energy use of dynamic street lighting with a case study in Krakow, Poland. Wang et al. [27] studied street ecosystems with trees of different ages in Dalin’s streets to suggest maximizing and sustaining the street built environment. Shirvani [28] explored eight major components of urban spatial organization and their interrelationships. Xu [29] proposed the evaluation indicators, such as physical spatial morphology and behavioral activities to monitor the factors that contribute to public space vitality. Katz et al. [30] studied the impact of compactness, walking scale, function mixture, and building density on street vitality.
Furthermore, Mahmoudi et al. [31] reviewed factors, including proportions of space, architectural style, accessibility, and so on and summarized the effects of physical problems on the quality of streets in Kuala Lumpur. Ewing and Clemente [32] found it necessary to study urban form measurement and performance. Long and Ye [33] proposed applying urban forms of humanistic scaling to study urban vitality. Harvey et al. [34] proposed a method for measuring geometric forms of street landscapes based on the skeletal streetscape. Hou et al. [35] quantified the best height-to-width ratio necessary for the renewal and vitality-building of traditional urban streets and alleys. Zarin et al. [36] investigated the vitality levels of two streets in Tehran with a questionnaire and a standard multivariate regression analysis. Sung and Lee [37] constructed multilevel regression models that used walking as the dependent variable, to analyze and observe six conditions of urban vitality.
However, it is common to find that streets with rich histories and worn-out facilities in old urban areas are bustling while recently-completed streets in some new urban areas, remain relatively empty [38]. Some researchers suggested urban vitality with the progression of time is the process of accumulating suitable building density and form while maintaining a high level of street accessibility [39]. Current studies focus on relatively fewer influencing factors of urban vitality from a static perspective. Assessing urban street vitality by comprehensively considering street form, street business type, and street accessibility, together combined with the impact of different time periods, has received little attention. To address these issues, this study selects three different groups of streets, built in different time periods, in Nanjing, China, and defines three main factors and 10 subfactors to seek street vitality under time dimensions through measurements and analysis of influencing factors. Finally, ranking method and multi-factor analysis are conducted to assess the impact of different factors on street vitality. Therefore, this study aims to achieve the following objectives:
(1)
Propose a framework to quantify the impact of select factors on urban street vitality under different time dimensions.
(2)
Apply street form (e.g., street density, continuity, height–width ratio), street business type (e.g., street function mixture, density, permeation rate), and street accessibility (e.g., street location, transportation, walkability, etc.) to comprehensively analyze urban street vitality.
(3)
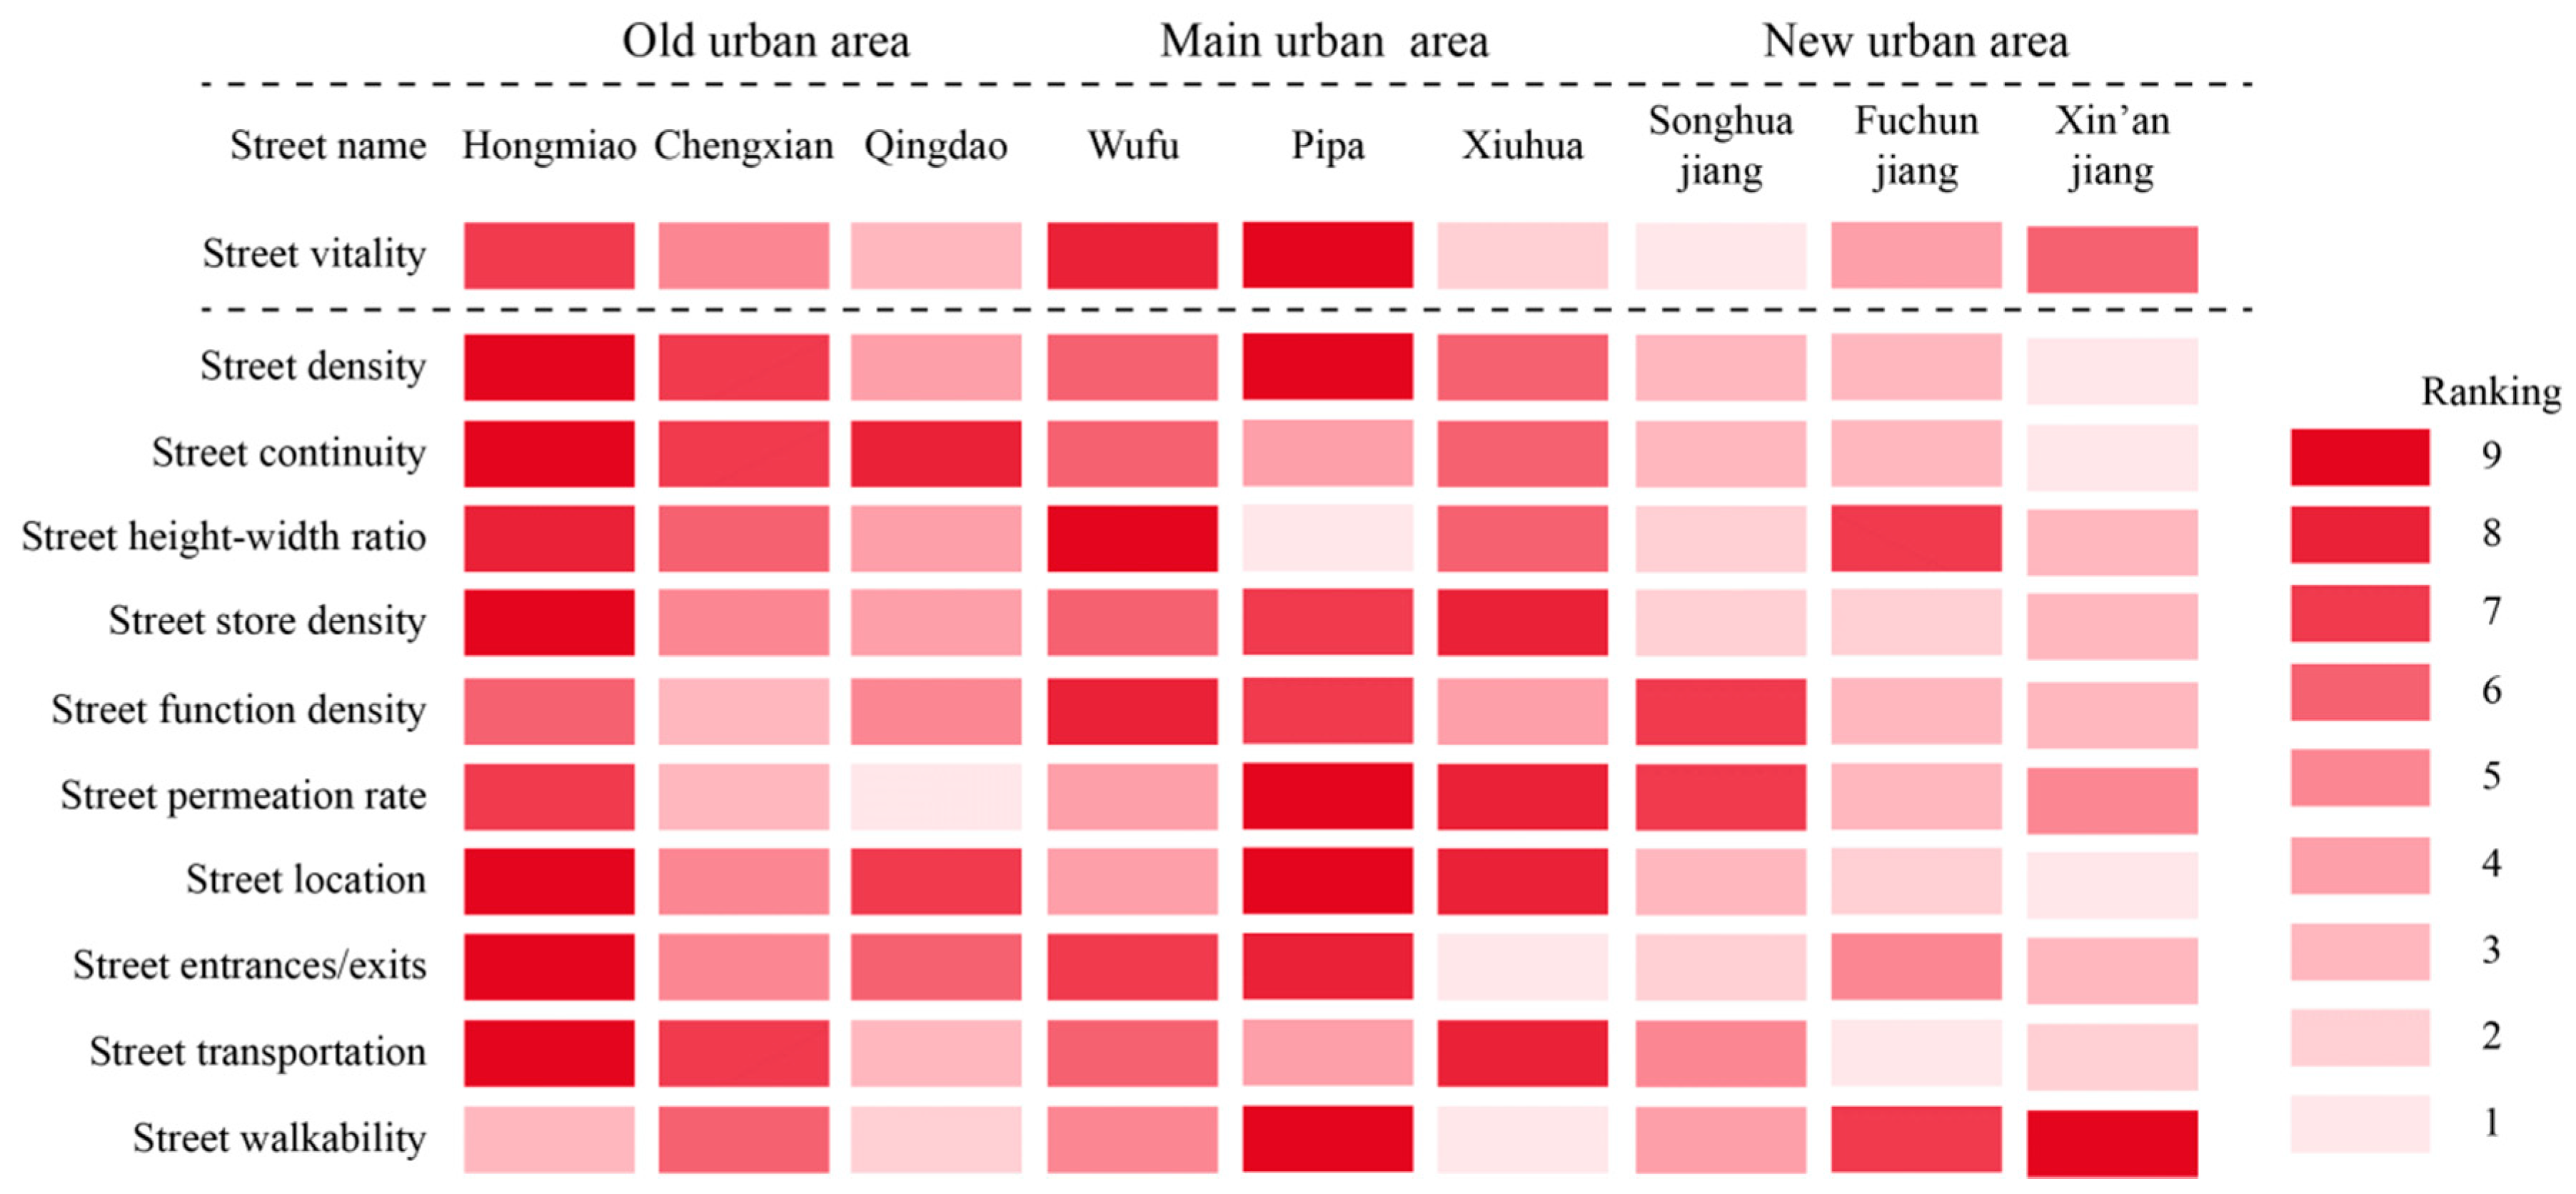
Propose a ranking method and conduct a multi-factor analysis of street vitality to compare the impact of each factor to guide urban planning, public space design, and street vitality construction.
(4)
Provide significant insights for street vitality and studies regarding urban sustainable development.

2. Methodology

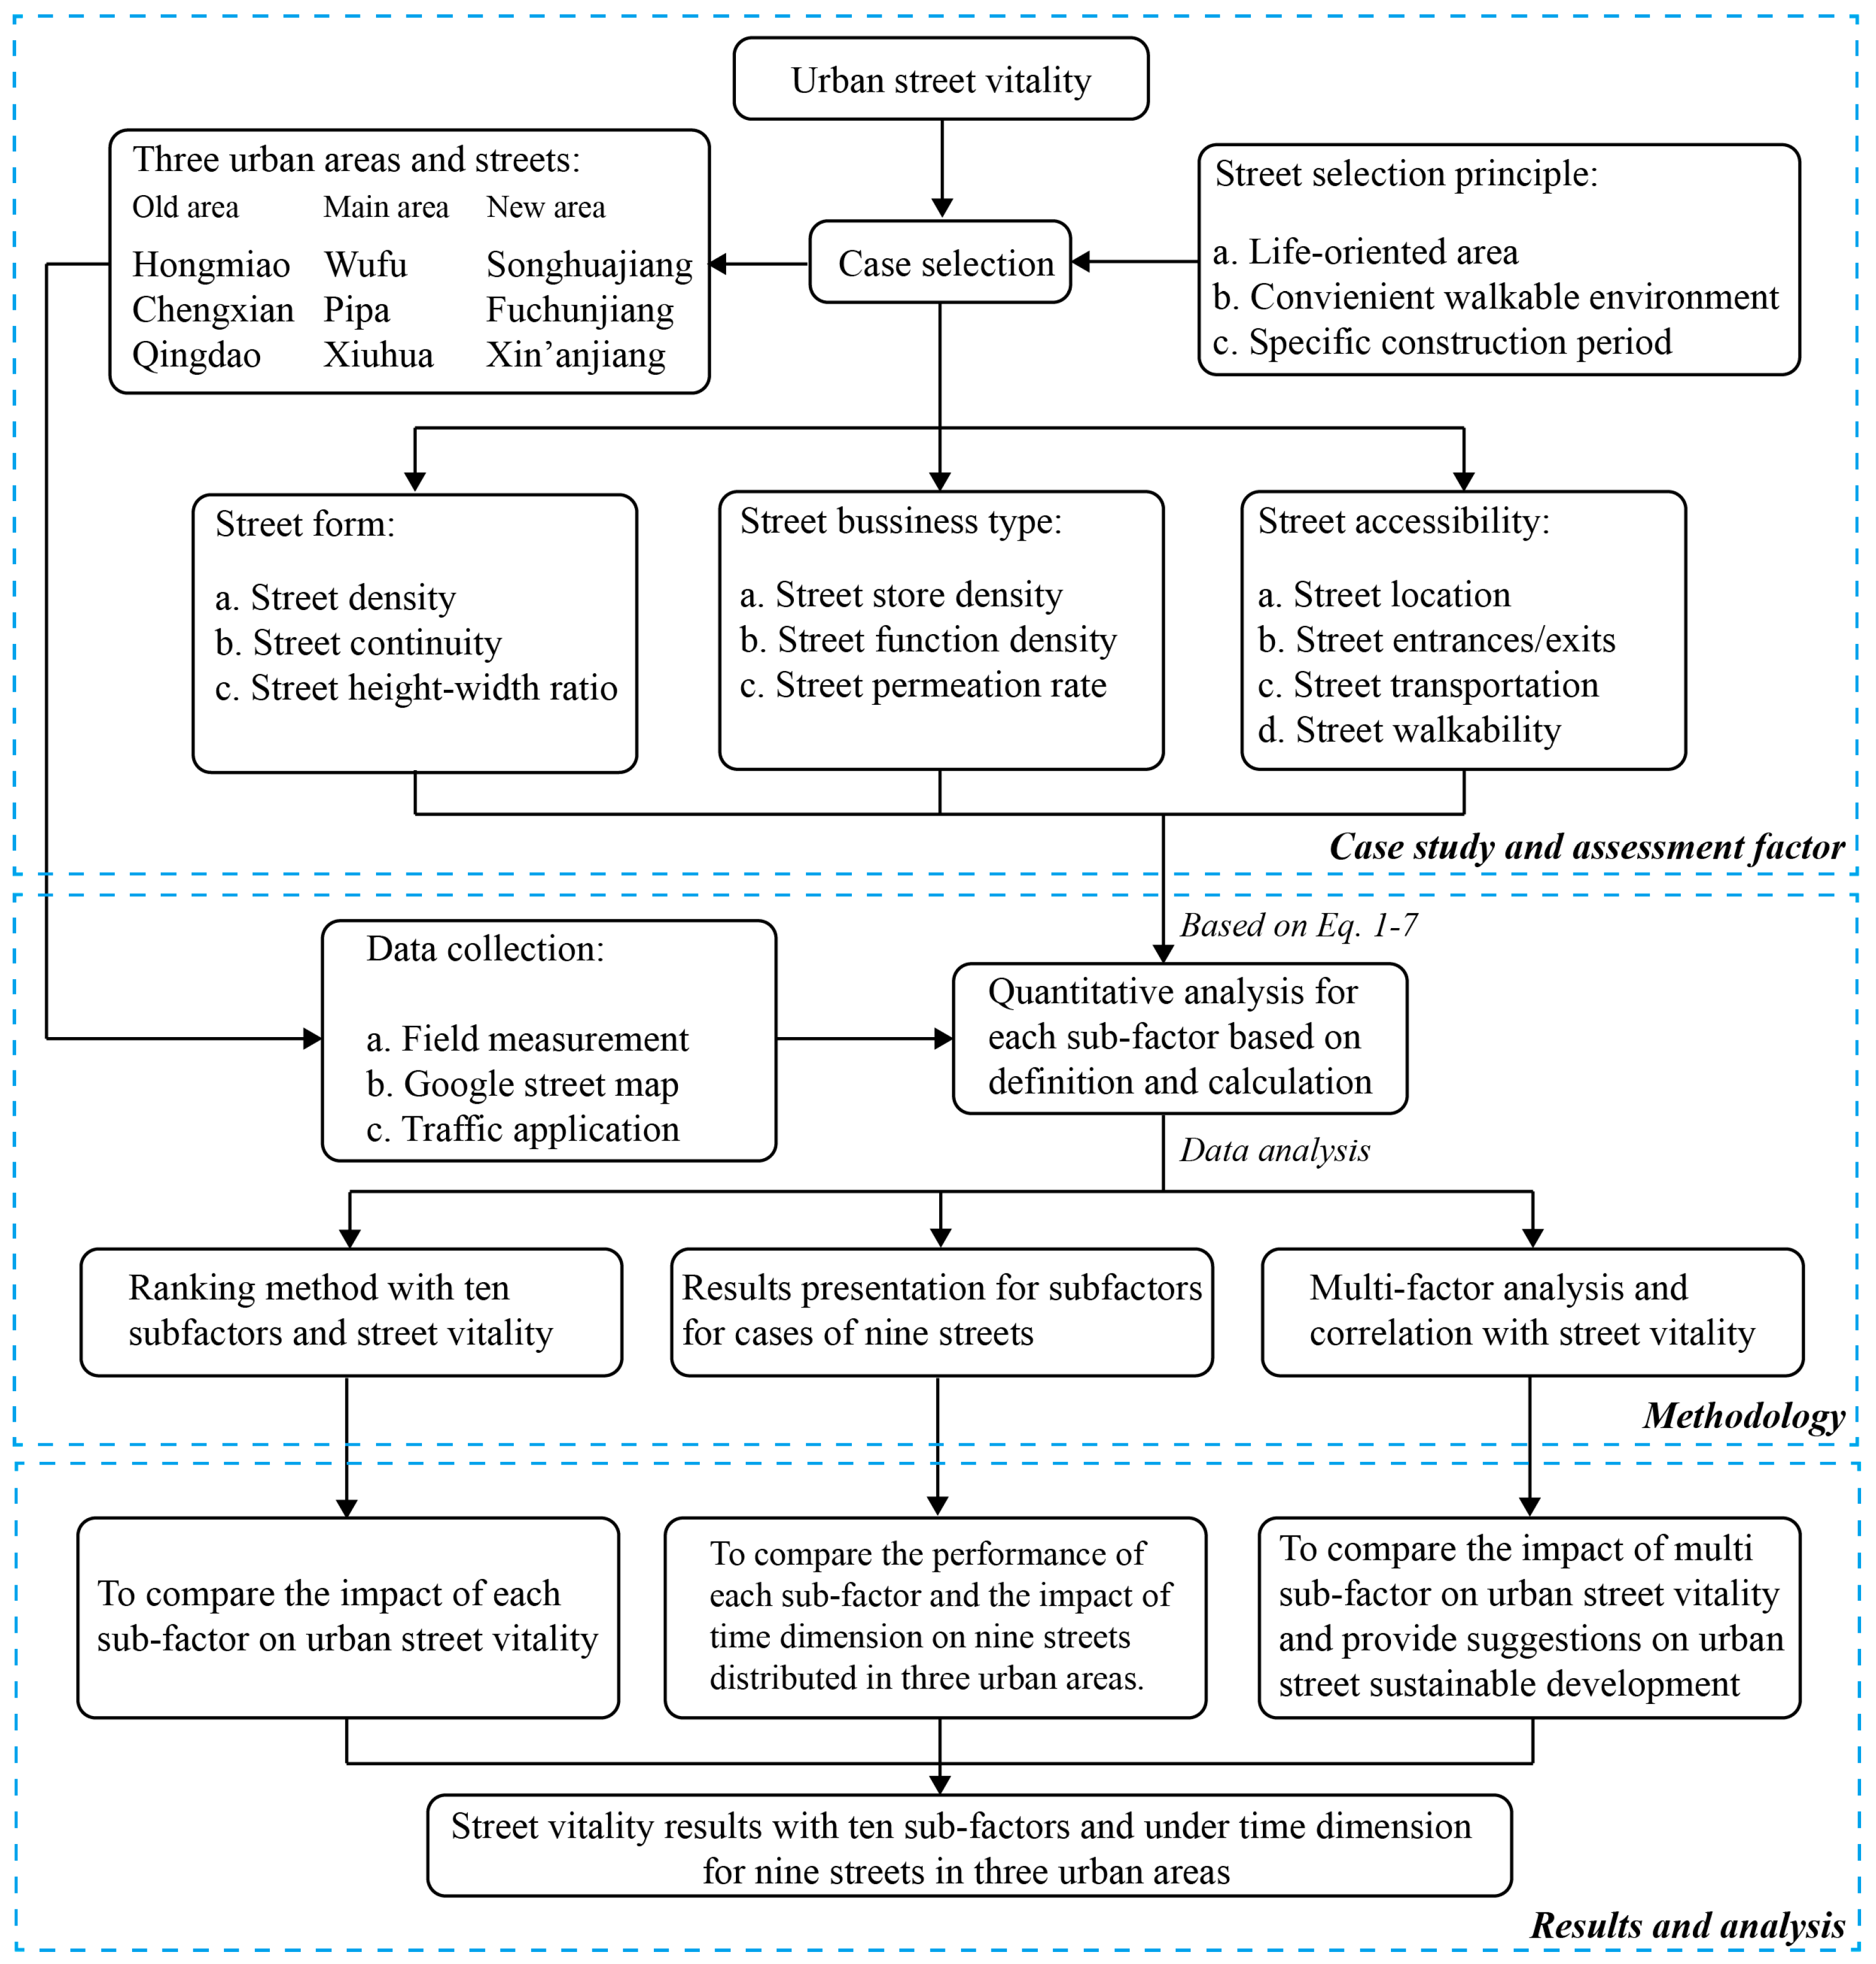
2.1. Overview of Methodology

Figure 1 shows the flow chart for the methodology applied in this study. In the first step, this study selected nine streets in the urban area of Nanjing City, China, and defines three main factors and 10 subfactors that influence street vitality in terms of street form, street business, and street accessibility, respectively. Upon the completion of field measurements and data collection, we conducted a quantitative analysis for each subfactor based on its definition and calculation. Third, a ranking method and multi-variable regression method were applied to (a) assess the impact of single factor on street vitality according to correlation comparison and (b) visualize the impact of multiple factors on street vitality to provide suggestions for the sustainable development of urban streets.

2.2. Assessment of Factors

This study considered three main factors, including street form, street business type, and street accessibility. Street form consists of street density, street continuity, and street height–width ratio. Street density ( D s ) is highly related to street vitality, which means the percentage of total building area ( A b ) compared with the total allocated building area ( A s ) of the street, which can be calculated using Equation (1). Typically, low street density will not facilitate high street vitality. Street continuity ( C s ) is denoted with the average building-to-line ratio. Street interfaces with good continuity can help form a desirable vitality atmosphere and a higher continuity, making the street look more orderly. Street continuity can be calculated by the total length of the building walls ( L b ) along the street divided by the total length of the street ( L s ), which can be seen in Equation (2). The street height–width ratio ( H W s ) can provide the spatial feelings for people and is calculated in Equation (3) by defining the average height of buildings ( H s ) along the street divided by the width of the street ( W s ).
D s = A b A s .
C s = L b L s .
H W s = H s W s .
Street business type consists of street store density, street function density, and street permeation rate. Commercial facilities located along streets provide people with daily necessities and streets with a full set of commodities and reasonably-distributed businesses to attract patrons to linger. The impact of street business types can be quantified using degrees of business activity. The degrees of business activity generally include store density, function density, and the permeation rate of frontage. Street store density ( S D s ) can be defined by the number of store buildings ( N s t o r e ) along every 100-m length of street, which is calculated by Equation (4). Similarly, street function density ( F D s ) is defined by the number of functions ( N f u n c t i o n ) of buildings for every 100-m length of street, which can be calculated using Equation (5). The permeation rate of frontage bottom businesses has a vital impact on visual accessibility, pedestrian movement, communication between streets and buildings, and between indoors and outdoors. Many American cities have clear regulations for the permeation rate of frontage buildings implemented in urban design [40], which encourages the use of large-size transparent glass and bans the use of solid walls or non-transparent showcases. The permeation rate ( P s ) can be calculated using Equation (6) by taking the percentage of the total length of the building’s transparent wall ( L t w ) along the street, divided by the total length of building’s walls located along the street.
S D s = N s t o r e L s   ×   100 .
F D s = N f u n c t i o n L s × 100 .
P s = L t w L b .
Street accessibility usually consists of street location, and accessibility refers to the opportunity for people to access streets, generally based on a distance–decay model. Accessibility can be expressed with parameters such as geo-location, public transportation, and the walking environment system. Geo-location refers to the location of a street and its spatial relationship to other places. With regards to the most fundamental influencing factors of street geo-location (in addition to the number of adjacent residential areas and their distribution scope) the distance between the street and residential areas or large business facilities is a major indicator. This indicator is excellent for measuring the advantages and disadvantages of geo-location. Therefore, this study sets up several distance ranges within 200 m, 500 m, 800 m, 1200 m, and 1500 m. One traffic application (app), so-called My Nanjing, is used in this study to acquire transportation information. Through traffic app, this study counts the number of metro stations and bus stops near streets within 500 m to assess street transportation and the number of entrances and exits along the streets. In addition, field observation was conducted to assess street walkability, and this study assigned 17 items to compare the walking environment.
Finally, to better visualize and compare the impact of the 10 subfactors on street vitality, a ranking method was applied to obtain a mathematical assessment of the street’s factors using Equation (7).
R s = { R s i > R s j ,   i f   N s i > N s j R s i = R s j ,   i f   N s i = N s j .
where, R s means the ranking of a street factor. N s i and N s j are the values of the corresponding factors of street i and street j, respectively. Because this study selects nine streets in the case study, the rankings from lowest to highest will be 1, 2, 3, …, 9.

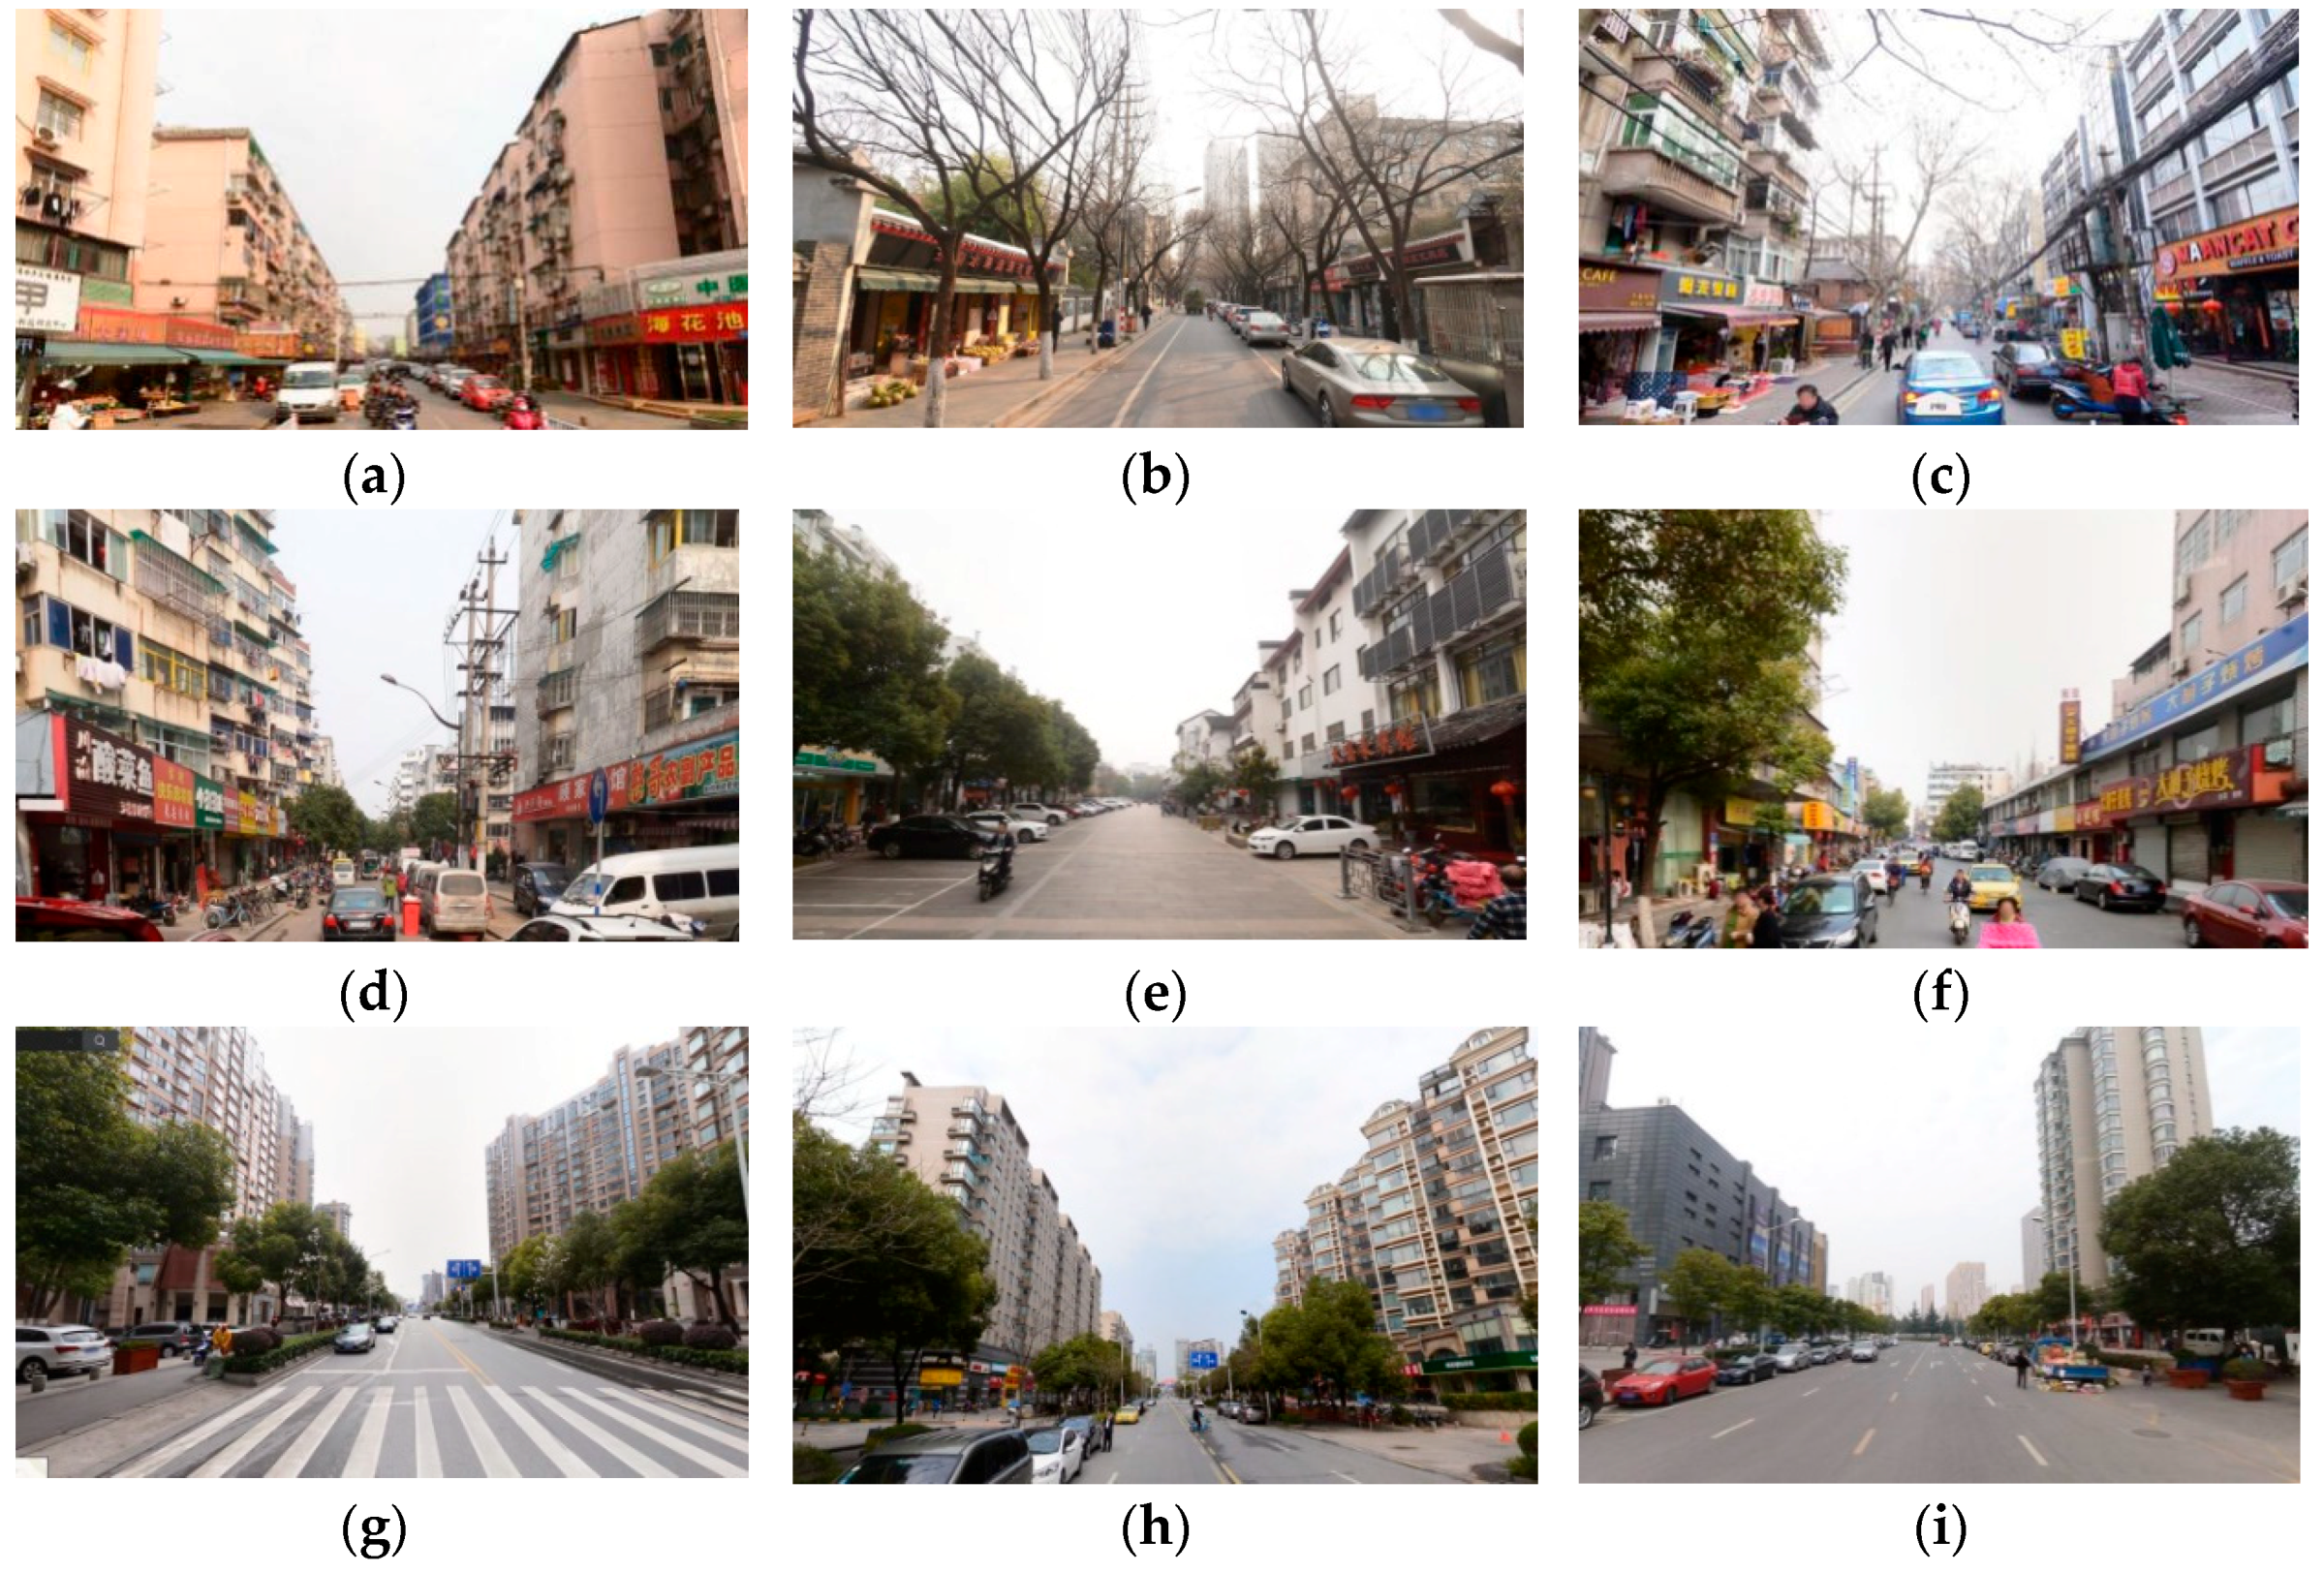
2.3. Case Study of Nine Streets

This study used the following three basic principles to select the streets for the case study: (a) the selected streets should be located close to residential areas and contribute more to residents’ daily life, work, and activities during their spare time, rather than large-scale commercial streets with commercial centers, office buildings, and markets; (b) the selected streets should have convenient and low-speed public transportation, a walkable environment, and should allow people temporary parking, rather than urban main traffic streets; and (c) the selected streets should be constructed in different time periods for comparison. Therefore, this study selects nine life-oriented streets in the urban area of Nanjing City, China, which can be found in Figure 2. Three streets are located in the old urban area built around the year 1990, three streets are located in the main urban area built around the year 2000, and three streets are located in the new urban area of Hexi in Nanjing built around the year 2010. Based on field observations and measurements of these streets, this study collected basic datasets required for each influencing factor for further assessment. This study mainly applies the field measurements, including observation and materials from the urban planning administration, and Google’s street map tool to collect cross-reference datasets for the urban street form, as well as street business type, street location, and street entrances/exits. The street’s transportation information was collected from the official transportation app of Nanjing while the information on the street walkability environment was collected through field measurements.

3. Results

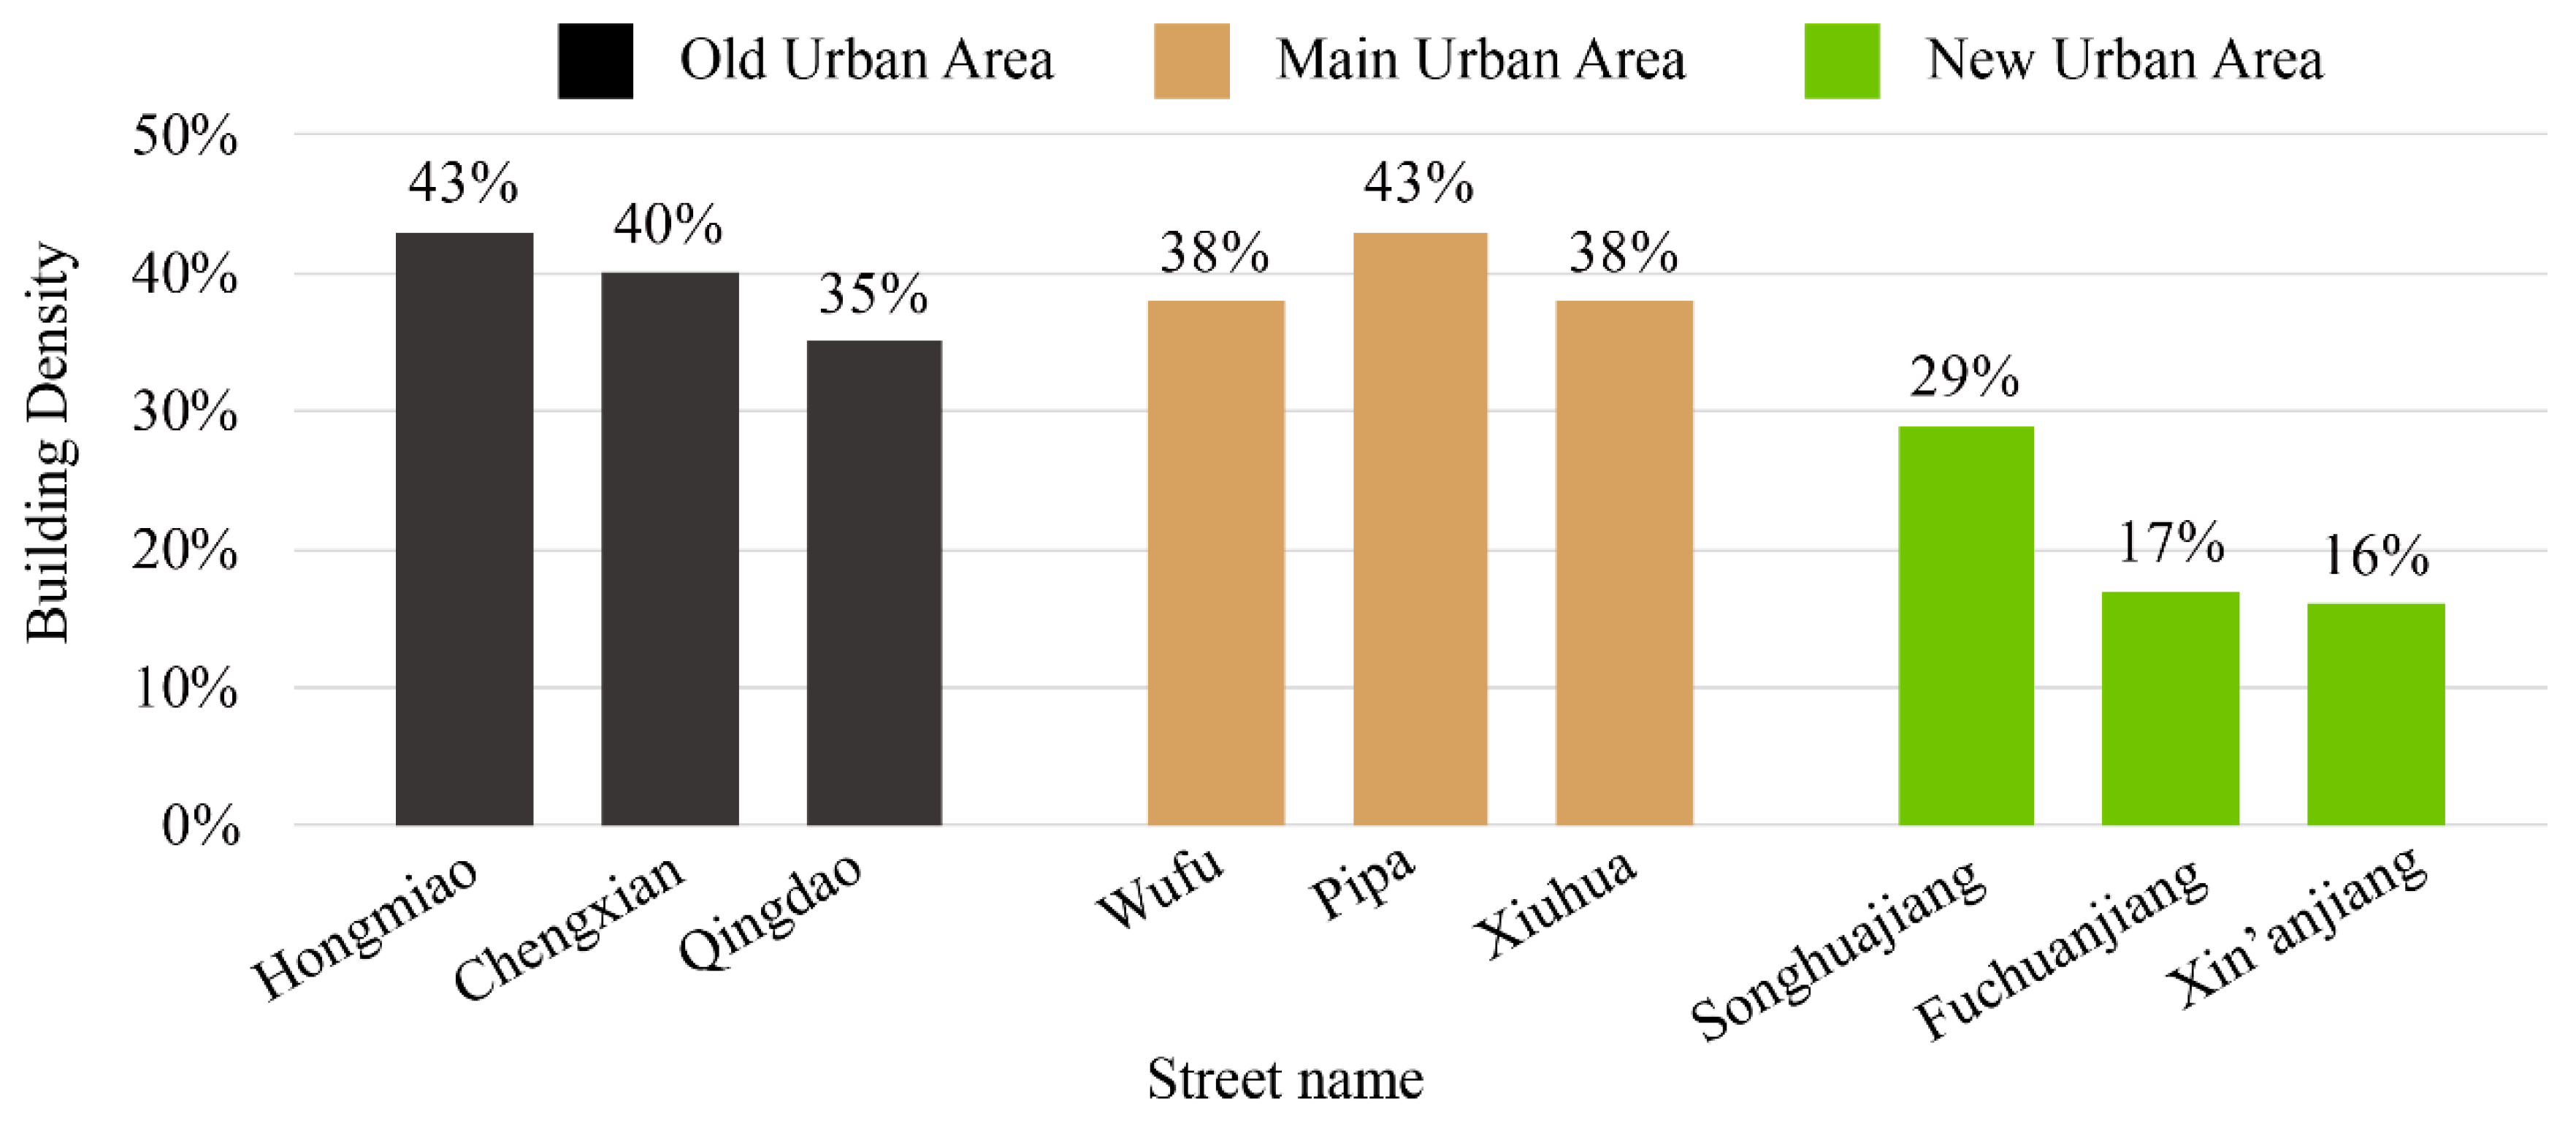
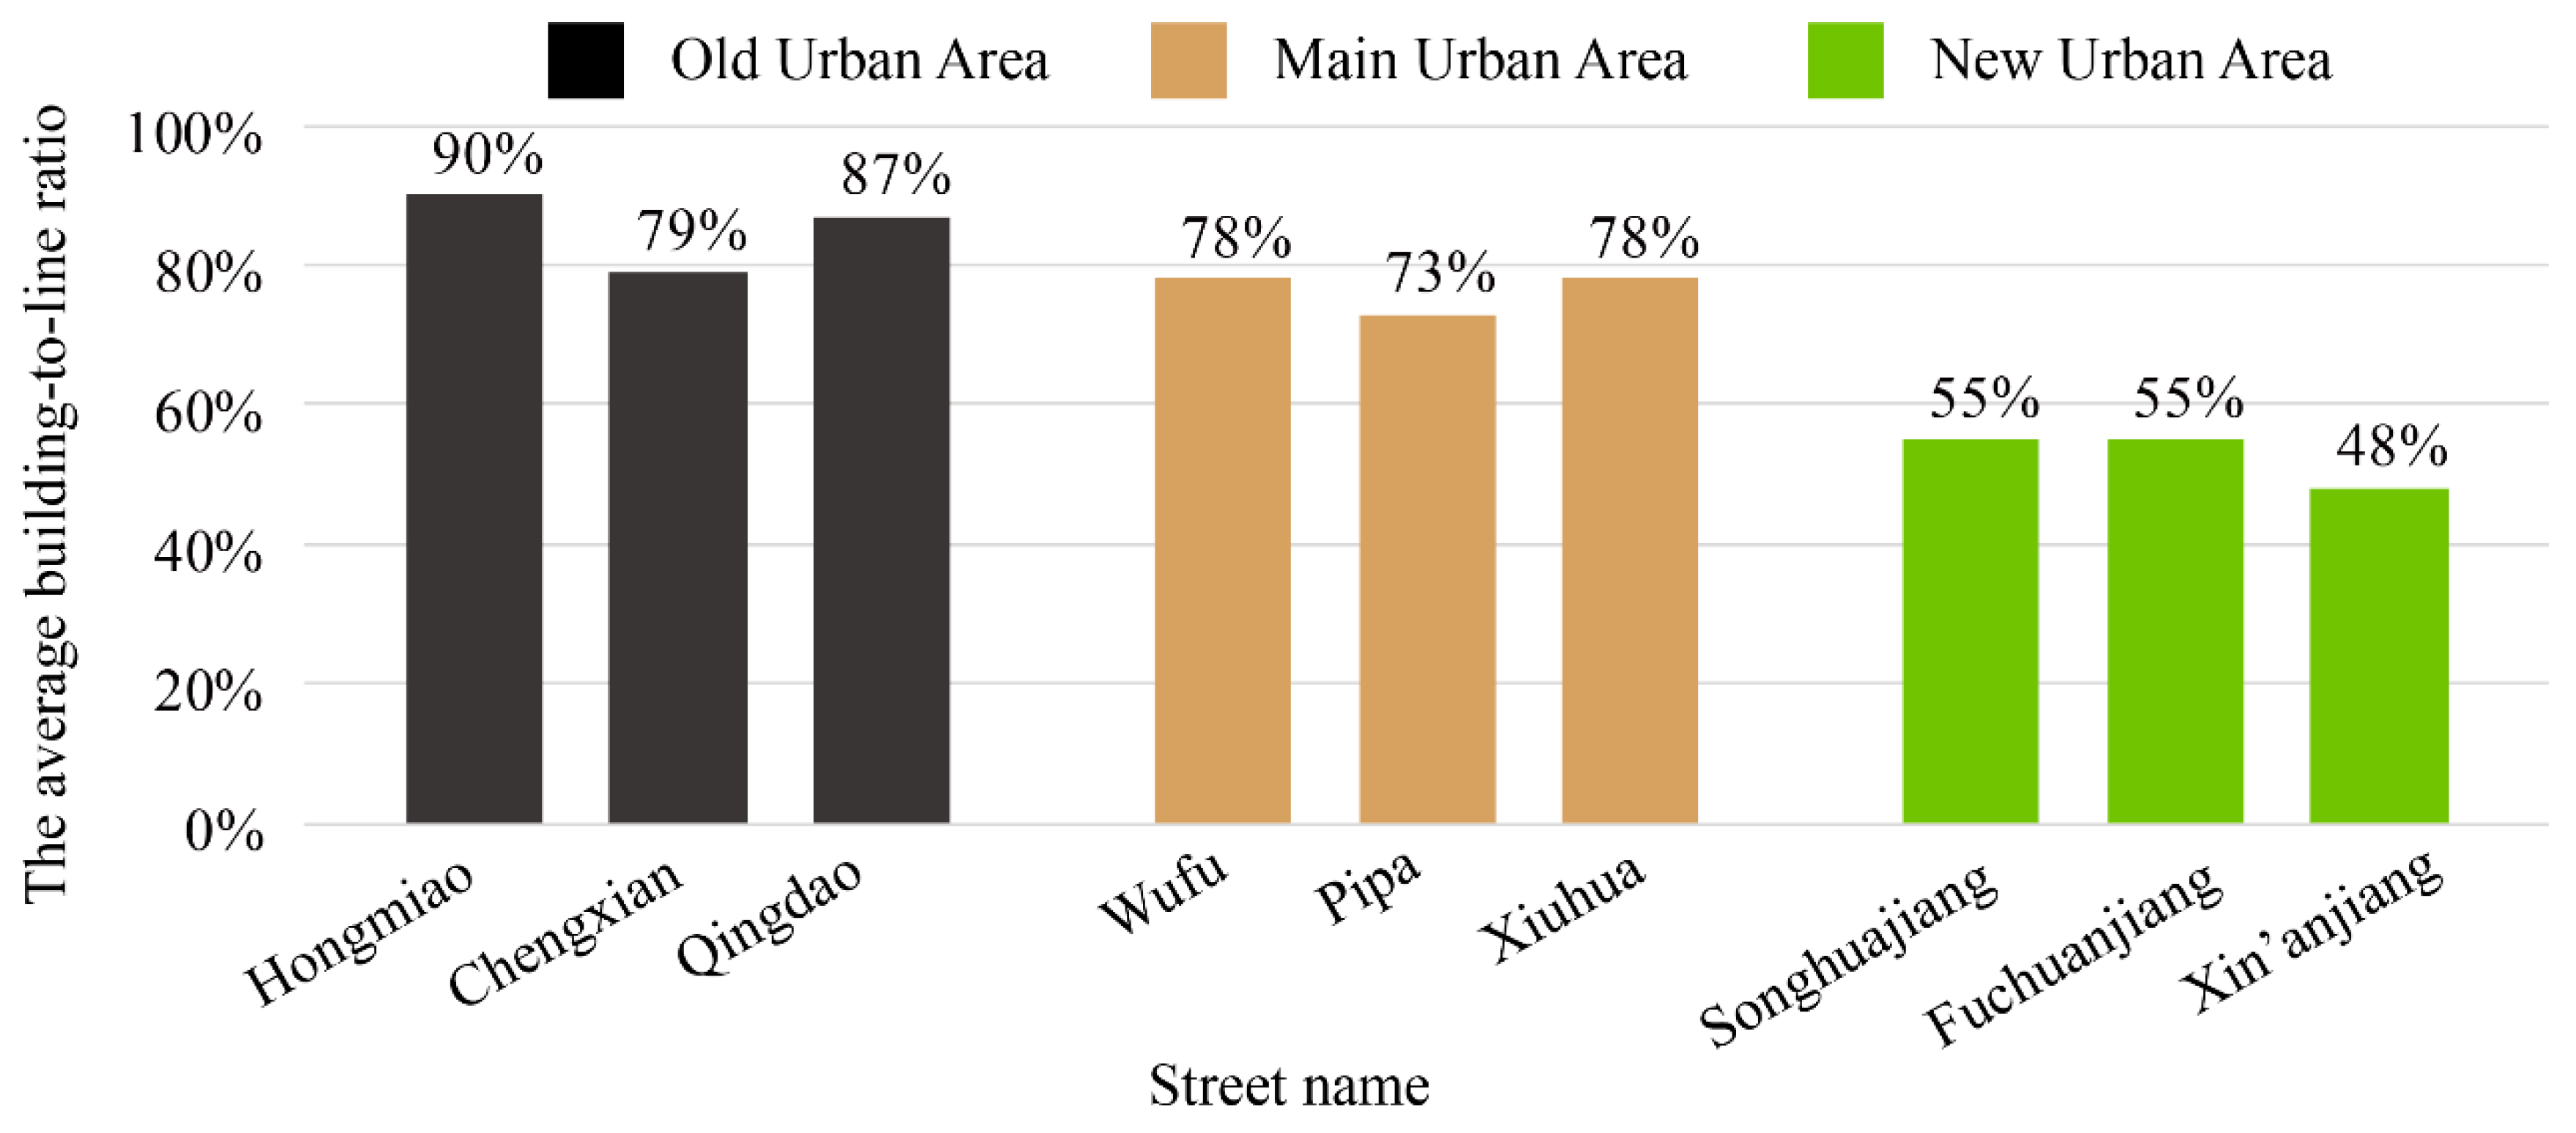
3.1. Comparative Analysis of Street Forms

Street form refers to the geometric factors of streets. The influencing factors include building density, interface continuity, and section height-to-width ratio, which are common street space attributes that affect the people’s psychological experiences. The results show that building density and street vitality are closely related. Loose texture density cannot help form a desirable business atmosphere. Figure 3 shows the building density along the nine streets calculated using Equation (1). The findings showed that the building density of buildings constructed in the new urban streets was less than the building density in the old and main streets. The average building density of streets in the old urban area was 39.3% and 39.7% in the main urban area, respectively, while average building density was only 20.7% in the new urban area. The rankings for nine streets with levels of building density are Hongmiao (9), Chengxian (7), Qiangdao (4), Wufu (6), Pipa (9), Xiuhua (6), Songhuajiang (3), Fuchuanjiang (2), and Xin’anjiang (1), respectively. Figure 4 shows the results of building continuity for the nine streets based on Equation (2). Similar to the building density results, the results for building continuity in the new urban area were also lower than in both the old and main urban areas, especially for Hongmiao Street, where the building continuity reached 90%. The average results of building continuity for the old urban area, the main urban area, and the new urban area were 85.3%, 76.3%, and 52.7%, respectively. While according to levels of building continuity, the rankings for nine streets based on Equation (7) are Hongmiao (9), Chengxian (7), Qiangdao (8), Wufu (6), Pipa (4), Xiuhua (6), Songhuajiang (3), Fuchuanjiang (3), and Xin’anjiang (1), respectively.
Figure 5 shows the results of the building height-to-width ratio on the nine streets. The street widths in the old urban area were 15 m, 18 m, and 15 m, with street height-to-width ratios of 1.41, 0.88, and 0.77, respectively. The street widths in the main urban area were 15 m, 25 m, and 16 m, with street height-to-width ratios of 1.50, 0.64, and 0.88, respectively. The street widths in the new urban area were 42 m, 47 m, and 46 m, with street height-to-width ratio of 0.69, 0.94, and 0.70, respectively. Comparatively, the street widths of the old urban area and the main urban area are narrower, with street height-to-width ratios approaching or exceeding 1. This promotes a strong street affinity suitable for walking. Streets in the new urban area are wide, with insufficient connection between both sides of the street, resulting in street height-to-width ratios of less than 1. Typically, buildings along most famous streets worldwide are generally not more than 30 m high, with height-to-width ratios ranging from 1:1.1 to 1:2.5. To rank the levels of building height-to-width ratio, we can find the rankings are Hongmiao (8), Chengxian (6), Qiangdao (4), Wufu (9), Pipa (1), Xiuhua (6), Songhuajiang (2), Fuchuanjiang (7), and Xin’anjiang (3), respectively.

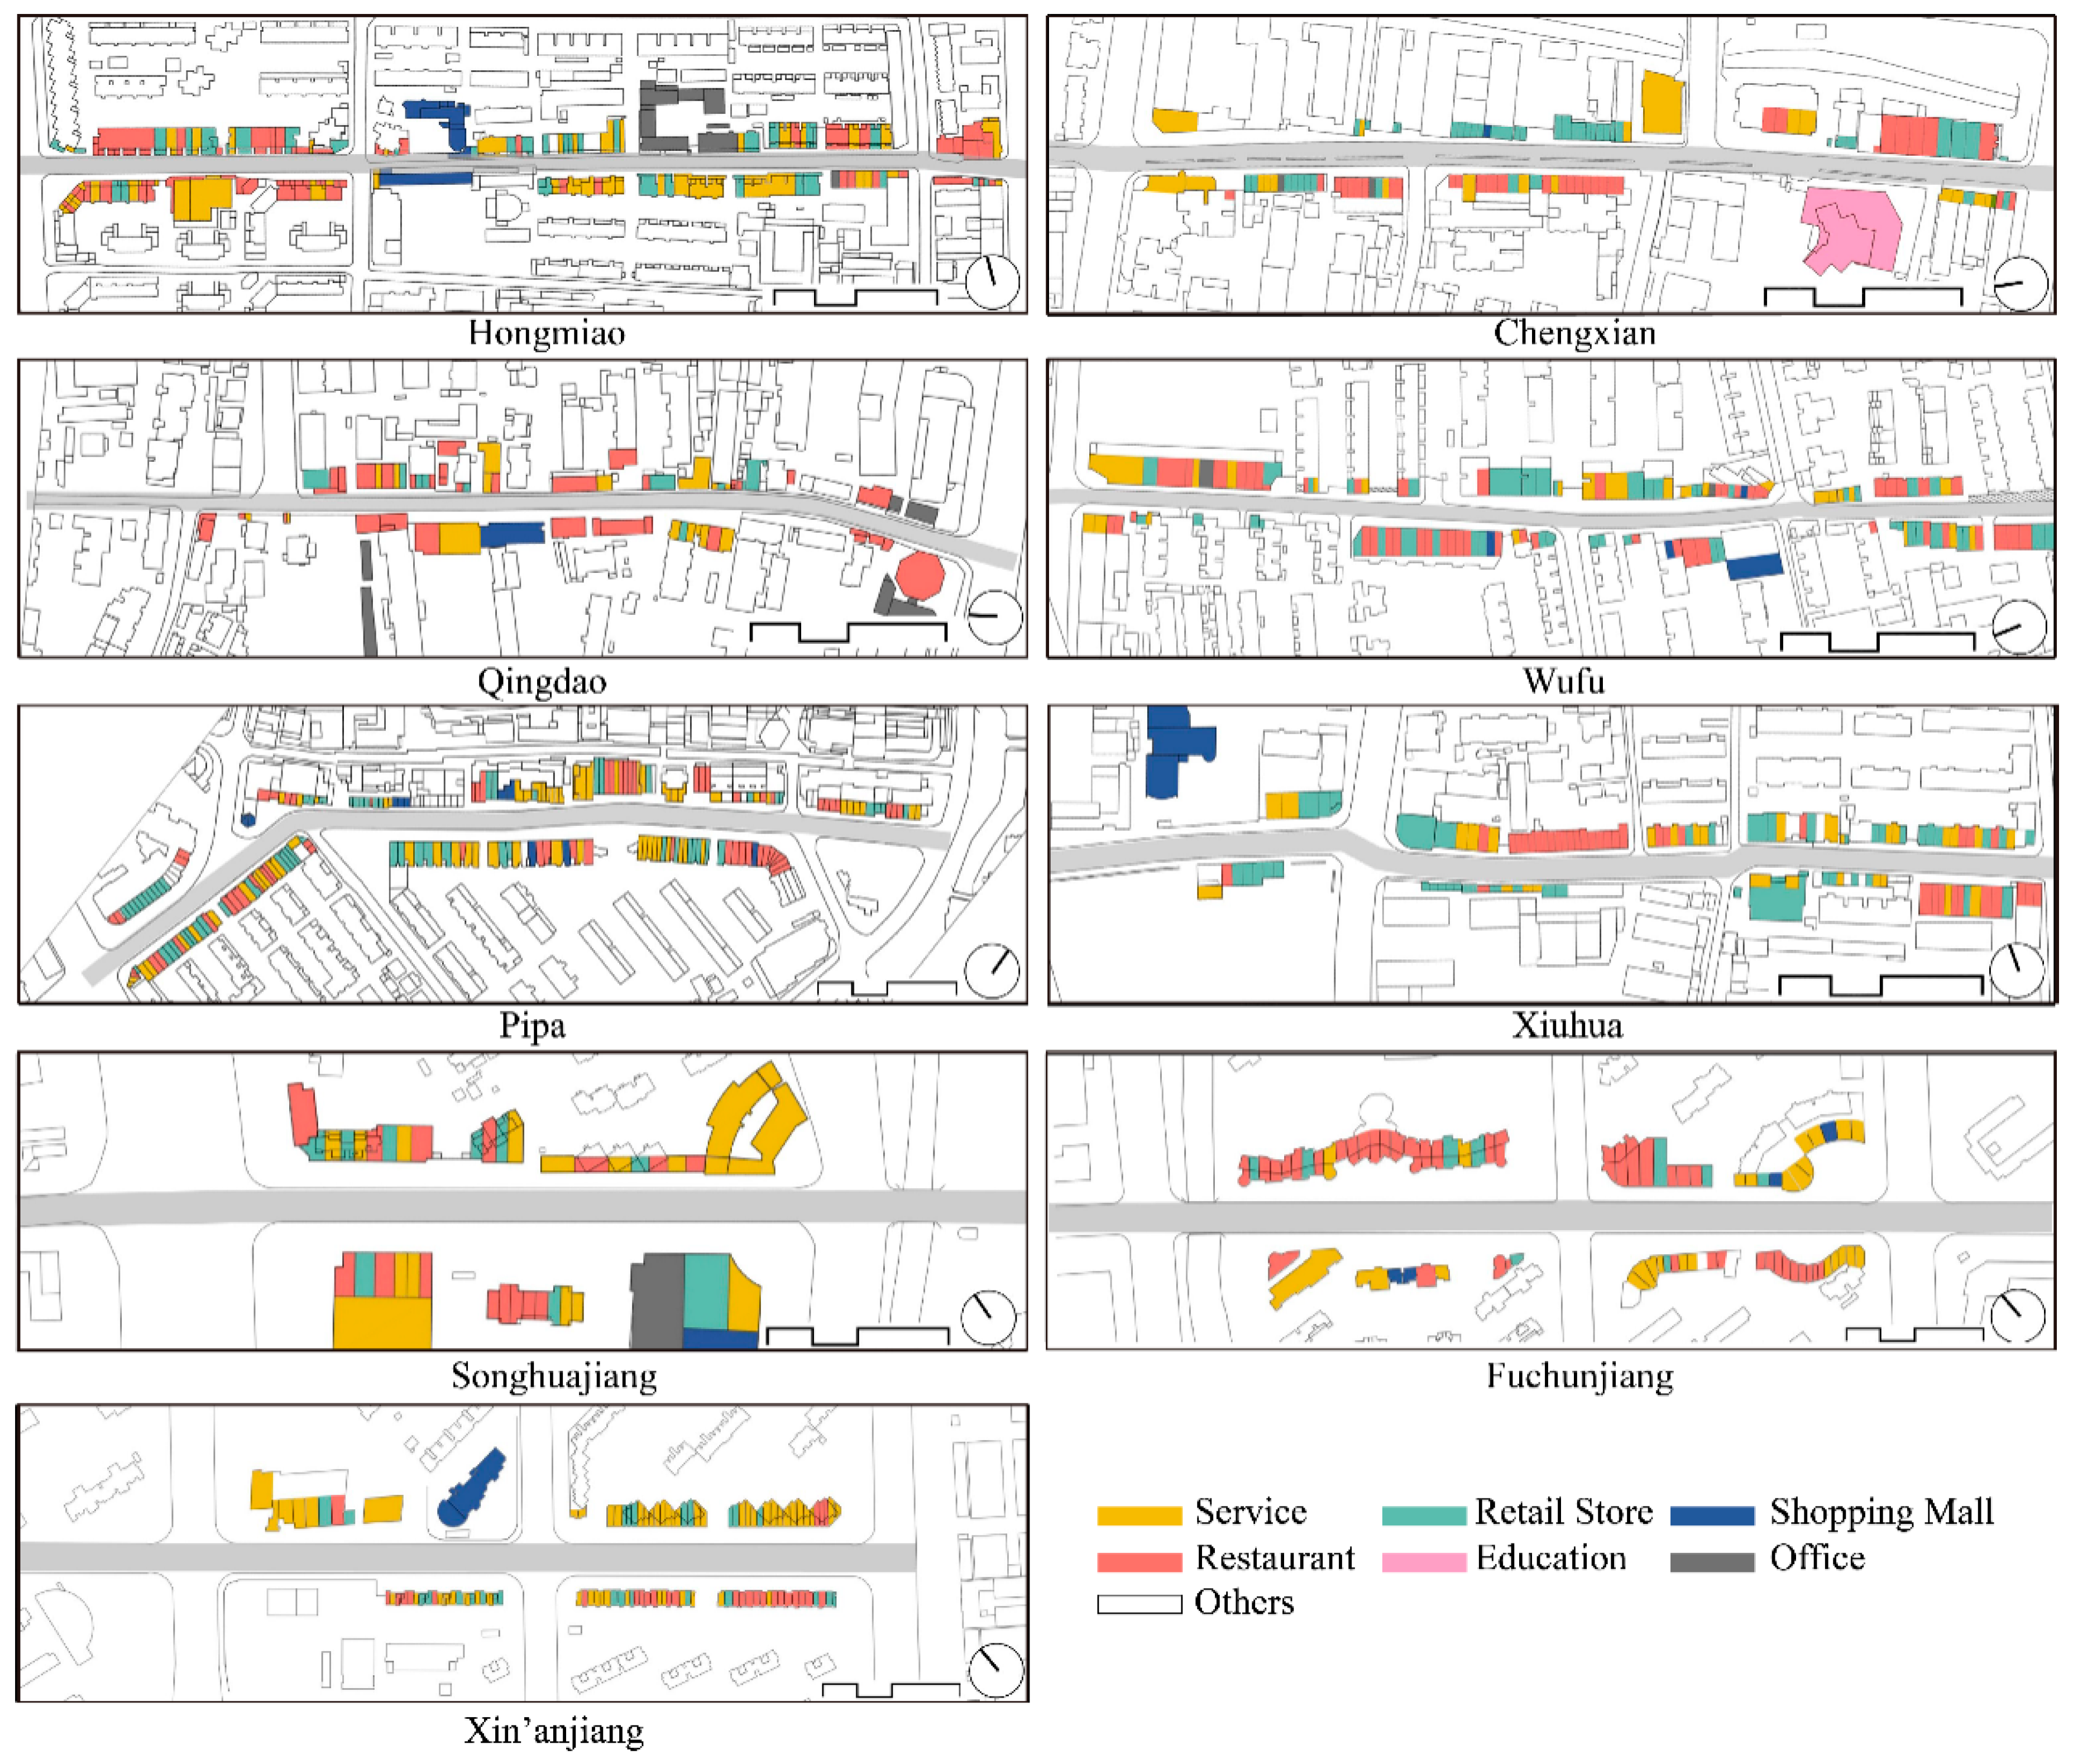
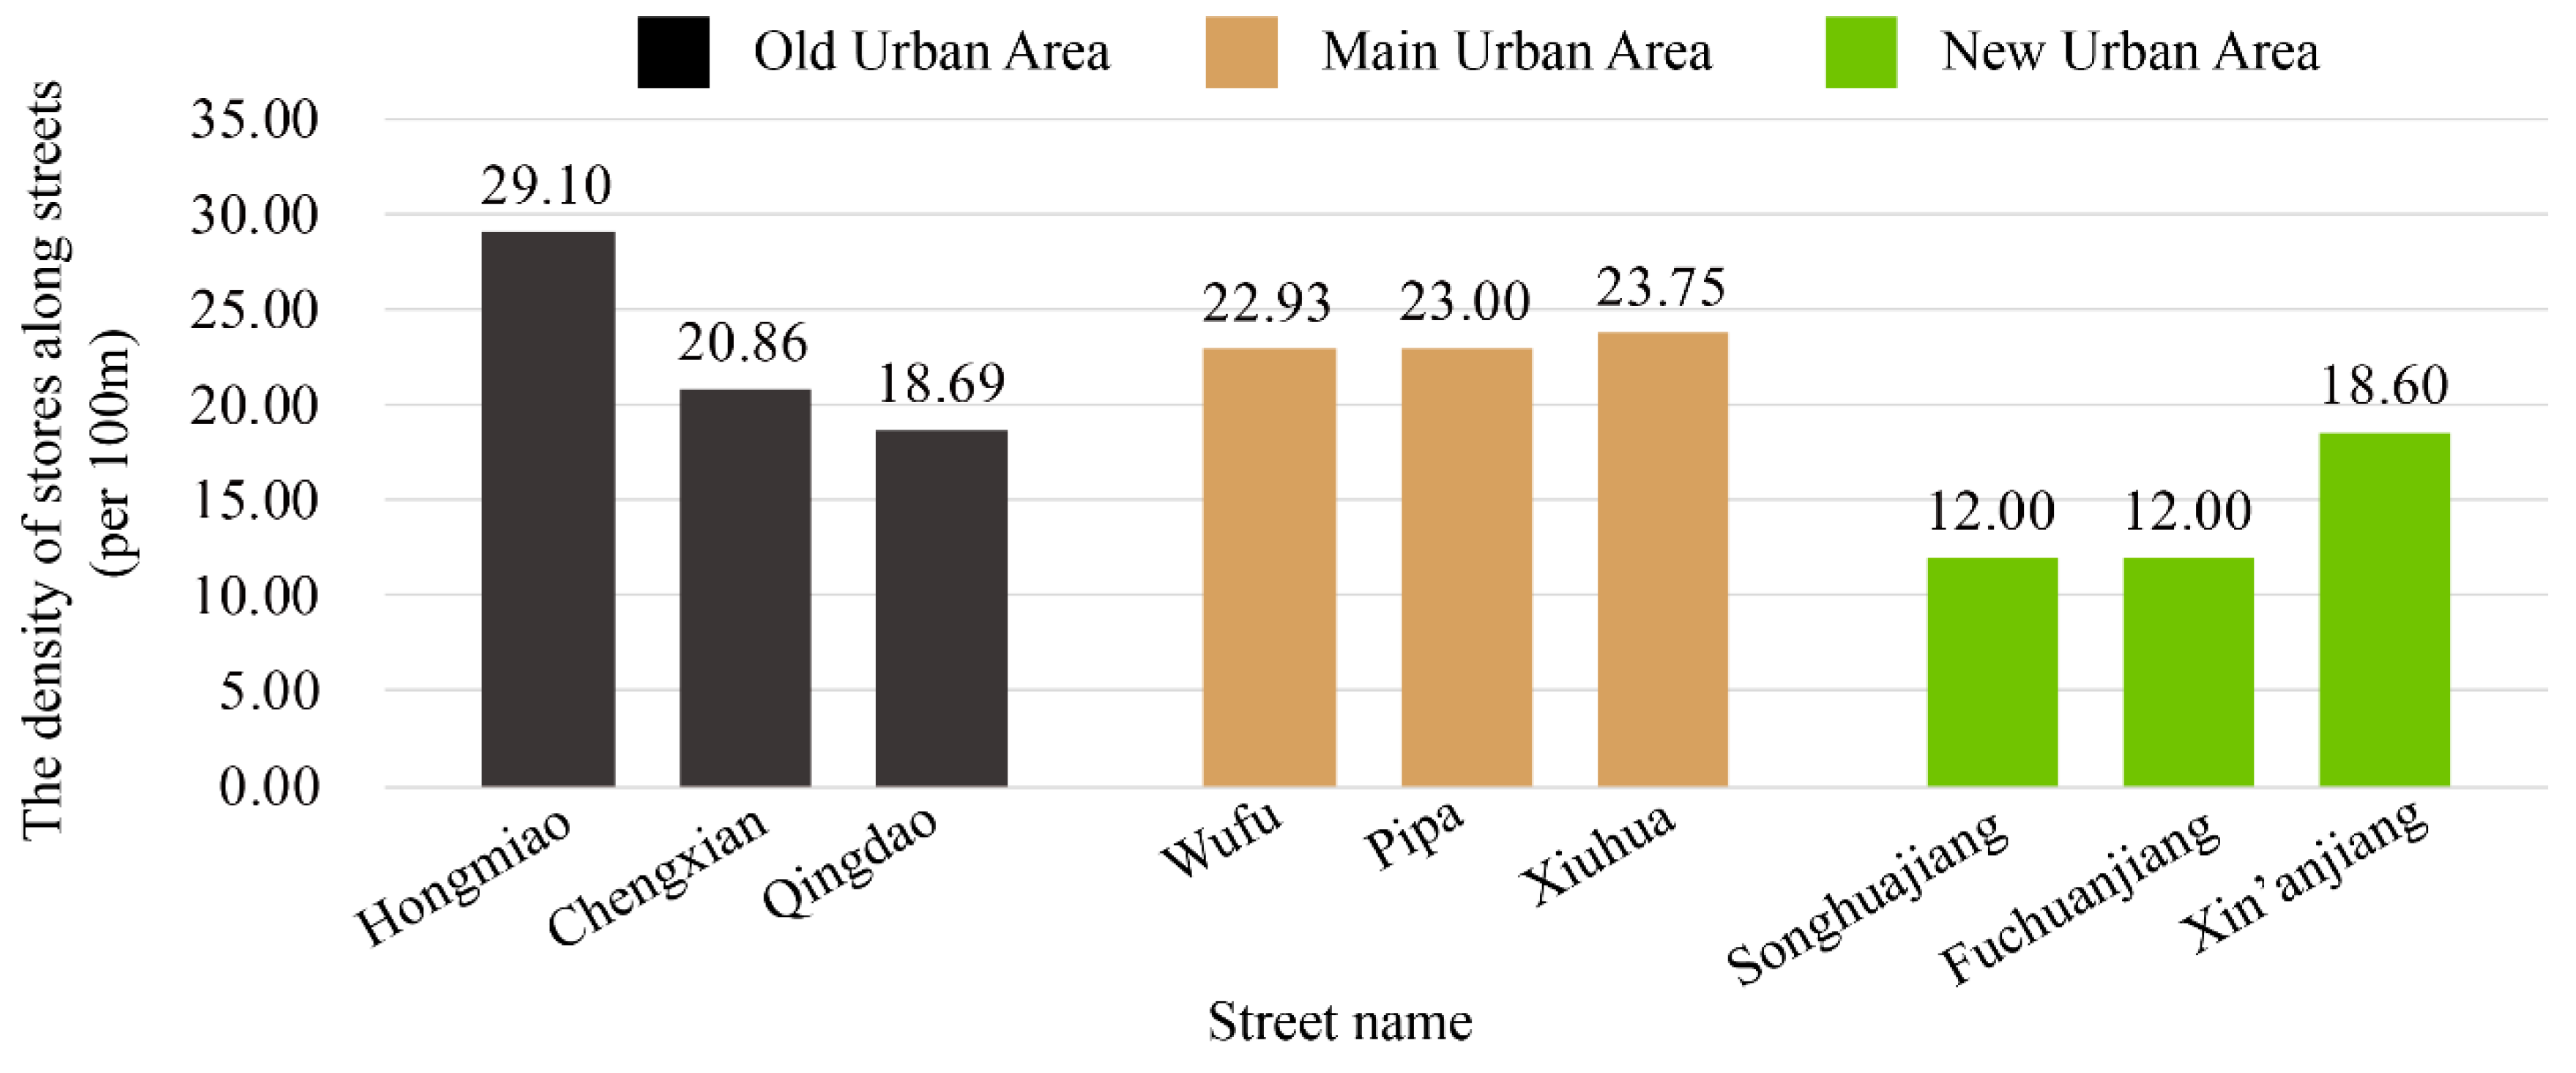
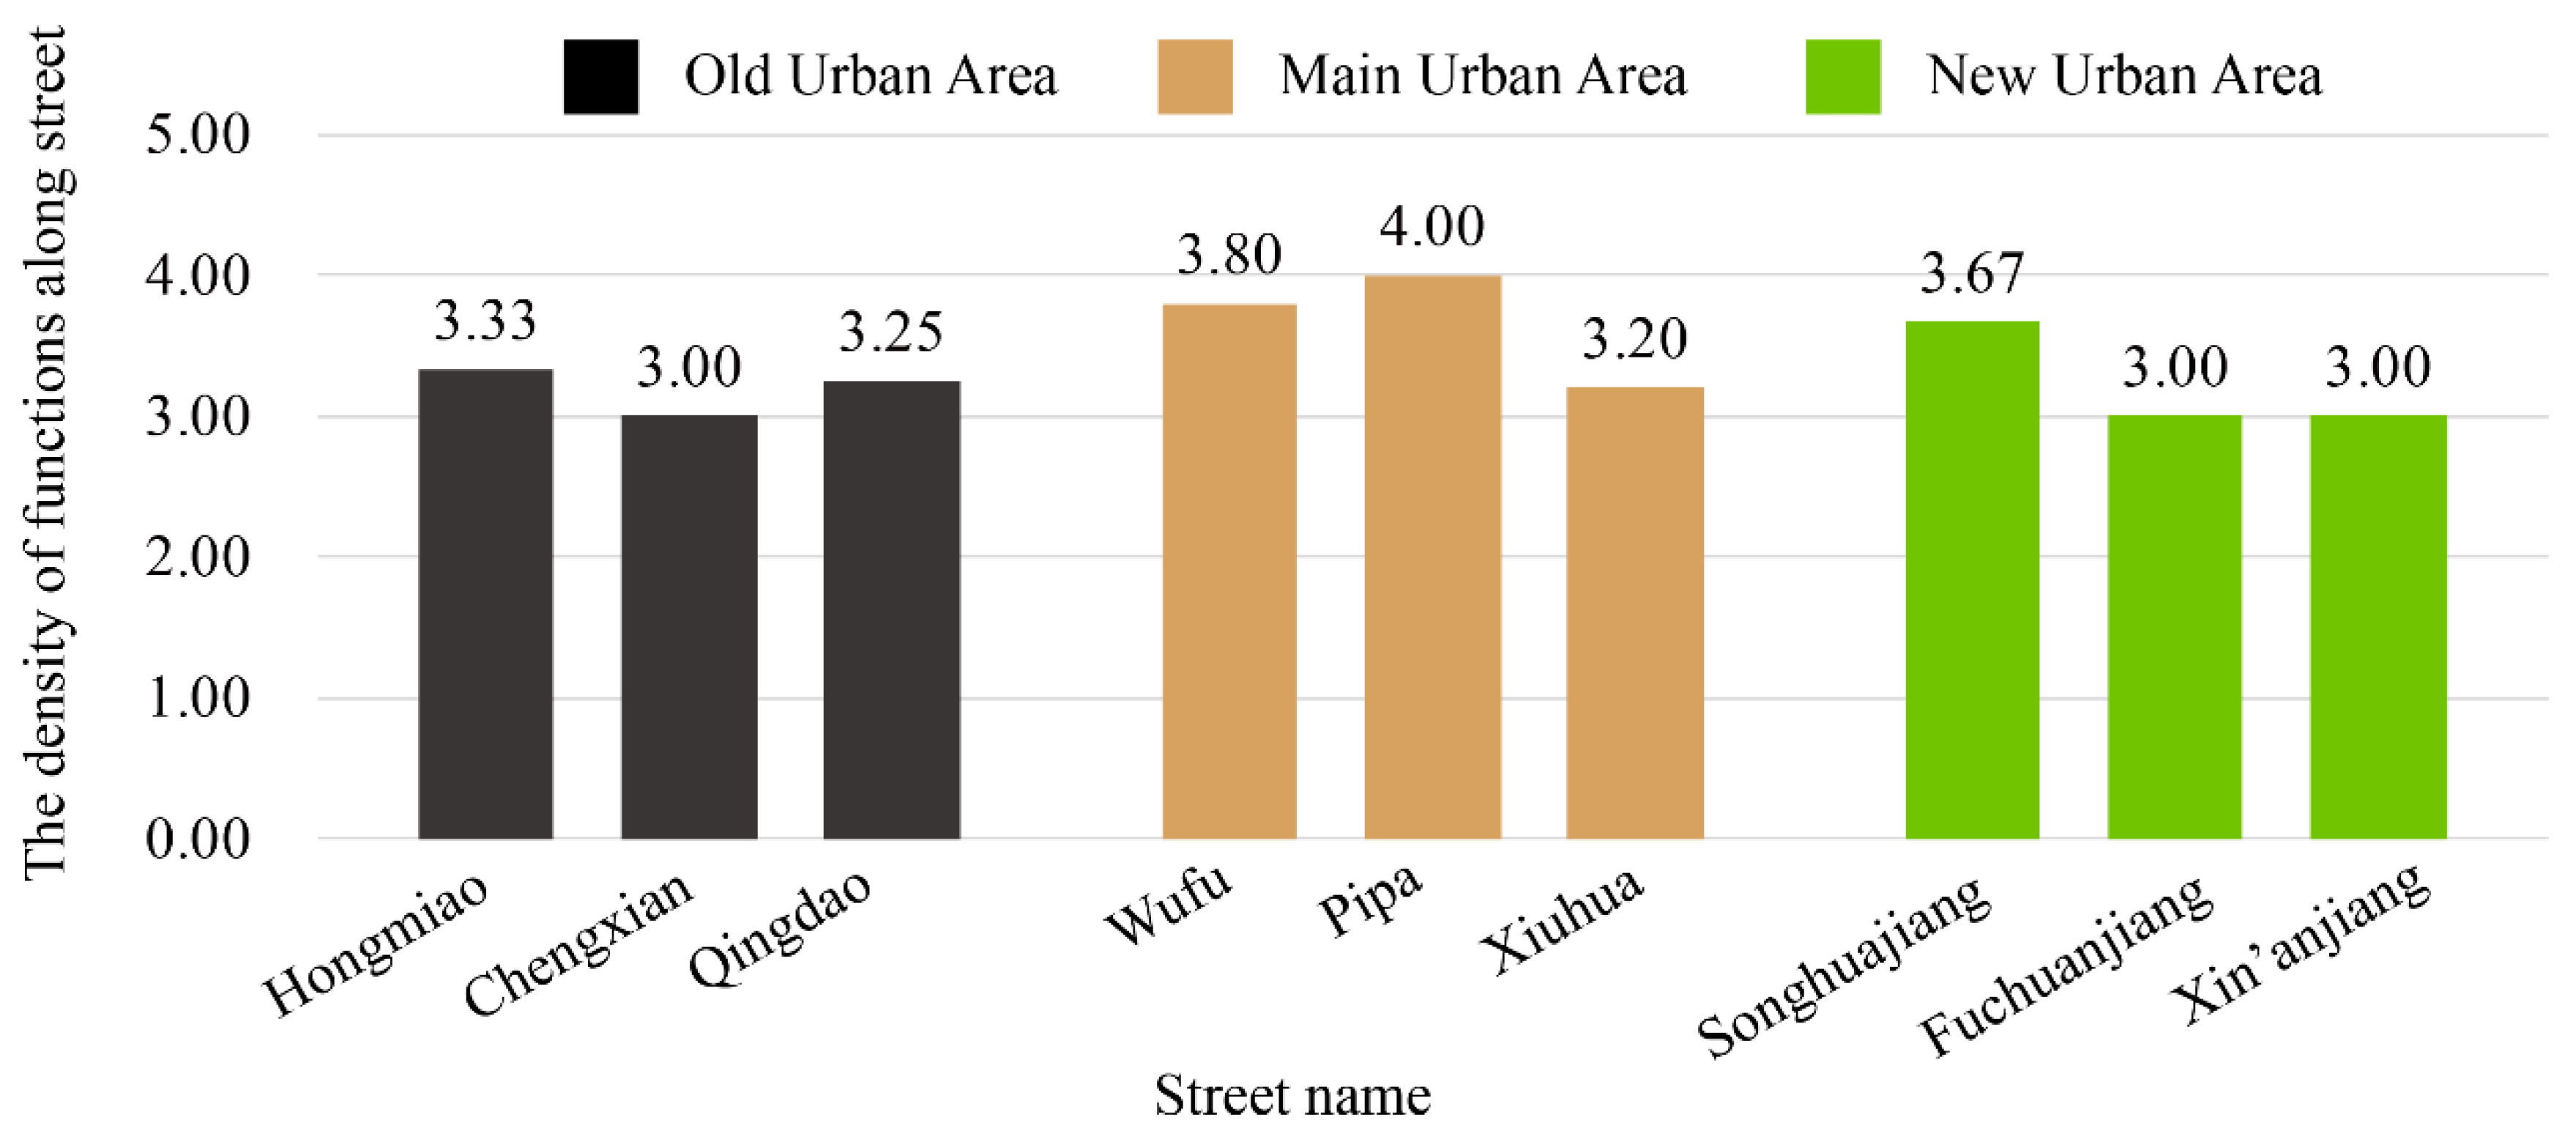
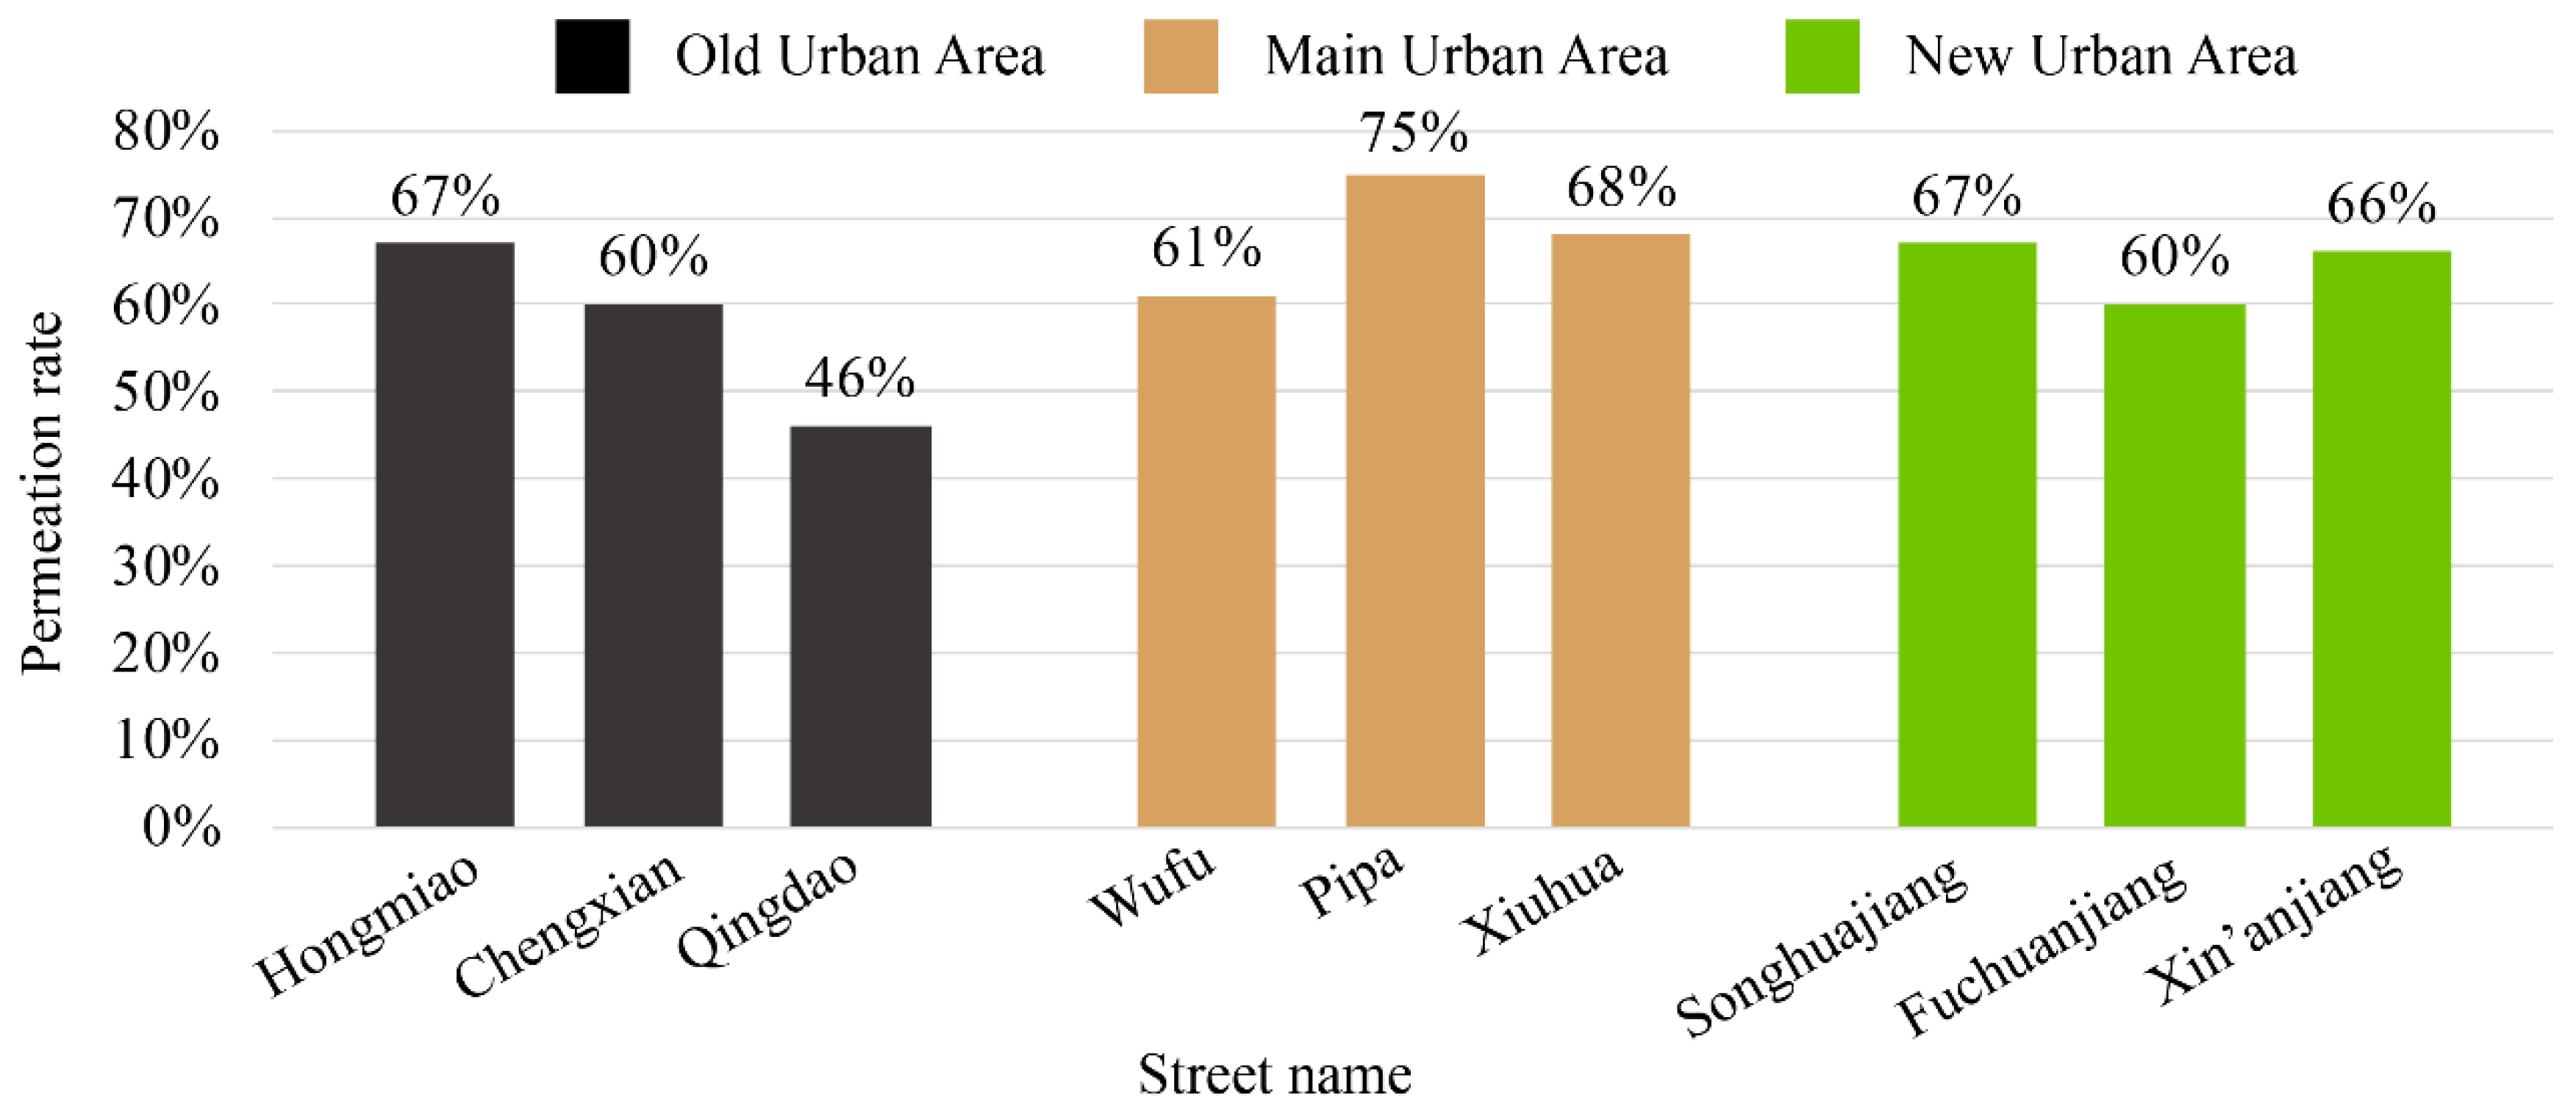
3.2. Comparative Analysis of Street Business Types

The function mixture degree is expressed through store density and function density. Figure 6 shows the street function distributions of the nine streets. The average results of store density calculated by Equation (4) in the old, main, and new urban areas were 22.8 stores/100 m, 23.2 stores/100 m, and 14.2 stores/100 m, respectively (see Figure 7). The rankings for nine streets with levels of store density are Hongmiao (9), Chengxian (5), Qiangdao (4), Wufu (6), Pipa (7), Xiuhua (8), Songhuajiang (1), Fuchuanjiang (2), and Xin’anjiang (3), respectively. The results showed that the construction of businesses in the old and main urban areas were very similar, while it was lowest in the new urban area. The function density results calculated by Equation (5) in the old, main, and new urban areas were 3.19 functions/100 m, 3.66 functions/100 m, and 3.20 functions/100 m, respectively, which are showed in Figure 8. The rankings for nine streets with levels of function density are Hongmiao (6), Chengxian (3), Qiangdao (5), Wufu (8), Pipa (9), Xiuhua (4), Songhuajiang (7), Fuchuanjiang (3), and Xin’anjiang (3), respectively. Based on the analysis and calculation of the permeation rate of frontage bottom businesses from Equation (6), the permeation rate of the old, main, and new urban areas was 58%, 68%, and 64%, respectively, as seen in Figure 9. The rankings for nine streets with levels of permeation rate are Hongmiao (7), Chengxian (3), Qiangdao (1), Wufu (4), Pipa (9), Xiuhua (8), Songhuajiang (7), Fuchuanjiang (3), and Xin’anjiang (5), respectively. The rate of the old urban area was relatively lower than the others because buildings 30 years ago were often constructed with limiting solid brick or concrete and smaller windows. Today, the new urban area has many large, complex buildings; however, the permeation treatment is not always adopted for all bottom-floor businesses depending upon the building’s functional needs.

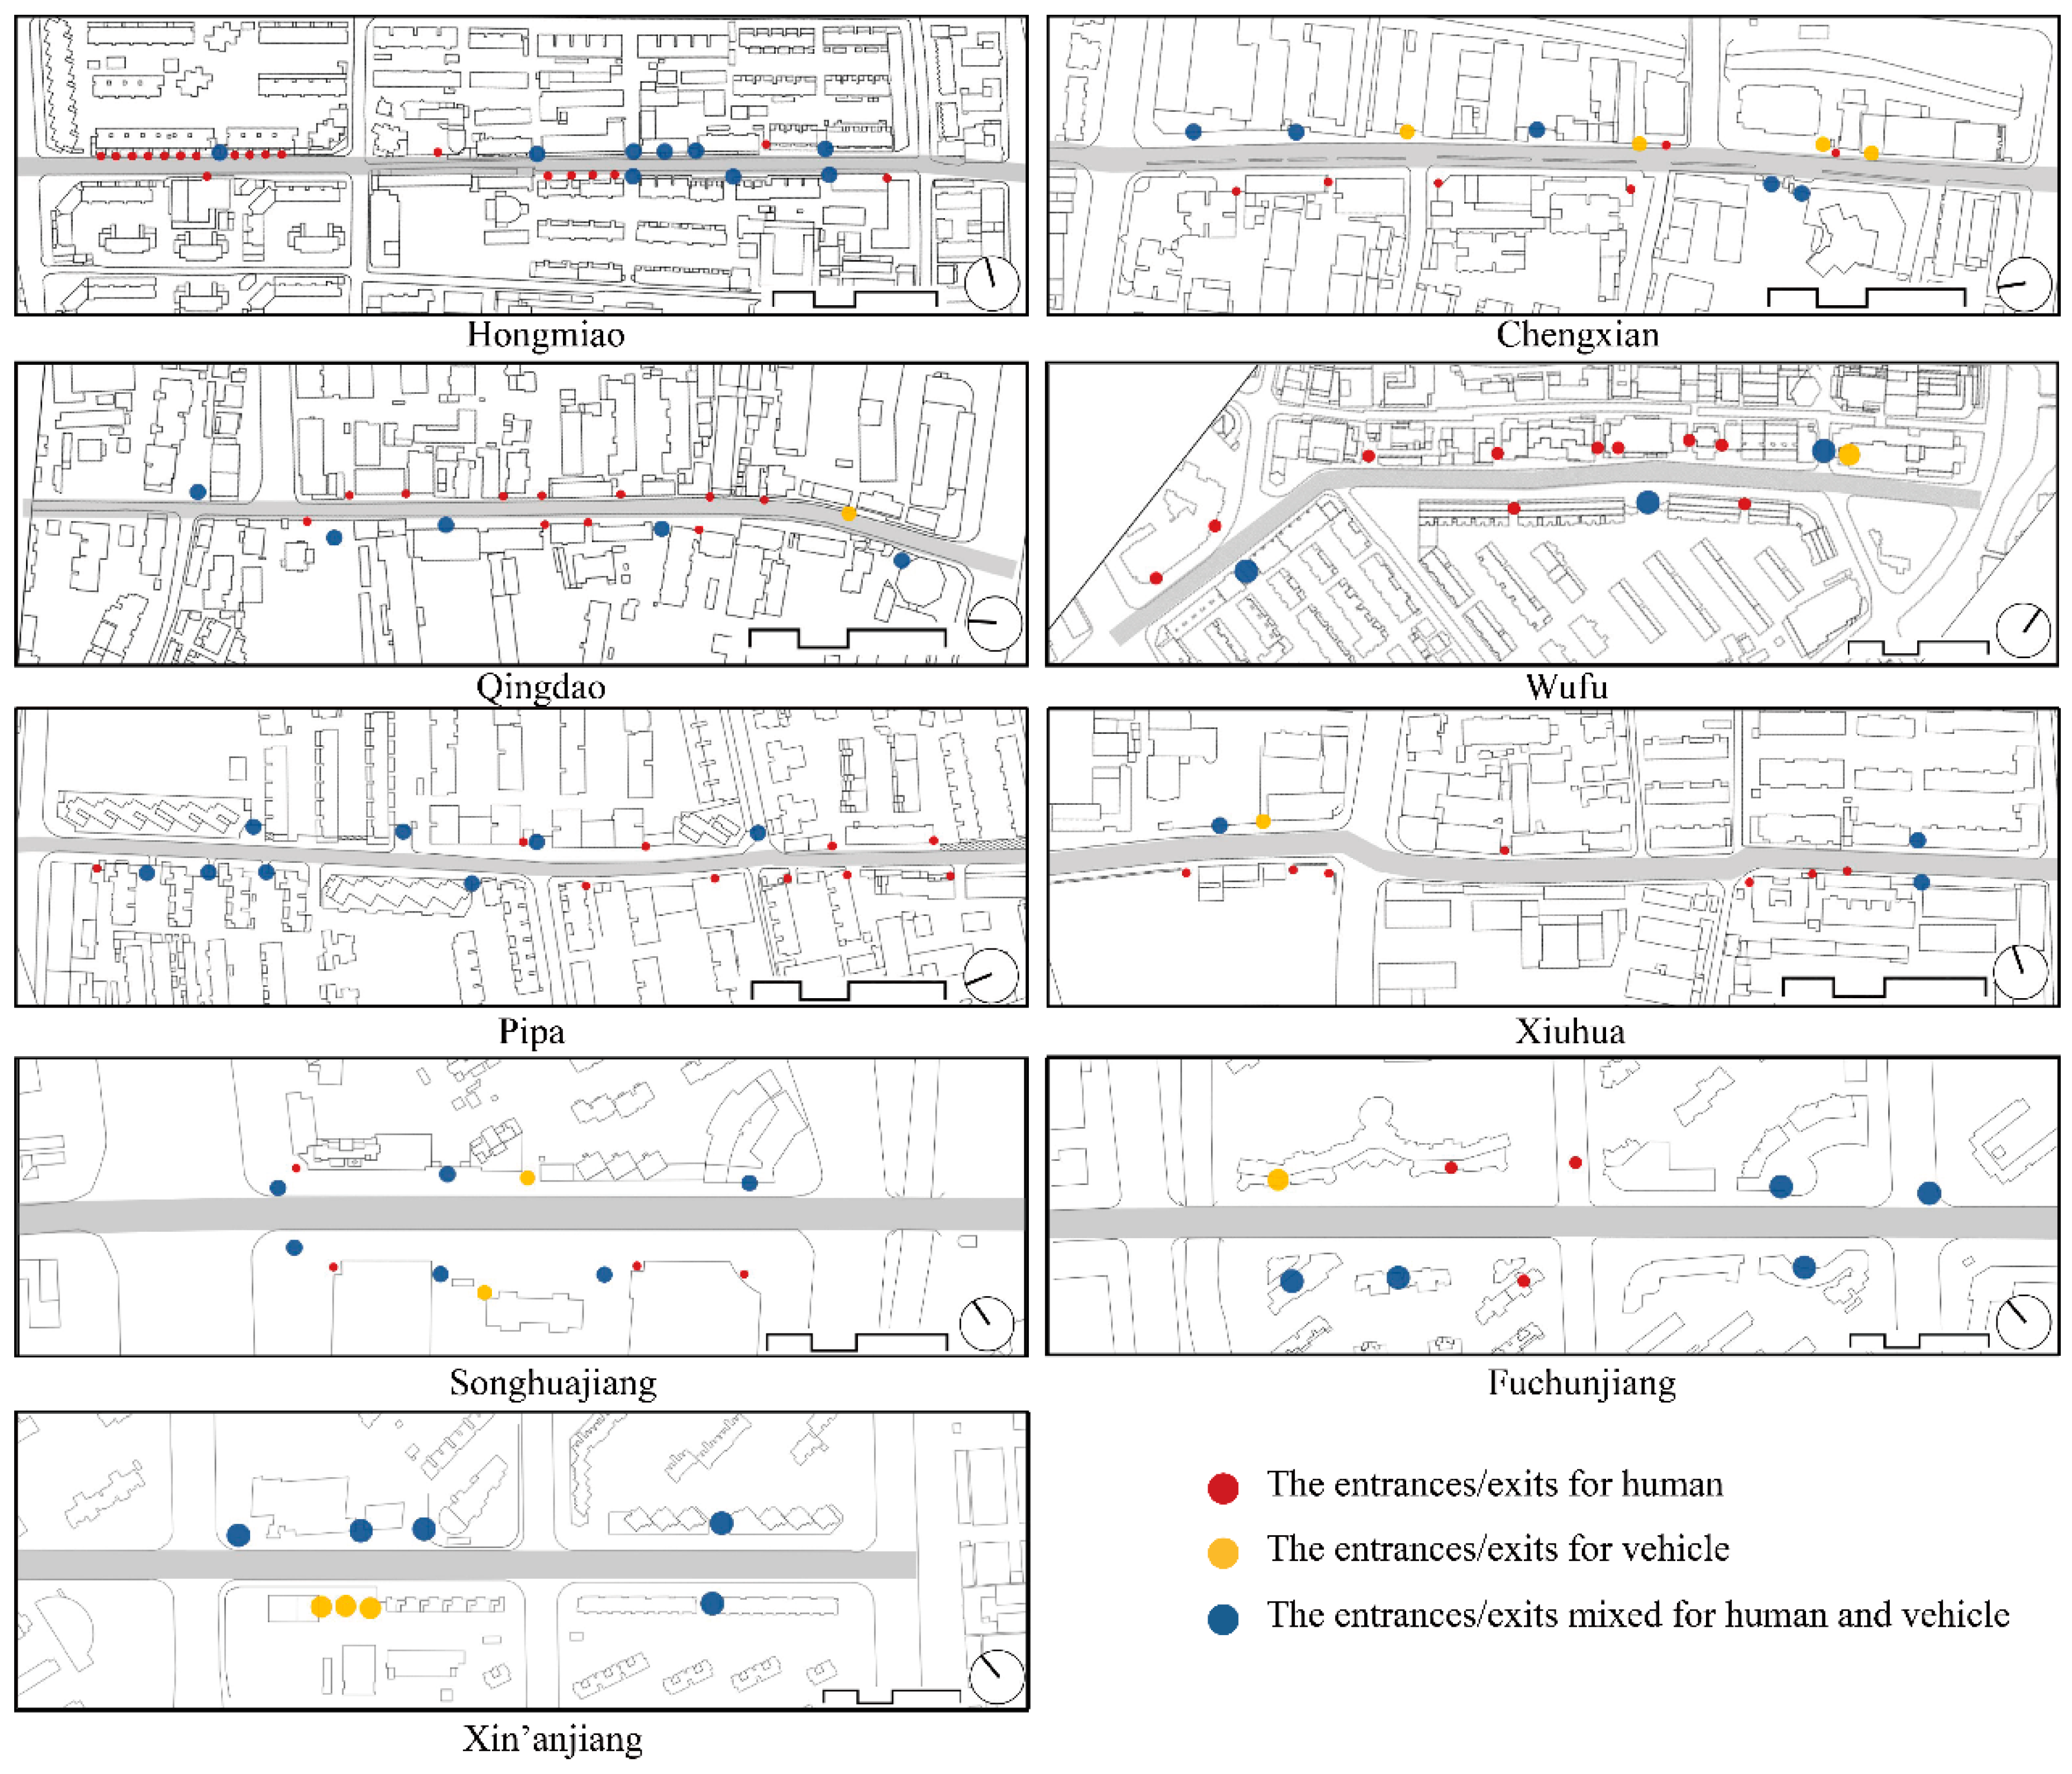
3.3. Analysis of Street Accessibility

Table 1 shows the number of business facilities and residential areas around the nine streets for different distance ranges. The results based on the data indicate that the number of residential areas and large business facilities are higher on streets in the old and main urban areas. For example, within the scope of 200–500 m, there were 11, 23, and 13 in the old urban area, 16, 21, and 17 in the main urban area, and 2, 5, and 4 in the new urban area. The quantity in the old and main urban areas was higher than that in the new urban area. In addition to the number of adjacent residential areas and their distribution scope, the number of street building units and entrances/exits is important to consider. To rank the levels of building locations with number of business facilities and residential area, this study counts the total number within 1500-m distance and then ranks the nine streets as Hongmiao (6), Chengxian (5), Qiangdao (7), Wufu (4), Pipa (9), Xiuhua (8), Songhuajiang (3), Fuchuanjiang (2), and Xin’anjiang (1), respectively. The results are presented in Figure 10. The number of entrances/exits of streets in different urban areas was 28 (rank 9), 14 (rank 5), and 17 (rank 6) in the old urban area, with an average of 20; 18 (rank 7), 20 (rank 8), and 10 (rank 1) on streets in the main urban area, with an average of 16; and 12 (rank 2), 14 (rank 5), and 13 (rank 3) on streets in the new urban area, with an average of 13. The number of entrances and exits on the streets in the old urban area was larger compared with the main and new urban areas.
Public transportation plays an important role in urban accessibility. Therefore, the number of metro stations and bus stops near streets and the number of vehicles that arrive every hour were compared in this study (Table 2). The number of bus stops within the scope of 500 m was 14, 12, and 5, respectively, for streets in the old urban area, 12, 5, and 14, respectively, for streets in the main urban area, and 17, 14 and 22, respectively, for streets in the new urban area. The old urban area shows the advantage of having more metro stations. In comparison, the average number of vehicles that arrived on the street every hour was 258.5 (rank 9), 197 (rank 7), and 104 (rank 3), respectively, in the old urban area, 135.5 (rank 6), 128 (rank 4), and 228.5 (rank 8), respectively, in the main urban area, and 135 (rank 5), 80 (rank 1), and 122 (rank 2), respectively in the new urban area. The average values of the old and main urban areas were higher than that of the new urban area. In general, the old urban area had a comparative advantage in accessibility to public transportation.
By analyzing various interactions of people on the streets from the perspective of social contact, we found that a desirable walking environment can encourage people to participate in more street activities. A desirable walking environment includes meticulous planning and design, small-scale street space, rich building elevation, advertisement markers, public windows, greenery, lighting, pavement, seats and chairs, telephone booths, newsstands, dustbins, public toilets, bicycle parking, street corner squares, and open spaces of retreat, among other factors. Based on statistics regarding the environmental factors and the results of the street walking system, the streets in the old urban area possessed 6, 10, and 4 items, respectively; the streets in main urban area possessed 7, 13, and 3 items, respectively; and the streets in new urban area possessed 8, 12, and 13 items, respectively (as showed in Table 3). Therefore, the new urban area showed an obvious advantage in environmental quality. Based on a ranking method when comparing each two results of street walkability, the results showed that the rankings of the nine streets are 3, 6, 2, 5, 9, 1, 4, 7, and 9, respectively. Pipa Street and Xin’anjiang Street have the greatest walkable environment, while Xiuhua Street has the worst.

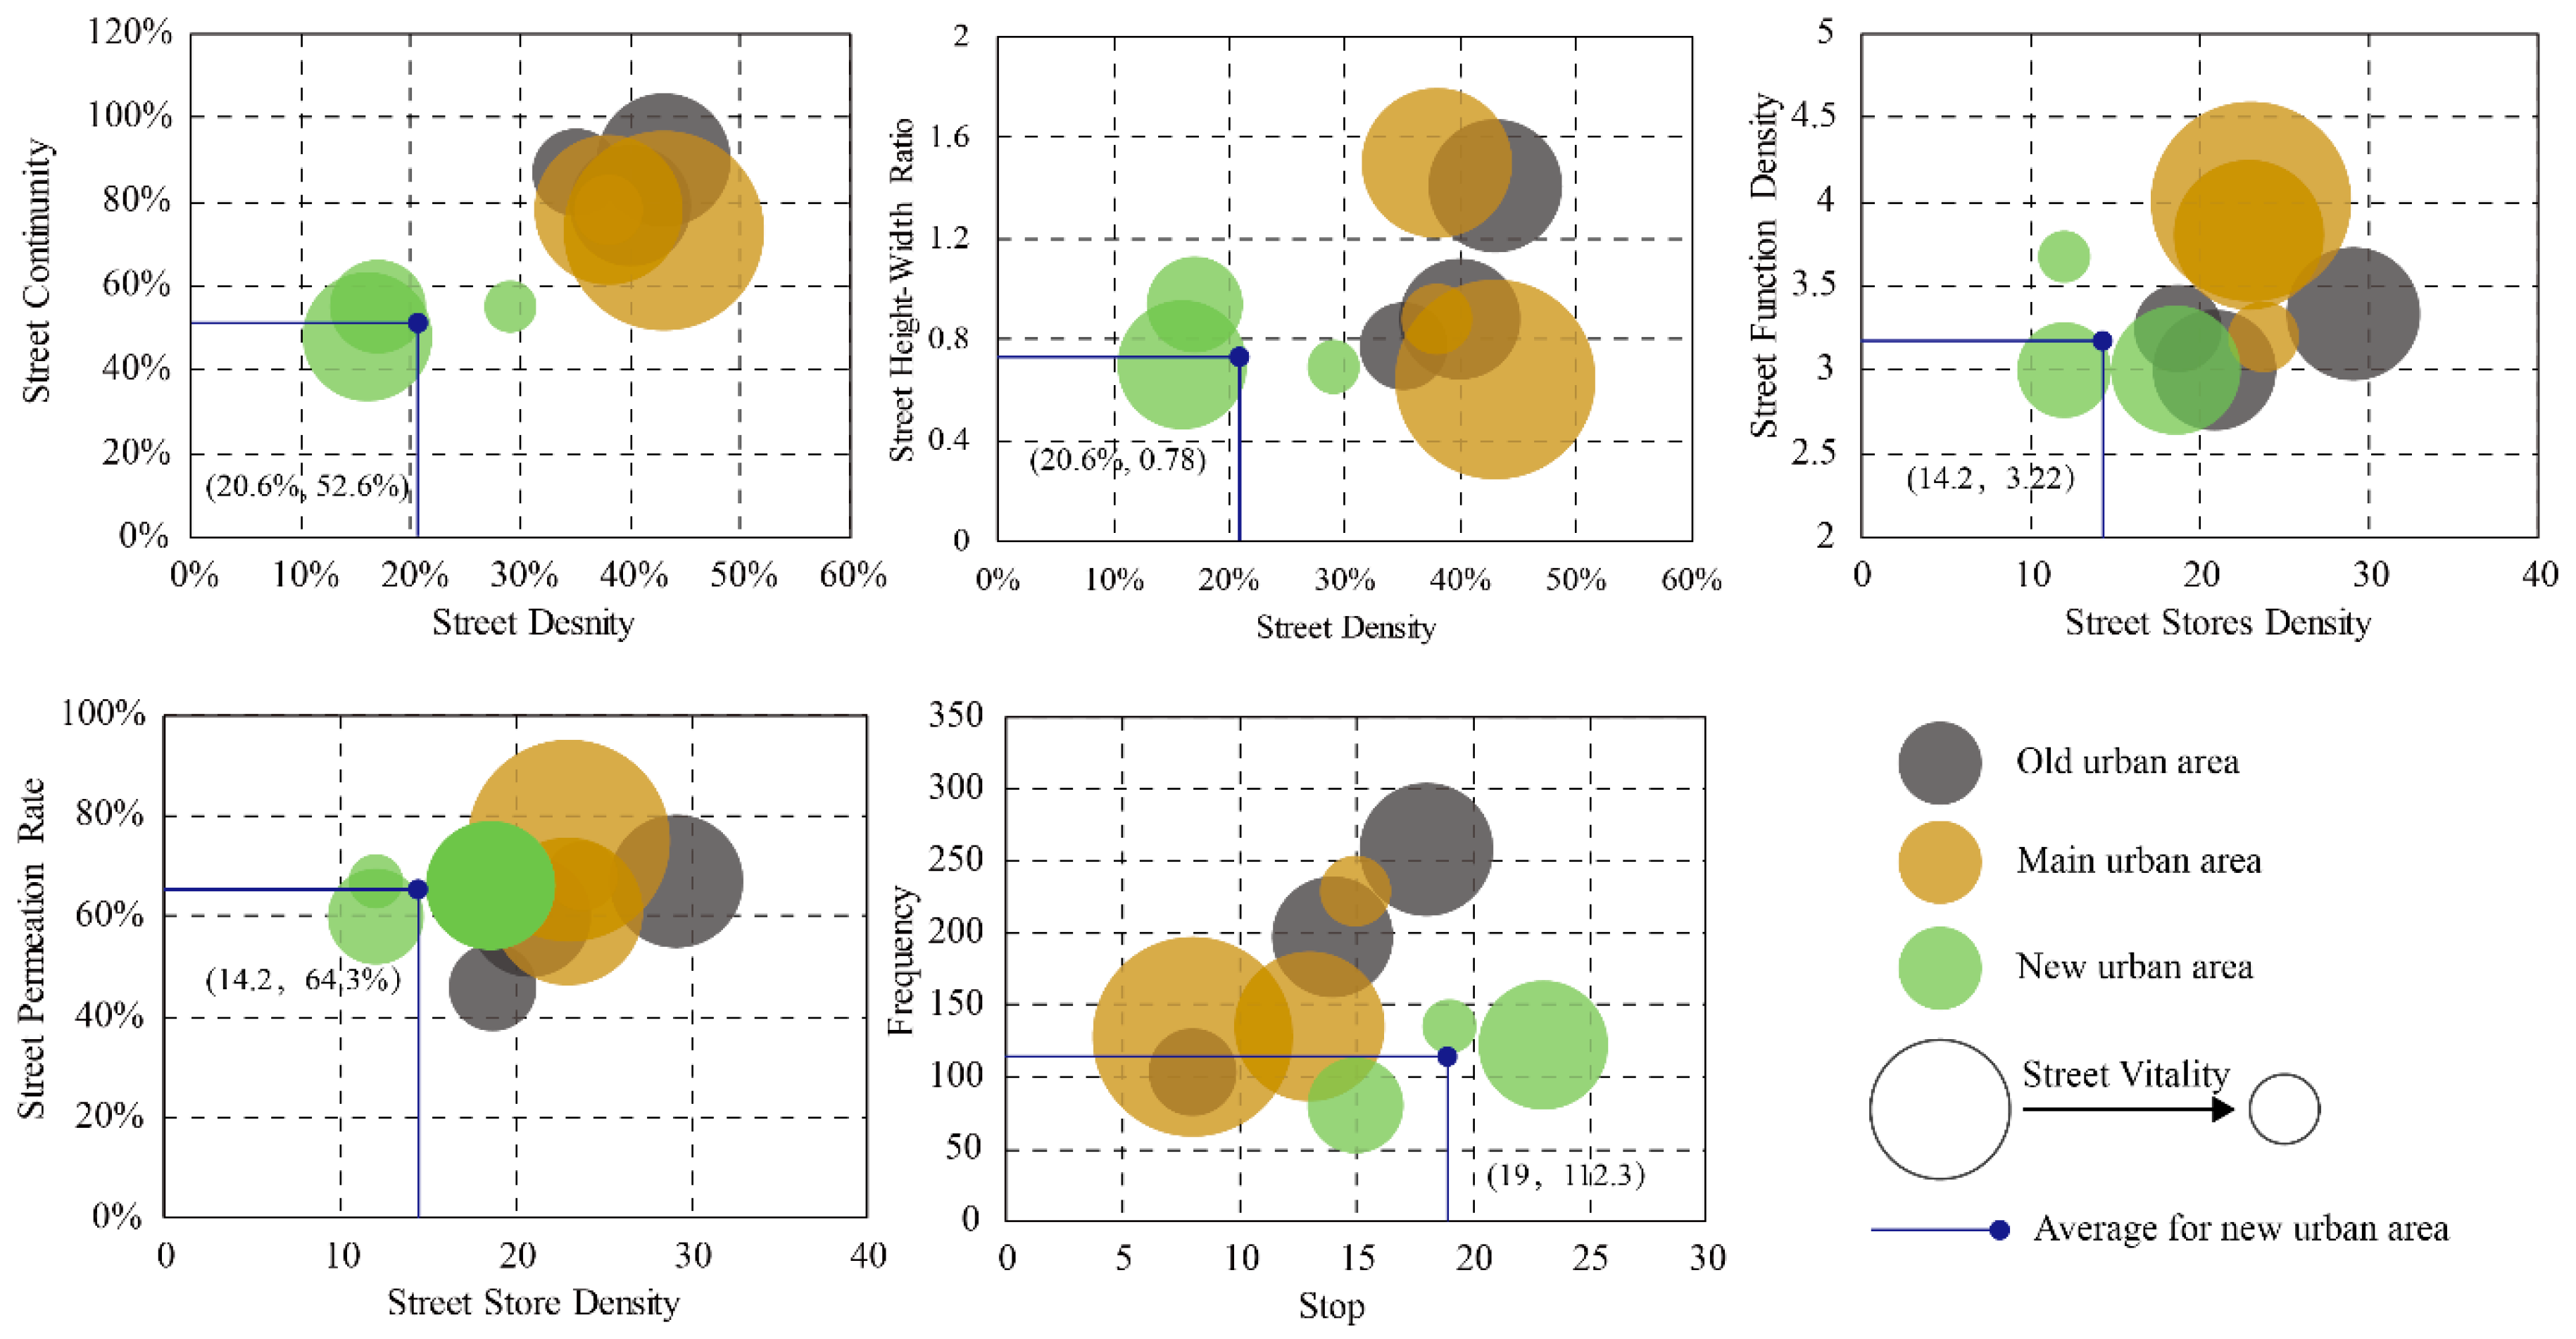
3.4. Analysis of Street Vitality

The vitality of urban streets can be described as an intuitional feeling and cannot be quantified easily. Vitality usually includes environmental factors, at the material level that contain various activities for development and the people who are active therein. Additionally, vitality can exist on streets only when people and activities are present. Thus, people are the fundamental reason for the formation of vitality. Therefore, the most direct external expression of street vitality can be reflected by “the density of people engaging in unnecessary activities in streets”. To reduce the impact of weather, commuting, and other daily necessities, this study selected the average number of active people during morning (8:00–9:00), afternoon (13:00–14:00), and evening (19:00–20:00) time periods on three different weekends with sunny weather.
The number of people on the streets in the old urban area was 668 (rank 7), 609 (rank 5), and 440 (rank 3), respectively; the number of people on the streets in the main urban area was 750 (rank 8), 1009 (rank 9), and 355 (rank 2), respectively; the number of people on the streets of the new urban area was 266 (rank 1), 479 (rank 4), and 649 (rank 6), respectively. The results reflected the distribution condition and approximate activity law for the activity of people in each of the nine streets (Table 4). The preliminary statistics, summary, and analysis were conducted by synthesizing the number of active people in the streets and their activity status, which is shown in Table 4.
According to the statistics, the average number of active people in the streets of the old urban area, the main urban area, and the new urban area was 572, 705, and 465, respectively. The number of active people in the streets of the old urban area and the main urban area were higher than that of the new urban area. However, because Pipa Street, in the main urban area, had a very large number of active people, the average number of active people in the main urban area was skewed higher. Based on further analysis, we found that Pipa Street was much wider than the other streets in the old and main urban areas and about half as wide as the streets in the new urban area. Therefore, the street has a suitable scale and is convenient for vehicular traffic, because Pipa Street allows on-street parking that has little impact on traffic. This proves that a moderate mixture of pedestrians and vehicles can help promote street vitality.
The number of active people in the streets also fluctuated during different periods. Except for special circumstances, the number of active people in the streets in the early morning was relatively small. This was especially the case in the new urban area, partially because most people in this area are young and usually sleep in on the weekends. By noon, the number of active people on the streets increased, and the number of active people on the streets was the largest in the evening. Additionally, during this time it was observed that people usually lingered for relatively longer periods of time during the evening compared with the morning and noon hours.
To compare the impact of each subfactor on street vitality, this study used a ranking method to assign a rank (from 1 to 9) for each subfactor for the nine streets according to the statistical results. The rankings of levels of each subfactor are assigned based on Equation (7) to sort and compare levels of each subfactor and since the number of streets selected in this study is nine, total ranking levels are nine, varying vary from 1 (lowest) to 9 (highest). Figure 11 shows the visual results of street vitality rankings and the 10 subfactors for the nine streets. The overall results showed that it is difficult to form one general numerical rule to assess street vitality. However, the findings showed that street vitality was determined by the combined outputs of multiple subfactors. Based on the street vitality ranking, the three streets with the highest street vitality were Pipa, Wufu, and Hongmiao streets, ranking 9, 8, and 7, respectively, while Songhuajiang Street had the lowest score. The rankings of the 10 factors for the nine streets showed that Pipa Street has the largest number of active people, and among the nine environmental factors, it had the largest building density, function density, number of neighboring residential areas, and permeation rate. Songhuajiang Street had the smallest number of active people. Among the nine environmental factors, it had the lowest store density, the smallest number of residential areas within 500 m, the smallest number of unit entrances and exits, a low building-to-line ratio, and a low street height-to-width ratio. This proves that a direct correlation exists between street vitality and environmental factors. Pipa, Hongmiao, and Wufu streets exhibited a large percentage of the highest ranking of subfactors, which might prove that street vitality can be improved by increasing suitable environmental factors. In addition, the vitality of Pipa Street, which had a height–width ratio ranked as 1, was higher than that of Hongmiao and Wufu streets, with height-to-width ratios ranked as 9 and 8, respectively. This finding showed that a reduction in the height-to-width ratio may improve street vitality. When comparing street vitality in the old, main, and new urban areas, the results of each of the nine streets showed that the rankings for the subfactors in the old and main urban areas were higher than the ranking for the new urban area. The streets in the old and main areas showed obviously higher vitality than the streets in new urban area. This might demonstrate the cause and evolution of urban street vitality and prove that street vitality varies from the perspective of time dimension and increases with time.
Figure 12 shows the results of street vitality for the nine streets analyzed in this study. Specifically, Figure 12 shows the three street form subfactors (street density, street continuity, and street height-to-width ratio), three street business subfactors (street store density, street function density, and street permeation rate), and the accessibility of the streets. The accessible walking environment in the new urban area was superior to those of the main and old urban areas. However, the statistical results for the distribution of active people in the streets showed that the main urban area had the highest street vitality, followed by the old urban area, and then the new urban area.
The street vitality in different time periods assumes obvious differences. The old and main streets existed for a longer period of time than those in the new urban area. Although these streets have developed relatively worn-out environmental factors over time, their street forms and business types have become more suitable for walking and more adaptable to the demands of daily life. Therefore, the streets have assumed full vigor and vitality. The newly-built new urban area has a higher quality street environment, but its streets are too wide for people on both sides to connect conveniently. Additionally, the occupancy rate of housing remains low. Therefore, the new urban area has poor street vitality at this time.
Figure 12 shows that the density and continuity for streets with high vitality for the old and main urban areas were distributed around 40%, and 80%, respectively, and around 21% and 53% for the new urban area. Therefore, for the new urban area to improve, we recommend enhancing the overall vitality, street density, and continuity to improve the new urban area. Considering the street height-to-width ratio, we found that the ratio in the new urban area was similar to the main urban area. This may indicate that the street height-to-width ratio in new urban area was reasonable.
For the street business type, Figure 12 suggests an improvement in the street store density is needed. Moreover, the street function density can be slightly adjusted, because the function density in the new urban area was slightly smaller than in the main urban area but similar to the old urban area.
For the street permeation rate, the results showed no significant differences between the three urban areas. Finally, for accessibility through transportation, we found that the average frequency of transportation into/out of the new urban area was lower than in old urban area and similar to the main urban area. Although the number of bus stops in the new urban area was higher than in the old and main urban areas, the street vitality was still the lowest. This suggests that transportation sources in the new urban areas should be fully utilized by increasing the frequency of buses and metros, for example, to help improve the street vitality.

4. Discussion and Limitations

Based on the different time phases of urbanization, the vitality of most Chinese cities will change during different time periods. In particular, new urban areas face the paradox that street vitality is still insufficient despite high rates of standard construction. This study examined three groups of life-oriented streets built in different periods. The findings provided insights into street vitality according to two perspectives: (1) environmental factors maintaining street vitality and (2) the number of people representing street vitality. Meanwhile, three main factors and 10 corresponding subfactors were applied as evaluation indicators, and one framework was used to observe and analyze the inherent correlations affecting street vitality. First, an inclusive assessment of the results indicates that relatively high building density, interface continuity, and a suitable street height-to-width ratio promote street vitality. The streets with a large number of active people located in the old and main urban areas have a relatively high building density, as well as street continuity and enclosure. On the other hand, streets in the new urban area are so wide that they have a weak enclosure. Moreover, poor continuity created an insufficient business atmosphere and a low street activity degree. Second, the results indicated that a relatively high degree of function mixture can raise the land utilization rate. For example, the streets in the old and main urban areas have a higher degree of function than those in newer urban areas, and they are surrounded by buildings that cater to people’s demand. These streets tend to have a more complicated and lively street space that promotes overall utilization, efficiency, and flexibility. Third, highly-efficient and convenient accessibility is an important condition for the formation of street vitality. The old and main urban areas are closer to more metro stations and enjoy convenient traffic facilities. In the new urban area, the metro service was launched at a later date, prior to which buses had been the most utilized means of transportation. Overall, the streets in the old and main urban areas have more established means of public transportation and higher vehicle frequency than those in the new urban area. Moreover, they are near neighboring residential areas or large business facilities, so they tend to have higher street vitality based on convenience.
The buildings along the streets in the old urban area and the main urban area are in the process of continuous alteration, expansion, and decoration. The continuity and permeation rate of these streets will be promoted and improved continuously. Additionally, some spontaneous and irregular construction activities will occur, resulting in improved street sections and environment quality. Along with the lapse of time and continual optimization of street space, street forms have been shifting toward a more energetic and vigorous model. In this process, streets will keep pace with the times and make continuous adjustments and optimizations in street business types to meet consumer’ demands. At present, an obvious difference exists between the street vitality of new and old urban areas for the following reasons: (1) almost all the streets in the new urban area are full of high-rise office buildings and closed residential areas with a low occupancy rate, and the relation between large office buildings, residences, and streets is not that strong; (2) the streets in new urban areas have a small number of large business facilities and a low street continuity, while having wider streets but lower business enclosures; and (3) the streets built in old and main urban areas have few parking lots, while the number active people is generally higher where temporary parking is allowed on both sides of streets. In new urban areas where the planning is better and more complete, the business and residential areas have their own parking lots, and no parking is allowed on the side streets; thus, the speed of vehicles is usually higher.
During the process of this research, we identified some shortcomings worthy of further exploration:
(1)
The expression of street vitality is not only directly related to the number of active people, but also the amount of time during which people linger on the street. However, it is very difficult to comprehensively describe and record the lingering time of the population activity. We only used the number of people to express the degree of street vitality at the time of our investigation, which will inevitably result in some differences of assessing street vitality.
(2)
We selected streets built in different time periods to make our investigation objective. Subject to the time span of 30 years, the investigation data of some street environment factors were inevitably insufficient. More cases are needed for a comparative analysis. However, the number of streets we have selected and their representativeness are worthy of discussion.
(3)
In recent years, various types of online consumption, e-commerce, app take-out, and so on have evolved to meet most of life’s demands, thus reducing the amount of time people spend physically shopping. Therefore, we should consider the impacts of various virtual environments on street vitality in the future.

5. Conclusions

This study proposes a framework to assess street vitality while considering different time dimensions and utilizing three main factors, street form, street business type, and street accessibility. In the case study, nine streets were selected from the old, main, and new urban areas in Nanjing City, China, and a ranking method was applied to rank the impact of all factors on street vitality for a comprehensive analysis. The results showed that Pipa and Wufu streets in the main urban area and Hongmiao Street are the three streets with the highest street vitality. A ranking comparison showed that those three streets have high rankings in almost all factors. However, the street vitality in the new urban area is low compared with the old and main urban areas. Pipa Street has the highest street vitality, with the lowest street height–width ratio (0.64, rank 1) and the best ranking (rank 9) in street building density (43%), street function density (4 per 100 m), permeation rate (75%), street location (total of 268 building facilities and residential areas within 1500 m), and walkability (14 items), respectively. Pipa Street is also ranked second highest in the number of entrances and exits (total of 20, rank 8) and third for street store density (23 per 100 m, rank 7). However, Pipa Street has two lower rankings (rank 4) for building continuity (75%) and street transportation (128 vehicles per hour). Songhuajiang Street has the lowest vitality, as the factors of Songhuajiang Street have rankings lower than 5, except for its relatively higher ranking for permeation rate (67%, rank 7).
By conducting measurements and performing a quantitative analysis of the streets in Nanjing, from a time dimension of 30 years, the results show that street vitality is not invariable but rather continuously evolving. On one hand, the results showed that the street vitality in different periods assumes obvious differences. It might take a long time for street vitality to exist only after balancing the demands of various factors. We should not only treat the present-day problem of insufficient street vitality in the new urban area from a longer time dimension, but we should also enhance the street vitality of the new urban area by optimizing the influencing factors. The findings suggested some improvements for vitality, such as increasing street density and continuity in terms of street form, increasing street store density in terms of business type, and increasing the frequency of buses and metros. On the other hand, the methodology framework and the findings presented in this study can provide some significant implications for future work on street vitality and sustainable urban development. More statistical characterizations and datasets for a large group of streets, from time-varied urban areas, can be provided to assess quantitative correlations between influencing factors, time, and street vitality. In this way, more accurate and significant insights can be provided for street vitality, construction, and guidelines for urban sustainability in the future.

Author Contributions

X.X. (Xiaodong Xu) proposed the original concept and methods, and wrote the first draft of the manuscript. X.X. (Xinhan Xu), P.G., Y.R. and N.X. finished initial investigation and data processing. W.W. and X.X. (Xiaodong Xu) optimized the methods. X.X. (Xiaodong Xu), W.W. and N.X. read, revised and approved the submitted final version of the manuscript.

Funding

This work described in this paper was sponsored by National Natural Science Foundation of China (NSCF #51678127), National Scientific and Technological Support during the 12th Five-Year Plan Period (#2013BAJ10B13), China Scholarship Council (CSC #201706095035), National Natural Science Foundation of China for Young Scholars (NSFC #51408122), and Beijing Advanced Innovation Center for Future Urban Design (UDC# 016010100). Any opinions, findings, conclusions, or recommendations expressed in this paper are those of the authors and do not necessarily reflect the views of the sponsoring committees.

Conflicts of Interest

The authors declare no conflict of interest.

References

  1. Cafuta, M.R. Open Space Evaluation Methodology and Three Dimensional Evaluation Model as a Base for Sustainable Development Tracking. Sustainability 2015, 7, 13690–13712. [Google Scholar] [CrossRef] [Green Version]
  2. Zhu, Y.; Ding, J.; Zhu, Q.; Cheng, Y.; Ma, Q.; Ji, X. The impact of green open space on community attachment-a case study of three communities in Beijing. Sustainability 2017, 9, 560. [Google Scholar] [CrossRef]
  3. Kim, S.; An, K. Exploring psychological and aesthetic approaches of bio-retention facilities in the urban open space. Sustainability 2017, 9, 2067. [Google Scholar] [CrossRef]
  4. Montgomery, J. Making a city: Urbanity, vitality and urban design. J. Urban Des. 1998, 3, 93–116. [Google Scholar] [CrossRef]
  5. Kevin, L. The Image of the City; The MIT Press: Cambridge, MA, USA, 1960; ISBN 0-262-62001-4. [Google Scholar]
  6. Jacobs, J. The Death and Life of Great American Cities; Random House: New York, NY, USA, 1961. [Google Scholar]
  7. Gehl, J. Life Between Buildings: Using Public Space; Island Press: Washington, DC, USA, 1987; ISBN 978-1597268271. [Google Scholar]
  8. Whyte, W.H. The Social Life of Small Urban Spaces; Conservation Foundation: New York, NY, USA, 1980; ISBN 0-9706324-1-X. [Google Scholar]
  9. Alexander, C. A city is not a tree. Arch. Forum 1965, 122, 58–62. [Google Scholar]
  10. Jacobs, A.B. Great Streets; The MIT Press: Cambridge, MA, USA, 1993; ISBN 9780262100489. [Google Scholar]
  11. Ewing, R.; Cervero, R. Travel and the Built Environment: A Synthesis. Transp. Res. Rec. J. Transp. Res. Board 2001, 1780, 87–114. [Google Scholar] [CrossRef]
  12. Shan, H. American new urbanism. Architect 2003, 3, 4–19. [Google Scholar]
  13. Fitch, D.T.; Rhemtulla, M.; Handy, S.L. The relation of the road environment and bicycling attitudes to usual travel mode to school in teenagers. Transp. Res. Part A Policy Pract. 2018. [Google Scholar] [CrossRef]
  14. Cervero, R.; Kockelman, K. Travel demand and the 3Ds: Density, diversity, and design. Transp. Res. Part D Transp. Environ. 1997, 2, 199–219. [Google Scholar] [CrossRef]
  15. Ikioda, F. The impact of road construction on market and street trading in Lagos. J. Transp. Geogr. 2016, 55, 175–181. [Google Scholar] [CrossRef]
  16. Galanis, A.; Botzoris, G.; Eliou, N. Pedestrian road safety in relation to urban road type and traffic flow. Transp. Res. Procedia 2017, 24, 220–227. [Google Scholar] [CrossRef]
  17. Ajeng, C.; Gim, T.H.T. Analyzing on-street parking duration and demand in a Metropolitan City of a developing country: A case study of Yogyakarta City, Indonesia. Sustainability 2018, 10, 591. [Google Scholar] [CrossRef]
  18. Park, J.-H.; Kim, J.; Yoon, D.K.; Cho, G.-H. The influence of Korea’s green parking project on the thermal environment of a residential street. Habitat Int. 2016, 56, 181–190. [Google Scholar] [CrossRef]
  19. Kang, C.-D. The S+5Ds: Spatial access to pedestrian environments and walking in Seoul, Korea. Cities 2018, 77, 130–141. [Google Scholar] [CrossRef]
  20. Peiravian, F.; Derrible, S.; Ijaz, F. Development and application of the Pedestrian Environment Index (PEI). J. Transp. Geogr. 2014, 39, 73–84. [Google Scholar] [CrossRef]
  21. Jung, H.; Lee, S.; Kim, H.S.; Lee, J.S. Does improving the physical street environment create satisfactory and active streets? Evidence from Seoul’s Design Street Project. Transp. Res. Part D Transp. Environ. 2017, 50, 269–279. [Google Scholar] [CrossRef]
  22. Park, C.Y.; Lee, D.K.; Krayenhoff, E.S.; Heo, H.K.; Ahn, S.; Asawa, T.; Murakami, A.; Kim, H.G. A multilayer mean radiant temperature model for pedestrians in a street canyon with trees. Build. Environ. 2018, 141, 298–309. [Google Scholar] [CrossRef]
  23. Sung, H.G.; Go, D.H.; Choi, C.G. Evidence of Jacobs’s street life in the great Seoul city: Identifying the association of physical environment with walking activity on streets. Cities 2013, 35, 164–173. [Google Scholar] [CrossRef]
  24. Lee, Y.-C.; Chang, T.-J.; Hsieh, C.-I. A numerical study of the temperature reduction by water spray systems within urban street Canyons. Sustainability 2018, 10, 1190. [Google Scholar] [CrossRef]
  25. Lee, S.; Moon, H.; Choi, Y.; Yoon, D.K. Analyzing Thermal Characteristics of Urban Streets Using a Thermal Imaging Camera: A Case Study on Commercial Streets in Seoul, Korea. Sustainability 2018, 10, 519. [Google Scholar] [CrossRef]
  26. Wojnicki, I. Empirical Study of How Traffic Intensity Detector Parameters Influence Dynamic Street Lighting Energy Consumption: A Case Study in Krakow, Poland. Sustainability 2018, 10, 1221. [Google Scholar] [CrossRef]
  27. Wang, X.; Yao, J.; Yu, S.; Miao, C.; Chen, W.; He, X. Street trees in a Chinese forest city: Structure, benefits and costs. Sustainability 2018, 10, 674. [Google Scholar] [CrossRef]
  28. Shirvani, H. The Urban Design Process; Van Nostrand Reinhold: New York, NY, USA, 2007; ISBN 10: 0442280645; ISBN 13: 9780442280642. [Google Scholar]
  29. Xu, N.; Wang, J. Research on urban public space based on daily life perspective: Case studies of three groups of urban public space in Nanjing old city. Arch. J. 2008, 8, 45–48. [Google Scholar]
  30. Katz, P. The New Urbanism: Toward an Architecture of Community; McGraw-Hill Education: New York, NY, USA, 1993; ISBN 978-0070338890. [Google Scholar]
  31. Mahmoudi, M.; Ahmad, F.; Abbasi, B. Livable streets: The effects of physical problems on the quality and livability of Kuala Lumpur streets. Cities 2015, 43, 104–114. [Google Scholar] [CrossRef]
  32. Ewing, R.; Clemente, O. Measuring Urban Design: Metrics for Livable Places; Island Press/Center for Resource Economics: Washington, DC, USA, 2013; ISBN 978-1-61091-209-9. [Google Scholar]
  33. Long, Y.; Ye, Y. Human-scale urban form: Measurements, performances, and urban planning & design interventions. South Arch. 2016, 5, 41–47. [Google Scholar]
  34. Harvey, C.; Aultman-Hall, L.; Hurley, S.E.; Troy, A. Effects of skeletal streetscape design on perceived safety. Landsc. Urban Plan. 2015, 142, 18–28. [Google Scholar] [CrossRef] [Green Version]
  35. Hou, Q.; Qu, S.; Fang, Y. The method of building traditional street vitality based on D/H. In Proceedings of the China Urban Planning Annual Congress: Sustainable Development and Reasonable Planning, Dongguan, China, 17–20 November 2017. [Google Scholar]
  36. Zarin, S.Z.; Niroomand, M.; Heidari, A.A. Physical and Social Aspects of Vitality Case Study: Traditional Street and Modern Street in Tehran. Procedia Soc. Behav. Sci. 2015, 170, 659–668. [Google Scholar] [CrossRef]
  37. Sung, H.; Lee, S. Residential built environment and walking activity: Empirical evidence of Jane Jacobs’ urban vitality. Transp. Res. Part D Transp. Environ. 2015, 41, 318–329. [Google Scholar] [CrossRef]
  38. Keeton, R. Rising in the East: Contemporary New Towns in Asia; SUN Architecture: San Francisco, CA, USA, 2011; ISBN 9789461056832. [Google Scholar]
  39. Yu, Y.; Zhuang, Y. A Hypothesis of Urban Morphogenesis and Urban Vitality in Newly Built-up Areas: Analyses Based on Street Accessibility, Building Density and Functional Mixture. Urban Plan. Int. 2018. [Google Scholar] [CrossRef]
  40. North Potomac Yard Small Area Plan Process, 2010 Information and Background Materials Regarding the 2010 North Potomac Yard Planning Process; Department of Planning and Zone: Alexandria, VA, USA, 2010.
Figure 1. Flow chart for the methodology applied in this study.
Sustainability 10 02797 g001
Figure 2. Pictures of the nine streets: Hongmiao (a), Chengxian (b), and Qingdao (c) in the old urban area (top row from left to right); Pipa (d), Wufu (e), and Xinhua (f) in the main urban area (middle row from left to right); Fuchunjiang (g), Xin’anjiang (h), Songhuajiang (i) in the new urban area (bottom row from left to right).
Sustainability 10 02797 g002
Figure 3. The building density of the nine streets.
Sustainability 10 02797 g003
Figure 4. The building continuity of the nine streets.
Sustainability 10 02797 g004
Figure 5. The results of street height-to-width ratio for the nine streets.
Sustainability 10 02797 g005
Figure 6. The function distribution of the nine streets.
Sustainability 10 02797 g006
Figure 7. The density of stores along the nine streets.
Sustainability 10 02797 g007
Figure 8. The density of functions along the nine streets.
Sustainability 10 02797 g008
Figure 9. The permeation rate of frontage bottom business buildings in the nine streets.
Sustainability 10 02797 g009
Figure 10. The diagram of street entrances/exits for the nine streets.
Sustainability 10 02797 g010
Figure 11. The correlations between street vitality and the subfactors for the nine streets.
Sustainability 10 02797 g011
Figure 12. The correlations between the street vitality of the nine streets and the subfactors.
Sustainability 10 02797 g012
Table 1. The number of business facilities (NBF) and the number of residential areas (NRA) in the nine streets.
Street Name0–200 m200–500 m500–800 m800–1200 m1200–1500 m
NRANBFNRANBFNRANBFNRANBFNRANBF
Old urban area
Hongmiao82562964315219
Chengxian51203264397332
Qingdao501301864213478
Main urban area
Wufu60160211361387
Pipa411384796441099
Xiuhua110152352454414
New urban area
Songhuajiang301181231245
Fuchunjiang40327315260
Xin’anjiang41408043112
Table 2. The number of public transportation stops and stations and the vehicle frequency for the nine streets.
Street Name Bus Stops Frequency (hour)Metro Stations Frequency (hour)Total StopsAvg. Frequency
Old urban area
Hongmiao 1443748018258.5
Chengxian1235424014197
Qingdao51483608104
Main urban area
Wufu1225112013135.5
Pipa51963608128
Xiuhua 1444711015 228.5
New urban area
Songhuajiang 1723024019135
Fuchunjiang 141401201580
Xin’anjiang2222412023122
Table 3. Statistics of walking environment factors of the nine streets.
Street NameMeticulous DesignSmall SpaceRich ElevationAdvertise-MentMarkersPublicity WindowGreeneryLight-IngPave-mentSeatTelephone BoothNews-StandDustbinPublic ToiletBicycle ParkingStreet SquareOpen SpaceRanking
Old urban area
Hongmiao 6
Chengxian 3
Qingdao 7
Main urban area
Wufu 4
Pipa 1
Xiuhua 8
New urban area
Songhuajiang 5
Fuchunjiang 2
Xin’anjiang 1
Table 4. Distribution of the number of pedestrians in the nine streets in the urban area of Nanjing.
StreetMorning (08:00–09:00)Afternoon (13:00–14:00)Evening (19:00–20:00)AverageTotal
Old urban area
Hongmiao197213258223668
Chengxian163245201203609
Qingdao106162172147440
Main urban area
Wufu245262243250750
Pipa2663513923361009
Xiuhua11482159118355
New urban area
Songhuajiang88859389266
Fuchunjiang141148190160479
Xin’anjiang206259184216.33649

