Article

Resilient Entrepreneurship among European Higher Education Graduates

by
Ana-Maria Zamfir
1,*,
Cristina Mocanu
1 and
Adriana Grigorescu
2,†
1
National Scientific Research Institute for Labour and Social Protection, 6-8 Povernei Street, 010643 Bucharest, Romania
2
National School for Political and Administrative Studies, 30A Expozitiei Bd., 012104 Bucharest, Romania
*
Author to whom correspondence should be addressed.
Correspondent Member of Academy of Romanian Scientists.
Sustainability 2018, 10(8), 2594; https://doi.org/10.3390/su10082594
Submission received: 14 June 2018 / Revised: 18 July 2018 / Accepted: 19 July 2018 / Published: 24 July 2018

Abstract

:
Resilience represents the ability of systems and individuals to adapt and overcome the difficulties and challenges they face. Resilient entrepreneurs are those who cope with stressful or adverse situations by relying on both internal and external factors. This article examines the way higher education graduates express entrepreneurial resilience in various national contexts. We analyze the Research into Employment and professional Flexibility (REFLEX) data set that provides information on early career of higher education graduates leaving education in the academic year 1999/2000 in 13 European countries. We study resilience in entrepreneurship by considering both how long higher education graduates succeed to remain in self-employment and the extent to which they re-entry in entrepreneurship after exiting. Survival analyses, logistic and cox regressions indicate important differences in patterns of starting, remaining and returning in self-employment and in factors influencing the retention in entrepreneurship among higher education graduates. It is argued that structural factors, personal characteristics and educational background explain a large amount of variation in resilient entrepreneurship.

1. Introduction

The concept of “resilience” refers to the positive ability of individuals to overcome difficulties and cope with changes encountered in their life, including their professional life [1,2]. Resilience is also used to characterize the capacity of business, regions, groups and communities to respond and recover from shocks and adverse situations [3]. Resilience needs to be conceptualized as a process that appears in the presence of cumulative protective factors [4]. While initial research has referred to resilience as a trait [5], more recent studies show that resilience comes as a result of the interaction between individuals with their environment [2]. Resilience is better referred as an acquired ability [3].
Resilience has been used as a framework of study in various scientific fields such as engineering, environmental studies, psychology, sociology and economy. This multitude of approaches is beneficial for research as it provides the opportunity for wider operationalization and interpretation [6]. In engineering, resilience describes the capacity of a system to maintain its equilibrium or stability [7]. This traditional way of understanding resilience has been used in many areas of research such as studies analyzing the capacity of regional economies to maintain its performances in case of exogenous shocks. Recently, resilience is less understood as the capacity to restore an initial equilibrium and more as ecological resilience or adaptive resilience [8,9]. In the case of ecological resilience, the focus is put on the way systems move from one state of equilibrium into another under the pressure of external shocks. Following this line of thinking, sustainability resilience is expressed when systems adapt by resuming or improving their equilibrium growth path in long term [10]. From the perspective of complex adaptive systems theory, resilience refers to systems that reconfigure and adapt their component structures in order to keep their growth trend. Resilience is seen as an evolutionary process, including adaptive changes and dynamics [11,12,13].
The early years of one’s career represent a difficult period that can be characterized by change and uncertainty. School leavers are more vulnerable to job loss and unemployment as they compete with more experienced workers. The concept of “resilience” is widely used in retention studies, especially when it comes to early career and numerous scholars have studied the resilience of early career workers in education and health care sectors [14,15,16,17,18,19]. Resilience in professional life is seen as a process resulted from the interaction of personal and contextual challenges and resources [19]. On the other hand, entrepreneurship represents a desirable way for graduates to start their career and to nurture their professional potential. In the same time, entrepreneurship contributes to employment and economic growth, as well as regional development, especially the entrepreneurship in knowledge intensive activities [20].
This article explores the way higher education graduates express entrepreneurial resilience in their early career in various national contexts. Resilience in entrepreneurship is examined by employing survival analysis techniques on the duration of self-employment. Logistic and cox regressions are used in order to uncover protective factors that foster entrepreneurial resilience. In relation to other studies, this article brings a valuable contribution to resilient entrepreneurship research by focusing on education related factors. The findings of the study are useful for improving higher education programs in the view of better supporting entrepreneurship and better equip future entrepreneurs with skills needed in adverse situations. Also, this article responds to the need of enriching the comparative research on resilient entrepreneurship in order to better understand the influence of the national contexts and how various protective factors support entrepreneurship in different national settings.
This paper is organized as follows. The second section reviews the most important contributions in the field of factors influencing resilient entrepreneurship, including both internal and external factors. The third section describes the used data and methodology and the article ends with the discussion of our results, limitations and conclusions.

2. Entrepreneurial Resilience

2.1. Youth Entrepreneurship

Focus on youth entrepreneurship increased during last years, as a measure to cope with youth unemployment, as well as in order to take full advantage of youth high skills, ambition and creativity [21,22,23,24]. Previous findings suggest that entrepreneurs are a very heterogeneous group, with youth entrepreneurs being different as resources, skills, personality traits or entrepreneurial culture and institutions [23,25].
Among the common factors hampering youth propensity towards entrepreneurship the lack of a coherent legal and financial support programs [23,26,27], lack of education and training programs targeting entrepreneurial skills development, as well as good access to information on existing resources (financial, legal or educational) were mentioned by numerous studies.
While access to financial resources and social networks act as a plus for older entrepreneurs, personality traits such as ambition and creativity, as well as the high ICT skills clearly work for young entrepreneurs’ advantage [23]. Also, the individual perception on the costs and gains related to entrepreneurship in specific economic conditions, perceived as more or less favorable influence the decision for self-employment [28,29]. Other studies pointed out to the impact of first negative experience in relation to the labor market, as periods of unemployment affect youth feelings of security and their long term entrepreneurial or career plans [24,30,31,32]. However, studies vary a lot in their findings. Some authors consider that those with previous unemployment experiences have a higher propensity towards self-employment [33], others consider that the unemployment experience in early career becomes a “scar”, increasing the fear of self-employment [23,25], while there are studies finding no significant effects [24]. Even if findings seem to contradict each other, the explanation is related to the decision for self-employment, whether it was by necessity or by opportunity [24].

2.2. Perspectives on Resilient Entrepreneurship

Economic studies on entrepreneurship focus on its role in the economic processes and development, the psychologists are more interested in the personality traits of the entrepreneurs, while social behavior scholars highlight the role of the social environment in forming entrepreneurs [4]. The understanding of the notion of “entrepreneur” has shifted from a traits-based approach to one that is focused on actions and outcomes [34]. Personal characteristics such as aging, being a women and fear of failure decrease the chance of becoming an entrepreneur, while the level of knowledge and skills has a positive impact on entrepreneurship [35].
Scholars consider resilience a key trait of entrepreneurs who succeed in continuing their business by overcoming various types of crises [1,36]. Resilient enterprises are those that survive, adapt and grow in times of change and adverse conditions [1,37].
On the other hand, resilience experienced in early life can trigger future entrepreneurship initiatives. Four elements have been identified as supporting this process: the existence of resilience mentors, commitment to undertaken actions, self-esteem and the search for meaning [38]. Other studies analyzed resilience of entrepreneurs as a factor influencing or predicting the business performances and entrepreneurial success. Three dimensions of resilience have been found to influence success of entrepreneurs: hardiness, resourcefulness and optimism, while the resourcefulness is the most important factor [39]. Resilience and confidence in personal entrepreneurial abilities have proven to be beneficial for entrepreneurs activating in adverse conditions, including war areas [40]. Also, previous research supports the reversal of this thesis as entrepreneurship has been found to lead to resilience in marginalized contexts [41].
Other researchers have studied the entrepreneurial failure, connecting it with personal characteristics of the entrepreneur, the characteristics of the company and the context [42]. Empirical evidences indicate that after venture failure, many entrepreneurs show resilience and re-entry into entrepreneurship [43,44]. While some scholars consider that entrepreneurial exit is not entirely assimilated with failure [45,46,47,48], most of the business exits are unsuccessful [49]. Small and young firms are most vulnerable to the risk of exit, while the innovation performances positively influence the probability of firms’ survival [50]. Moreover, while their growth patterns are not very predictable, firms’ survival depends by the stock of available resources [51].
Entrepreneurial resilience is conducive to sustainability in general, while evidences on various trade-offs between resilience and sustainability have been found [52,53,54]. One study of the difficulties encountered by entrepreneurs to implement circular economy in Europe shows that national policies need to support both the skills development and the reduction of the bureaucracy in the field [55]. So, education and skills development seem to be important for both sustainability and resilience in entrepreneurship.

2.3. Factors Shaping Entrepreneurial Resilience

In the case of entrepreneurs, protective factors include various resources such as social networks, knowledge and skills, attitudes and values, as well as other types of support available to them [56,57,58]. It has been shown that entrepreneurial resilience is highly influenced by self-confidence in personal entrepreneurial skills, belonging to networks and developing entrepreneurial plans [59]. The Successful Start-up Business Model identifies four factors influencing entrepreneurial success: (1) personality traits, (2) psychological capital, (3) education, skills and knowledge representing the human capital, and (4) networks and connections representing the social capital of entrepreneurs [60]. Other scholars found that responsibility, accountability, and emotional intelligence have positive impact on micro-enterprise performances [61] and that positive outlook on life, business success and business demand predict the business success [62]. Personal characteristics of entrepreneurs such as self-confidence, task–result orientation, in-depth planning of the business future and the use of a unique business model support the enterprises performances [63]. Other scholars have shown that individual factors (skills and abilities), situational factors (behavior and experience of parents) and process-related factors (entrepreneurial learning and work attitudes and behavior) are mutually dependent and shape the entrepreneurial resilience [64].
Along with various personal characteristics, education of entrepreneurs influences the probability of firms’ survival [65,66]. However, previous work indicates mixed results concerning the relation between entrepreneurial education and entrepreneurial skills or intention to become an entrepreneur [67,68]. Although education has an increasing role in human capital accumulation, providing higher private returns to individuals, in some situation, characteristics of the process of participants’ selection to education and training programs explain the negative effects that appear at the level of the expected outcomes in some situations [69]. In the same time, according to the absorptive capacity theory [70], entrepreneurs who have higher capacity to understand external information and use it in the commercial process are more likely to be successful.
Scholars show that, similar to entrepreneurship, resilience in entrepreneurship is influenced not only by internal and personal characteristics, but also by structural and external factors. The dynamics of the entrepreneurial process is influenced by the institutional settings and level of economic development within a country [71]. In fact, entrepreneurial resilience has been proven to be the result of the match between entrepreneurs’ personal characteristics and their environment [72,73]. Other scholars have argued that the increasing focus on sustainability provides better opportunities for innovation and economic development [74], as well as for entrepreneurship [75].

3. Data and Methods

This article studies the entrepreneurial resilience in early career of higher education graduates as their probability to “survive” as self-employed. Our analysis is based on a large-scale survey carried out among higher education graduates in fourteen countries within the REFLEX project (Research into Employment and professional Flexibility). For the purpose of this study, we excluded Japan from the analysis. Data have been collected in 2005 from higher education graduates leaving education in the academic year 1999/2000. The data set contains information on early career of graduates from: Portugal, Spain, Italy, France, Austria, Germany, Netherlands, Belgium, United Kingdom, Norway, Finland, Estonia and Czech Republic. A total of 31,846 of graduates have been included in the sample. In-depth information regarding characteristics of the first job after graduation and of the current job (moment of the survey) has been collected. Also, the data set includes information regarding the educational background and skills of the graduates, professional values and aspirations, as well as other personal characteristics relevant for the topic of this paper.
In order to study the resilience of early career entrepreneurs, we focus on those becoming self-employed at first job after graduation and use several methods: logistic regression to better understand the factors that influence the entrance, remaining and returning in self-employment of higher education graduates, Kaplan–Meier estimator to determine the retention in self-employment and multivariate Cox regression model to study the effects of a number of factors on the duration of retention. This paper aims to investigate the profile of higher education graduates becoming self-employed, the profile of those remaining or returning in self-employment at the moment of the survey. Additionally, the article examines patterns of graduates “survival” in self-employment and what factors influence the duration of their retention in self-employment.
First, profile of those entering in self-employment after graduation is explored by employing logistic regression. Further, in order to examine the resilience of early career self-employed, we restrict the sample to those who have become self-employed at their first job, obtaining a final sample of 2209 graduates. Distribution of the sample by country is presented in Figure A1 (748 self-employed from Czech Republic, 329 from Italy, 210 from Spain, 177 from Austria, 159 from Netherlands, 127 from Belgium, 121 from Germany, 78 from Finland, 58 from France, 58 from Portugal, 53 from Norway, 49 from United Kingdom and 42 from Estonia). Other logistic regressions are constructed in order to depict characteristics of those remaining and returning in self-employment after exiting (5 years after graduation). For the logistic regression model, Backward Stepwise Wald method was used. All the independent variables were included in the regression models and they were excluded one by one based on the probability of the Wald statistic. Additionally, following other scholars [76], retention in self-employment and factors influencing it are studied by employing survival analysis tools: Kaplan–Meier estimator and Cox regression.
The Kaplan–Meier estimator is a nonparametric method very popular in medical and biological studies on life-time data. The core idea of this method is to determine the conditional probabilities at each point in time when an event takes place and further compute the product limit of these probabilities in order to generate survival functions.
The surviving function S ( t ) = p r ( T > t ) refers to the probability of an early career entrepreneur to “survive” t points in time (in our case, months) from the beginning of the study period (entrance in the first job as self-employed—first job after graduation, starting before or after graduation) until the event happens (exit from the first job as self-employed), where T is a random variable called survival time or lifetime. Censored cases are represented by self-employed higher education graduates remaining in self-employment until the moment of the survey (for whom the event of exiting the self-employment isn’t recorded during the study period).
The hazard function represents the risk of “death” at time t, conditional on survival to that time:
  h ( t ) = lim Δ t 0 p r [ ( t T < t + Δ t | T t ) ] Δ t =   p ( t ) S ( t )  
where p ( t ) = d P ( t ) d ( t ) is the probability density function.
We use Cox proportional hazards model [77] in order to examine the relationship of the survival distribution to a series of factors:
  log h i ( t ) =   α ( t ) + β 1 x i 1 + β 2 x i 2 + + β k x i k  
where the dependent variable is the log hazard and the constant of the model is a log-baseline hazard ( t ) = log h 0 ( t ) . The coefficients are interpreted in terms of relative risks when the covariate is increased by 1.
The duration of the self-employment is measured as conditional probability that an early career self-employed exits self-employment within a particular month, given that this has not occurred prior to this month. The starting time is considered the month of entering in the first job as self-employed.
For both logistic and Cox regressions, we consider various independent variables (Table 1 and Table A1) regarding personal characteristics of the graduates, educational backgrounds, skills and education-job match, professional values and social networks useful for setting up businesses. Summary statistics for all variables are presented in Table A2, Table A3, Table A4, Table A5, Table A6, Table A7, Table A8, Table A9, Table A10, Table A11, Table A12, Table A13, Table A14, Table A15, Table A16 and Table A17.

4. Results

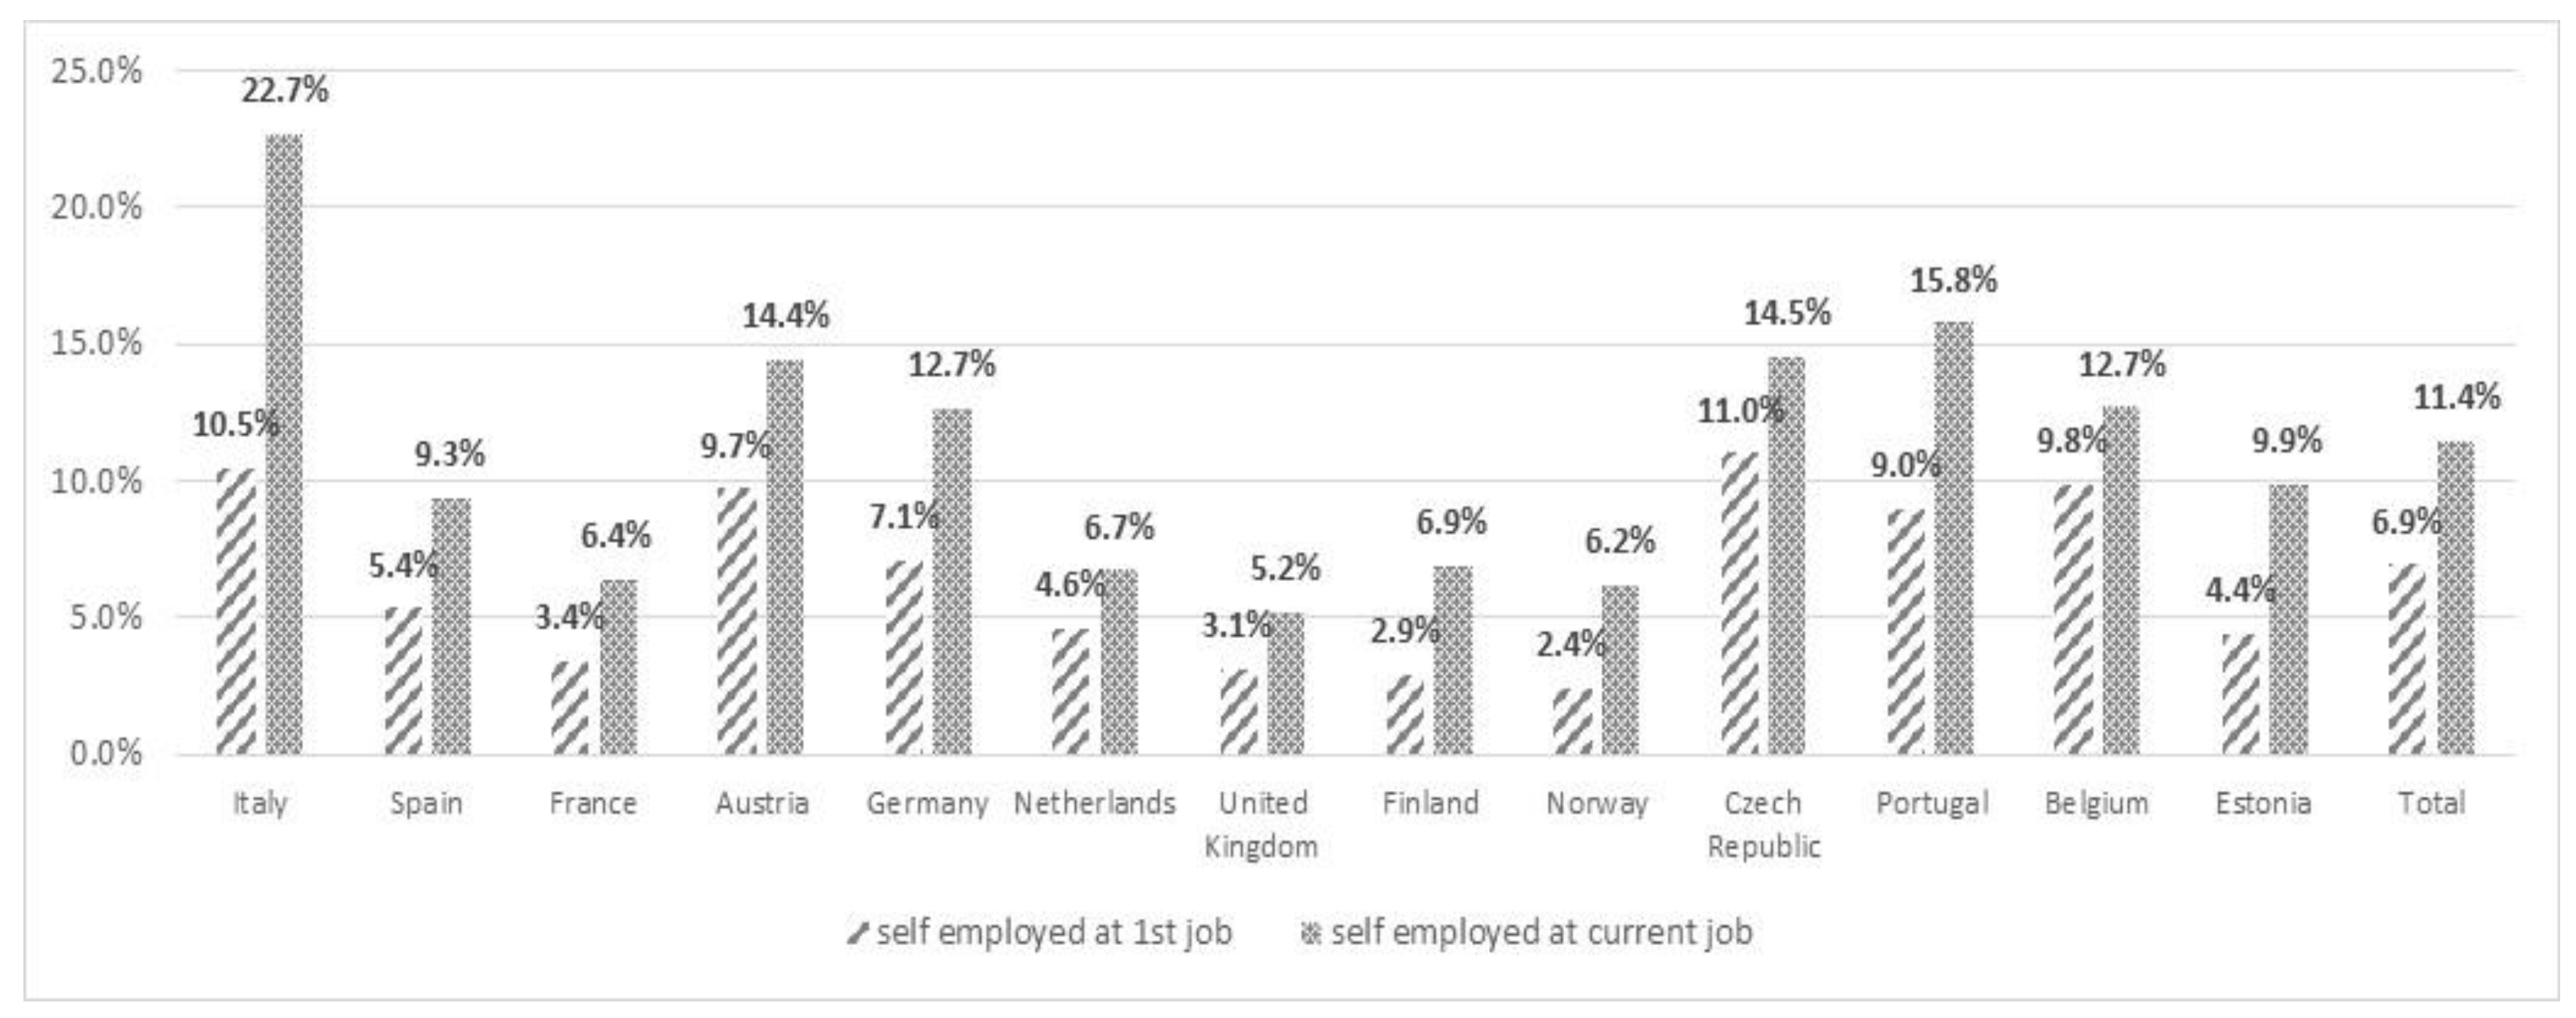
4.1. Incidence of Self-Employment among Higher Education Graduates

A minority of 6.9% of higher education graduates became self-employed at their first job after leaving the higher education (including those working during the study period). As expected, only a minority of graduates had no job after ending education, namely 2.2%.
The incidence of self-employment after graduation is higher in countries such as Italy, Portugal, Belgium, Austria, but also in Czech Republic, a former communist country. Surprisingly to a certain extent, the survey data pointed out a higher incidence of self-employment at the first job after graduation in Central and Eastern Europe as against Western countries. Part of the explanation resides in the need of youth to secure employment in countries coping with effects of restructuration and scarcity of employment opportunities. Also, in these countries, important part of self-employment represents a shadow dependent self-employment, with numerous self-employed being dependent employees [29] or simply self-employed by necessity [78,79]. Also, as expected, incidence of self-employment is higher among male graduates than among female graduates. Only 6.3% of female graduates became self-employed to their first job, as against 8.1% of male graduates.
The share of those reported that are self-employed increased from 6.9% to 11.4% at the moment of the survey carried out 5 years after graduation (see Figure 1). The share of self-employed at 5 years after graduation increased in all countries, as shown in the chart below.
Analysis of the transitions occurred between the self-employed status and other occupational statuses between first and current job reveals that most of those starting their career as self-employed tend to remain as such on medium and long term. The highest stability register those having other occupational statuses (most of them dependent workers), but also, approximately two thirds of graduates beginning as self-employed were also self-employed at the moment of the survey (64.0%). If we consider graduates being self-employed at both first and current jobs as resilient self-employed, we find that resilience among self-employed is higher in Western Europe as compared with Central and Eastern Europe, as well as among men as compared with women (Table 2).
On the one hand, resilience is expressed by the self-employed who succeeded to remain self-employed for long periods of time and we named them “remaining self-employed”. On the other hand, resilience can also be found among those starting their career as self-employed, leaving the track (to unemployment or becoming dependent worker) and then coming back to self-employment and we named them “returned to self-employment”. The share of self-employed in the first job remaining self-employed until 2005 and the share of self-employed returning to self-employment after a break are evidenced in the Figure 2. The highest rate of remaining self-employed is witnessed in Italy, while the rate of returning to self-employment picks in Portugal, Spain and Czech Republic.

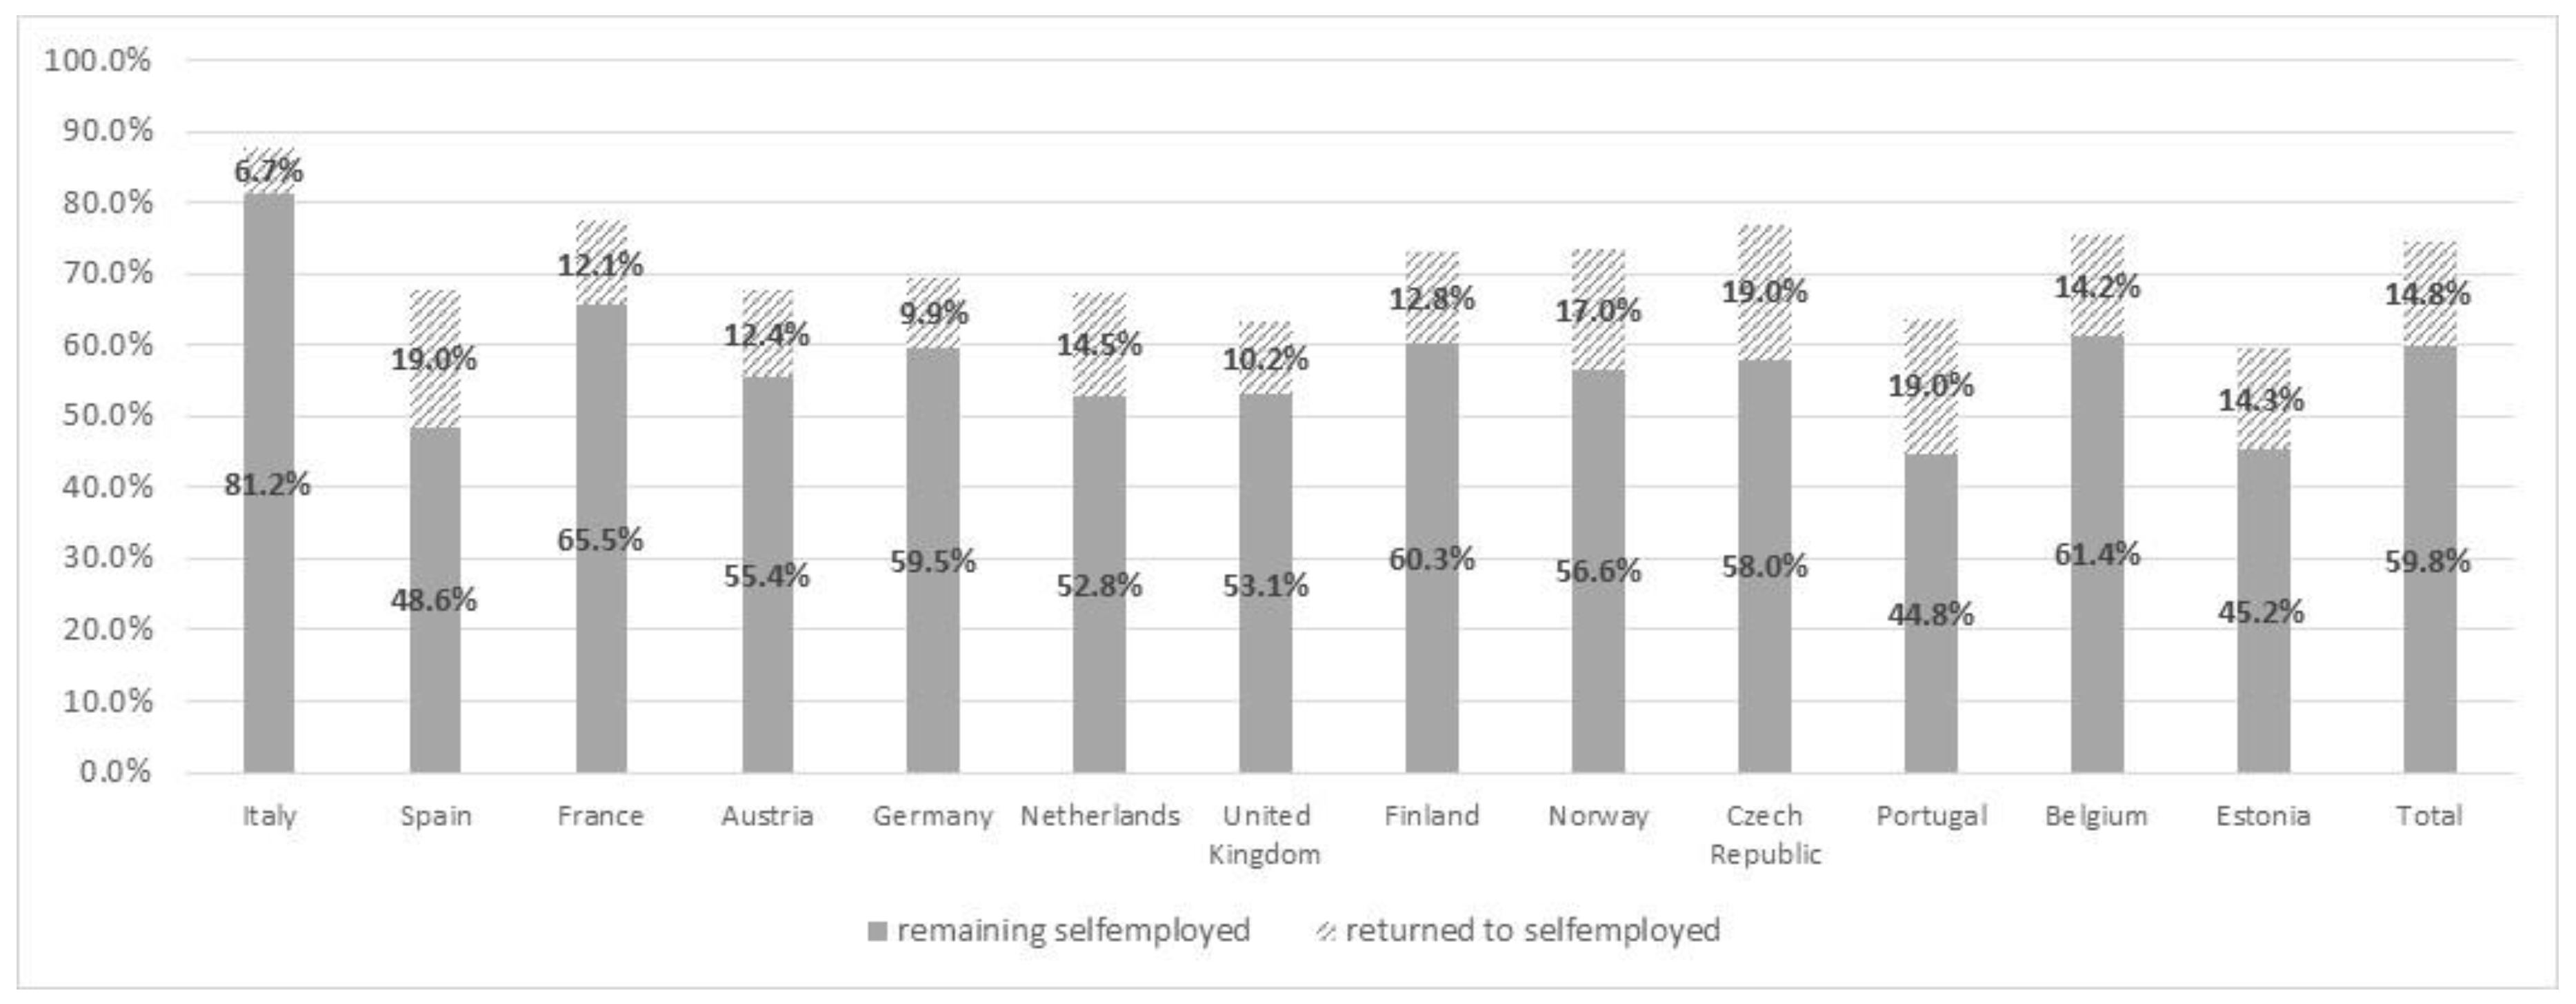
4.2. Profile of Higher Education Graduates Entering, Remaining and Returning in Self-Employment

In order to better understand the factors that facilitate both becoming self-employed as well as becoming a resilient self-employed, we run a set of three logistic regression analyses, as described in the methodology section.
First model (Table 3) aims to understand the factors that lay behind the decision to become entrepreneur. The dependent variable used in the model is self-employed, taking value “1 = self-employed”. The results of the logistic regression sustain our goal of uncovering underlying factors related to education or education-job match that facilitate the decision to become self-employed. As evidenced by previous studies, socio-demographics factors play a very important role in modelling the decision of becoming self-employed. Those born in Italy, Spain, Austria, Germany, Czech Republic, Portugal and Belgium have significantly higher chances of becoming self-employed than those born in Estonia (the country of reference). On the other hand, the decision to become self-employed is significantly lower among higher graduates from Nordic countries as compared with the country of reference. Gender is also a significant factor modelling the decision of graduates, with a higher probability among man to become self-employed. Also, age is a very important factor, and even if the paper is focused mostly on youth entrepreneurship, higher the age, higher the probability to enter in self-employment at the first job. Last, but not least, as a variable characterizing the socio-economic background of the family, we found out that graduates coming from families where the father reached higher education (and presuming higher earnings) also have a higher propensity of becoming self-employed. Social capital is another important predictor, as extensively discussed in previous studies. Those declaring their networks as useful and very useful for setting up businesses have 40% more chances of becoming self-employed, as comparing with those not relying so much on their social resources. Additionally, those perceiving the need of additional informal learning have a higher probability to become self-employed. Informal learning seems to be rather developed along social networks. Personal values and traits represent another set of factors debated in the studies on entrepreneurship. Our results show that youth valuing work autonomy have higher probability of choosing self-employment, while those acknowledging the need for continuing education and learning have a lower one.
Also, as evidenced by previous studies, the economic environment and the characteristics of different economic sectors shape the entrepreneurship behavior. Even though most of the variables used are subjective, reflecting perceptions of the graduates, the findings prove to be significant. When a specific market is a perceived as unstable, the probability of becoming self-employed is lower. On contrary, where the market is well-developed and characterized by high competition and increased added-value (competition driven by quality), the probability of entering in self-employment increases.
As a main contribution of this paper, we study the influence of different characteristics of the study programs and education-job match on the decision of youth for entrepreneurship. As expected, the field of study is among the significant variables, indicating that those graduating humanities and arts and agriculture and veterinary sciences have higher chances to become self-employed. Students completely committed to their education program (full-time student) have a lower probability to enter in entrepreneurship. Following a study program perceived as demanding or based on projects and problem learning also slightly increases the probability of becoming self-employed. Even though some study programs incorporate modules or courses dedicated to entrepreneurship, these new features do not necessarily lead to increased propensity of becoming self-employed. On the contrary, they are considered less important in developing a career as self-employed. All factors related to education-job mismatch included in the model proved to be significant. Youth transiting from education to self-employment are rather those considering they are under-educated for their job, those needing more skills and knowledge relative to what they possess, as well as those needing formal continuing training. The findings on the role of education-job mismatch could be puzzling. But, first we have to mention that the assessment of under-education at the first job is measured at the moment of survey data collection, and not at the moment of entering in that specific job. Secondly, it is to a certain extent expected that the content of the education programs cannot adapt to the need of small businesses and entrepreneurship that sometimes aim to emerge in rapidly changing market niches.
Second and third models aim to identify determinants of resilient self-employment. Resilient entrepreneurs are far more diverse, and the factors underneath resilience are much more difficult to be caught. Model M2 (Table 4) begins from defining resilient self-employed as those that succeed to survive until the moment of the survey. The dependent variable used in the model is remaining self-employed, taking value “1 = still self-employed at the first job”. Country, gender and age are important in explaining the success of entrepreneurs in this model. Graduates from Italy, France and Belgium have higher chances to remain self-employed for longer periods of time. Again, male have a probability with 41% higher to remain self-employed as compared with women. Also, higher the age, higher the probability to remain self-employed for longer periods of time. Economic context is another predictor for resilient entrepreneurship. Those activating in the primary sector have a higher probability to remain self-employed, the explanation residing in the structure of the employment in the sector. Also, activating in sectors with higher competition and higher added value, as well as on the markets perceived as unstable increase the resilience of entrepreneurs. The last predictor could point to resilient entrepreneurship both due to necessity, but also as opportunity, by taking full advantage of market niches developing in changing economies. Again, perceived under-education is a significant predictor in the model, what is understandable if we consider the fact that entrepreneurs are at the forefront of economic development. On the other hand, those valuing work autonomy register an increased probability to remain self-employed, while those valuing new challenges and the need to permanently learn new things have a lower probability to remain self-employed. So, if the rapid changes of economy and occupational content is coupled with unstable markets and permanent changes of legal and fiscal framework, then the incidence of resilient self-employed decrease significantly.
Model M3 (Table 5) identifies determinants of resilient entrepreneurship, but using another definition. Here the resilient entrepreneurs are considered those who left their first jobs as self-employed for other occupational statuses, and then return to self-employment. The dependent variable used in the model is returning to self-employment, taking value “1 = returning to self-employment after leaving the first job”. The role of personal factors decreases as importance in explaining this type of resilient entrepreneurship, only gender and social capital remaining significant in the model. Men again are to a higher extent represented among resilient entrepreneurs, as well as those for which the social network is very useful for the business success. Economic context is again significant; the resilient entrepreneurship being more probable to be found in sectors characterized by high competition and increased added-value. When it comes to the educational background of resilient entrepreneurs, field of study is significant as youth graduating humanities and arts, social sciences, business and law (fields nurturing the so called liberal professions) and science, mathematics and computers have higher probability to return to self-employment after leaving it. The most interesting findings are referring to the importance of following academic prestigious study programs and being involved in research programs during higher education. Those following this kind of study programs have higher chances to return to self-employed. To conclude with respect to resilient self-employment, we can say that findings related to socio-demographic (including access to social networks), role of the economic context and personal values are consistent with previous studies. But when it comes to characteristics of the study programs, we found that the most demanding, academically prestigious and research-oriented programs can build resilience among their graduates.

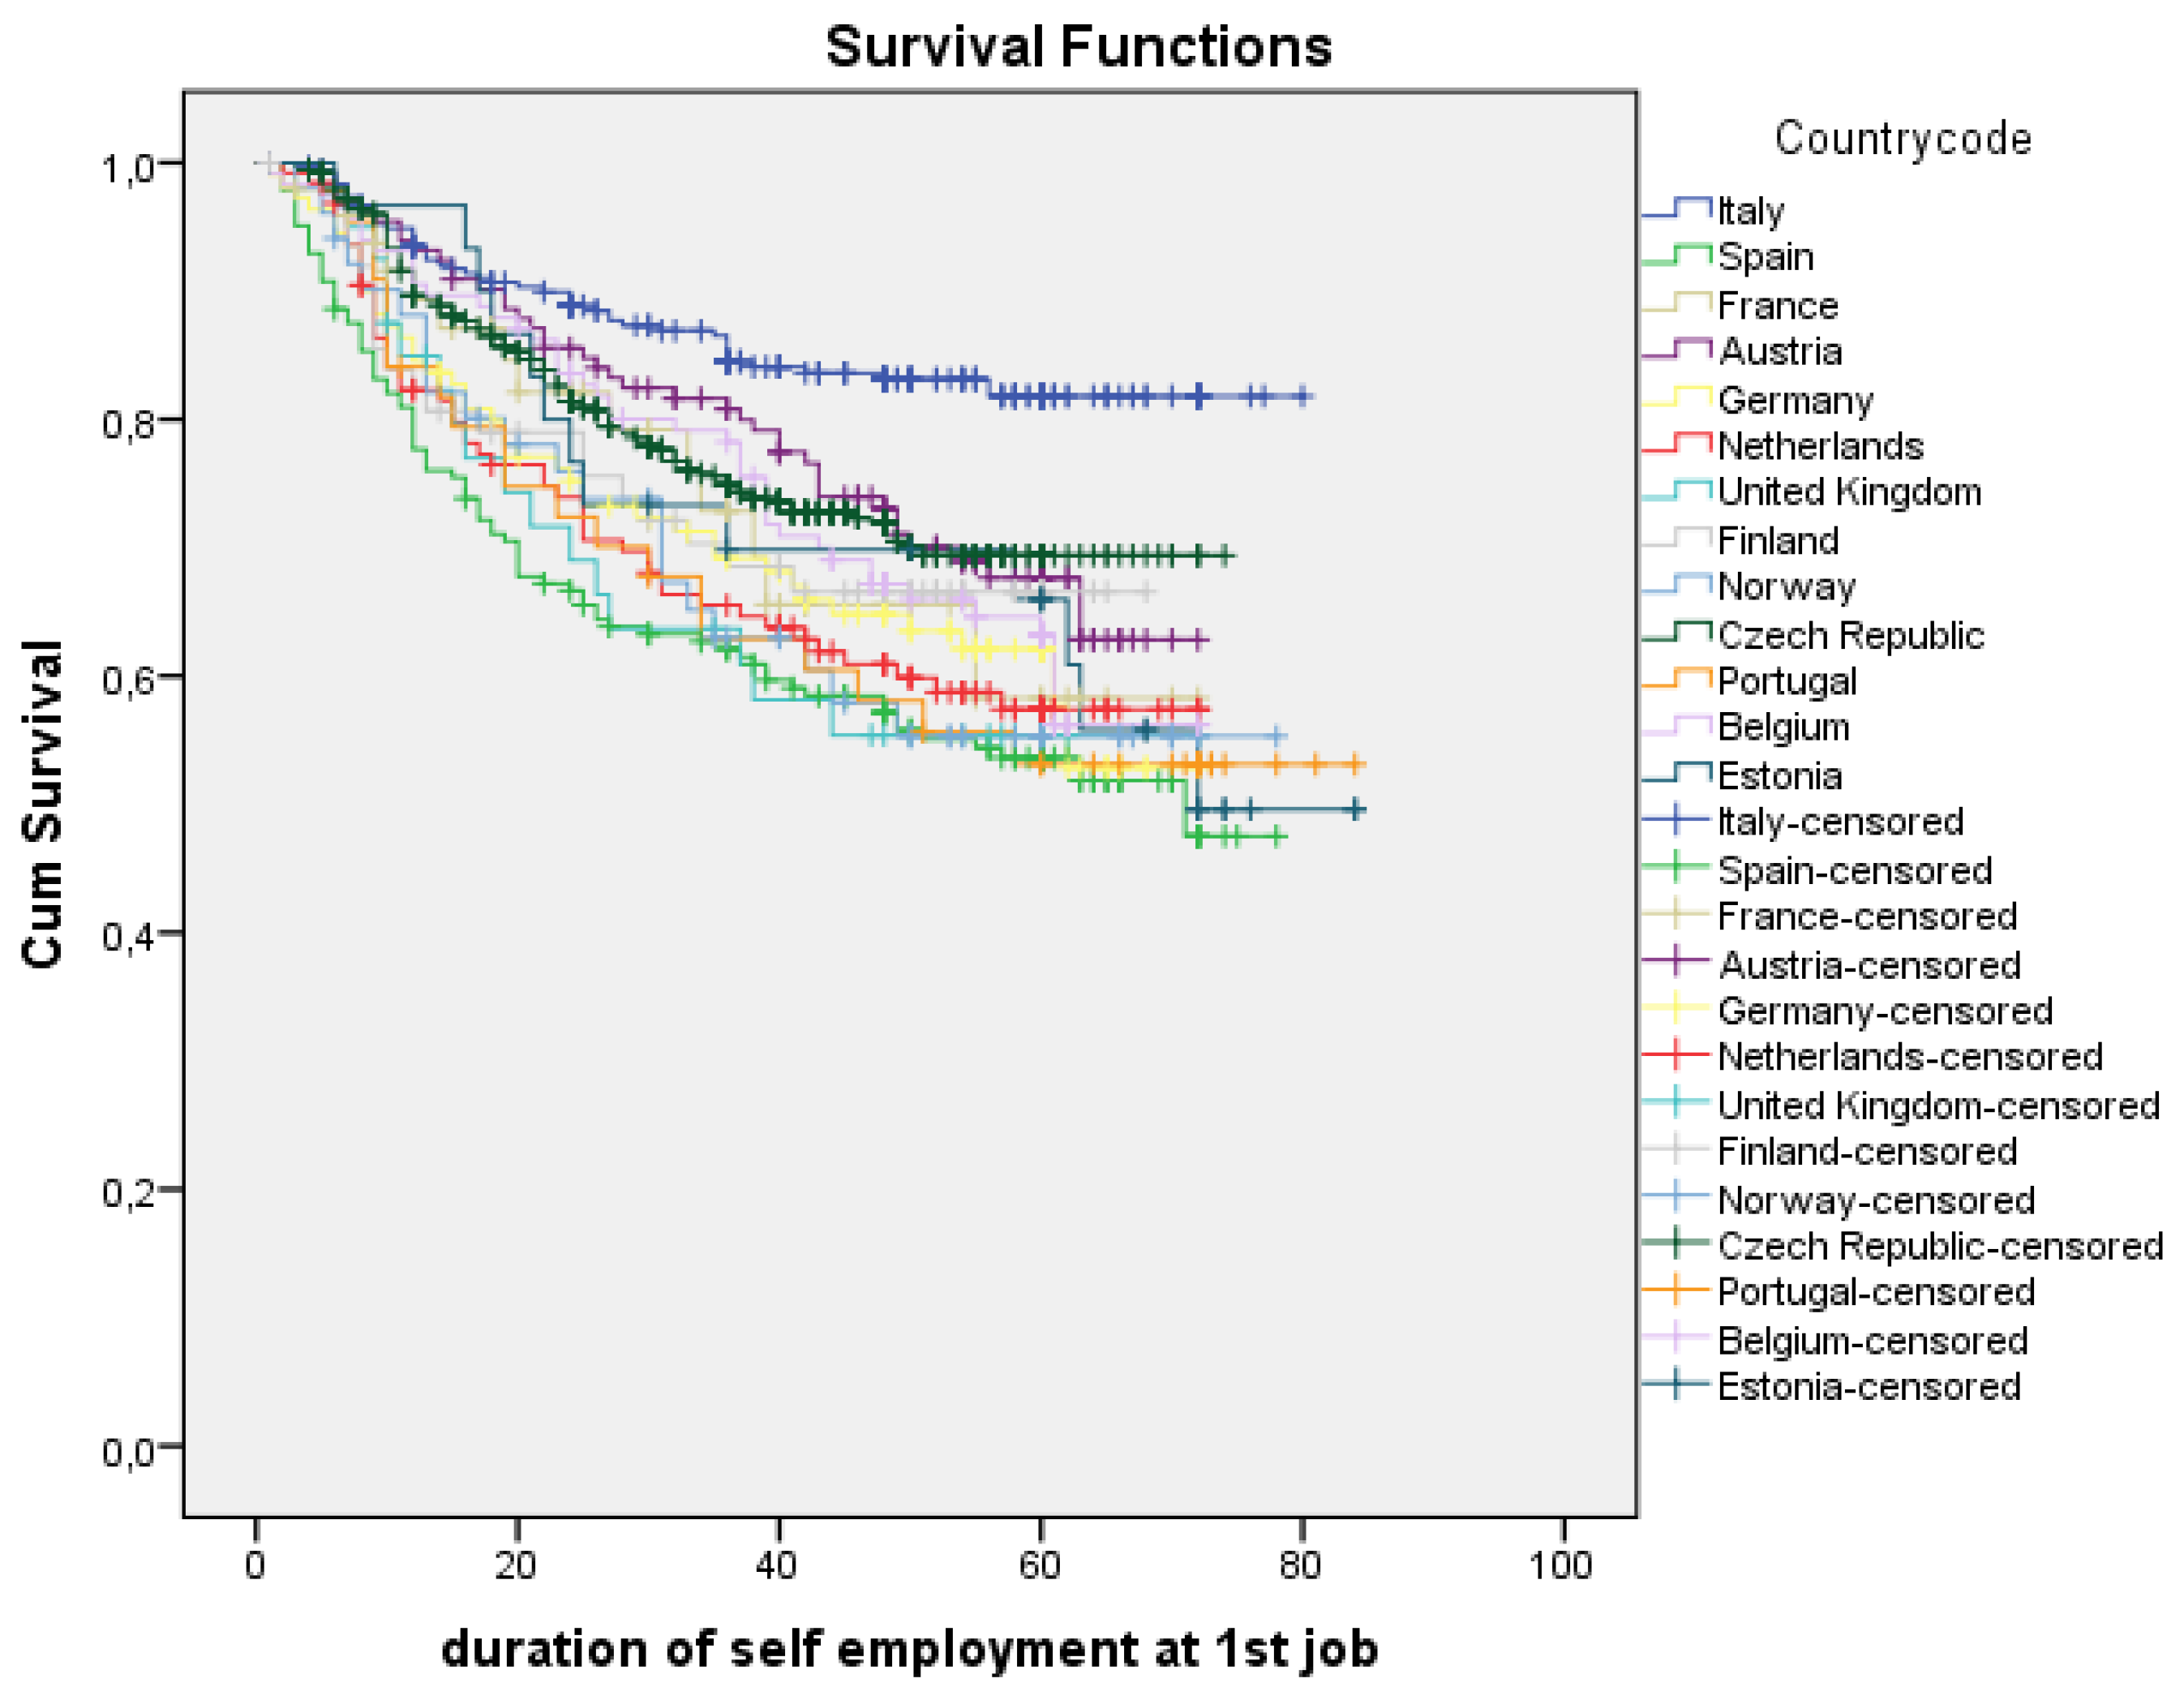
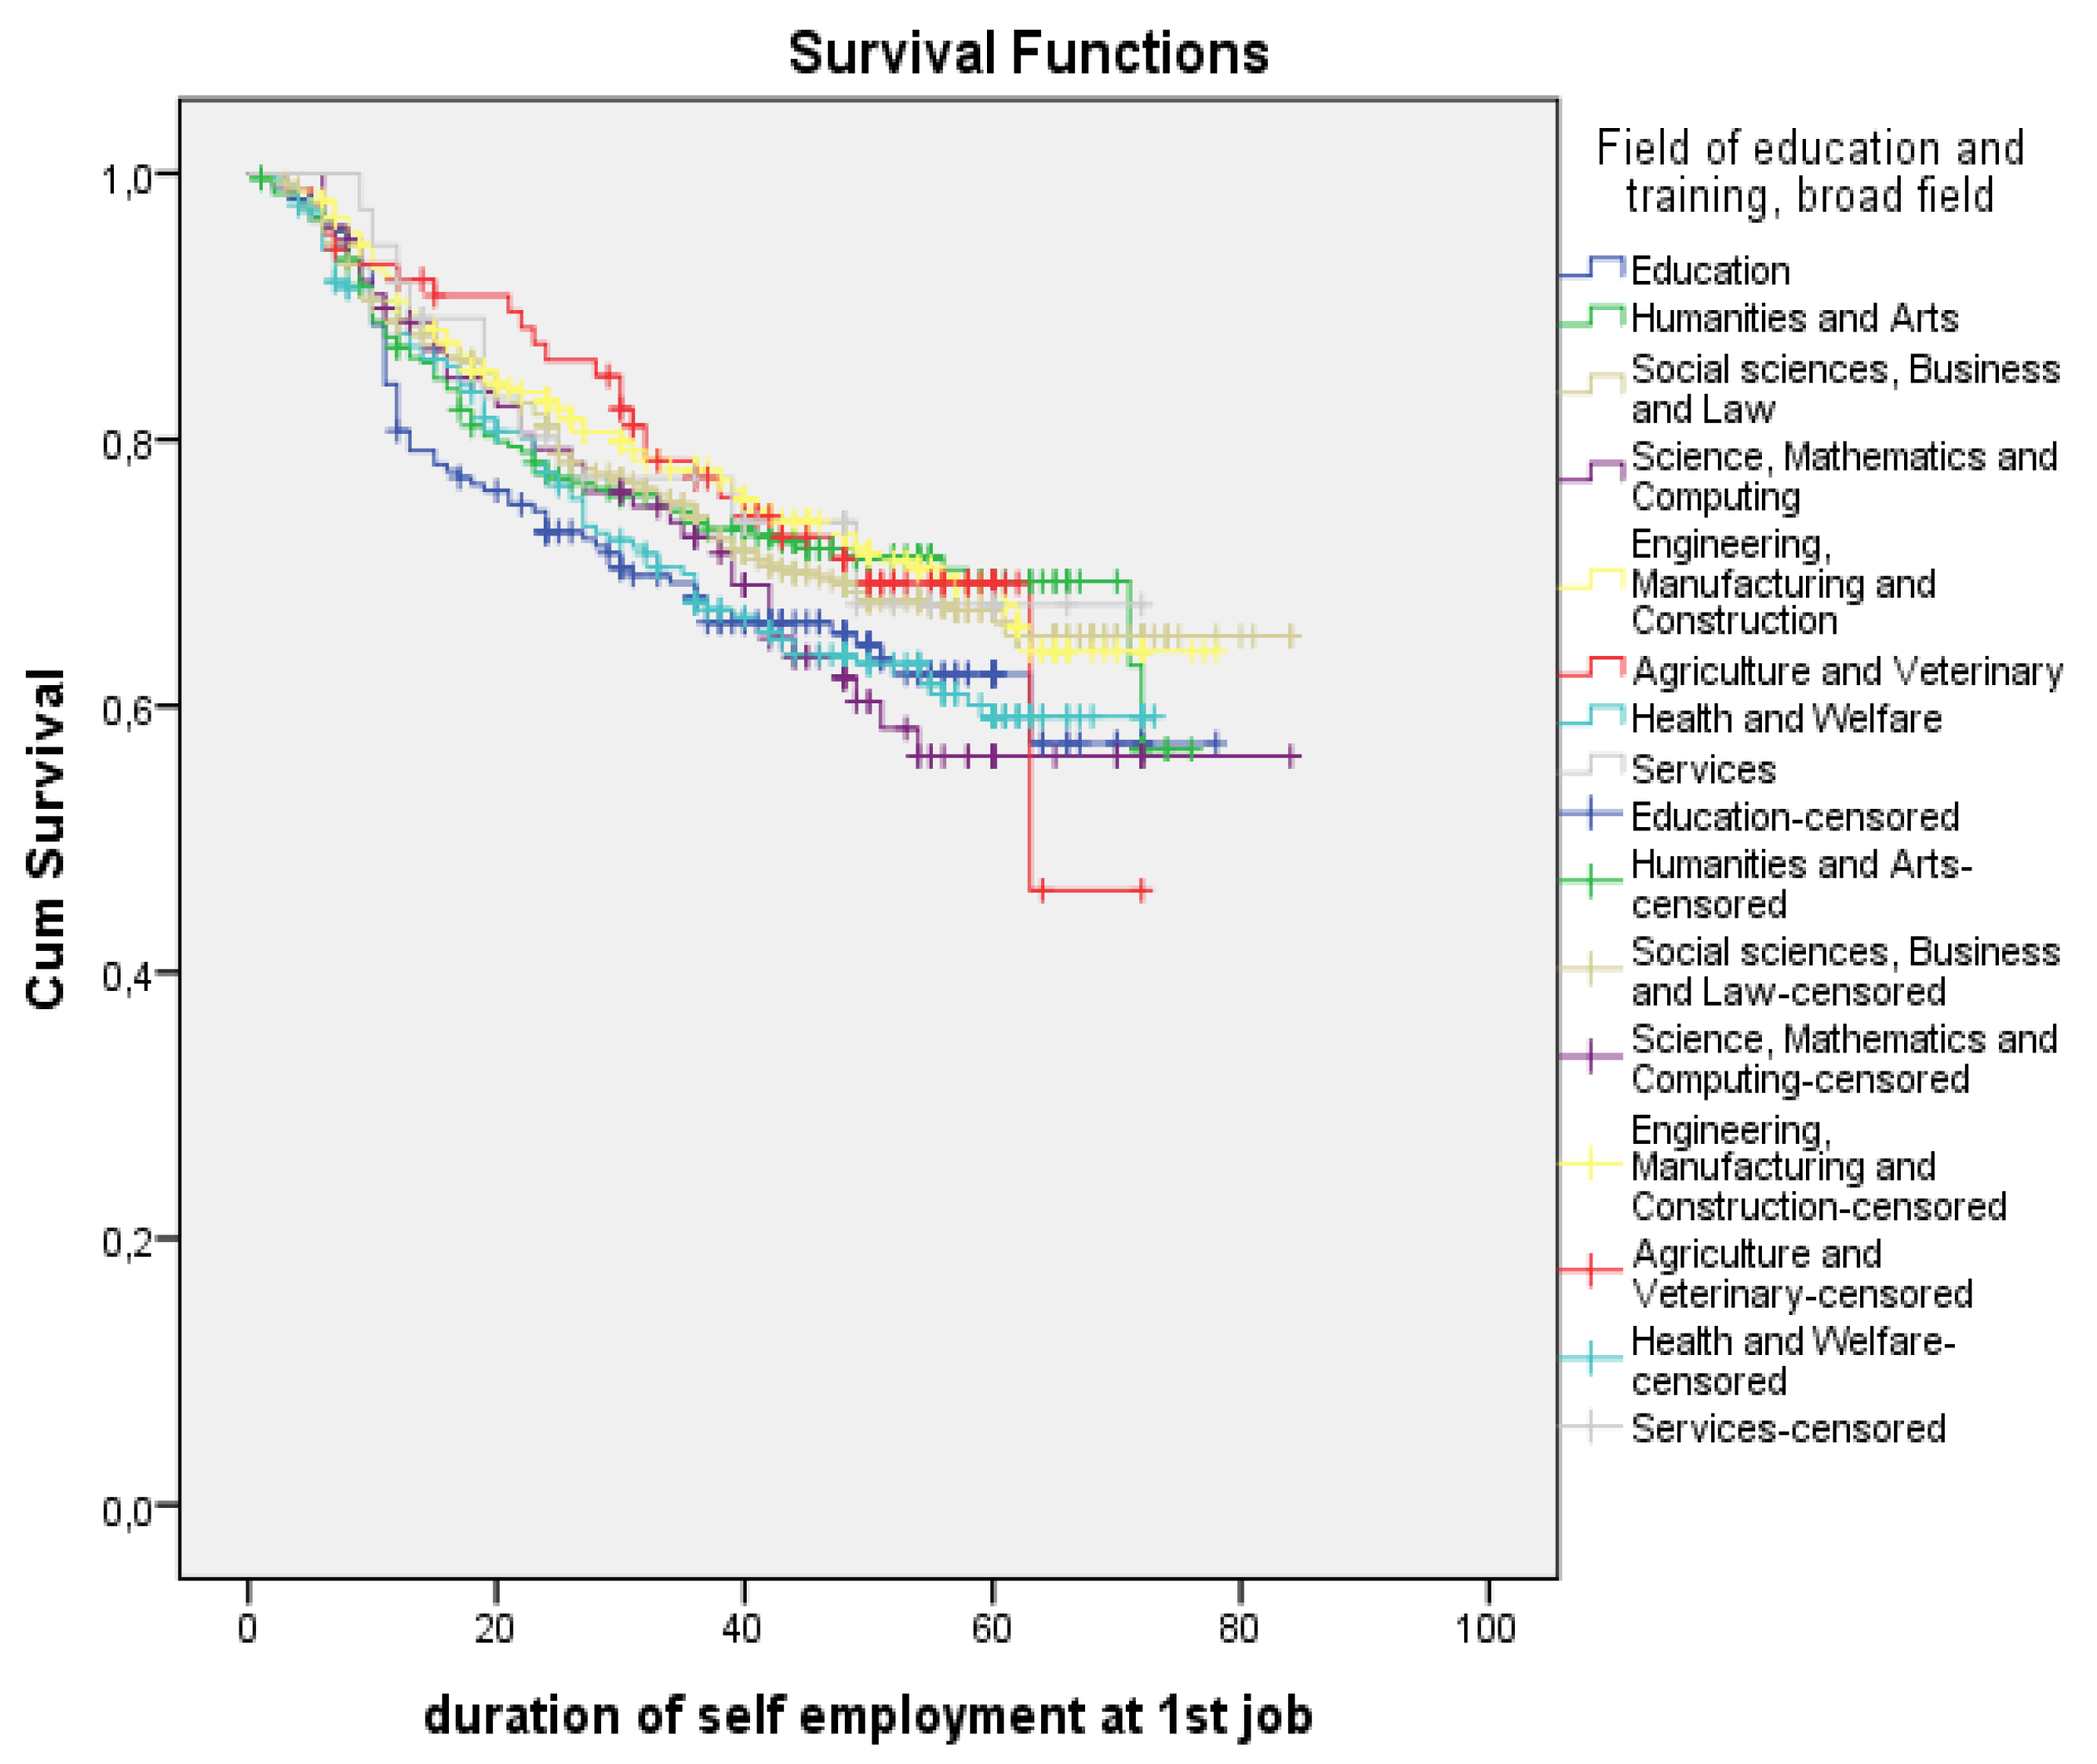
4.3. Factors Influencing Retention in Self-Employment

As stated in the methodology section, survival analysis tools are employed in order to study the retention of higher education graduates in self-employment at first job. Retention is measured by the duration of remaining in self-employment and Kaplan–Meier survival estimates by country are shown in Figure 3. The results indicate that the national context determines important differences in retention of higher education graduates in self-employment. National differences increase sharply for duration of self-employment more than 20 months. Highest resilience is found for self-employed in Italy where around 80% of graduates remain in self-employment until de moment of the survey. Moreover, after 40 months of self-employment, higher education graduates become very resilient in Italy and cross the next period of the study with no relevant exits. Spain displays the poorest performance with respect to resilience in the first job as self-employed, being characterized by the sharpest decline of the share of resilient self-employed. After 20 months, more than 30% of self-employed exit this state in Spain.
Figure 4 plots Kaplan–Meier survival estimates by fields of study. High resilience in self-employment is shown by graduates of engineering, manufacturing and construction education programs. While graduates from agriculture and veterinary studies display high resilience in the first period of the study, their share declines sharply after 60 months of self-employment. A similar pattern of evolution is found in the case of graduates of science, mathematics and computing whose resilience declines significantly after 40 months of self-employment.
In order to estimate the influence of a number of factors on the duration of self-employment, we use a Cox regression model. Results that are presented in Table 6 show that graduates from Italy, France, Austria, Czech Republic and Belgium present a lower risk of leaving self-employment earlier as compared to those from Estonia (the reference country). Along with the influence of the national context, numerous factors related to the educational background of the graduates influence the retention in self-employment. First, high academic performances, as measured by the grades level, are associated with a lower risk of early exit from self-employment. Also, the statute of full-time student in the last years of the study program increases the risk of leaving the first job as self-employed. It seems that working experience during higher education is conducive for resilient entrepreneurship after graduation. We also explored the influence of several teaching and learning methods used during higher education programs on the later retention in self-employment. Participation to research projects in high extent seems to improve the retention in self-employment. On the other hand, factors related with the education-job match do not have the expected influence on the duration of self-employment. Thus, self-employed who consider themselves undereducated for their first job are characterized by higher duration of retention in self-employment. In the same time, higher skill gap, measured as the need for more knowledge and skills compared with what the individual possess, increases the number of months spent in self-employment. However, those who graduated study programs fostering the development of entrepreneurial skills display improved retention in self-employment. Self-employment in secondary and tertiary sectors is characterized by higher risk of exiting earlier from this position. Additionally, social networks of the graduates represent an important protective factor for retention in self-employment. Those who have social networks useful for setting up their own business register longer duration of self-employment. Personal factors related with professional values of the graduates have some influence on the risk of exiting self-employment. Those who value the opportunity to learn new things and new challenges in their professional life register lower retention in self-employment. They seem to be more open to leave faster the first job as self-employed and look for other opportunities and challenges. Finally, male graduates register longer duration of self-employment as compared with women, while older graduates have lower risk of exiting the self-employment status.

5. Discussion and Conclusions

This article explored data collected through a large scale international survey among higher education graduates in order to uncover patterns and factors influencing the resilience in entrepreneurship. We used Kaplan–Meier estimates, logistic and Cox regression models for better understanding protective factors that act in the case of early career self-employment among European higher education graduates. This study confirms and complements the findings of previous studies showing the role of both internal and external factors shaping resilient entrepreneurship. We studied resilience in entrepreneurship by considering both how long higher education graduates succeed to remain in self-employment and the extent to which they re-entry in entrepreneurship after exiting.
Our results show that countries such as Italy, France, Belgium and Czech Republic offer a more protective environment for resilient entrepreneurship. Other structural factors influencing the resilience in entrepreneurship include the economic sector and market characteristics. On the other hand, personal factors such as gender and age of the graduates shape the resilience in entrepreneurship indicating that male and older graduates are more resilient. Additional internal factors that influence the capacity of self-employed to cope with adverse situations are professional values. Higher education graduates who value the opportunity to learn new things and to experience new challenges register higher rates of exit from self-employment, while those valuing the autonomy in work have higher probability to become and remain self-employed for longer duration of time. Confirming the findings of previous studies [46,47], our results show that social networks supporting business setting up are important protective factors for resilient entrepreneurship.
Another valuable contribution of this paper refers to the influence of educational background on the resilience in self-employment. Along with the field of study that shape the way higher education graduates express later entrepreneurship resilience, factors related with characteristics of the study program, methods of teaching/learning and level of academic performances influence retention in and returning to self-employment. Working experience during the higher education period and study programs that support the development of entrepreneurial skills are conducive for resilient entrepreneurship. Our results are valuable for decision makers in education field aiming to improve study programs in higher education for equipping future entrepreneurs with improved resilience.
As previously shown by other scholars [80], population characteristics and the wider context can influence the impact of policies in a given sector. Therefore, our results on internal and external factors that shape resilient entrepreneurship are useful for policymakers designing policies for fostering entrepreneurship in various national contexts. Considering our results of survival in self-employment functions by country, policymakers can identify and address specific vulnerabilities in the lifecycle of early career entrepreneurs in each country. From the research implications point of view, our results underline the role of the national context for resilient entrepreneurship and can offer a base for more in-depth national studies. Also, the internal and external factors found to influence the resilience in entrepreneurship can represent a framework for other qualitative studies on the topic.
Our data and findings refer to the resilience of higher educated young entrepreneurs in the period 2000–2005. So, one limitation of this study is related to the fact that our data didn’t cover the resilience of entrepreneurs during the economic and financial crisis and that the observation period is rather old. However, this article analysis patterns of behavior and influences that are rather stable in time. Other limitations are related with the nature of available data that helped us estimate the resilience of entrepreneurs. As described in the methodology section, the REFLEX database registers the occupational statute and duration of first and current job of higher education graduates. Based on these data, we constructed the two proxy measures for resilient entrepreneurs: those remaining and those returning in self-employment. Moreover, given the nature of our data, we were able to analyze the retention in entrepreneurship only for those becoming self-employed at their first job after graduation. Ideally, the study should also include some national-level indicators (related with economic performances and entrepreneurship environment) and other individual-level factors such as business-related attitudes. Therefore, in order to better understand the influence of structural factors on entrepreneurship resilience, our future research will employ a multi-level approach including other factors characterizing the national context.

Author Contributions

All authors have participated to the article by making substantial, direct, intellectual contributions to this research. Writing—original draft, A.-M.Z., C.M. and A.G.

Funding

NUCLEU Program funded by the Romanian Ministry of Research and Innovation (Project PN 18420101).

Acknowledgments

Part of this work was supported by the NUCLEU Program funded by the Romanian Ministry of Research and Innovation (Project PN 18420101).

Conflicts of Interest

The authors declare no conflict of interest.

Appendix A

Figure A1. Distribution of self-employed at first job, by country.
Sustainability 10 02594 g0a1
Table A1. Description of variables included in the analysis.
Variables LabelVariable GroupVariable Type
Self-employed at first jobDependent variable (M1)Dummy variable, taking value 1 for being self-employed at first job after graduation and 0 for other situation
Remaining self-employed in current jobDependent variable (M2)Dummy variable, taking value 1 for being self-employed both at first job and current job (moment of the survey) and 0 for other situation
Returning to self-employment after leaving the first jobDependent variable (M3)Dummy variable, taking value 1 for being self-employed both at first job, leaving it and returning to self-employed at current job (moment of the survey) and 0 for other situation
Retention in self-employment at first jobDependent variable (M4)Continuous variable, number of months spent as self-employed in current job, calculated from the beginning of the first job till the end of it or till the moment of the survey
CountryIndependent Nominal variable, taking values from 1 to 17, according to country code (1 = Italy, 2 = Spain, 3 = France, 4 = Austria, 5 = Germany, 6 = Netherlands, 7 = United Kingdom, 8 = Finland, 10 = Norway, 11 = Czech Republic, 15 = Portugal, 16 = Belgium, 17 = Estonia)
Field of study (broad field)IndependentNominal variable, taking values from 1 to 8 (1 = Education, 2 = Humanities and arts, 3 = Social sciences, Business and Law, 4 = Science. Mathematics, Computing, 5 = Engineering, Manufacturing, Construction, 6 = Agriculture and Veterinary, 7 = Health and Welfare, 8 = Services)
Field of education and trainingIndependentDummy variable, taking value 1 for graduating a field of education and training related to environment protection and 0 for other situation
Grade compared to other students gradesIndependentDummy variable, taking value 1 for graduating with a grade higher than average 0 for other situation
Situation in the last 1–2 years of studyIndependentNominal variable, taking values from 1 for being fulltime student and 2 for being part-time student. All other values were treated as missing
Study program demandingIndependentDummy variable, taking value 1 for graduating a study program generally regarded as demanding (values 4 and 5 on a scale from 1 = not at all to 5 = to a very high extent) and 0 for other situation
Freedom in composing the own study programIndependentDummy variable, taking value 1 for graduating a study program generally regarded as providing freedom in organizing the study program (values 4 and 5 on a scale from 1 = not at all to 5 = to a very high extent) and 0 for other situation
Study program with a broad focusIndependentDummy variable, taking value 1 for graduating a study program generally regarded as having a broad focus (values 4 and 5 on a scale from 1 = not at all to 5 = to a very high extent) and 0 for other situation
Study program vocationally orientedIndependentDummy variable, taking value 1 for graduating a study program generally regarded as vocationally oriented (values 4 and 5 on a scale from 1 = not at all to 5 = to a very high extent) and 0 for other situation
Study program academically prestigiousIndependentDummy variable, taking value 1 for graduating a study program generally regarded as academically prestigious (values 4 and 5 on a scale from 1 = not at all to 5 = to a very high extent) and 0 for other situation
Participation in research projectsIndependentDummy variable, taking value 1 for graduating a study program where participation in research projects was used as teaching and learning method (values 4 and 5 on a scale from 1 = not at all to 5 = to a very high extent) and 0 for other situation
Project/problem-based learningIndependentDummy variable, taking value 1 for graduating a study program where project and/or problem-based learning was used as teaching and learning method (values 4 and 5 on a scale from 1 = not at all to 5 = to a very high extent) and 0 for other situation
Internship, work placementIndependentDummy variable, taking value 1 for graduating a study program where taking part to internships or different work placements was used as teaching and learning method (values 4 and 5 on a scale from 1 = not at all to 5 = to a very high extent) and 0 for other situation
Looking for workIndependentDummy variable, taking value 1 for having a job searching behavior prior or after graduation and 0 for nether searching for a job
Primary sectorIndependentDummy variable, taking value 1 for working in agriculture, forestry, hunting, fishery and mining and quarrying and 0 for other situation
Secondary sectorIndependentDummy variable, taking value 1 for working in industry and constructions and 0 for other situation
Tertiary sectorIndependentDummy variable, taking value 1 for working in public or private services sectors and 0 for other situation
Need of training coursesIndependentDummy variable, taking value 1 for working in a job needing initial formal training period and 0 for other situation
Need of informal learningIndependentDummy variable, taking value 1 for working in a job needing initial informal training period and 0 for other situation
Perceived under-education relative to study programIndependentDummy variable, taking value 1 for working undereducated in first job and 0 for other situation
Need for more knowledge and skills compared with what the individual possesIndependentDummy variable, taking value 1 for working in a job that demands more knowledge and skills that the graduate possess (values 4 and 5 on a scale from 1 = not at all to 5 = to a very high extent) and 0 for other situation
Usefulness of social network—Very usefulIndependentDummy variable, taking value 1 for those considering social network (friends, relatives, colleagues, former teachers, etc.) as useful in setting up the business (values 4 and 5 on a scale from 1 = not very useful to 5 = very useful) and 0 for other situation
Very strong competition in the fieldIndependentDummy variable, taking value 1 for those considering the competition in the market they operate as strong and very strong (values 4 and 5 on a scale from 1 = very weak to 5 = very strong) and 0 for other situation
Competition driven mainly by qualityIndependentDummy variable, taking value 1 for those considering their organization as operating mainly by quality (values 4 and 5 on a scale from 1 = mainly price to 5 = mainly quality) and 0 for other situation
Highly stable marketIndependentDummy variable, taking value 1 for those considering the demand in the market they operate as stable and highly stable (values 4 and 5 on a scale from 1 = highly stable to 5 = highly unstable) and 0 for other situation
Study program good basis for entrepreneurial skillsIndependentDummy variable, taking value 1 for those considering their study program as a good basis for development of entrepreneurial skills (values 4 and 5 on a scale from 1 = not at all to 5 = to a very high extent) and 0 for other situation
Work autonomyIndependentDummy variable, taking value 1 for those valuing work autonomy as a job characteristic (values 4 and 5 on a scale from 1 = not at all to 5 = very important) and 0 for other situation
Opportunity to learn new thingsIndependentDummy variable, taking value 1 for those valuing opportunities to learn new things as a job characteristic (values 4 and 5 on a scale from 1 = not at all to 5 = very important) and 0 for other situation
New challengesIndependentDummy variable, taking value 1 for those valuing new challenges as a job characteristic (values 4 and 5 on a scale from 1 = not at all to 5 = very important) and 0 for other situation
Gender IndependentNominal variable, taking value 1 for male and 2 for female. All other values were treated as missing
AgeIndependentContinuous variable, number of years at the moment of the survey
Father with higher educationIndependentDummy variable, taking value 1 for those mentioning their father’s level of education being ISCED 5 + 6 and 0 for other situation
Table A2. Distribution of selected sub-samples by country (%).
CountryTotal Number of Self-Employed at First JobTotal Number of Those Remaining Self-Employed in Current JobTotal Number of Those Returning to Self-Employment
N = 2209N = 1321N = 327
Italy14.920.26.7
Spain9.57.712.2
France2.62.92.1
Austria8.07.46.7
Germany5.55.53.7
Netherlands7.26.47.0
United Kingdom2.22.01.5
Finland3.53.63.1
Norway2.42.32.8
Czech Republic33.932.943.4
Portugal2.62.03.4
Belgium5.75.95.5
Estonia1.91.41.8
Total100.0100.0100.0
Table A3. Distribution of selected sub-samples by field of study (broad field) (%).
Field of Study (Broad Field)Total Number of Self-Employed at First JobTotal Number of Those Remaining Self-Employed in Current JobTotal Number of Those Returning to Self-Employment
N = 2209N = 1321N = 327
Education12.411.315.0
Humanities and Arts15.115.413.1
Social sciences, Business and Law29.030.122.9
Science, Mathematics and Computing5.75.04.6
Engineering, Manufacturing and Construction18.219.019.6
Agriculture and Veterinary4.75.13.4
Health and Welfare11.310.814.4
Services2.42.14.6
DNA1.31.32.4
Total100.0100.0100.0
Table A4. Distribution of selected sub-samples by the situation in the last 1–2 years of study (%).
Situation in the Last 1–2 Years of StudyTotal Number of Self-Employed at First JobTotal Number of Those Remaining Self-Employed in Current JobTotal Number of Those Returning to Self-Employment
N = 2209N = 1321N = 327
Fulltime student67.266.665.7
Part-time student32.132.932.7
No answer0.70.51.5
Total100.0100.0100.0
Table A5. Distribution of selected sub-samples by how they perceive their study program (%).
Description of Study ProgramTotal Number of Self-Employed at First JobTotal Number of Those Remaining Self-Employed in Current JobTotal Number of Those Returning to Self-Employment
N = 2209N = 1321N = 327
Perceived as demanding60.063.059.9
Perceived as academically prestigious38.340.140.1
Note: differences to 100% are those not considering their study programs as such.
Table A6. Distribution of selected sub-samples by how they perceive the methods of teaching and learning used under their study program (%).
Description of Methods of Teaching and Learning UsedTotal Number of Self-Employed at First JobTotal Number of Those Remaining Self-Employed in Current JobTotal Number of Those Returning to Self-Employment
N = 2209N = 1321N = 327
Project/problem-based learning26.728.027.5
Participation to research projects41.740.647.1
Note: differences to 100% are those not considering their study programs used methods as such.
Table A7. Distribution of selected sub-samples by job searching behavior (%).
Job Searching BehaviorTotal Number of Self-Employed at First JobTotal Number of Those Remaining Self-Employed in Current JobTotal Number of Those Returning to Self-Employment
N = 2209N = 1321N = 327
Looked for a job44.739.552.3
Never looked for a job55.360.547.7
Total100.0100.0100.0
Table A8. Distribution of selected sub-samples by main economic sector of activity (%).
Main Economic Sector of ActivityTotal Number of Self-Employed at First JobTotal Number of Those Remaining Self-Employed in Current JobTotal Number of Those Returning to Self-Employment
N = 2209N = 1321N = 327
Primary sector3.33.81.8
Secondary sector11.711.412.8
Tertiary sector75.975.877.4
Note: differences to 100% are those not working in the respective sector of activity.
Table A9. Distribution of selected sub-samples by perceived need for initial training (%).
Need for Initial TrainingTotal Number of Self-Employed at First JobTotal Number of Those Remaining Self-Employed in Current JobTotal Number of Those Returning to Self-Employment
N = 2209N = 1321N = 327
Need of training courses12.413.49.8
Need of informal learning26.224.429.7
Note: differences to 100% are those not considering they had the respective need.
Table A10. Distribution of selected sub-samples by perceived under-education at first job (%).
Under-Education at First JobTotal Number of Self-Employed at First JobTotal Number of Those Remaining Self-Employed in Current JobTotal Number of Those Returning to Self-Employment
N = 2209N = 1321N = 327
Relative to study program9.711.59.2
Need for more knowledge and skills30.632.130.6
Note: differences to 100% are those not considering they had the respective need/issue.
Table A11. Distribution of selected sub-samples by perceived usefulness of social network (%).
Usefulness of Social NetworkTotal Number of Self-Employed at First JobTotal Number of Those Remaining Self-Employed in Current JobTotal Number of Those Returning to Self-Employment
N = 2209N = 1321N = 327
Useful and very useful42.344.244.6
Other situation57.755.855.4
Total100.0100.0100.0
Table A12. Distribution of selected sub-samples by perceived economic context (%).
Economic ContextTotal Number of Self-Employed at First JobTotal Number of Those Remaining Self-Employed in Current JobTotal Number of Those Returning to Self-Employment
N = 2209N = 1321N = 327
Very strong competition 57.963.064.2
Competition driven by quality43.046.947.4
Highly stable market30.028.938.5
Note: differences to 100% are those not considering the economic context as such.
Table A13. Distribution of selected sub-samples by perceived usefulness of study program for the development of entrepreneurial skills (%).
Usefulness of Study Program for Entrepreneurial SkillsTotal Number of Self-Employed at First JobTotal Number of Those Remaining Self-Employed in Current JobTotal Number of Those Returning to Self-Employment
N = 2209N = 1321N = 327
Useful and very useful7.47.98.9
Other situation92.692.191.1
Total100.0100.0100.0
Table A14. Distribution of selected sub-samples by the importance of different job characteristics (%).
Valuing Job CharacteristicsTotal Number of Self-Employed at First JobTotal Number of Those Remaining Self-Employed in Current JobTotal Number of Those Returning to Self-Employment
N = 2209N = 1321N = 327
Work autonomy54.756.562.1
Opportunity to learn new things 51.147.860.9
New challenges36.634.145.6
Note: differences to 100% are those not considering the different job characteristics as important and very important.
Table A15. Distribution of selected sub-samples by gender (%).
GenderTotal Number of Self-Employed at First JobTotal Number of Those Remaining Self-Employed in Current JobTotal Number of Those Returning to Self-Employment
N = 2209N = 1321N = 327
Male44.348.443.7
Female52.748.353.5
DNA3.03.32.8
Total100.0100.0100.0
Table A16. Distribution of selected sub-samples by father’s level of education (%).
Father’s Level of EducationTotal Number of Self-Employed at First JobTotal Number of Those Remaining Self-Employed in Current JobTotal Number of Those Returning to Self-Employment
N = 2209N = 1321N = 327
Having higher education or more31.031.032.7
Having less that higher education69.069.067.3
Total100.0100.0100.0
Table A17. Descriptive for age variable for selected sub-samples.
AgeTotal Number of Self-Employed at First JobTotal Number of Those Remaining Self-Employed in Current JobTotal Number of Those Returning to Self-Employment
N = 2209N = 1321N = 327
Valid values21251263315
Mean 32.2132.8431.37
Median 30.0031.0030.00

References

  1. Neenan, M. Developing Resilience; Routledge: London, UK, 2018; ISBN 9781351745338. [Google Scholar]
  2. Zautra, A.J.; Hall, J.S.; Murray, K.E. Resilience: A New Definition of Health for People and Communities. In Handbook of Adult Resilience; Reich, J.W., Zautra, A.J., Hall, J.S., Eds.; The Guilford Press: New York, NY, USA, 2010; pp. 3–30. ISBN 978-1-60623-488-4. [Google Scholar]
  3. Rutter, M. Developing Concepts in Developmental Psychopathology. In Developmental Psychopathology and Wellness: Genetic and Environmental Influences; Hudziak, J.J., Ed.; American Psychiatric Publishing: Washington, DC, USA, 2008; pp. 3–22. ISBN 978-1585622795. [Google Scholar]
  4. Hedner, T.; Abouzeedan, A.; Klofsten, M. Entrepreneurial resilience. Ann. Innov. Entrep. 2011, 2, 7986. [Google Scholar] [CrossRef]
  5. Masten, A.S. Resilience in Individual Development: Successful Adaptation Despite Risk and Adversity. In Risk and Resilience in Inner City America: Challenges and Prospects; Wang, M., Gordon, E., Eds.; Lawrence Erlbaum Associated: Hillsdale, NJ, USA, 1994; pp. 3–27. ISBN 978-0805813258. [Google Scholar]
  6. Bigos, M.; Qaran, W.; Fenger, M.; Koster, F.; Mascini, P.; van der Veen, R. Review Essay on Labour Market Resilience. Available online: https://www.researchgate.net/profile/Menno_Fenger/publication/258568715_Review_Essay_on_Labour_Market_Resilience/links/00b49528b2fe842f5e000000/Review-Essay-on-Labour-Market-Resilience.pdf (accessed on 21 May 2018).
  7. Holling, C.S. Resilience and stability of ecological systems. Ann. Rev. Ecol. Syst. 1973, 4, 1–23. [Google Scholar] [CrossRef]
  8. Martin-Breen, P.; Anderies, J.M. Resilience: A Literature Review. Background Paper, Bellagio Initiative; IDS: Brighton, UK, 2011. [Google Scholar]
  9. Berkes, F.; Folke, C. Linking Sociological and Ecological Systems for Resilience and Sustainability. In Linking Sociological and Ecological Systems: Management Practices and Social Mechanisms for Building Resilience; Berkes, F., Folke, C., Eds.; Cambridge University Press: New York, NY, USA, 1998; pp. 1–25. ISBN 9780521785624. [Google Scholar]
  10. Simmie, J.; Martin, R.L. The economic resilience of regions: Towards an evolutionary approach. Camb. J. Reg. Econ. Soc. 2010, 3, 27–43. [Google Scholar] [CrossRef]
  11. Pendell, R.; Foster, K.A.; Cowell, M. Resilience and Regions: Building Understanding of the Metaphor. Camb. J. Reg. Econ. Soc. 2010, 3, 71–84. [Google Scholar] [CrossRef]
  12. Hassink, R. Regional Resilience: A promising Concept to Explain Differences in Regional Economic Adaptability? Camb. J. Reg. Econ. Soc. 2010, 3, 45–58. [Google Scholar] [CrossRef]
  13. Pike, A.; Dawley, S.; Tomaney, J. Resilience, Adaptation and Adaptability. Camb. J. Reg. Econ. Soc. 2010, 3, 59–70. [Google Scholar] [CrossRef]
  14. Probst, H.; Boylan, M.; Martin, R. Early Career Resilience: Interdisciplinary Insights to Support Professional Education of Radiation Therapists. J. Med. Imaging Radiat. Sci. 2014, 45, 390–398. [Google Scholar] [CrossRef]
  15. Johnson, B.; Down, B.; Le Cornu, R.; Peters, J.; Sullivan, A.; Pearce, J.; Hunter, J. Promoting early career teacher resilience: A framework for understanding and acting. Teach. Teach. 2014, 20, 530–546. [Google Scholar] [CrossRef]
  16. Kolar, C.; von Treuer, K.; Koh, C. Resilience in early-career psychologists. Aust. Psychol. 2017, 52, 198–208. [Google Scholar] [CrossRef]
  17. Johnson, B.; Down, B.; Le Cornu, R.; Peters, J.; Sullivan, A.; Pearce, J.; Hunter, J. Early Career Teachers. Stories of Resilience; Springer: Singapore, 2015; ISBN 978-981-287-173-2. [Google Scholar]
  18. Wang, L.; Tao, H.; Bowers, B.J.; Brown, R.; Zhang, Y. Influence of Social Support and Self-Efficacy on Resilience of Early Career Registered Nurses. West. J. Nurs. Res. 2018, 40, 648–664. [Google Scholar] [CrossRef] [PubMed]
  19. Mansfield, C.; Beltman, S.; Price, A. ‘I’m coming back again!’ The resilience process of early career teachers. Teach. Teach. 2014, 20, 547–567. [Google Scholar] [CrossRef]
  20. Strat, V.A.; Davidescu, A.A.M.; Grosu, R.M.; Zgură, I.D. Regional Development Fueled by Entrepreneurial Ventures Providing KIBS—Case Study on Romania. Amfiteatru Econ. 2016, 18, 55–72. [Google Scholar]
  21. Lévesque, M.; Minniti, M. The effect of aging on entrepreneurial behavior. J. Bus. Ventur. 2006, 21, 177–194. [Google Scholar] [CrossRef]
  22. Bosma, N.; Levie, J. Global Entrepreneurship Monitor 2009—Executive Report. Global Entrepreneurship Monitor. 2010. Available online: https://www.babson.edu/Academics/centers/blank-center/global-research/gem/Documents/gem-2009-global-report.pdf (accessed on 10 May 2018).
  23. Minola, T.; Criaco, G.; Cassia, L. Are youth really different? New beliefs for old practices in entrepreneurship. Int. J. Entrep. Innov. Manag. 2014, 18, 233–259. [Google Scholar] [CrossRef]
  24. Dvouletý, O.; Mühlböck, M.; Warmuth, J.; Kittel, B. ‘Scarred’ young entrepreneurs. Exploring young adults’ transition from former unemployment to self-employment. J. Youth Stud. 2018, 1–23. [Google Scholar] [CrossRef]
  25. Kautonen, T.; Luoto, S.; Tornikoski, E.T. Influence of work history on entrepreneurial intentions in ‘prime age’ and ‘third age’: A preliminary study. Int. Small Bus. J. 2010, 28, 583–601. [Google Scholar] [CrossRef]
  26. Schoof, U. Stimulating Youth Entrepreneurship: Barriers and Incentives to Enterprise Start-Ups by Young People; International Labour Office: Geneva, Switzerland, 2006; Available online: http://www.ilo.org/public/libdoc/ilo/2006/106B09_94_engl.pdf (accessed on 5 May 2018).
  27. Minola, T.; Giorgino, M. Who’s going to provide the funding for high tech start-ups? A model for the analysis of determinants with a fuzzy approach. R & D Manag. 2008, 38, 335–351. [Google Scholar] [CrossRef]
  28. Carmona, M.; Congregado, E.; Golpe, A.A.; Iglesias, J. Self-employment and Business Cycles: Searching for Asymmetries in a Panel of 23 OECD Countries. J. Bus. Econ. Manag. 2016, 17, 1155–1171. [Google Scholar] [CrossRef]
  29. Dvouletý, O. Does the Self-employment Policy Reduce Unemployment and Increase Employment? Empirical Evidence from the Czech Regions. Cent. Eur. J. Public Policy 2017, 11, 11–22. [Google Scholar] [CrossRef] [Green Version]
  30. Arulampalam, W.; Gregg, P.; Gregory, M. Introduction: Unemployment Scarring. Econ. J. 2001, 111, 577–584. [Google Scholar] [CrossRef]
  31. Eilam-Shamir, G.; Yaakobi, E. Effects of Early Employment Experiences on Anticipated Psychological Contracts. Pers. Rev. 2014, 43, 553–572. [Google Scholar] [CrossRef]
  32. Røed, K.; Skogstrøm, J.F. Job Loss and Entrepreneurship. Oxf. Bull. Econ. Stat. 2014, 76, 727–744. [Google Scholar] [CrossRef]
  33. Wennberg, K.; Pathak, S.; Autio, E. How Culture Moulds the Effects of Self-efficacy and Fear of Failure on Entrepreneurship. Entrep. Reg. Dev. 2013, 25, 756–780. [Google Scholar] [CrossRef]
  34. Aldrich, H.E.; Martinez, M.A. Many are called, but few are chosen: An evolutionary perspective for the study of entrepreneurship. Entrep. Theory Pract. 2001, 25, 41–56. [Google Scholar] [CrossRef]
  35. Maer Matei, M.M.; Lungu, E. What determines you to be an entrepreneur? SEA–Pract. Appl. Sci. 2014, 2, 310–318. [Google Scholar]
  36. Sheffi, Y. The Resilient Enterprise: Overcoming Vulnerability for Competitive Enterprise; MIT Press: Cambridge, MA, USA, 2005; ISBN 9780262195379. [Google Scholar]
  37. Fiksel, J. Sustainability and resilience: Toward a systems approach. Sustain. Sci. Pract. Policy 2006, 2, 14–21. [Google Scholar] [CrossRef]
  38. Bernard, M.-J.; Barbosa, S.D. Resilience and entrepreneurship: A dynamic and biographical approach to the entrepreneurial act. Management 2016, 19, 89–121. [Google Scholar]
  39. Ayala, J.-C.; Manzano, G. The resilience of the entrepreneur. Influence on the success of the business. A longitudinal analysis. J. Econ. Psychol. 2014, 42, 126–135. [Google Scholar] [CrossRef]
  40. Bullough, A.; Renko, M.; Myatt, T. Danger zone entrepreneurs: The importance of resilience and self-efficacy for entrepreneurial intentions. Entrep. Theory Pract. 2014, 38, 473–499. [Google Scholar] [CrossRef]
  41. McInnis-Bowers, C.; Parris, D.L.; Galperin, B.L. Which came first, the chicken or the egg? Exploring the relationship between entrepreneurship and resilience among the Boruca Indians of Costa Rica. JEC 2017, 11, 39–60. [Google Scholar] [CrossRef]
  42. Liao, J. Entrepreneurial Failures: Key Challenges and Future Directions. In Entrepreneurship: The Way Ahead; Welsch, H.P., Ed.; Routledge: London, UK, 2004; pp. 133–150. ISBN 0-415-32394-0. [Google Scholar]
  43. Corner, P.D.; Singh, S.; Pavlovich, K. Entrepreneurial resilience and venture failure. ISBJ 2017, 35, 687–708. [Google Scholar] [CrossRef]
  44. Cope, J. Entrepreneurial learning from failure: An interpretive phenomenological analysis. J. Bus. Ventur. 2011, 26, 604–623. [Google Scholar] [CrossRef] [Green Version]
  45. DeTienne, D.R.; McKelvie, A.; Chandler, G.N. Making sense of entrepreneurial exit strategies: A typology and test. J. Bus. Ventur. 2015, 30, 255–272. [Google Scholar] [CrossRef]
  46. De Tienne, D.R.; Wennberg, K. Studying exit from entrepreneurship: New directions and insights. ISBJ 2016, 34, 151–156. [Google Scholar] [CrossRef] [Green Version]
  47. Bates, T. Analysis of young, small firms that have closed: Delineating successful from unsuccessful closures. J. Bus. Ventur. 2005, 20, 343–358. [Google Scholar] [CrossRef]
  48. Headd, B. Redefining business success: Distinguishing between closure and failure. Small Bus. Econ. 2003, 21, 51–61. [Google Scholar] [CrossRef]
  49. Coad, A. Death is not a success: Reflections on business exit. ISBJ 2014, 32, 721–732. [Google Scholar] [CrossRef]
  50. Cefis, E.; Marsili, O. Survivor: The role of innovation in firms’ survival. Res. Policy 2006, 35, 626–641. [Google Scholar] [CrossRef] [Green Version]
  51. Coad, A.; Frankish, J.; Roberts, R. Growth paths and survival chances: An application of gambler’s ruin theory. J. Bus. Ventur. 2013, 28, 615–632. [Google Scholar] [CrossRef]
  52. Larsson, M.; Milestad, R.; Hahn, T.; von Oelreich, J. The Resilience of a Sustainability Entrepreneur in the Swedish Food System. Sustainability 2016, 8, 550. [Google Scholar] [CrossRef]
  53. Korber, S.; McNaughton, R.B. Resilience and entrepreneurship: A systematic literature review. Int. J. Entrep. Behav. Res. 2017. [Google Scholar] [CrossRef]
  54. Afshar Jahanshahi, A.; Brem, A.; Shahabinezhad, M. Does Thinking Style Make a Difference in Environmental Perception and Orientation? Evidence from Entrepreneurs in Post-Sanction Iran. Sustainability 2018, 10, 1546. [Google Scholar] [CrossRef]
  55. Ghența, M.; Matei, A. SMEs and the Circular Economy: From Policy to Difficulties Encountered During Implementation. Amfiteatru Econ. 2018, 20, 294–309. [Google Scholar] [CrossRef]
  56. Davidson, R.J. Affective style, psychopathology and resilience: Brain mechanisms and plasticity. Am. Psychol. 2000, 55, 1196–1214. [Google Scholar] [CrossRef] [PubMed]
  57. Leadbeater, B.; Dodgen, D.; Solarz, A. The Resilience Revolution: A Paradigm Shift for Research and Policy. In Resilience in Children, Families, and Communities: Linking Context to Practice and Policy; Peters, R.D., Leadbeater, B., McMahon, R.J., Eds.; Kluwer: New York, NY, USA, 2005; pp. 47–61. ISBN 978-0-306-48655-5. [Google Scholar]
  58. Pollack, J.M.; Vanepps, E.M.; Hayes, A.F. The moderating role of social ties on entrepreneurs’ depressed affect and withdrawal intentions in response to economic stress. J. Organ. Behav. 2012, 33, 789–810. [Google Scholar] [CrossRef]
  59. Bullougha, A.; Renko, M. Entrepreneurial resilience during challenging times. Bus. Horiz. 2013, 56, 343–350. [Google Scholar] [CrossRef]
  60. Baum, J.R.; Frese, M.; Baron, R.A. The Psychology of Entrepreneurship; Taylor & Francis Group: New York, NY, USA, 2007; ISBN 9780805850628. [Google Scholar]
  61. Al Mamun, A.; Ibrahim, M.D.; Yusoff, M.N.; Fazal, S.A. Entrepreneurial Leadership, Performance, and Sustainability of Micro-Enterprises in Malaysia. Sustainability 2018, 10, 1591. [Google Scholar] [CrossRef]
  62. Yang, Y.; Danes, S.M. Resiliency and resilience process of entrepreneurs in new venture creation. Entrep. Res. J. 2015, 5, 1–30. [Google Scholar] [CrossRef]
  63. Windapo, A. Entrepreneurial Factors Affecting the Sustainable Growth and Success of a South African Construction Company. Sustainability 2018, 10, 1276. [Google Scholar] [CrossRef]
  64. Duchek, S. Entrepreneurial resilience: A biographical analysis of successful entrepreneurs. Int. Entrep. Manag. J. 2018, 14, 429–455. [Google Scholar] [CrossRef]
  65. Bates, T. Entrepreneur human capital inputs and small business longevity. Rev. Econ. Stat. 1990, 72, 551–559. [Google Scholar] [CrossRef]
  66. Wennberg, K.; Wiklund, J.; Detienne, D.R. Reconceptualizing entrepreneurial exit: Divergent exit routes and their drivers. J. Bus. Ventur. 2010, 25, 361–375. [Google Scholar] [CrossRef]
  67. Oosterbeek, H.; Van Praag, M.; Ijsselstein, A. The impact of entrepreneurship education on entrepreneurship skills and motivation. Eur. Econ. Rev. 2010, 54, 442–454. [Google Scholar] [CrossRef]
  68. Hussain, A.; Hashim, N. Impact of Entrepreneurial Education on Entrepreneurial Intentions of Pakistani Students. J. Entrep. Bus. Innov. 2015, 2, 43–53. [Google Scholar] [CrossRef]
  69. Pirciog, S.; Ciuca, V.; Popescu, M.E. The Net Impact of Training Measures from Active Labour Market Programs in Romania—Subjective and Objective Evaluation. Procedia Econ. Financ. 2015, 26, 339–344. [Google Scholar] [CrossRef]
  70. Cohen, W.M.; Levinthal, D.A. Absorptive capacity: A new perspective on learning and innovation. ASQ 1990, 35, 128–152. [Google Scholar] [CrossRef]
  71. Acs, Z.J. Entrepreneurship and economic development: The valley of backwardness. Ann. Innov. Entrep. 2010, 1, 5641. [Google Scholar] [CrossRef]
  72. Bulmash, B. Entrepreneurial Resilience: Locus of Control and Well-being of Entrepreneurs. J. Entrep. Organ. Manag. 2016, 5, 171. [Google Scholar] [CrossRef]
  73. Markman, G.D.; Baron, R.A. Person-entrepreneurship fit: Why some people are more successful as entrepreneurs than others. HRMR 2003, 13, 281–301. [Google Scholar] [CrossRef]
  74. Popescu, G.H.; Sima, V.; Nica, E.; Gheorghe, I.G. Measuring Sustainable Competitiveness in Contemporary Economies—Insights from European Economy. Sustainability 2017, 9, 1230. [Google Scholar] [CrossRef]
  75. Cohen, B.; Winn, M. Market Imperfections, Opportunity and Sustainable Entrepreneurship. J. Bus. Ventur. 2007, 22, 29–49. [Google Scholar] [CrossRef]
  76. Block, J.; Sandner, P. Necessity and Opportunity Entrepreneurs and Their Duration in Self-employment: Evidence from German Micro Data. J. Ind. Compet. Trade 2009, 9, 117–137. [Google Scholar] [CrossRef] [Green Version]
  77. Cox, D.R. Regression Models and Life-Tables. J. R. Stat. Soc. 1972, 34, 187–220. [Google Scholar]
  78. Margolis, D.N. By choice and by necessity: Entrepreneurship and self-employment in the developing world. Eur. J. Dev. Res. 2014, 26, 419–436. [Google Scholar] [CrossRef]
  79. Block, J.H.; Kohn, K.; Miller, D.; Ullrich, K. Necessity entrepreneurship and competitive strategy. Small Bus. Econ. 2015, 44, 37–54. [Google Scholar] [CrossRef]
  80. Avram, S.; Militaru, E. Interactions between policy effects, population characteristics and the tax-benefit system: An illustration using child poverty and child related policies in Romania and the Czech Republic. Soc. Indic. Res. 2016, 128, 1365–1385. [Google Scholar] [CrossRef] [PubMed]
Figure 1. Incidence of self-employment at first job and at current job, by country (% of total number of graduates).
Sustainability 10 02594 g001
Figure 2. Incidence of remaining in self-employment and incidence of returning to self-employment, by country (% of graduates reporting self-employment at first job).
Sustainability 10 02594 g002
Figure 3. Retention in self-employment (months), by country.
Sustainability 10 02594 g003
Figure 4. Retention in self-employment (months), by field of education.
Sustainability 10 02594 g004
Table 1. List of independent variables.
Personal CharacteristicsEducation BackgroundBusiness EnvironmentEducation-Job Match
-
Country
-
Social networks
-
Gender
-
Age
-
Father’s level of education
-
Professional values
-
Field of education
-
Part-time/Full time student
-
Characteristics of study program
-
Methods of teaching and learning
-
Economic sector
-
Perceived competition on the labor market
-
Market driven by quality/Market driven by quantity
-
Perceived stability of the market
-
Job searching behavior
-
Perceived under-education
-
Need for more knowledge and skills
-
Use of study programs for entrepreneurial skills
Table 2. Transitions in between first job after graduation and current job (% of total number of graduates).
Current Job (Moment of the Survey)Total
Self-EmployedOther Occ. StatusNo Paid WorkNo Answer
First job after graduationSelf-employed64.027.37.51.3100.0
Other occupational status5.884.78.11.3100.0
Had paid work before graduation14.884.7 0.5100.0
No paid work 0.22.195.22.4100.0
No answer6.750.19.034.2100.0
Table 3. Model estimation results of Logistic regression: dependent variable M1 = self-employed at first job (Method: Backward Stepwise Wald).
VariablesM1
EstimateS.E.Sig.Exp (B)
Country (Estonia—reference)
Italy1.1200.1790.0003.066
Spain0.7260.1850.0002.066
France0.2190.2190.3171.245
Austria0.8620.1880.0002.367
Germany0.5530.1940.0041.738
Netherlands0.2150.1860.2481.240
United Kingdom−0.1460.2270.5200.864
Finland−0.3680.2040.0710.692
Norway−0.5270.2220.0180.590
Czech Republic1.3670.1710.0003.925
Portugal0.7370.2210.0012.089
Belgium 1.2430.1920.0003.467
Field of study (Education—reference)
Humanities and arts0.4840.0960.0001.623
Social sciences, Business and Law−0.1470.0850.0830.863
Science. Mathematics, Computing−0.5570.1240.0000.573
Engineering, Manufacturing, Construction−0.0690.0990.4880.934
Agriculture and Veterinary0.3200.1470.0291.377
Health and Welfare−0.0850.1000.3960.919
Services0.0880.1650.5931.092
Situation in the last 1–2 years of study (Part-time student—reference)
Full-time student−0.1410.0610.0200.868
Description of study program (not perceived as such—reference)
Study program demanding0.1580.0510.0021.172
Methods of teaching and learning (Low extent of project/problem-based learning—reference)
Project/problem-based learning0.2080.0560.0001.231
Job searching behavior (not looking for work—reference)
Looking for work−0.5150.0530.0000.597
Economic sector (any other—reference)
Primary sector1.5100.1740.0004.528
Secondary sector0.6230.1120.0001.865
Tertiary sector1.0250.0890.0002.787
Job needing initial training period (any other—reference)
Need of training courses−0.2300.0720.0020.795
Need of informal learning−0.2190.0560.0000.804
Under-education at first job (not mentioned—reference)
Perceived under-education relative to study program0.2500.0830.0031.283
Need for more knowledge and skills compared with what the individual posses0.2810.0530.0001.324
Usefulness of social network (not or low usefulness—reference)
Very useful 0.3810.0500.0001.464
Economic context (not mentioned—reference)
Very strong competition in the field 0.3890.0530.0001.476
Competition driven mainly by quality0.1860.0510.0001.204
Highly stable market−0.1650.0540.0020.848
Study program useful for development of entrepreneurial skills (not or low extent—reference)
Study program good basis for entrepreneurial skills −0.2790.0600.0000.757
Job characteristics valued by respondents (no or low importance—reference)
Work autonomy0.2190.0710.0021.245
Opportunity to learn new things −0.3260.0730.0000.722
Gender (female—reference)
Male0.1590.0520.0021.173
Age0.0380.0050.0001.039
Family background (father with upmost medium education—reference)
Father with high education0.1370.0550.0131.147
Constant−5.3050.2750.0000.005
Note: Total number of observations included in the model = 29,459; Model fit summary: Nagelkerke pseudo-R2 = 0.118, Cox & Snell pseudo-R2 = 0.047, −2 log-likelihood = 13,424.043, % correct = 93.1.
Table 4. Model estimation results of Logistic regression: dependent variable M2 = remaining self-employed in current job (Method: Backward Stepwise Wald) Variables.
M2
EstimateS.E.Sig.Exp (B)
Country (Estonia—reference)
Italy1.3050.3590.0003.687
Spain0.1370.3590.7031.146
France0.9150.4480.0412.497
Austria0.0790.3670.8291.082
Germany0.2030.3810.5951.225
Netherlands0.1800.3710.6281.197
United Kingdom−0.2000.4540.6590.819
Finland0.3330.4070.4131.396
Norway0.2140.4430.6301.238
Czech Republic0.5130.3350.1261.670
Portugal−0.2680.4350.5370.765
Belgium 0.6250.3790.0991.869
Description of study program (not perceived as such—reference)
Study program demanding0.2010.0990.0421.222
Economic sector (any other—reference)
Primary sector0.4770.2800.0881.611
Under-education at first job (not mentioned—reference)
Perceived under-education relative to study program0.5100.1730.0031.666
Need for more knowledge and skills compared with what the individual posses0.2310.1050.0281.260
Economic context (not mentioned—reference)
Very strong competition in the field 0.4770.1010.0001.611
Competition driven mainly by quality0.3690.1030.0001.447
Highly stable market−0.2170.1080.0440.805
Job characteristics valued by respondents (no or low importance—reference)
Work autonomy0.2560.1450.0791.291
Opportunity to learn new things −0.3510.1610.0290.704
New challenges−0.2870.1270.0240.751
Gender (female—reference)
Male0.3470.0970.0001.414
Age0.0520.0100.0001.054
Constant−2.2070.4920.0000.110
Note: Total number of observations included in the model = 2040, Model fit summary: Nagelkerke pseudo-R2 = 0.136, Cox & Snell pseudo-R2 = 0.101, −2 log-likelihood = 2539.139, % correct = 64.7.
Table 5. Model estimation results of Logistic regression: dependent variable M3 = returning to self-employment after leaving the first job (Method: Backward Stepwise Wald).
VariablesM3
EstimateS.E.Sig.Exp (B)
Field of study (Education—reference)
Humanities and arts−0.5750.2900.0480.563
Social sciences, Business and Law−0.7670.2610.0030.464
Science. Mathematics, Computing−1.0200.3950.0100.361
Engineering, Manufacturing, Construction−0.3250.2860.2560.723
Agriculture and Veterinary−0.7110.4480.1120.491
Health and Welfare0.1290.2950.6611.138
Services0.7770.4880.1112.175
Description of study program (not perceived as such—reference)
Study program academically prestigious0.3300.1630.0431.391
Methods of teaching and learning (Low extent of project/problem-based learning—reference)
Participation to research projects0.3500.1570.0261.420
Usefulness of social network (not or low usefulness—reference)
Very useful 0.2850.1580.0721.330
Economic context (not mentioned—reference)
Very strong competition in the field 0.8280.1650.0002.288
Competition driven mainly by quality0.3950.1640.0161.484
Study program useful for development of entrepreneurial skills (not or low extent—reference)
Study program good basis for entrepreneurial skills −0.5270.1910.0060.590
Gender (female—reference)
Male0.4000.1700.0191.492
Constant−0.9270.2980.0020.396
Note: Total number of observations included in the model = 828, Model fit summary: Nagelkerke pseudo-R2 = 0.151, Cox & Snell pseudo-R2 = 0.110, −2 log-likelihood = 985.615, % correct = 67.1.
Table 6. Model estimation results of Cox regression: dependent variable = retention in self-employment at first job, (Method Backward Stepwise Wald).
Variables Model 4
EstimateS.E.Sig.Exp (B)
Country (Estonia—reference)
Italy−1.0530.3460.0020.349
Spain−0.1980.3240.5420.821
France−1.1060.4860.0230.331
Austria−0.5880.3530.0960.555
Germany−0.2860.3690.4390.752
Netherlands−0.3880.3460.2630.678
United Kingdom0.2670.4050.5101.306
Finland−0.2250.3990.5730.799
Norway−0.1880.3940.6340.829
Czech Republic−0.9410.3210.0030.390
Portugal−0.4280.3940.2770.652
Belgium −0.7960.3470.0220.451
Grades during study time (average and below—reference)
Grades higher than the average−0.1930.1080.0750.825
Situation in the last 1–2 years of study (Part-time student—reference)
Full-time student0.6430.1520.0001.902
Methods of teaching and learning used: research projects (Low extent—reference)
Participation to research projects (high extent)−0.1120.0550.0430.894
Under-education at first job (not mentioned—reference)
Perceived under-education relative to study program−0.4150.2300.0710.660
Need for more knowledge and skills compared with what the individual posses−0.2010.0450.0000.818
Study program useful for development of entrepreneurial skills (not or low extent—reference)
Study program good basis for entrepreneurial skills −0.1230.0460.0070.884
Economic sector (any other—reference)
Secondary sector0.3920.2170.0711.480
Tertiary sector0.3340.1720.0521.397
Usefulness of social networkfor setting up own business (not or low usefulness—reference)
Very useful −0.0710.0400.0730.931
Job characteristics valued (no or low importance—reference)
Opportunity to learn new things (high importance)0.1810.0880.0401.198
New challenges (high importance)0.1610.0740.0301.174
Gender (male—reference)
Female0.2720.1090.0131.313
Age−0.0550.0140.0000.946
Note: Total number of observations included in the model = 1263, Number of events = 379, Model fit summary: Model Chi2 = 146.361, Model Chi2 (sig) = 0.000, Degree of freedom = 25.

