An Integrated Sustainable Supplier Selection Approach Based on Hybrid Information Aggregation


Abstract
1. Introduction
2. Literature Review
2.1. SSCM and Supplier Selection
2.2. Sustainable Supplier Selection Criteria
2.3. The Measures
2.4. Supplier Selection Methods
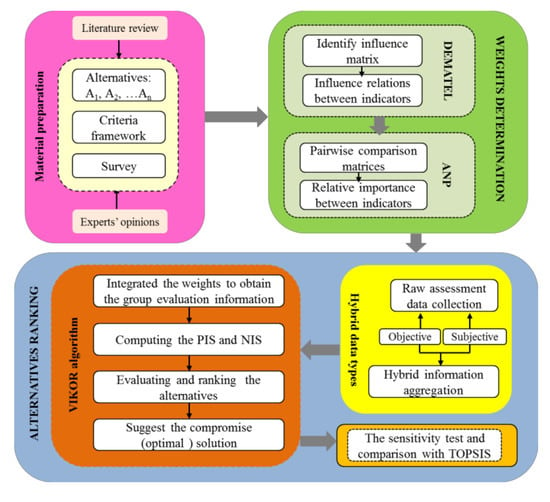
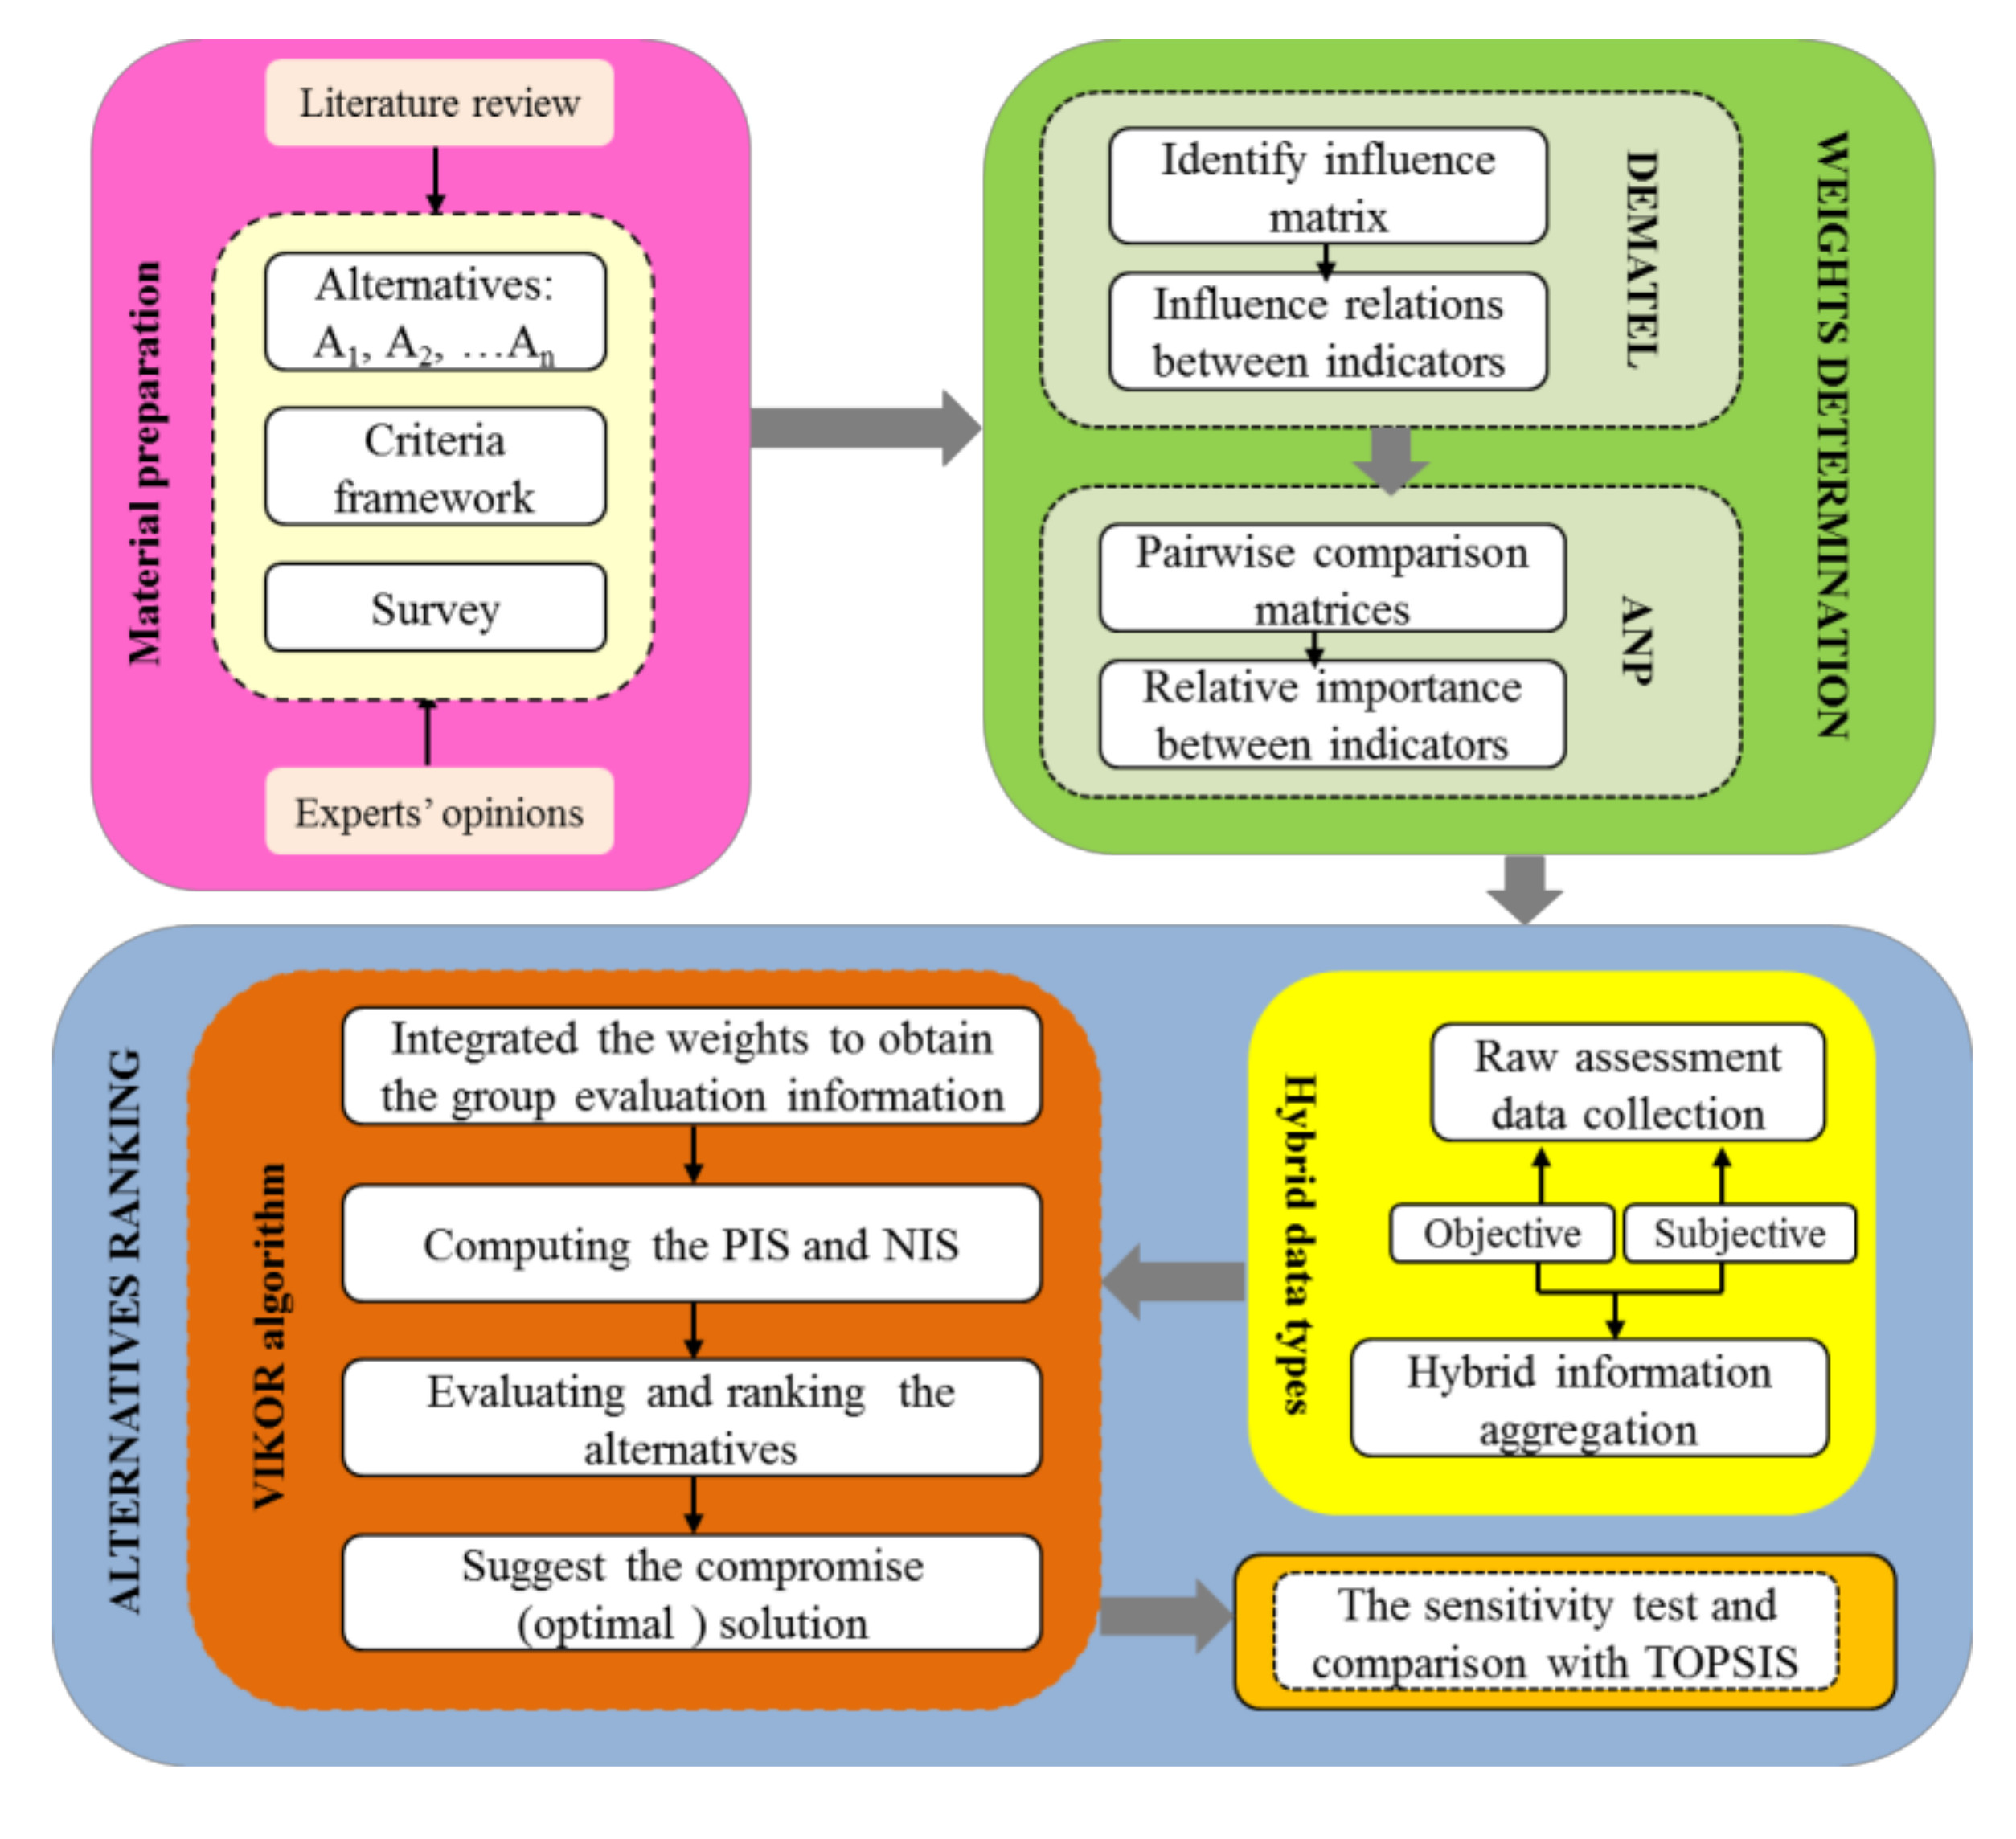
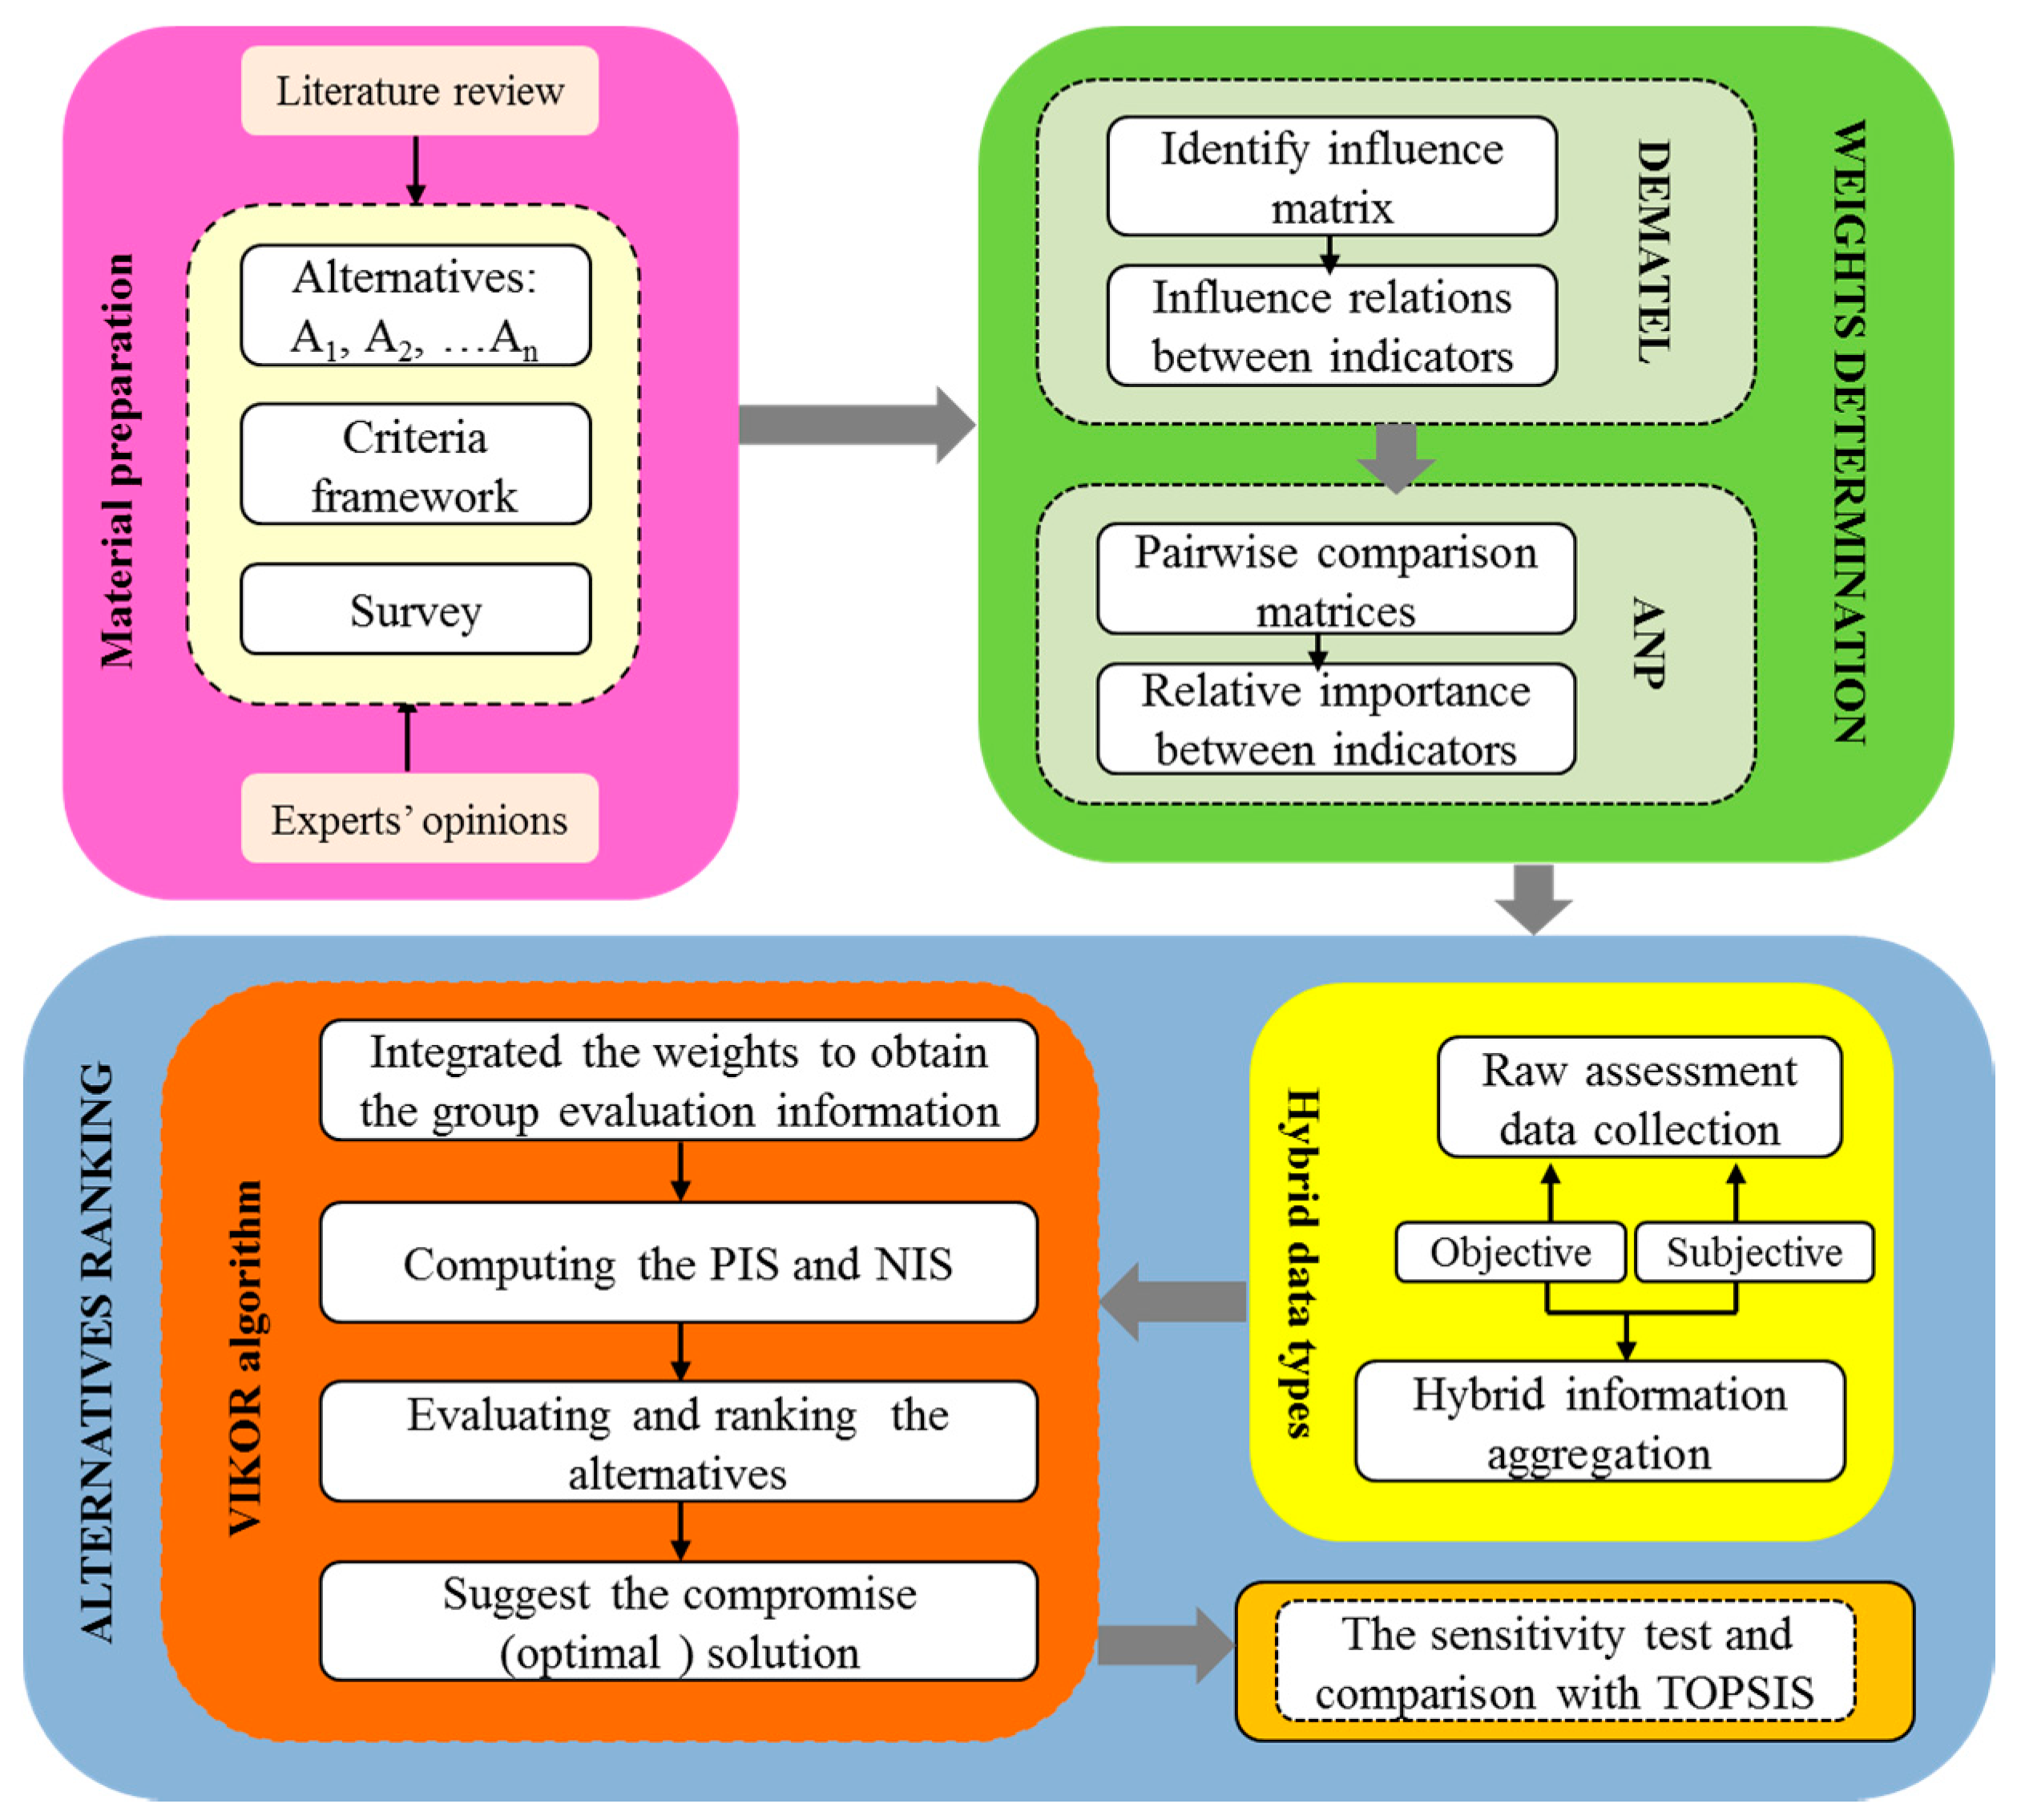
3. Methodology
3.1. DEMATEL-ANP-VIKOR
3.1.1. Combining the DEMATEL and ANP to Obtain Criteria Weights
- Step 1: Calculating the initial average matrix through expert marks. Given the integer scale from 0 to 4 (“No impact (0)”, “Low impact (1)”, “Moderate impact (2)”, “High impact (3)”, and “Super-high impact (4)”, respectively), inviting experts to answer the direct effects that they think criterion i imposed on another criterion j, as indicated by . We can obtain an average matrix by any direct matrix set, of which factors in matrix A are the mean values integrated from the initial experts’ judgments.
- Step 2: Deriving the full direct/indirect impact matrix and normalizing the direct impact matrix D, as shown in Equation (1).
- Step 3: Obtaining the total impact matrix T through Equation (2); I represents the identity matrix.
- Step 4: Defining the sum of rows and sums of columns, respectively, as vectors R and C in the total impact matrix T via Equations (3)–(5), of which element can be denoted as , and
- Step 5: Generating a causal diagram of the primary index to identify the relationship between the primary indicators and their importance according to the value of center degree and cause degree .
- Step 6: Identifying the relationship between the primary indicators according to the DEMATEL method, setting the thresholds [162], and removing the indicators with a weaker impact, re-determining the incidence relation between the indicators, and drawing the influence relation diagram while combining it with the actual situation of the secondary indicators to map the ANP network structure.
- Step 7: Constructing judgment matrix W, assuming that in the network structure of ANP the indicators for the goal G in the control layer are indicated as while the element set in the network layer is indicated as , where elements are in . Regarding in the control layer as the indicator, and in as the sub-criteria, and comparing the degree of impact influenced by the other elements in , allows for the construction of the judgment matrix under the indicator . On this basis, the normalized feature vector can be calculated as the ordering vector of the network element. By repeating the above steps for , the following matrix can be obtained by Equation (6).
- Step 8: Contributing to pairwise comparisons. According to the structure of the judgment matrix W, the relative importance of the clusters and factors forming the ANP decision network is obtained through expert pairwise comparisons. The relative importance of the calculated factors is attained by comparing the results of the individual indicators [146].
- Step 9: Solving the unweighted super-matrix, the weighted super-matrix, and the limit super-matrix. By combining with the interactional ordering vector of all network layer elements to form a super-matrix under the control element and normalizing each column, we can then obtain the weight matrix E, which is composed of the ordering vectors. As is shown in Equation (7), represents the influence weight of element group i on group j under the criterion in the control layer. If these two factors have no impact on each other, then . The resulting weighted super-matrix, as shown in Equation (8), is the sum of the elements of each column equal to 1. Then, we make a stability process for the weighted super-matrix to calculate the limit relative ordering vector . If this limit is convergent and unique, then the column i is the ranking of the element i relative to the other elements in the network layer under the criterion, namely, the weight value of each element relative to the highest target.
3.1.2. Ranking Candidate Suppliers Using the VIKOR Technique
The Algorithm Principle of VIKOR and Comparison with TOPSIS
The Computational Procedure of VIKOR
- Step 1: Assembling and transforming the original quantitative data based on transaction records, market performances, and the qualitative information judged by the scorers, integrating the weights obtained through the DEMATEL-ANP method to get the group evaluation information, and further build a streamlined fuzzy evaluation matrix, as shown in Equations (9) and (10) for the weight.where represents the performance of under alternative , , . represents the weight of as determined by the DEMATEL-ANP method.
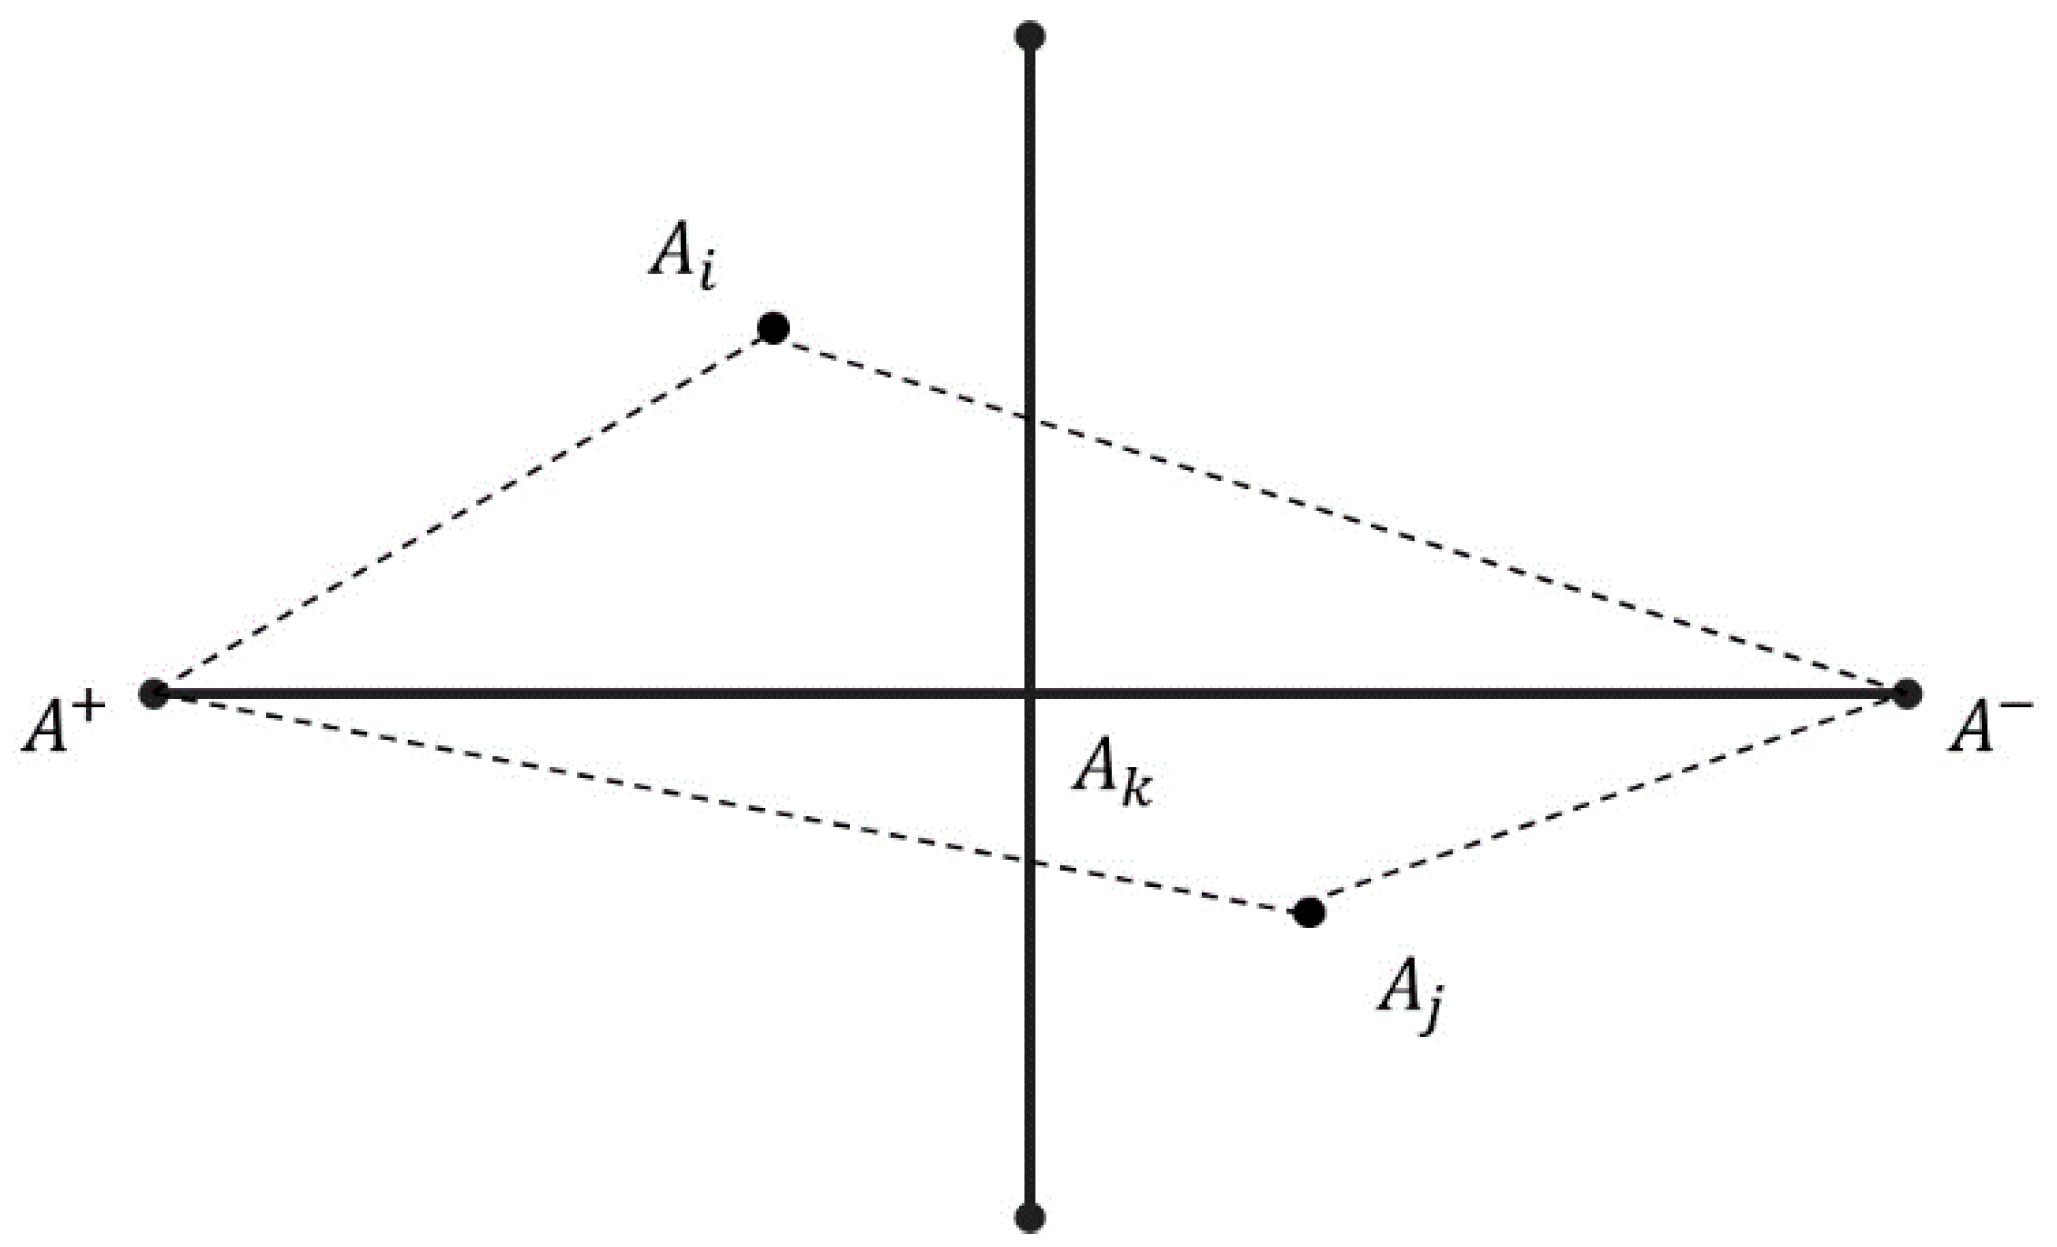
- Step 2: After determining the decision matrix, the PISs ( and ) and NIS () can be attained, as shown in Equations (11)–(13), where B represents the beneficial criteria and C represents the cost criteria.
- Step 3: Following Equations (14)–(17) to obtain the and values of the potential supplier, respectively:
- Step 4: Acquiring the corresponding basis of and through Equation (18):where .
- Step 5: Obtaining the ranks of the alternatives according to the value of , and respectively. Notably, the smaller the value is, the better the scheme may be.
- Step 6: After determining the sorting scheme, checking whether the compromise can be accepted. If the following two conditions are met, the compromise solution according to the value will be the best alternative.
- If Condition 2 is not met, the final set contains and ;
- If Condition 1 is not met, the final set contains , where the maximum value of L in is decided by .
3.2. Hybrid Data Type and Information Aggregation
3.2.1. Precise Number
3.2.2. Interval Number
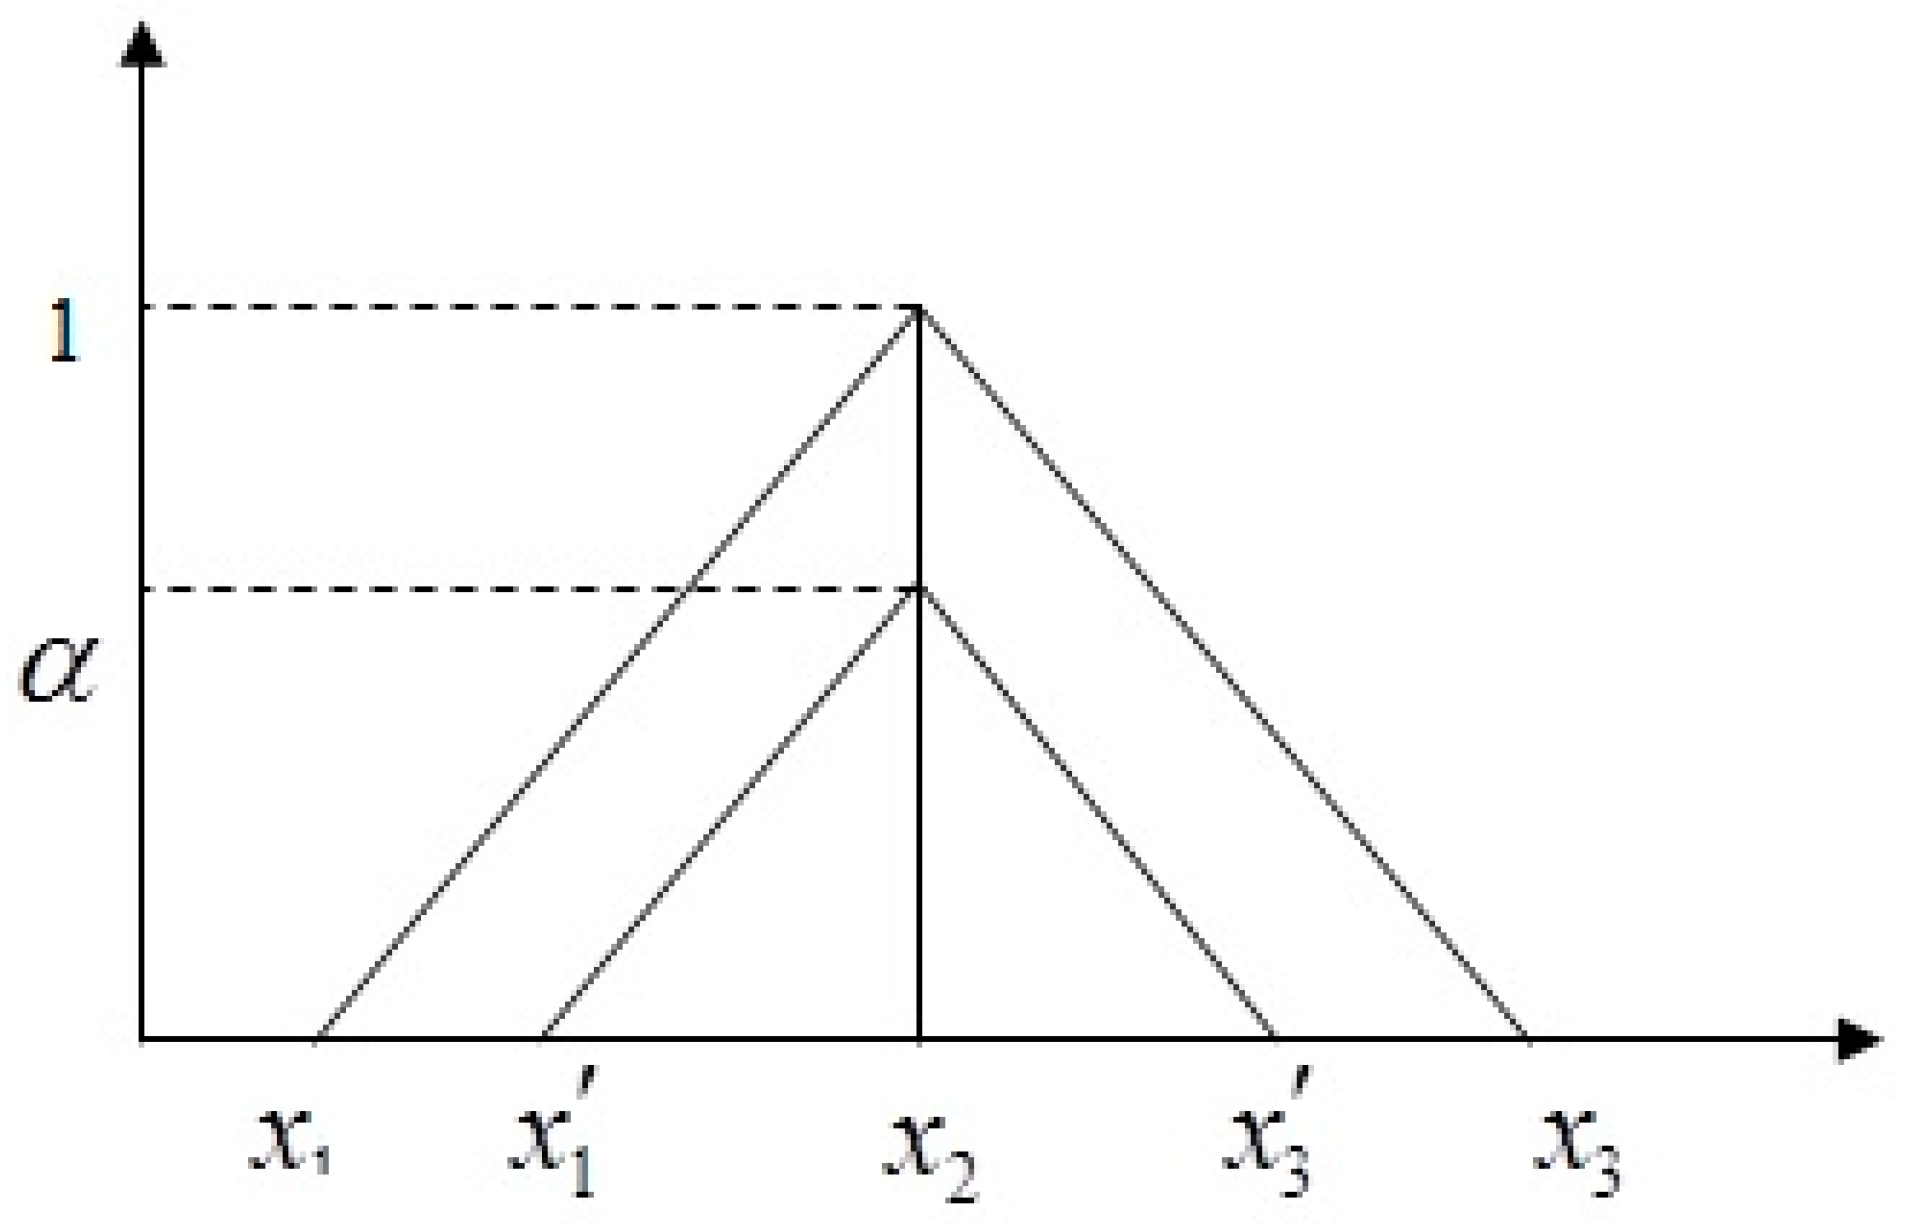
3.2.3. Interval-Valued Triangular Fuzzy Number
Definition and Graphic Demonstration
Arithmetic Operations
- (1)
- Addition:
- (2)
- Subtraction:
- (3)
- Multiplication:
- (4)
- Multiplication figure with IVTFNs:where k is an arbitrary positive real number.
- (5)
- Reciprocal value:
Distance Measure
Date Processing of Linguistic Variables
4. The Empirical Case of a Retail Enterprise
4.1. Background and Problem Descriptions
4.2. Data Collection
4.3. Identifying the Relationships between Dimensions and Criteria
4.4. Determining the Weights Using DEMATEL-ANP
- Step 1: Lining up a panel of 20 experts from the associations, enterprises, and researchers in the academy to judge and score the direct influence among the primary criteria applying the Delphi law, of which the indicator values were scored in accordance with the 0–4 scores. The 20 expert-scoring tables are gathered to calculate the arithmetic mean and are listed as a 7 × 7 direct-relation matrix A, as shown in Table 10.
- Step 2: Obtaining the normalized direct-relation matrix D through Equation (1), and then acquiring the comprehensive influence matrix T by Equation (2), as shown in Table 11.
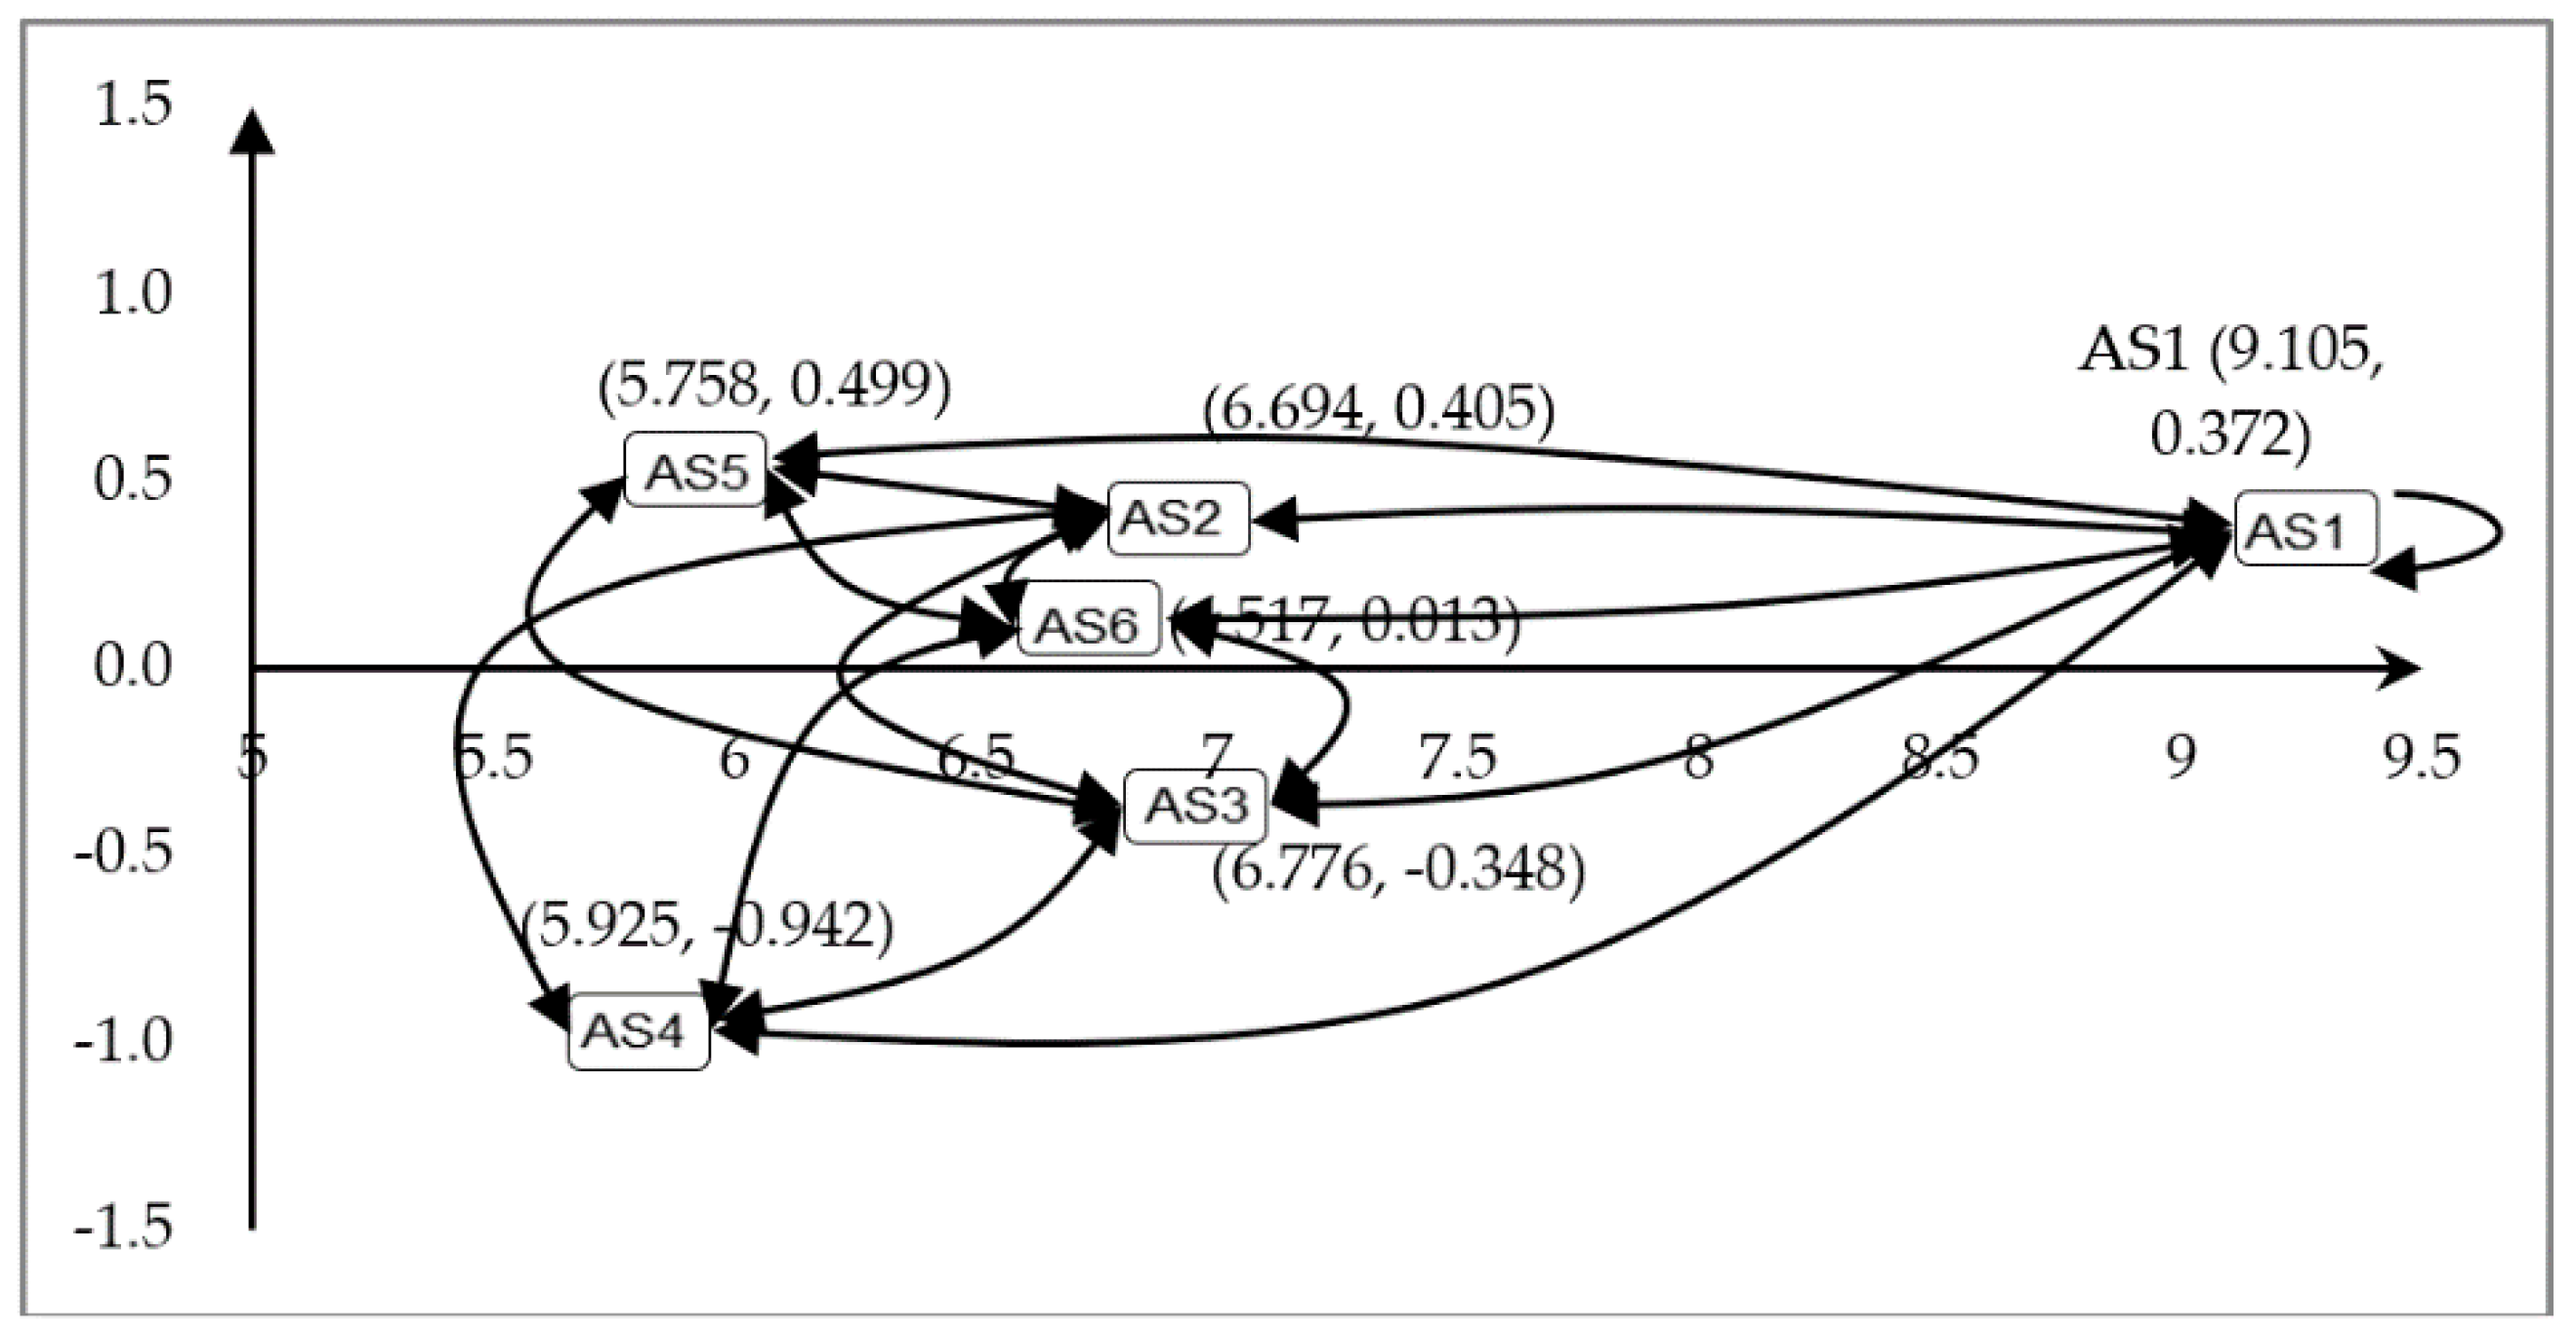
- Step 3: Constructing the causal map according to expert advice and repeated tests to get the threshold, which is equal to 0.55. If the value in the composite impact matrix is less than 0.55, it means that there is a clear correlation between the indicators, so the criteria with negligible relationships should be removed. Then, the influencing degree C, influenced degree R, the center degree , and the cause degree are calculated, as shown in Table 12. Finally, the causal map is drawn according to and , as shown in Figure 5, where the pointing arrow represents the degree of the impact exerted by other factors.
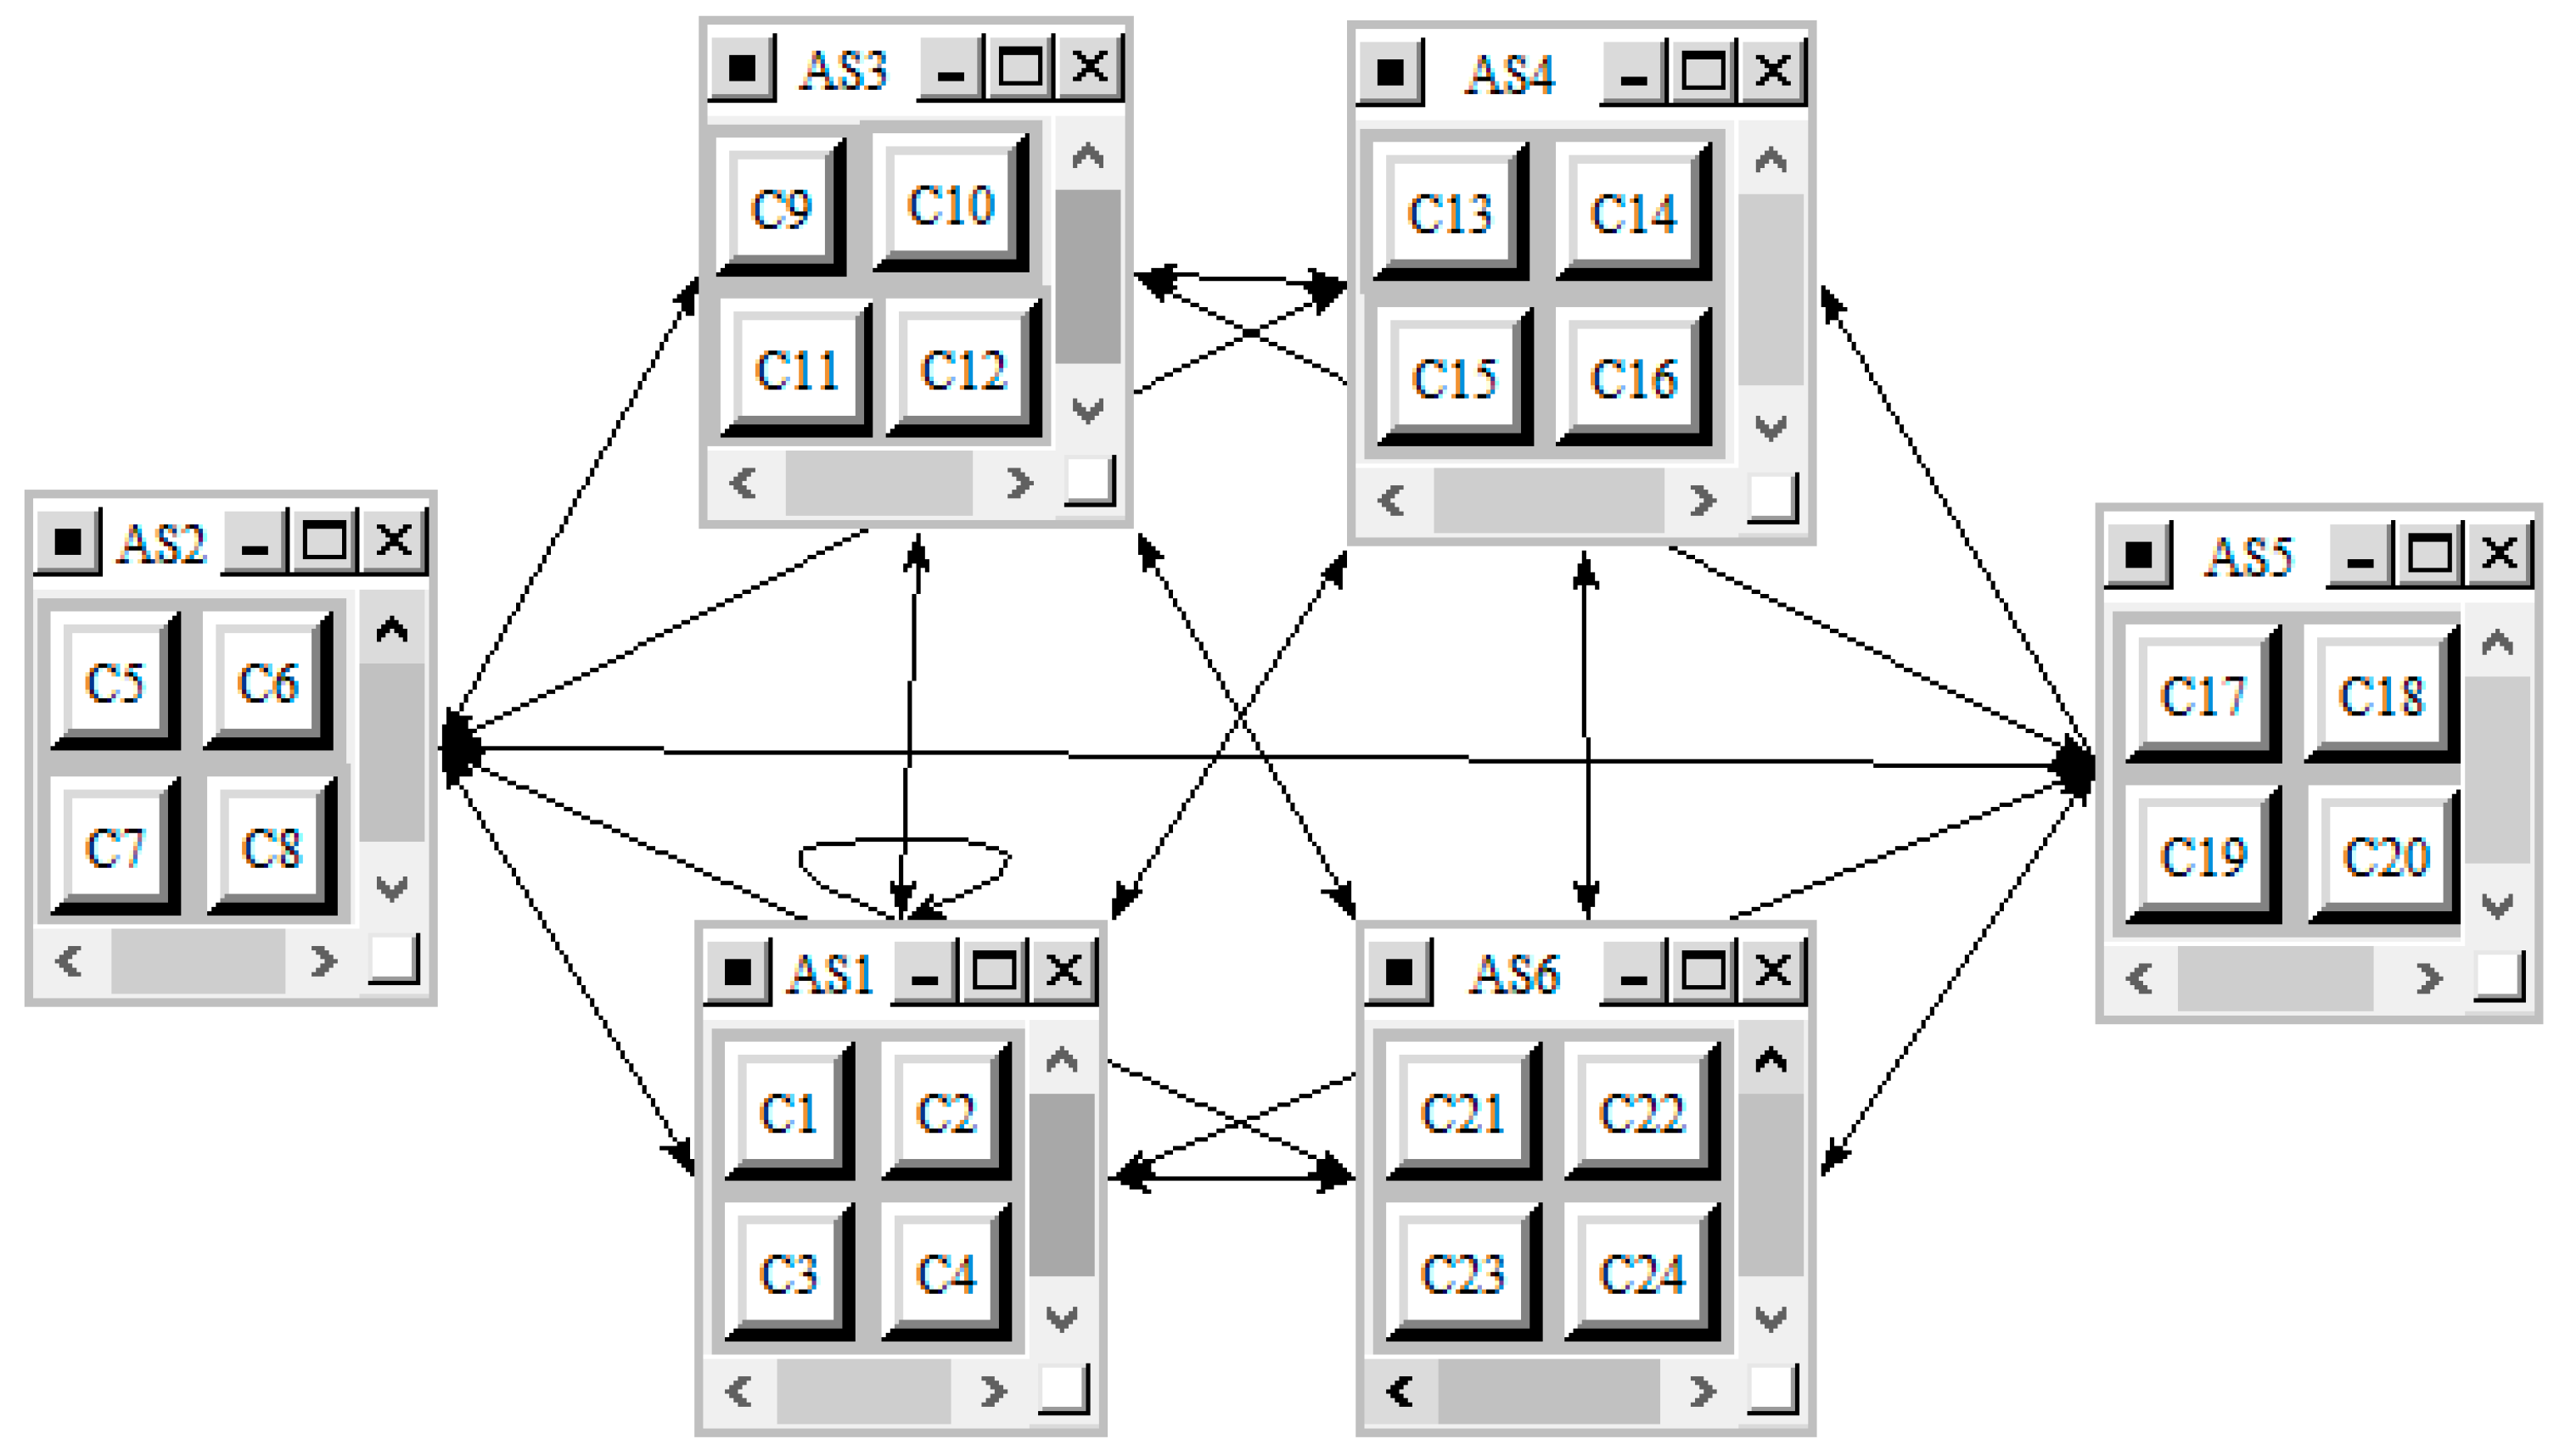
- Step 4: After determining the relationship between indicators through the DEMATEL, the ANP network of the sustainable suppliers’ decision would be constructed, as shown in Figure 6, where the arrow pointing represents the mutual interdependence and feedback among the criteria, as shown in Appendix D.
- Step 5: According to the causal relationship between the indicators, the judgment matrix of scale 1–9 is established, and then the unweighted super-matrix, weighted super-matrix, and limit super-matrix are obtained in succession. This paper considers the importance of the interplay of the 6 primary indicators and the 24 secondary indicators. Through the Super Decision software, the judgment matrix of the pairwise comparison in the manner of a questionnaire is inputted to compute and then perform the consistency test. Thereafter, choosing the factors to be judged in turn, the construction of the judgment matrix is repeated and its weight is determined. Finally, the unweighted super-matrix, weighted super-matrix, and limit super-matrix are established, as shown in the Appendix E, Appendix F and Appendix G.
- Step 6: Achieving the weight of the indicator. On the basis of the results of the limit super-matrix, the weight of the indicators of the alternatives can be obtained, as shown in Table 13.
4.5. Evaluating the Social Performance of Suppliers Using VIKOR
- Step 1: Normalizing the objective evaluation data. The numerical and interval data in Table 14 are normalized to eliminate the influence of the index dimension through Equations (18)–(20).
- Step 2: The semantic variables of the subjective evaluation information given by the scorers in Table 15 are transformed into the form of IVTFNs to construct the decision matrix. The evaluation information of the subjective and objective indicators is then aggregated to obtain a comprehensive evaluation matrix, as shown in Table 16.
- Step 3: According to the weight obtained by the DEMATEL-ANP method, the weighted interval triangular fuzzy matrix is constructed. Based on the above comprehensive evaluation matrix, the VIKOR method is used to choose the optimal alternative before the PISs ( and ) and NIS () are obtained through Equations (11)–(13).
- Step 4: The and of the potential sustainable suppliers are calculated through Equations (14)–(17), and then and are obtained. Further, we can acquire the cases of v by taking different parameters according to Equation (18), as shown in Table 17.
- Step 5: Ranked by , , and ; the smaller the value is, the better the corresponding alternative. Then, the appropriate target supplier is selected after the validity test. The priority order of the alternative sustainable suppliers is , given by the values, while the sustainable supplier has the smallest value. In order to determine whether the selected scheme satisfies Condition 1 and Condition 2 of the evaluation criteria, we can calculate , which is proved to meet the Condition 1, coupled with Condition 2 (that is also the optimal scheme ordered by and ). Furthermore, suppose the v value equates to 0, 0.5, and 1, respectively, the values corresponding to are still the smallest and, therefore, the supplier can be considered as the optimally sustainable supplier of the FX Supermarket based on the decision making process.
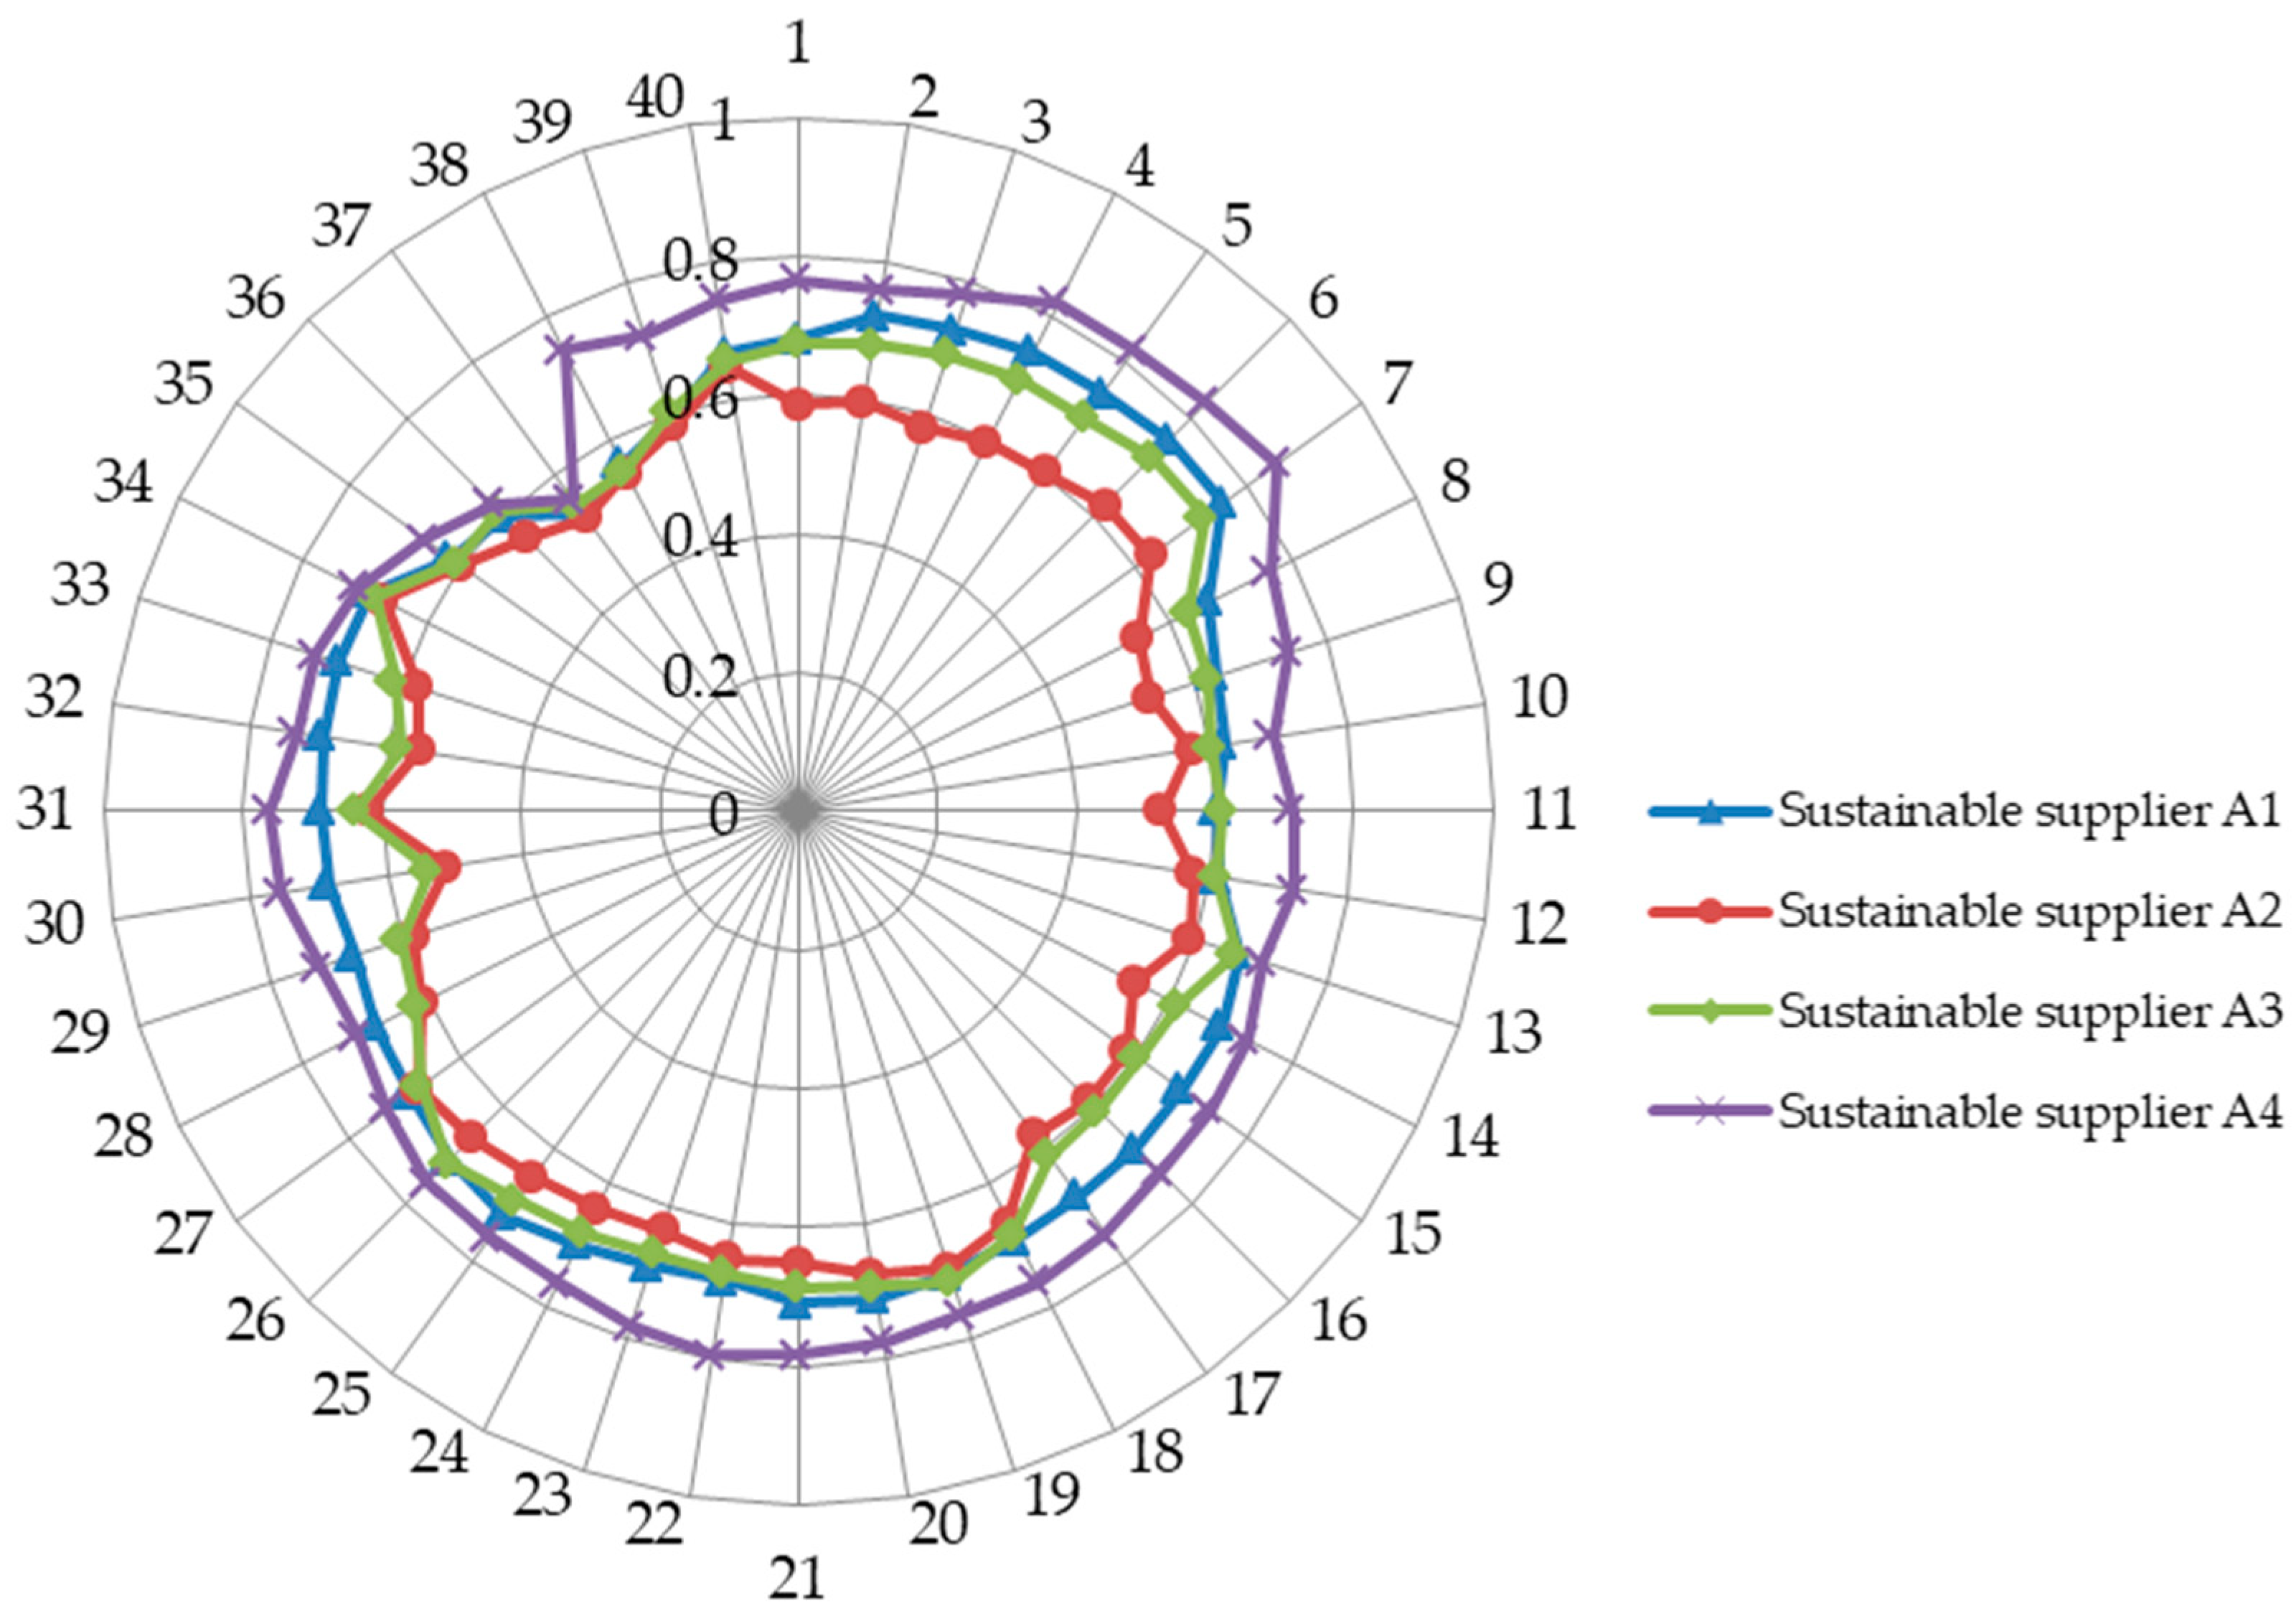
4.6. The Sensitivity Analysis
4.7. Comparative Study
5. Implications and Discussions
6. Conclusions and Future Research
Author Contributions
Funding
Acknowledgments
Conflicts of Interest
Appendix A
| Score | 0 | 1 | 2 | 3 | 4 |
| Impact | No Impact | Lower Impact | Moderate Impact | Higher Impact | Very higher Impact |
| AS1 | AS2 | AS3 | AS4 | AS5 | AS6 | |
| AS1 | 0 | 0 | ||||
| AS2 | 0 | 1 | ||||
| AS3 | 0 | 2 | ||||
| AS4 | 0 | 3 | ||||
| AS5 | 0 | 4 | ||||
| AS6 | 0 |
| AS1 | AS2 | AS3 | AS4 | AS5 | AS6 | |
| AS1 | 0 | |||||
| AS2 | 0 | |||||
| AS3 | 0 | |||||
| AS4 | 0 | |||||
| AS5 | 0 | |||||
| AS6 | 0 |
Appendix B

| Importance | Numerical Judgments |
|---|---|
| Elements i and j are equally important. | 1 |
| Element i is equally to more important than j. | 2 |
| Element i is more important than j. | 3 |
| Element i is equally to moderately more important than j. | 4 |
| Element i is moderately more important than j. | 5 |
| Element i is equally to strongly more important than j. | 6 |
| Element i is strongly more important than j. | 7 |
| Element i is equally to extremely more important than j. | 8 |
| Element i is extremely more important than j. | 9 |
| Source: Saaty (2000) |
| A | B | C | D | |
| A | 1 | 1 | ||
| B | 1 | 3 | ||
| C | 1 | 1/5 | ||
| D | 1 |
| AS1 | AS2 | AS3 | AS4 | AS5 | AS6 | |
| AS1 | 1 | |||||
| AS2 | 1 | |||||
| AS3 | 1 | |||||
| AS4 | 1 | |||||
| AS5 | 1 | |||||
| AS6 | 1 |
| AS1 | C1 | C2 | C3 | C4 |
| C1 | 1 | |||
| C2 | 1 | |||
| C3 | 1 | |||
| C4 | 1 |
| AS2 | C5 | C6 | C7 | C8 |
| C5 | 1 | |||
| C6 | 1 | |||
| C7 | 1 | |||
| C8 | 1 |
| AS3 | C9 | C10 | C11 | C12 |
| C9 | 1 | |||
| C10 | 1 | |||
| C11 | 1 | |||
| C12 | 1 |
| AS4 | C13 | C14 | C15 | C16 |
| C13 | 1 | |||
| C14 | 1 | |||
| C15 | 1 | |||
| C16 | 1 |
| AS5 | C17 | C18 | C19 | C20 |
| C17 | 1 | |||
| C18 | 1 | |||
| C19 | 1 | |||
| C20 | 1 |
| AS6 | C21 | C22 | C23 | C24 |
| C21 | 1 | |||
| C22 | 1 | |||
| C23 | 1 | |||
| C24 | 1 |
Appendix C. Questionnaire for Quantitative and Qualitative Criteria Ratings
| (USD/Box) | |
| Supplier 1 | [______, ______] |
| Supplier 2 | [______, ______] |
| Supplier 3 | [______, ______] |
| Supplier 4 | [______, ______] |
| (%) | |
| Supplier 1 | |
| Supplier 2 | |
| Supplier 3 | |
| Supplier 4 |
| (%) | |
| Supplier 1 | |
| Supplier 2 | |
| Supplier 3 | |
| Supplier 4 |
| (%) | |
| Supplier 1 | |
| Supplier 2 | |
| Supplier 3 | |
| Supplier 4 |
| (%) | |
| Supplier 1 | |
| Supplier 2 | |
| Supplier 3 | |
| Supplier 4 |
| Language Variables | VP | P | MP | F | MG | G | VG |
| Meaning | Very poor | Poor | Moderate poor | Fair | Moderately good | good | Very good |
| VP | P | MP | F | MG | G | VG | |
| Supplier 1 | |||||||
| Supplier 2 | |||||||
| Supplier 3 | |||||||
| Supplier 4 |
| VP | P | MP | F | MG | G | VG | |
| Supplier 1 | |||||||
| Supplier 2 | |||||||
| Supplier 3 | |||||||
| Supplier 4 |
| VP | P | MP | F | MG | G | VG | |
| Supplier 1 | |||||||
| Supplier 2 | |||||||
| Supplier 3 | |||||||
| Supplier 4 |
| VP | P | MP | F | MG | G | VG | |
| Supplier 1 | |||||||
| Supplier 2 | |||||||
| Supplier 3 | |||||||
| Supplier 4 |
| VP | P | MP | F | MG | G | VG | |
| Supplier 1 | |||||||
| Supplier 2 | |||||||
| Supplier 3 | |||||||
| Supplier 4 |
| VP | P | MP | F | MG | G | VG | |
| Supplier 1 | |||||||
| Supplier 2 | |||||||
| Supplier 3 | |||||||
| Supplier 4 |
| VP | P | MP | F | MG | G | VG | |
| Supplier 1 | |||||||
| Supplier 2 | |||||||
| Supplier 3 | |||||||
| Supplier 4 |
| VP | P | MP | F | MG | G | VG | |
| Supplier 1 | |||||||
| Supplier 2 | |||||||
| Supplier 3 | |||||||
| Supplier 4 |
| VP | P | MP | F | MG | G | VG | |
| Supplier 1 | |||||||
| Supplier 2 | |||||||
| Supplier 3 | |||||||
| Supplier 4 |
| VP | P | MP | F | MG | G | VG | |
| Supplier 1 | |||||||
| Supplier 2 | |||||||
| Supplier 3 | |||||||
| Supplier 4 |
| VP | P | MP | F | MG | G | VG | |
| Supplier 1 | |||||||
| Supplier 2 | |||||||
| Supplier 3 | |||||||
| Supplier 4 |
| VP | P | MP | F | MG | G | VG | |
| Supplier 1 | |||||||
| Supplier 2 | |||||||
| Supplier 3 | |||||||
| Supplier 4 |
| VP | P | MP | F | MG | G | VG | |
| Supplier 1 | |||||||
| Supplier 2 | |||||||
| Supplier 3 | |||||||
| Supplier 4 |
| VP | P | MP | F | MG | G | VG | |
| Supplier 1 | |||||||
| Supplier 2 | |||||||
| Supplier 3 | |||||||
| Supplier 4 |
| VP | P | MP | F | MG | G | VG | |
| Supplier 1 | |||||||
| Supplier 2 | |||||||
| Supplier 3 | |||||||
| Supplier 4 |
| VP | P | MP | F | MG | G | VG | |
| Supplier 1 | |||||||
| Supplier 2 | |||||||
| Supplier 3 | |||||||
| Supplier 4 |
| VP | P | MP | F | MG | G | VG | |
| Supplier 1 | |||||||
| Supplier 2 | |||||||
| Supplier 3 | |||||||
| Supplier 4 |
| VP | P | MP | F | MG | G | VG | |
| Supplier 1 | |||||||
| Supplier 2 | |||||||
| Supplier 3 | |||||||
| Supplier 4 |
| VP | P | MP | F | MG | G | VG | |
| Supplier 1 | |||||||
| Supplier 2 | |||||||
| Supplier 3 | |||||||
| Supplier 4 |
Appendix D

Appendix E
| AS1 | AS2 | AS3 | AS4 | AS5 | AS6 | ||||||||||||||||||||
|---|---|---|---|---|---|---|---|---|---|---|---|---|---|---|---|---|---|---|---|---|---|---|---|---|---|
| C1 | C2 | C3 | C4 | C5 | C6 | C7 | C8 | C9 | C10 | C11 | C12 | C13 | C14 | C15 | C16 | C17 | C18 | C19 | C20 | C21 | C22 | C23 | C24 | ||
| AS1 | C1 | 0.237 | 0.237 | 0.237 | 0.237 | 0.237 | 0.237 | 0.237 | 0.237 | 0.237 | 0.237 | 0.237 | 0.237 | 0.237 | 0.237 | 0.237 | 0.237 | 0.237 | 0.237 | 0.237 | 0.237 | 0.237 | 0.237 | 0.237 | 0.237 |
| C2 | 0.319 | 0.319 | 0.319 | 0.319 | 0.319 | 0.319 | 0.319 | 0.319 | 0.319 | 0.319 | 0.319 | 0.319 | 0.319 | 0.319 | 0.319 | 0.319 | 0.319 | 0.319 | 0.319 | 0.319 | 0.319 | 0.319 | 0.319 | 0.319 | |
| C3 | 0.241 | 0.241 | 0.241 | 0.241 | 0.241 | 0.241 | 0.241 | 0.241 | 0.241 | 0.241 | 0.241 | 0.241 | 0.241 | 0.241 | 0.241 | 0.241 | 0.241 | 0.241 | 0.241 | 0.241 | 0.241 | 0.241 | 0.241 | 0.241 | |
| C4 | 0.203 | 0.203 | 0.203 | 0.203 | 0.203 | 0.203 | 0.203 | 0.203 | 0.203 | 0.203 | 0.203 | 0.203 | 0.203 | 0.203 | 0.203 | 0.203 | 0.203 | 0.203 | 0.203 | 0.203 | 0.203 | 0.203 | 0.203 | 0.203 | |
| AS2 | C5 | 0.203 | 0.203 | 0.203 | 0.203 | 0.000 | 0.000 | 0.000 | 0.000 | 0.203 | 0.203 | 0.203 | 0.203 | 0.203 | 0.203 | 0.203 | 0.203 | 0.203 | 0.203 | 0.203 | 0.203 | 0.203 | 0.203 | 0.203 | 0.203 |
| C6 | 0.156 | 0.156 | 0.156 | 0.156 | 0.000 | 0.000 | 0.000 | 0.000 | 0.156 | 0.156 | 0.156 | 0.156 | 0.156 | 0.156 | 0.156 | 0.156 | 0.156 | 0.156 | 0.156 | 0.156 | 0.156 | 0.156 | 0.156 | 0.156 | |
| C7 | 0.271 | 0.271 | 0.271 | 0.271 | 0.000 | 0.000 | 0.000 | 0.000 | 0.271 | 0.271 | 0.271 | 0.271 | 0.271 | 0.271 | 0.271 | 0.271 | 0.271 | 0.271 | 0.271 | 0.271 | 0.271 | 0.271 | 0.271 | 0.271 | |
| C8 | 0.370 | 0.370 | 0.370 | 0.370 | 0.000 | 0.000 | 0.000 | 0.000 | 0.370 | 0.370 | 0.370 | 0.370 | 0.370 | 0.370 | 0.370 | 0.370 | 0.370 | 0.370 | 0.370 | 0.370 | 0.370 | 0.370 | 0.370 | 0.370 | |
| AS3 | C9 | 0.311 | 0.311 | 0.311 | 0.311 | 0.311 | 0.311 | 0.311 | 0.311 | 0.000 | 0.000 | 0.000 | 0.000 | 0.311 | 0.311 | 0.311 | 0.311 | 0.311 | 0.311 | 0.311 | 0.311 | 0.311 | 0.311 | 0.311 | 0.311 |
| C10 | 0.268 | 0.268 | 0.268 | 0.268 | 0.268 | 0.268 | 0.268 | 0.268 | 0.000 | 0.000 | 0.000 | 0.000 | 0.268 | 0.268 | 0.268 | 0.268 | 0.268 | 0.268 | 0.268 | 0.268 | 0.268 | 0.268 | 0.268 | 0.268 | |
| C11 | 0.230 | 0.230 | 0.230 | 0.230 | 0.230 | 0.230 | 0.230 | 0.230 | 0.000 | 0.000 | 0.000 | 0.000 | 0.230 | 0.230 | 0.230 | 0.230 | 0.230 | 0.230 | 0.230 | 0.230 | 0.230 | 0.230 | 0.230 | 0.230 | |
| C12 | 0.191 | 0.191 | 0.191 | 0.191 | 0.191 | 0.191 | 0.191 | 0.191 | 0.000 | 0.000 | 0.000 | 0.000 | 0.191 | 0.191 | 0.191 | 0.191 | 0.191 | 0.191 | 0.191 | 0.191 | 0.191 | 0.191 | 0.191 | 0.191 | |
| AS4 | C13 | 0.419 | 0.419 | 0.419 | 0.419 | 0.419 | 0.419 | 0.419 | 0.419 | 0.419 | 0.419 | 0.419 | 0.419 | 0.000 | 0.000 | 0.000 | 0.000 | 0.419 | 0.419 | 0.419 | 0.419 | 0.419 | 0.419 | 0.419 | 0.419 |
| C14 | 0.144 | 0.144 | 0.144 | 0.144 | 0.144 | 0.144 | 0.144 | 0.144 | 0.144 | 0.144 | 0.144 | 0.144 | 0.000 | 0.000 | 0.000 | 0.000 | 0.144 | 0.144 | 0.144 | 0.144 | 0.144 | 0.144 | 0.144 | 0.144 | |
| C15 | 0.297 | 0.297 | 0.297 | 0.297 | 0.297 | 0.297 | 0.297 | 0.297 | 0.297 | 0.297 | 0.297 | 0.297 | 0.000 | 0.000 | 0.000 | 0.000 | 0.297 | 0.297 | 0.297 | 0.297 | 0.297 | 0.297 | 0.297 | 0.297 | |
| C16 | 0.140 | 0.140 | 0.140 | 0.140 | 0.140 | 0.140 | 0.140 | 0.140 | 0.140 | 0.140 | 0.140 | 0.140 | 0.000 | 0.000 | 0.000 | 0.000 | 0.140 | 0.140 | 0.140 | 0.140 | 0.140 | 0.140 | 0.140 | 0.140 | |
| AS5 | C17 | 0.120 | 0.120 | 0.120 | 0.120 | 0.120 | 0.120 | 0.120 | 0.120 | 0.120 | 0.120 | 0.120 | 0.120 | 0.000 | 0.000 | 0.000 | 0.000 | 0.000 | 0.000 | 0.000 | 0.000 | 0.120 | 0.120 | 0.120 | 0.120 |
| C18 | 0.302 | 0.302 | 0.299 | 0.302 | 0.302 | 0.302 | 0.302 | 0.302 | 0.302 | 0.302 | 0.302 | 0.302 | 0.000 | 0.000 | 0.000 | 0.000 | 0.000 | 0.000 | 0.000 | 0.000 | 0.302 | 0.302 | 0.302 | 0.302 | |
| C19 | 0.207 | 0.207 | 0.210 | 0.207 | 0.207 | 0.207 | 0.207 | 0.207 | 0.207 | 0.207 | 0.207 | 0.207 | 0.000 | 0.000 | 0.000 | 0.000 | 0.000 | 0.000 | 0.000 | 0.000 | 0.207 | 0.207 | 0.207 | 0.207 | |
| C20 | 0.371 | 0.371 | 0.371 | 0.371 | 0.371 | 0.371 | 0.371 | 0.371 | 0.371 | 0.371 | 0.371 | 0.371 | 0.000 | 0.000 | 0.000 | 0.000 | 0.000 | 0.000 | 0.000 | 0.000 | 0.371 | 0.371 | 0.371 | 0.371 | |
| AS6 | C21 | 0.318 | 0.318 | 0.318 | 0.318 | 0.318 | 0.318 | 0.318 | 0.318 | 0.318 | 0.318 | 0.318 | 0.318 | 0.318 | 0.318 | 0.318 | 0.318 | 0.318 | 0.318 | 0.318 | 0.318 | 0.000 | 0.000 | 0.000 | 0.000 |
| C22 | 0.264 | 0.264 | 0.264 | 0.264 | 0.264 | 0.264 | 0.264 | 0.264 | 0.264 | 0.264 | 0.264 | 0.264 | 0.264 | 0.264 | 0.264 | 0.264 | 0.264 | 0.264 | 0.264 | 0.264 | 0.000 | 0.000 | 0.000 | 0.000 | |
| C23 | 0.145 | 0.145 | 0.145 | 0.145 | 0.145 | 0.145 | 0.145 | 0.145 | 0.145 | 0.145 | 0.145 | 0.145 | 0.145 | 0.145 | 0.145 | 0.145 | 0.145 | 0.145 | 0.145 | 0.145 | 0.000 | 0.000 | 0.000 | 0.000 | |
| C24 | 0.273 | 0.273 | 0.273 | 0.273 | 0.273 | 0.273 | 0.273 | 0.273 | 0.273 | 0.273 | 0.273 | 0.273 | 0.273 | 0.273 | 0.273 | 0.273 | 0.273 | 0.273 | 0.273 | 0.273 | 0.000 | 0.000 | 0.000 | 0.000 | |
Appendix F
| AS1 | AS2 | AS3 | AS4 | AS5 | AS6 | ||||||||||||||||||||
|---|---|---|---|---|---|---|---|---|---|---|---|---|---|---|---|---|---|---|---|---|---|---|---|---|---|
| C1 | C2 | C3 | C4 | C5 | C6 | C7 | C8 | C9 | C10 | C11 | C12 | C13 | C14 | C15 | C16 | C17 | C18 | C19 | C20 | C21 | C22 | C23 | C24 | ||
| AS1 | C1 | 0.027 | 0.027 | 0.027 | 0.027 | 0.032 | 0.032 | 0.032 | 0.032 | 0.034 | 0.034 | 0.034 | 0.034 | 0.031 | 0.031 | 0.031 | 0.031 | 0.032 | 0.032 | 0.032 | 0.032 | 0.037 | 0.037 | 0.037 | 0.037 |
| C2 | 0.036 | 0.036 | 0.036 | 0.036 | 0.043 | 0.043 | 0.043 | 0.043 | 0.045 | 0.045 | 0.045 | 0.045 | 0.042 | 0.042 | 0.042 | 0.042 | 0.044 | 0.044 | 0.044 | 0.044 | 0.051 | 0.051 | 0.051 | 0.051 | |
| C3 | 0.027 | 0.027 | 0.027 | 0.027 | 0.032 | 0.032 | 0.032 | 0.032 | 0.034 | 0.034 | 0.034 | 0.034 | 0.032 | 0.032 | 0.032 | 0.032 | 0.033 | 0.033 | 0.033 | 0.033 | 0.038 | 0.038 | 0.038 | 0.038 | |
| C4 | 0.023 | 0.023 | 0.023 | 0.023 | 0.027 | 0.027 | 0.027 | 0.027 | 0.029 | 0.029 | 0.029 | 0.029 | 0.027 | 0.027 | 0.027 | 0.027 | 0.028 | 0.028 | 0.028 | 0.028 | 0.032 | 0.032 | 0.032 | 0.032 | |
| AS2 | C5 | 0.027 | 0.027 | 0.027 | 0.027 | 0.000 | 0.000 | 0.000 | 0.000 | 0.034 | 0.034 | 0.034 | 0.034 | 0.038 | 0.038 | 0.038 | 0.038 | 0.028 | 0.028 | 0.028 | 0.028 | 0.037 | 0.037 | 0.037 | 0.037 |
| C6 | 0.021 | 0.021 | 0.021 | 0.021 | 0.000 | 0.000 | 0.000 | 0.000 | 0.026 | 0.026 | 0.026 | 0.026 | 0.030 | 0.030 | 0.030 | 0.030 | 0.021 | 0.021 | 0.021 | 0.021 | 0.028 | 0.028 | 0.028 | 0.028 | |
| C7 | 0.036 | 0.036 | 0.036 | 0.036 | 0.000 | 0.000 | 0.000 | 0.000 | 0.045 | 0.045 | 0.045 | 0.045 | 0.051 | 0.051 | 0.051 | 0.051 | 0.037 | 0.037 | 0.037 | 0.037 | 0.049 | 0.049 | 0.049 | 0.049 | |
| C8 | 0.049 | 0.049 | 0.049 | 0.049 | 0.000 | 0.000 | 0.000 | 0.000 | 0.061 | 0.061 | 0.061 | 0.061 | 0.070 | 0.070 | 0.070 | 0.070 | 0.050 | 0.050 | 0.050 | 0.050 | 0.067 | 0.067 | 0.067 | 0.067 | |
| AS3 | C9 | 0.071 | 0.071 | 0.071 | 0.071 | 0.087 | 0.087 | 0.087 | 0.087 | 0.000 | 0.000 | 0.000 | 0.000 | 0.110 | 0.110 | 0.110 | 0.110 | 0.084 | 0.084 | 0.084 | 0.084 | 0.082 | 0.082 | 0.082 | 0.082 |
| C10 | 0.061 | 0.061 | 0.061 | 0.061 | 0.075 | 0.075 | 0.075 | 0.075 | 0.000 | 0.000 | 0.000 | 0.000 | 0.095 | 0.095 | 0.095 | 0.095 | 0.073 | 0.073 | 0.073 | 0.073 | 0.071 | 0.071 | 0.071 | 0.071 | |
| C11 | 0.053 | 0.053 | 0.053 | 0.053 | 0.065 | 0.065 | 0.065 | 0.065 | 0.000 | 0.000 | 0.000 | 0.000 | 0.082 | 0.082 | 0.082 | 0.082 | 0.063 | 0.063 | 0.063 | 0.063 | 0.061 | 0.061 | 0.061 | 0.061 | |
| C12 | 0.044 | 0.044 | 0.044 | 0.044 | 0.054 | 0.054 | 0.054 | 0.054 | 0.000 | 0.000 | 0.000 | 0.000 | 0.068 | 0.068 | 0.068 | 0.068 | 0.052 | 0.052 | 0.052 | 0.052 | 0.050 | 0.050 | 0.050 | 0.050 | |
| AS4 | C13 | 0.063 | 0.063 | 0.063 | 0.063 | 0.058 | 0.058 | 0.058 | 0.058 | 0.078 | 0.078 | 0.078 | 0.078 | 0.000 | 0.000 | 0.000 | 0.000 | 0.076 | 0.076 | 0.076 | 0.076 | 0.086 | 0.086 | 0.086 | 0.086 |
| C14 | 0.022 | 0.022 | 0.022 | 0.022 | 0.020 | 0.020 | 0.020 | 0.020 | 0.027 | 0.027 | 0.027 | 0.027 | 0.000 | 0.000 | 0.000 | 0.000 | 0.026 | 0.026 | 0.026 | 0.026 | 0.030 | 0.030 | 0.030 | 0.030 | |
| C15 | 0.045 | 0.045 | 0.045 | 0.045 | 0.041 | 0.041 | 0.041 | 0.041 | 0.055 | 0.055 | 0.055 | 0.055 | 0.000 | 0.000 | 0.000 | 0.000 | 0.054 | 0.054 | 0.054 | 0.054 | 0.061 | 0.061 | 0.061 | 0.061 | |
| C16 | 0.021 | 0.021 | 0.021 | 0.021 | 0.019 | 0.019 | 0.019 | 0.019 | 0.026 | 0.026 | 0.026 | 0.026 | 0.000 | 0.000 | 0.000 | 0.000 | 0.026 | 0.026 | 0.026 | 0.026 | 0.029 | 0.029 | 0.029 | 0.029 | |
| AS5 | C17 | 0.018 | 0.018 | 0.018 | 0.018 | 0.022 | 0.022 | 0.022 | 0.022 | 0.022 | 0.022 | 0.022 | 0.022 | 0.000 | 0.000 | 0.000 | 0.000 | 0.000 | 0.000 | 0.000 | 0.000 | 0.023 | 0.023 | 0.023 | 0.023 |
| C18 | 0.044 | 0.044 | 0.044 | 0.044 | 0.056 | 0.056 | 0.056 | 0.056 | 0.057 | 0.057 | 0.057 | 0.057 | 0.000 | 0.000 | 0.000 | 0.000 | 0.000 | 0.000 | 0.000 | 0.000 | 0.059 | 0.059 | 0.059 | 0.059 | |
| C19 | 0.030 | 0.030 | 0.031 | 0.030 | 0.038 | 0.038 | 0.038 | 0.038 | 0.039 | 0.039 | 0.039 | 0.039 | 0.000 | 0.000 | 0.000 | 0.000 | 0.000 | 0.000 | 0.000 | 0.000 | 0.040 | 0.040 | 0.040 | 0.040 | |
| C20 | 0.054 | 0.054 | 0.054 | 0.054 | 0.069 | 0.069 | 0.069 | 0.069 | 0.069 | 0.069 | 0.069 | 0.069 | 0.000 | 0.000 | 0.000 | 0.000 | 0.000 | 0.000 | 0.000 | 0.000 | 0.072 | 0.072 | 0.072 | 0.072 | |
| AS6 | C21 | 0.073 | 0.073 | 0.073 | 0.073 | 0.083 | 0.083 | 0.083 | 0.083 | 0.101 | 0.101 | 0.101 | 0.101 | 0.103 | 0.103 | 0.103 | 0.103 | 0.087 | 0.087 | 0.087 | 0.087 | 0.000 | 0.000 | 0.000 | 0.000 |
| C22 | 0.061 | 0.061 | 0.061 | 0.061 | 0.069 | 0.069 | 0.069 | 0.069 | 0.084 | 0.084 | 0.084 | 0.084 | 0.085 | 0.085 | 0.085 | 0.085 | 0.072 | 0.072 | 0.072 | 0.072 | 0.000 | 0.000 | 0.000 | 0.000 | |
| C23 | 0.033 | 0.033 | 0.033 | 0.033 | 0.038 | 0.038 | 0.038 | 0.038 | 0.046 | 0.046 | 0.046 | 0.046 | 0.047 | 0.047 | 0.047 | 0.047 | 0.040 | 0.040 | 0.040 | 0.040 | 0.000 | 0.000 | 0.000 | 0.000 | |
| C24 | 0.063 | 0.063 | 0.063 | 0.063 | 0.072 | 0.072 | 0.072 | 0.072 | 0.087 | 0.087 | 0.087 | 0.087 | 0.088 | 0.088 | 0.088 | 0.088 | 0.075 | 0.075 | 0.075 | 0.075 | 0.000 | 0.000 | 0.000 | 0.000 | |
Appendix G
| AS1 | AS2 | AS3 | AS4 | AS5 | AS6 | ||||||||||||||||||||
|---|---|---|---|---|---|---|---|---|---|---|---|---|---|---|---|---|---|---|---|---|---|---|---|---|---|
| C1 | C2 | C3 | C4 | C5 | C6 | C7 | C8 | C9 | C10 | C11 | C12 | C13 | C14 | C15 | C16 | C17 | C18 | C19 | C20 | C21 | C22 | C23 | C24 | ||
| AS1 | C1 | 0.033 | 0.033 | 0.033 | 0.033 | 0.033 | 0.033 | 0.033 | 0.033 | 0.033 | 0.033 | 0.033 | 0.033 | 0.033 | 0.033 | 0.033 | 0.033 | 0.033 | 0.033 | 0.033 | 0.033 | 0.033 | 0.033 | 0.033 | 0.033 |
| C2 | 0.044 | 0.044 | 0.044 | 0.044 | 0.044 | 0.044 | 0.044 | 0.044 | 0.044 | 0.044 | 0.044 | 0.044 | 0.044 | 0.044 | 0.044 | 0.044 | 0.044 | 0.044 | 0.044 | 0.044 | 0.044 | 0.044 | 0.044 | 0.044 | |
| C3 | 0.033 | 0.033 | 0.033 | 0.033 | 0.033 | 0.033 | 0.033 | 0.033 | 0.033 | 0.033 | 0.033 | 0.033 | 0.033 | 0.033 | 0.033 | 0.033 | 0.033 | 0.033 | 0.033 | 0.033 | 0.033 | 0.033 | 0.033 | 0.033 | |
| C4 | 0.028 | 0.028 | 0.028 | 0.028 | 0.028 | 0.028 | 0.028 | 0.028 | 0.028 | 0.028 | 0.028 | 0.028 | 0.028 | 0.028 | 0.028 | 0.028 | 0.028 | 0.028 | 0.028 | 0.028 | 0.028 | 0.028 | 0.028 | 0.028 | |
| AS2 | C5 | 0.029 | 0.029 | 0.029 | 0.029 | 0.029 | 0.029 | 0.029 | 0.029 | 0.029 | 0.029 | 0.029 | 0.029 | 0.029 | 0.029 | 0.029 | 0.029 | 0.029 | 0.029 | 0.029 | 0.029 | 0.029 | 0.029 | 0.029 | 0.029 |
| C6 | 0.022 | 0.022 | 0.022 | 0.022 | 0.022 | 0.022 | 0.022 | 0.022 | 0.022 | 0.022 | 0.022 | 0.022 | 0.022 | 0.022 | 0.022 | 0.022 | 0.022 | 0.022 | 0.022 | 0.022 | 0.022 | 0.022 | 0.022 | 0.022 | |
| C7 | 0.038 | 0.038 | 0.038 | 0.038 | 0.038 | 0.038 | 0.038 | 0.038 | 0.038 | 0.038 | 0.038 | 0.038 | 0.038 | 0.038 | 0.038 | 0.038 | 0.038 | 0.038 | 0.038 | 0.038 | 0.038 | 0.038 | 0.038 | 0.038 | |
| C8 | 0.052 | 0.052 | 0.052 | 0.052 | 0.052 | 0.052 | 0.052 | 0.052 | 0.052 | 0.052 | 0.052 | 0.052 | 0.052 | 0.052 | 0.052 | 0.052 | 0.052 | 0.052 | 0.052 | 0.052 | 0.052 | 0.052 | 0.052 | 0.052 | |
| AS3 | C9 | 0.068 | 0.068 | 0.068 | 0.068 | 0.068 | 0.068 | 0.068 | 0.068 | 0.068 | 0.068 | 0.068 | 0.068 | 0.068 | 0.068 | 0.068 | 0.068 | 0.068 | 0.068 | 0.068 | 0.068 | 0.068 | 0.068 | 0.068 | 0.068 |
| C10 | 0.059 | 0.059 | 0.059 | 0.059 | 0.059 | 0.059 | 0.059 | 0.059 | 0.059 | 0.059 | 0.059 | 0.059 | 0.059 | 0.059 | 0.059 | 0.059 | 0.059 | 0.059 | 0.059 | 0.059 | 0.059 | 0.059 | 0.059 | 0.059 | |
| C11 | 0.050 | 0.050 | 0.050 | 0.050 | 0.050 | 0.050 | 0.050 | 0.050 | 0.050 | 0.050 | 0.050 | 0.050 | 0.050 | 0.050 | 0.050 | 0.050 | 0.050 | 0.050 | 0.050 | 0.050 | 0.050 | 0.050 | 0.050 | 0.050 | |
| C12 | 0.042 | 0.042 | 0.042 | 0.042 | 0.042 | 0.042 | 0.042 | 0.042 | 0.042 | 0.042 | 0.042 | 0.042 | 0.042 | 0.042 | 0.042 | 0.042 | 0.042 | 0.042 | 0.042 | 0.042 | 0.042 | 0.042 | 0.042 | 0.042 | |
| AS4 | C13 | 0.063 | 0.063 | 0.063 | 0.063 | 0.063 | 0.063 | 0.063 | 0.063 | 0.063 | 0.063 | 0.063 | 0.063 | 0.063 | 0.063 | 0.063 | 0.063 | 0.063 | 0.063 | 0.063 | 0.063 | 0.063 | 0.063 | 0.063 | 0.063 |
| C14 | 0.022 | 0.022 | 0.022 | 0.022 | 0.022 | 0.022 | 0.022 | 0.022 | 0.022 | 0.022 | 0.022 | 0.022 | 0.022 | 0.022 | 0.022 | 0.022 | 0.022 | 0.022 | 0.022 | 0.022 | 0.022 | 0.022 | 0.022 | 0.022 | |
| C15 | 0.045 | 0.045 | 0.045 | 0.045 | 0.045 | 0.045 | 0.045 | 0.045 | 0.045 | 0.045 | 0.045 | 0.045 | 0.045 | 0.045 | 0.045 | 0.045 | 0.045 | 0.045 | 0.045 | 0.045 | 0.045 | 0.045 | 0.045 | 0.045 | |
| C16 | 0.021 | 0.021 | 0.021 | 0.021 | 0.021 | 0.021 | 0.021 | 0.021 | 0.021 | 0.021 | 0.021 | 0.021 | 0.021 | 0.021 | 0.021 | 0.021 | 0.021 | 0.021 | 0.021 | 0.021 | 0.021 | 0.021 | 0.021 | 0.021 | |
| AS5 | C17 | 0.016 | 0.016 | 0.016 | 0.016 | 0.016 | 0.016 | 0.016 | 0.016 | 0.016 | 0.016 | 0.016 | 0.016 | 0.016 | 0.016 | 0.016 | 0.016 | 0.016 | 0.016 | 0.016 | 0.016 | 0.016 | 0.016 | 0.016 | 0.016 |
| C18 | 0.039 | 0.039 | 0.039 | 0.039 | 0.039 | 0.039 | 0.039 | 0.039 | 0.039 | 0.039 | 0.039 | 0.039 | 0.039 | 0.039 | 0.039 | 0.039 | 0.039 | 0.039 | 0.039 | 0.039 | 0.039 | 0.039 | 0.039 | 0.039 | |
| C19 | 0.027 | 0.027 | 0.027 | 0.027 | 0.027 | 0.027 | 0.027 | 0.027 | 0.027 | 0.027 | 0.027 | 0.027 | 0.027 | 0.027 | 0.027 | 0.027 | 0.027 | 0.027 | 0.027 | 0.027 | 0.027 | 0.027 | 0.027 | 0.027 | |
| C20 | 0.048 | 0.048 | 0.048 | 0.048 | 0.048 | 0.048 | 0.048 | 0.048 | 0.048 | 0.048 | 0.048 | 0.048 | 0.048 | 0.048 | 0.048 | 0.048 | 0.048 | 0.048 | 0.048 | 0.048 | 0.048 | 0.048 | 0.048 | 0.048 | |
| AS6 | C21 | 0.071 | 0.071 | 0.071 | 0.071 | 0.071 | 0.071 | 0.071 | 0.071 | 0.071 | 0.071 | 0.071 | 0.071 | 0.071 | 0.071 | 0.071 | 0.071 | 0.071 | 0.071 | 0.071 | 0.071 | 0.071 | 0.071 | 0.071 | 0.071 |
| C22 | 0.059 | 0.059 | 0.059 | 0.059 | 0.059 | 0.059 | 0.059 | 0.059 | 0.059 | 0.059 | 0.059 | 0.059 | 0.059 | 0.059 | 0.059 | 0.059 | 0.059 | 0.059 | 0.059 | 0.059 | 0.059 | 0.059 | 0.059 | 0.059 | |
| C23 | 0.032 | 0.032 | 0.032 | 0.032 | 0.032 | 0.032 | 0.032 | 0.032 | 0.032 | 0.032 | 0.032 | 0.032 | 0.032 | 0.032 | 0.032 | 0.032 | 0.032 | 0.032 | 0.032 | 0.032 | 0.032 | 0.032 | 0.032 | 0.032 | |
| C24 | 0.061 | 0.061 | 0.061 | 0.061 | 0.061 | 0.061 | 0.061 | 0.061 | 0.061 | 0.061 | 0.061 | 0.061 | 0.061 | 0.061 | 0.061 | 0.061 | 0.061 | 0.061 | 0.061 | 0.061 | 0.061 | 0.061 | 0.061 | 0.061 | |
References
- Seuring, S.; Müller, M. From a literature review to a conceptual framework for sustainable supply chain management. J. Clean Prod. 2008, 16, 1699–1710. [Google Scholar] [CrossRef]
- Hashemi, S.H.; Karimi, A.; Tavana, M. An integrated green supplier selection approach with analytic network process and improved Grey relational analysis. Int. J. Prod. Econ. 2015, 159, 178–191. [Google Scholar] [CrossRef]
- Apple Wakes Up to Chinese Pollution Concerns. https://www.theguardian.com/environment/2011/oct/04/apple-chinese-pollution-concerns (accessed on 4 October 2011).
- Amindoust, A.; Ahmed, S.; Saghafinia, A.; Bahreininejad, A. Sustainable supplier selection: A ranking model based on fuzzy inference system. Appl. Soft Comput. 2012, 12, 1668–1677. [Google Scholar] [CrossRef]
- Bai, C.; Sarkis, J. Determining and applying sustainable supplier key performance indicators. Supply Chain Manag. 2014, 19, 275–291. [Google Scholar] [CrossRef]
- Buyukozkan, G.; Cifci, G. A novel fuzzy multi-criteria decision framework for sustainable supplier selection with incomplete information. Comput. Ind. 2011, 62, 164–174. [Google Scholar] [CrossRef]
- Zimmer, K.; Froehling, M.; Schultmann, F. Sustainable supplier management—A review of models supporting sustainable supplier selection, monitoring and development. Int. J. Prod. Res. 2016, 54, 1412–1442. [Google Scholar] [CrossRef]
- Esfahbodi, A.; Zhang, Y.; Watson, G. Sustainable supply chain management in emerging economies: Trade-offs between environmental and cost performance. Int. J. Prod. Econ. 2016, 181, 350–366. [Google Scholar] [CrossRef]
- Vahidi, F.; Torabi, S.A.; Ramezankhani, M.J. Sustainable supplier selection and order allocation under operational and disruption risks. J. Clean Prod. 2018, 174, 1351–1365. [Google Scholar] [CrossRef]
- Guo, X.; Yuan, Z.; Tian, B. Supplier selection based on hierarchical potential support vector machine. Expert Syst. Appl. 2009, 36, 6978–6985. [Google Scholar] [CrossRef]
- Ghodsypour, S.H.; O’Brien, C. The total cost of logistics in supplier selection, under conditions of multiple sourcing, multiple criteria and capacity constraint. Int. J. Prod. Econ. 2001, 73, 15–27. [Google Scholar] [CrossRef]
- Shemshadi, A.; Shirazi, H.; Toreihi, M.; Tarokh, M.J. A fuzzy VIKOR method for supplier selection based on entropy measure for objective weighting. Expert Syst. Appl. 2011, 38, 12160–12167. [Google Scholar] [CrossRef]
- Handfield, R.; Walton, S.V.; Sroufe, R.; Melnyk, S.A. Applying environmental criteria to supplier assessment: A study in the application of the Analytical Hierarchy Process. Eur. J. Oper. Res. 2002, 141, 70–87. [Google Scholar] [CrossRef]
- Lee, A.H.I.; Kang, H.Y.; Hsu, C.F.; Hung, H.C. A green supplier selection model for high-tech industry. Expert Syst. Appl. 2009, 36, 7917–7927. [Google Scholar] [CrossRef]
- Song, W.; Xu, Z.; Liu, H.C. Developing sustainable supplier selection criteria for solar air-conditioner manufacturer: An integrated approach. Renew. Sust. Energ. Rev. 2017, 79, 1461–1471. [Google Scholar] [CrossRef]
- Fallahpour, A.; Olugu, E.U.; Musa, S.N.; Wong, K.Y.; Noori, S. A decision support model for sustainable supplier selection in sustainable supply chain management. Comput. Ind. Eng. 2017, 105, 391–410. [Google Scholar] [CrossRef]
- Tavana, M.; Yazdani, M.; Di Caprio, D. An application of an integrated ANP-QFD framework for sustainable supplier selection. Int. J. Logist.-Res. Appl. 2017, 20, 254–275. [Google Scholar] [CrossRef]
- Kannan, D. Role of multiple stakeholders and the critical success factor theory for the sustainable supplier selection process. Int. J. Prod. Econ. 2018, 195, 391–418. [Google Scholar] [CrossRef]
- Elkington, J. Cannibals with forks : The triple bottom line of 21st century business. Environ. Qual. Manage. 1998, 8, 37–51. [Google Scholar] [CrossRef]
- Ou Yang, Y.P.; Shieh, H.M.; Leu, J.D.; Tzeng, G.H. A novel hybrid MCDM model combined with DEMATEL and ANP with applications. Int. J. Oper. Res. 2008, 5, 160–168. [Google Scholar]
- Hsu, C.H.; Wang, F.K.; Tzeng, G.H. The best vendor selection for conducting the recycled material based on a hybrid MCDM model combining DANP with VIKOR. Resour. Conserv. Recycl. 2012, 66, 95–111. [Google Scholar] [CrossRef]
- Chiu, W.Y.; Tzeng, G.H.; Li, H.L. A new hybrid MCDM model combining DANP with VIKOR to improve e-store business. Knowledge-Based Syst. 2013, 37, 48–61. [Google Scholar] [CrossRef]
- Wang, Y.L.; Tzeng, G.H. Brand marketing for creating brand value based on a MCDM model combining DEMATEL with ANP and VIKOR methods. Expert Syst. Appl. 2012, 39, 5600–5615. [Google Scholar] [CrossRef]
- Opricovic, S.; Tzeng, G. Compromise solution by MCDM methods: A comparative analysis of VIKOR and TOPSIS. Eur. J. Oper. Res. 2004, 156, 445–455. [Google Scholar] [CrossRef]
- Sanayei, A.; Mousavi, S.F.; Yazdankhah, A. Group decision making process for supplier selection with VIKOR under fuzzy environment. Expert Syst. Appl. 2010, 37, 24–30. [Google Scholar] [CrossRef]
- Lin, Y.H.; Tseng, M.L. Assessing the competitive priorities within sustainable supply chain management under uncertainty. J. Clean Prod. 2016, 112, 2133–2144. [Google Scholar] [CrossRef]
- Kuo, M.S.; Liang, G.S. A soft computing method of performance evaluation with MCDM based on interval-valued fuzzy numbers. Appl. Soft Comput. 2012, 12, 476–485. [Google Scholar] [CrossRef]
- Kuo, T.C.; Hsu, C.W.; Li, J.Y. Developing a green supplier selection model by using the DANP with VIKOR. Sustainability 2015, 7, 1661–1689. [Google Scholar] [CrossRef]
- Luthra, S.; Govindan, K.; Kannan, D.; Mangla, S.K.; Garg, C.P. An integrated framework for sustainable supplier selection and evaluation in supply chains. J. Clean Prod. 2017, 140, 1686–1698. [Google Scholar] [CrossRef]
- Jauhar, S.K.; Pant, M. Integrating DEA with DE and MODE for sustainable supplier selection. J. Comput. Sci. 2017, 21, 299–306. [Google Scholar] [CrossRef]
- Drumwright, M.E. Socially responsible organizational buying: Environmental concern as a noneconomic buying criterion. J. Mark. 1994, 58, 1–19. [Google Scholar] [CrossRef]
- Murphy, P.R.; Poist, R.F.; Braunschwieg, C.D. Management of environmental issues in logistics: Current status and future potential. Transp. J. 1994, 34, 48–56. [Google Scholar]
- Green, K.; Morton, B.; New, S. Purchasing and environmental management: Interactions, politics and opportunities. Bus. Strateg. Environ. 1996, 5, 188–197. [Google Scholar] [CrossRef]
- Min, H.; Galle, W.P. Green purchasing practices of US firms. Int. J. Oper. Prod. Manage. 2001, 21, 1222–1238. [Google Scholar] [CrossRef]
- Carter, C.R.; Jennings, M.M. Logistics social responsibility: An integrative framework. J. Bus. Logist. 2002, 23, 145–180. [Google Scholar] [CrossRef]
- Mentzer, J.T.; Dewitt, W.; Keebler, J.S.; Min, S.; Nix, N.W.; Smith, C.D.; Zacharia, Z.G. Defining supply chain management. J. Bus. Logist. 2001, 22, 1–25. [Google Scholar] [CrossRef]
- Linton, J.D.; Klassen, R.; Jayaraman, V. Sustainable supply chains: An introduction. J. Oper. Manag. 2007, 25, 1075–1082. [Google Scholar] [CrossRef]
- Carter, C.R.; Rogers, D.S. A framework of sustainable supply chain management: Moving toward new theory. Int. J. Phys. Distrib. Logist. Manag. 2008, 38, 360–387. [Google Scholar] [CrossRef]
- Handfield, R.; Sroufe, R.; Walton, S. Integrating environmental management and supply chain strategies. Bus. Strateg. Environ. 2005, 14, 1–19. [Google Scholar] [CrossRef]
- Lamming, R.; Hampson, J. The environment as a supply chain management issue. Brit. J. Manage. 1996, 7, S45–S62. [Google Scholar] [CrossRef]
- Preuss, L. Buying into our future: Sustainability initiatives in local government procurement. Bus. Strateg. Environ. 2007, 16, 354–365. [Google Scholar] [CrossRef]
- Leppelt, T.; Kai, F.; Reuter, C.; Hartmann, E. Sustainability management beyond organizational boundaries–sustainable supplier relationship management in the chemical industry. J. Clean. Prod. 2013, 56, 94–102. [Google Scholar] [CrossRef]
- Grimm, J.H.; Hofstetter, J.S.; Sarkis, J. Critical factors for sub-supplier management: A sustainable food supply chains perspective. Int. J. Prod. Econ. 2014, 152, 159–173. [Google Scholar] [CrossRef]
- Baskaran, V.; Nachiappan, S.; Rahman, S. Indian textile suppliers’ sustainability evaluation using the grey approach. Int. J. Prod. Econ. 2012, 135, 647–658. [Google Scholar] [CrossRef]
- Sarkis, J.; Talluri, S. A model for strategic supplier selection. J. Supply Chain Manag. 2002, 38, 18–28. [Google Scholar] [CrossRef]
- Verma, R.; Pullman, M.E. An analysis of the supplier selection process. Omega-Int. J. Manag. Sci. 1998, 26, 739–750. [Google Scholar] [CrossRef]
- Şen, S.; Başligil, H.; Şen, C.G.; BaraÇli, H. A framework for defining both qualitative and quantitative supplier selection criteria considering the buyer–supplier integration strategies. Int. J. Prod. Res. 2008, 46, 1825–1845. [Google Scholar] [CrossRef]
- Choi, T.Y.; Hartley, J.L. An exploration of supplier selection practices across the supply chain. J. Oper. Manag. 1996, 14, 333–343. [Google Scholar] [CrossRef]
- Freeman, J.; Chen, T. Green supplier selection using an AHP-Entropy-TOPSIS framework. Supply Chain Manag. 2015, 20, 327–340. [Google Scholar] [CrossRef]
- Bai, C.; Sarkis, J. Integrating sustainability into supplier selection with grey system and rough set methodologies. Int. J. Prod. Econ. 2010, 124, 252–264. [Google Scholar] [CrossRef]
- Dickson, G. An analysis of vendor selection systems and decision. J. Purch. 1966, 2, 5–17. [Google Scholar] [CrossRef]
- Weber, C.A.; Current, J.R.; Benton, W.C. Vendor selection criteria and methods. Eur. J. Oper. Res. 1991, 50, 2–18. [Google Scholar] [CrossRef]
- Dixon, J.R.; Arnold, P.; Heineke, J.; Kim, J.S.; Mulligan, P. Business process reengineering: Improving in new strategic directions. Calif. Manag. Rev. 1994, 36, 93–108. [Google Scholar] [CrossRef]
- Chang, S.C.; Lin, N.P.; Sheu, C. Aligning manufacturing flexibility with environmental uncertainty in high-tech industry. Int. J. Prod. Res. 2002, 40, 4765–4780. [Google Scholar] [CrossRef]
- Bruntland, G. Our Common Future: UN World Commission on Environment and Development; Oxford University Press: Oxford, UK, 1987; p. 383. [Google Scholar]
- Walton, S.V.; Handfield, R.B.; Melnyk, S.A. The green supply chain: Integrating suppliers into environmental management processes. In Proceedings of the Annual Meeting of the Decision-Science-Institute, San Diego, CA, USA, 22–25 November 1997; pp. 1114–1116. [Google Scholar]
- Awasthi, A.; Govindan, K.; Gold, S. Multi-tier sustainable global supplier selection using a fuzzy AHP-VIKOR based approach. Int. J. Prod. Econ. 2018, 195, 106–117. [Google Scholar] [CrossRef]
- Yahya, S.; Kingsman, B. Vendor rating for an entrepreneur development programme: A case study using the Analytic Hierarchy Process method. J. Oper. Res. Soc. 1999, 50, 916–930. [Google Scholar] [CrossRef]
- Schan, F.T. Interactive selection model for supplier selection process: An analytical hierarchy process approach. Int. J. Prod. Res. 2003, 41, 3549–3579. [Google Scholar]
- Boer, L.D.; Dijkhuizen, G.V.; Telgen, J. A basis for modelling the costs of supplier selection: The economic tender quantity. J. Oper. Res. Soc. 2000, 51, 1128–1135. [Google Scholar] [CrossRef]
- Chen, C.T.; Lin, C.T.; Huang, S.F. A fuzzy approach for supplier evaluation and selection in supply chain management. Int. J. Prod. Econ. 2006, 102, 289–301. [Google Scholar] [CrossRef]
- Hamdan, S.; Cheaitou, A. Green supplier selection and order allocation using an integrated fuzzy TOPSIS, AHP and IP approach. In Proceedings of the IEEE International Conference on Industrial Engineering and Operations Management (IEOM), Dubai, United Arab Emirates, 3–5 March 2015; pp. 1–10. [Google Scholar]
- Kuo, R.J.; Wang, Y.C.; Tien, F.C. Integration of artificial neural network and MADA methods for green supplier selection. J. Clean Prod. 2010, 18, 1161–1170. [Google Scholar] [CrossRef]
- Zhu, Q.; Dou, Y.; Sarkis, J. A portfolio-based analysis for green supplier management using the analytical network process. Supply Chain Manag. 2010, 15, 306–319. [Google Scholar] [CrossRef]
- Kannan, D.; Jabbour, C.J.C. Selecting green suppliers based on GSCM practices: Using fuzzy TOPSIS applied to a Brazilian electronics company. Eur. J. Oper. Res. 2014, 233, 432–447. [Google Scholar] [CrossRef]
- Awasthi, A.; Chauhan, S.S.; Goyal, S.K. A fuzzy multicriteria approach for evaluating environmental performance of suppliers. Int. J. Prod. Econ. 2010, 126, 370–378. [Google Scholar] [CrossRef]
- Keskin, G.A.; İlhan, S.; Özkan, C. The fuzzy ART algorithm: A categorization method for supplier evaluation and selection. Expert Syst. Appl. 2010, 37, 1235–1240. [Google Scholar] [CrossRef]
- Govindan, K.; Khodaverdi, R.; Jafarian, A. A fuzzy multi criteria approach for measuring sustainability performance of a supplier based on triple bottom line approach. J. Clean Prod. 2013, 47, 345–354. [Google Scholar] [CrossRef]
- Ciliberti, F.; Groot, G.D.; Haan, J.D.; Pontrandolfo, P. Codes to coordinate supply chains: SMEs’ experiences with SA8000. Supply Chain Manag. 2013, 14, 117–127. [Google Scholar] [CrossRef]
- Ciliberti, F.; Pontrandolfo, P.; Scozzi, B. Investigating corporate social responsibility in supply chains: A SME perspective. J. Clean Prod. 2008, 16, 1579–1588. [Google Scholar] [CrossRef]
- Cruz, J.M.; Wakolbinger, T. Multiperiod effects of corporate social responsibility on supply chain networks, transaction costs, emissions, and risk. Int. J. Prod. Econ. 2008, 116, 61–74. [Google Scholar] [CrossRef]
- Azadnia, A.H.; Saman, M.Z.M.; Wong, K.Y.; Ghadimi, P.; Zakuan, N. Sustainable supplier selection based on self-organizing map neural network and multi criteria decision making approaches. In Proceedings of the International Congress on Interdisciplinary Business and Social Sciences, Jakarta, Indonesia, 1–2 December 2012; pp. 879–884. [Google Scholar]
- Hutchins, M.J.; Sutherland, J.W. An exploration of measures of social sustainability and their application to supply chain decisions. J. Clean Prod. 2008, 16, 1688–1698. [Google Scholar] [CrossRef]
- Sarkis, J.; Dhavale, D.G. Supplier selection for sustainable operations: A triple-bottom-line approach using a Bayesian framework. Int. J. Prod. Econ. 2015, 166, 177–191. [Google Scholar] [CrossRef]
- Yu, Q.; Hou, F. An approach for green supplier selection in the automobile manufacturing industry. Kybernetes 2016, 45, 571–588. [Google Scholar] [CrossRef]
- Büyüközkan, G.; Çifçi, G. A novel hybrid MCDM approach based on fuzzy DEMATEL, fuzzy ANP and fuzzy TOPSIS to evaluate green suppliers. Expert Syst. Appl. 2012, 39, 3000–3011. [Google Scholar] [CrossRef]
- Chiou, C.Y.; Hsu, C.W.; Hwang, W.Y. Comparative investigation on green supplier selection of the American, Japanese and Taiwanese Electronics Industry in China. In Proceedings of the IEEE International Conference on Industrial Engineering and Engineering Management, Singapore, 8–11 December 2008; pp. 1909–1914. [Google Scholar]
- Yeh, W.C.; Chuang, M.C. Using multi-objective genetic algorithm for partner selection in green supply chain problems. Expert Syst. Appl. 2011, 38, 4244–4253. [Google Scholar] [CrossRef]
- Sawik, T. On the risk-averse optimization of service level in a supply chain under disruption risks. Int. J. Prod. Res. 2016, 54, 98–113. [Google Scholar] [CrossRef]
- Hsu, C.W.; Hu, A.H. Applying hazardous substance management to supplier selection using analytic network process. J. Clean Prod. 2009, 17, 255–264. [Google Scholar] [CrossRef]
- Tseng, M.L.; Chiu, A.S.F. Evaluating firm’s green supply chain management in linguistic preferences. J. Clean Prod. 2013, 40, 22–31. [Google Scholar] [CrossRef]
- Rajesh, R.; Ravi, V. Supplier selection in resilient supply chains: A grey relational analysis approach. J. Clean Prod. 2015, 86, 343–359. [Google Scholar] [CrossRef]
- Chen, Y.-J. Structured methodology for supplier selection and evaluation in a supply chain. Inf. Sci. 2011, 181, 1651–1670. [Google Scholar] [CrossRef]
- Punniyamoorthy, M.; Mathiyalagan, P.; Parthiban, P. A strategic model using structural equation modeling and fuzzy logic in supplier selection. Expert Syst. Appl. 2011, 38, 458–474. [Google Scholar] [CrossRef]
- Guarnieri, P.; Sobreiro, V.A.; Nagano, M.S.; Serrano, A.L.M. The challenge of selecting and evaluating third-party reverse logistics providers in a multicriteria perspective: A Brazilian case. J. Clean Prod. 2015, 96, 209–219. [Google Scholar] [CrossRef]
- Tam, M.C.Y.; Tummala, V.M.R. An application of the AHP in vendor selection of a telecommunications system. Omega-Int. J. Manag. Sci. 2001, 29, 171–182. [Google Scholar] [CrossRef]
- Büyüközkan, G.; Çifçi, G. Evaluation of the green supply chain management practices: A fuzzy ANP approach. Prod. Plan. Control 2012, 23, 405–418. [Google Scholar] [CrossRef]
- Rezaei, J.; Ortt, R. Multi-criteria supplier segmentation using a fuzzy preference relations based AHP. Eur. J. Oper. Res. 2013, 225, 75–84. [Google Scholar] [CrossRef]
- Akman, G. Evaluating suppliers to include green supplier development programs via fuzzy c-means and VIKOR methods. Comput. Ind. Eng. 2015, 86, 69–82. [Google Scholar] [CrossRef]
- Chan, F.T.S.; Kumar, N. Global supplier development considering risk factors using fuzzy extended AHP-based approach. Omega-Int. J. Manag. Sci. 2007, 35, 417–431. [Google Scholar] [CrossRef]
- Wang, J.W.; Cheng, C.H.; Huang, K.C. Fuzzy hierarchical TOPSIS for supplier selection. Appl. Soft Comput. 2009, 9, 377–386. [Google Scholar] [CrossRef]
- Ustun, O.; Demirtas, E.A. An integrated multi-objective decision-making process for multi-period lot-sizing with supplier selection. Omega-Int. J. Manag. Sci. 2008, 36, 509–521. [Google Scholar] [CrossRef]
- Adobor, H.; McMullen, R. Supplier diversity and supply chain management: A strategic approach. Bus. Horiz. 2007, 50, 219–229. [Google Scholar] [CrossRef]
- Saghiri, S.S.; Barnes, S.J. Supplier flexibility and postponement implementation: An empirical analysis. Int. J. Prod. Econ. 2016, 173, 170–183. [Google Scholar] [CrossRef]
- Hosseini, S.; Barker, K. A Bayesian network model for resilience-based supplier selection. Int. J. Prod. Econ. 2016, 180, 68–87. [Google Scholar] [CrossRef]
- Zhang, H.C.; Li, J.; Merchant, M.E. Using fuzzy multi-agent decision-making in environmentally conscious supplier management. CIRP Ann-Manuf. Technol. 2003, 52, 385–388. [Google Scholar] [CrossRef]
- Humphreys, P.K.; Wong, Y.K.; Chan, F.T.S. Integrating environmental criteria into the supplier selection process. J. Mater. Process. Technol. 2003, 138, 349–356. [Google Scholar] [CrossRef]
- Humphreys, P.; McIvor, R.; Chan, F. Using case-based reasoning to evaluate supplier environmental management performance. Expert Syst. Appl. 2003, 25, 141–153. [Google Scholar] [CrossRef]
- Kannan, D.; Govindan, K.; Rajendran, S. Fuzzy Axiomatic Sesign approach based green supplier selection: A case study from Singapore. J. Clean Prod. 2015, 96, 194–208. [Google Scholar] [CrossRef]
- Mahdiloo, M.; Saen, R.F.; Lee, K.H. Technical, environmental and eco-efficiency measurement for supplier selection: An extension and application of data envelopment analysis. Int. J. Prod. Econ. 2015, 168, 279–289. [Google Scholar] [CrossRef]
- Humphreys, P.; McCloskey, A.; McIvor, R.; Maguire, L.; Glackin, C. Employing dynamic fuzzy membership functions to assess environmental performance in the supplier selection process. Int. J. Prod. Res. 2006, 44, 2379–2419. [Google Scholar] [CrossRef]
- Mafakheri, F.; Breton, M.; Ghoniem, A. Supplier selection-order allocation: A two-stage multiple criteria dynamic programming approach. Int. J. Prod. Econ. 2011, 132, 52–57. [Google Scholar] [CrossRef]
- Chen, C.C.; Tseng, M.L.; Lin, Y.H.; Lin, Z.S. Implementation of green supply chain management in uncertainty. In Proceedings of the IEEE International Conference on Industrial Engineering and Engineering Management, Macao, China, 7–10 December 2010; pp. 260–264. [Google Scholar]
- Bai, C.; Sarkis, J. Green supplier development: Analytical evaluation using rough set theory. J. Clean Prod. 2010, 18, 1200–1210. [Google Scholar] [CrossRef]
- Zhu, Q.; Sarkis, J.; Lai, K. Initiatives and outcomes of green supply chain management implementation by Chinese manufacturers. J. Environ. Manag. 2007, 85, 179–189. [Google Scholar] [CrossRef] [PubMed]
- Chiou, T.Y.; Chan, H.K.; Lettice, F.; Chung, S.H. The influence of greening the suppliers and green innovation on environmental performance and competitive advantage in Taiwan. Transp. Res. Pt. e-Logist. Transp. Rev. 2011, 47, 822–836. [Google Scholar] [CrossRef]
- Sarkis, J.; Zhu, Q.; Lai, K. An organizational theoretic review of green supply chain management literature. Int. J. Prod. Econ. 2011, 130, 1–15. [Google Scholar] [CrossRef]
- Ehrgott, M.; Reimann, F.; Kaufmann, L.; Carter, C.R. Social Sustainability in Selecting Emerging Economy Suppliers. J. Bus. Ethics 2011, 98, 99–119. [Google Scholar] [CrossRef]
- Awasthi, A.; Kannan, G. Green supplier development program selection using NGT and VIKOR under fuzzy environment. Comput. Ind. Eng. 2016, 91, 100–108. [Google Scholar] [CrossRef]
- Blome, C.; Hollos, D.; Paulraj, A. Green procurement and green supplier development: Antecedents and effects on supplier performance. Int. J. Prod. Res. 2014, 52, 32–49. [Google Scholar] [CrossRef]
- Cardozo, R.N.; Cagley, J.W. Experimental Study of Industrial Buyer Behavior. J. Mark. Res. 1971, 8, 329–334. [Google Scholar] [CrossRef]
- Taylor, T.A.; Plambeck, E.L. Supply chain relationships and contracts: The impact of repeated interaction on capacity investment and procurement. Manag. Sci. 2007, 53, 1577–1593. [Google Scholar] [CrossRef]
- Monczka, R.M.; Petersen, K.J.; Handfield, R.B.; Ragatz, G.L. Success factors in strategic supplier alliances: The buying company perspective. Decis. Sci. 1998, 29, 553–577. [Google Scholar] [CrossRef]
- Chen, I.J.; Popovich, K. Understanding customer relationship management (CRM): People, process and technology. Bus. Process. Manag. J. 2003, 9, 672–688. [Google Scholar] [CrossRef]
- Tallon, P.P.; Kraemer, K.L.; Gurbaxani, V. Executives’ perceptions of the business value of information technology: A process-oriented approach. J. Manag. Inform. Syst. 2000, 16, 145–173. [Google Scholar] [CrossRef]
- González-Benito, J. A theory of purchasing’s contribution to business performance. J. Oper. Manag. 2007, 25, 901–917. [Google Scholar] [CrossRef]
- Shen, L.; Olfat, L.; Govindan, K.; Khodaverdi, R.; Diabat, A. A fuzzy multi criteria approach for evaluating green supplier’s performance in green supply chain with linguistic preferences. Resour. Conserv. Recycl. 2013, 74, 170–179. [Google Scholar] [CrossRef]
- Carter, C.R.; Jennings, M.M. The role of purchasing in the socially responsible management of the supply chain: A structural equation analysis. J. Bus. Logist. 2004, 25, 145–186. [Google Scholar] [CrossRef]
- Hillman, A.J.; Keim, G.D. Shareholder value, stakeholder management, and social issues: What’s the bottom line? Strateg. Manag. J. 2001, 22, 125–139. [Google Scholar] [CrossRef]
- Jabbour, A.B.L.S.; Jabbour, C.J.C. Are supplier selection criteria going green? Case studies of companies in Brazil. Ind. Manag. Data Syst. 2009, 109, 477–495. [Google Scholar] [CrossRef]
- Huber, V.L.; Neale, M.A.; Nofthcraft, G.B. Judgment by heuristics: Effects of ratee and rater characteristics and performance standards on performance-related judgments. Organ. Behav. Hum. Decis. 1987, 40, 149–169. [Google Scholar] [CrossRef]
- Chan, L.K.; Kao, H.P.; Wu, M.L. Rating the importance of customer needs in quality function deployment by fuzzy and entropy methods. Int. J. Prod. Res. 1999, 37, 2499–2518. [Google Scholar] [CrossRef]
- Ashlaghi, M.J. A new approach to green supplier selection based on fuzzy multi-criteria decision making method and linear physical programming. Teh. Vjesn. 2014, 21, 591–597. [Google Scholar]
- Sarkar, A.; Mohapatra, P.K.J. Evaluation of supplier capability and performance: A method for supply base reduction. J. Purch. Supply Manag. 2006, 12, 148–163. [Google Scholar] [CrossRef]
- Kilincci, O.; Onal, S.A. Fuzzy AHP approach for supplier selection in a washing machine company. Expert Syst. Appl. 2011, 38, 9656–9664. [Google Scholar] [CrossRef]
- Shaw, K.; Shankar, R.; Yadav, S.S.; Thakur, L.S. Supplier selection using fuzzy AHP and fuzzy multi-objective linear programming for developing low carbon supply chain. Expert Syst. Appl. 2012, 39, 8182–8192. [Google Scholar] [CrossRef]
- Thongchattu, C.; Siripokapirom, S. Notice of retraction green supplier selection consensus by neural network. In Proceedings of the 2nd International Conference on Mechanical and Electronics Engineering, Kyoto, Japan, 1–3 August 2010; pp. 313–316. [Google Scholar]
- Yan, G. Research on green suppliers’ evaluation based on AHP & Genetic algorithm. In Proceedings of the International Conference on Signal Processing Systems (ICSPS), Singapore, 15–17 May 2009; pp. 615–619. [Google Scholar]
- Ramanathan, R. Supplier selection problem: Integrating DEA with the approaches of total cost of ownership and AHP. Supply Chain Manag. 2007, 12, 258–261. [Google Scholar] [CrossRef]
- Hatefi, S.M.; Tamosaitiene, J. Construction projects assessment based on the sustainable development criteria by an integrated fuzzy AHP and improved GRA model. Sustainability 2018, 10, 991. [Google Scholar] [CrossRef]
- Junior, F.R.L.; Osiro, L.; Carpinetti, L.C.R. A comparison between fuzzy AHP and fuzzy TOPSIS methods to supplier selection. Appl. Soft Comput. 2014, 21, 194–209. [Google Scholar] [CrossRef]
- Beikkhakhian, Y.; Javanmardi, M.; Karbasian, M.; Khayambashi, B. The application of ISM model in evaluating agile suppliers selection criteria and ranking suppliers using fuzzy TOPSIS-AHP methods. Expert Syst. Appl. 2015, 42, 6224–6236. [Google Scholar] [CrossRef]
- Vinodh, S.; Anesh Ramiya, R.; Gautham, S.G. Application of fuzzy analytic network process for supplier selection in a manufacturing organisation. Expert Syst. Appl. 2011, 38, 272–280. [Google Scholar] [CrossRef]
- Kuo, R.J.; Lin, Y.J. Supplier selection using analytic network process and data envelopment analysis. Int. J. Prod. Res. 2012, 50, 2852–2863. [Google Scholar] [CrossRef]
- Chung, C.C.; Chao, L.C.; Lou, S.J. The establishment of a green supplier selection and guidance mechanism with the ANP and IPA. Sustainability 2016, 8, 259. [Google Scholar] [CrossRef]
- Kilic, H.S.; Zaim, S.; Delen, D. Selecting “The Best” ERP system for SMEs using a combination of ANP and PROMETHEE methods. Expert Syst. Appl. 2015, 42, 2343–2352. [Google Scholar] [CrossRef]
- Tadić, S.; Zečević, S.; Krstić, M. A novel hybrid MCDM model based on fuzzy DEMATEL, fuzzy ANP and fuzzy VIKOR for city logistics concept selection. Expert Syst. Appl. 2014, 41, 8112–8128. [Google Scholar] [CrossRef]
- Lin, R.H. An integrated model for supplier selection under a fuzzy situation. Int. J. Prod. Econ. 2012, 138, 55–61. [Google Scholar] [CrossRef]
- Chen, J.K.; Chen, I.S. Using a novel conjunctive MCDM approach based on DEMATEL, fuzzy ANP, and TOPSIS as an innovation support system for Taiwanese higher education. Expert Syst. Appl. 2010, 37, 1981–1990. [Google Scholar] [CrossRef]
- Vujanović, D.; Momčilović, V.; Bojović, N.; Papić, V. Evaluation of vehicle fleet maintenance management indicators by application of DEMATEL and ANP. Expert Syst. Appl. 2012, 39, 10552–10563. [Google Scholar] [CrossRef]
- Wu, C.S.; Lin, C.T.; Lee, C. Optimal marketing strategy: A decision-making with ANP and TOPSIS. Int. J. Prod. Econ. 2010, 127, 190–196. [Google Scholar] [CrossRef]
- Sevkli, M.; Oztekin, A.; Uysal, O.; Torlak, G.; Turkyilmaz, A.; Delen, D. Development of a fuzzy ANP based SWOT analysis for the airline industry in Turkey. Expert Syst. Appl. 2012, 39, 14–24. [Google Scholar] [CrossRef]
- Azadi, M.; Jafarian, M.; Mirhedayatian, S.M.; Mirhedayatian, S.M. A new fuzzy DEA model for evaluation of efficiency and effectiveness of suppliers in sustainable supply chain management context. Comput. Oper. Res. 2015, 54, 274–285. [Google Scholar] [CrossRef]
- Fallahpour, A.; Olugu, E.U.; Musa, S.N.; Khezrimotlagh, D.; Wong, K.Y. An integrated model for green supplier selection under fuzzy environment: Application of data envelopment analysis and genetic programming approach. Neural Comput. Appl. 2016, 27, 707–725. [Google Scholar] [CrossRef]
- Li, X.; Zhao, C. Selection of suppliers of vehicle components based on green supply chain. In Proceedings of the 16th International Conference on Industrial Engineering and Engineering Management, Beijing, China, 21–23 October 2009; pp. 1588–1591. [Google Scholar]
- Dou, Y.; Zhu, Q.; Sarkis, J. Evaluating green supplier development programs with a grey-analytical network process-based methodology. Eur. J. Oper. Res. 2014, 233, 420–431. [Google Scholar] [CrossRef]
- Fu, X.; Zhu, Q.; Sarkis, J. Evaluating green supplier development programs at a telecommunications systems provider. Int. J. Prod. Econ. 2012, 140, 357–367. [Google Scholar] [CrossRef]
- Su, C.M.; Horng, D.J.; Tseng, M.L.; Chiu, A.S.F.; Wu, K.J.; Chen, H.P. Improving sustainable supply chain management using a novel hierarchical grey-DEMATEL approach. J. Clean Prod. 2016, 134, 469–481. [Google Scholar] [CrossRef]
- Govindan, K.; Sivakumar, R. Green supplier selection and order allocation in a low-carbon paper industry: Integrated multi-criteria heterogeneous decision-making and multi-objective linear programming approaches. Ann. Oper. Res. 2016, 238, 243–276. [Google Scholar] [CrossRef]
- Zandi, A.; Roghanian, E. Extension of fuzzy ELECTRE based on VIKOR method. Comput. Ind. Eng. 2013, 66, 258–263. [Google Scholar] [CrossRef]
- Opricovic, S. Multicriteria Optimization of Civil Engineering Systems; Faculty of Civil Engineering: Belgrade, Serbia, 1998. [Google Scholar]
- Ou Yang, Y.P.; Shieh, H.M.; Tzeng, G.H. A VIKOR technique based on DEMATEL and ANP for information security risk control assessment. Inf. Sci. 2013, 232, 482–500. [Google Scholar] [CrossRef]
- Sayadi, M.K.; Heydari, M.; Shahanaghi, K. Extension of VIKOR method for decision making problem with interval numbers. Appl. Math. Modell. 2009, 33, 2257–2262. [Google Scholar] [CrossRef]
- Liu, H.C.; Liu, L.; Liu, N.; Mao, L.X. Risk evaluation in failure mode and effects analysis with extended VIKOR method under fuzzy environment. Expert Syst. Appl. 2012, 39, 12926–12934. [Google Scholar] [CrossRef]
- Li, S.Y.; Li, H.X. An approximation method of intuitionistic fuzzy numbers. J. Intell. Fuzzy Syst. 2017, 32, 4343–4355. [Google Scholar] [CrossRef]
- You, X.Y.; You, J.X.; Liu, H.C.; Zhen, L. Group multi-criteria supplier selection using an extended VIKOR method with interval 2-tuple linguistic information. Expert Syst. Appl. 2015, 42, 1906–1916. [Google Scholar] [CrossRef]
- Liu, P.D.; Jin, F. A multi-attribute group decision-making method based on weighted geometric aggregation operators of interval-valued trapezoidal fuzzy numbers. Appl. Math. Modell. 2012, 36, 2498–2509. [Google Scholar] [CrossRef]
- Saaty, T.L. Decision Making with Dependence and Feedback: The Analytic Network Process; RWS Publications: Pittsburgh, PA, USA, 1996. [Google Scholar]
- Gabus, A.; Fontela, E. World Problems, an Invitation to Further Thought within the Framework of DEMATEL; Battelle Geneva Research Centre: Geneva, Switzerland, 1972; pp. 1–8. [Google Scholar]
- Wu, W.W. Choosing knowledge management strategies by using a combined ANP and DEMATEL approach. Expert Syst. Appl. 2008, 35, 828–835. [Google Scholar] [CrossRef]
- Lioua, J.J.H.; Tzengb, G.H.; Changa, H.C. Airline safety measurement using a hybrid model. J. Air Transp. Manag. 2007, 13, 243–249. [Google Scholar] [CrossRef]
- Li, C.W.; Tzeng, G.H. Identification of a threshold value for the DEMATEL method: Using the maximum mean De-Entropy algorithm. Expert Syst. Appl. 2009, 36, 9891–9898. [Google Scholar] [CrossRef]
- Tzeng, G.; Chiang, C.; Li, C. Evaluating intertwined effects in e-learning programs: A novel hybrid MCDM model based on factor analysis and DEMATEL. Expert Syst. Appl. 2007, 32, 1028–1044. [Google Scholar] [CrossRef]
- Wu, W.W.; Lee, Y.T. Developing global managers’ competencies using the fuzzy DEMATEL method. Expert Syst. Appl. 2007, 32, 499–507. [Google Scholar] [CrossRef]
- Tsai, W.H.; Chou, W.C. Selecting management systems for sustainable development in SMEs: A novel hybrid model based on DEMATEL, ANP, and ZOGP. Expert Syst. Appl. 2009, 36, 1444–1458. [Google Scholar] [CrossRef]
- Zhang, S.F.; Liu, S.Y.; Zhai, R.H. An extended GRA method for MCDM with interval-valued triangular fuzzy assessments and unknown weights. Comput. Ind. Eng. 2011, 61, 1336–1341. [Google Scholar] [CrossRef]
- Ashtiani, B.; Haghighirad, F.; Makui, A.; Montazer, G.A. Extension of fuzzy TOPSIS method based on interval-valued fuzzy sets. Appl. Soft Comput. 2009, 9, 457–461. [Google Scholar] [CrossRef]


| Organizational Objectives | Relationship in Supply Chain | The Number of Suppliers | Evaluation Standards | |
|---|---|---|---|---|
| Traditional suppliers | Maximum benefit of economy | Short-term and rival strategy | Scattered suppliers | Price, quality and delivery |
| Green suppliers | Maximum benefits of economy and environment | Green cooperation and competition | Suppliers integration | Economy and environment |
| Sustainable suppliers | Maximum benefits of economy, society and environment | Partner for creating new value through SSCM | Suppliers integration | Considering the TBL factors |
| Criteria | Explanations | Related Attributes | References |
|---|---|---|---|
| Cost/price | The final cost to purchase a unit of raw or semi-finished products. | Product cost, logistics cost, ordering cost, inventory cost, warranty cost, maintenance cost, manufacturing cost | [2,18,63,74,75,76,77,78,79] |
| Quality | The performance of materials purchased to meet or exceed the requirements and expectations in service or product that were committed to. | ISO quality system, product performance, warranties and claim policies, repair and return rate | [12,63,75,77,80,81] |
| Technology capability | The sum of all the knowledge of an enterprise in support of technological innovation. | Manufacturing facilities, informatization level for the enterprise, technological compatibility | [2,6,75,82,83] |
| Production capacity | The ability of human, financial, and material resources that is related to the product manufacturing. | New launch of products, supply capacity, product advantage, production facilities | [67,79,84] |
| Financial capability | The capital needed to maintain normal business activities for an enterprise during a certain period of time. | Financial position, debt ratio and current ratio, profit/sale trends, finance stability, interest on payment purchasing | [75,85,86,87] |
| Delivery | The capability of transporting goods from a source location to a predefined destination. | Lead time, on time, safety and security of components, delivery reliability | [21,74,77,79,88,89] |
| Service | The efficiency of scheduling and ability to handle changing orders, after-sales responsibility of suppliers, as well as motivation to share skills to solve problems. | Standard of service, punctuality, responsiveness, service capability, value added services to customers, information acquisition | [63,75,77,90,91] |
| Relationship | Determining the willingness to establish long-term and close business relations with suppliers to jointly develop the market. | Long term relationship, communication openness, reputation for integrity, relationship closeness | [64,81,82,92,93] |
| Flexibility | Demand that can be profitably sustained, and time or cost required to add new products to existing production operations. | Product volume changes, short set-up time, conflict resolution, using flexible machines | [18,64,81,82,91,94,95,96] |
| Criteria | Explanations | Related Attributes | References |
|---|---|---|---|
| Green image | The identity that consumers prioritize environmental conservation and sustainable business practices. | Ratio of green customers to total customers, green customers market share, green materials coding and recording | [14,66,78,80,97,98,99] |
| Environmental management system | A system that comprehensively evaluates the internal and external environmental performance of an organization. | Environmental certificates such as ISO 14000, green process planning, regulatory compliance, environmental policies | [63,75,77,80,81,97,98] |
| Environmental competencies | The capacity to balance the containment relationships between economic and environmental performance for an enterprise. | Technical transformation ability, ability to change process and product for reducing the impact on natural resources, carbon footprint reduction | [14,50,66,80,97,100,101,102] |
| Pollution control | The control of pollutants that are released into air, water, or soil. | Remediation, end-of-pipe controls, air emissions, waste water, pollution control capability, pollution reduction capability | [66,74,78,97,99] |
| Green product | Environmentally conscious products, which are pollution-free, resource-saving, or renewable and recyclable. | Use of recycled and nontoxic materials, green packaging, reuse, re-manufacture, disposal | [6,13,14,81,97] |
| Resource consumption | The use of non-renewable, or less often, renewable resources. | Consumption of resources in terms of raw material, energy, and water | [68,75,78,97] |
| ECO-design | An approach to designing products with special consideration for the environmental impacts of the product during its whole lifecycle. | Design for resource efficiency, design of products for reuse, recycle, and recovery of material, design for reduction or elimination of hazardous materials | [13,77,85,89,97,98,103] |
| GSCM | Considering environmental issues on supply chain; focusing the coordination between economy and environment. | Commitment of senior managers to support and improve green supply chain management initiatives, GSCM practice | [6,14,50,66,78,81,104,105] |
| Green technology innovation | The ability to continuously update environmental technologies to achieve the goal of minimizing the sum of product life cycle costs. | Green technology capabilities, recycling product design, renewable product design, redesign of product, green R&D project, green process | [66,77,78,99,105,106,107] |
| Criteria | Explanations | Related Attributes | References |
|---|---|---|---|
| The rights of the employee | A group of legal rights and claimed human rights having to do with labor relations between workers and their employers. | Staff training on sustainable issues, equity labor sources, disciplinary and security practices, employee contracts | [6,16,18,63,85,99] |
| The rights of stakeholders | The right or welfare belonging to the person who holds the stake or some relevant interests in the private sector. | Partnership standards, share level, stakeholder empowerment, stakeholder engagement, consumers education, | [43,63,68,99,108] |
| Work safety and health | Concerned with the safety, health, and welfare of people at work. | Health and safety incidents, health and safety practices | [4,50,67,74,82,109] |
| Local community influence | Neighboring relations between the company and the local government, the community and all residents, representing the public image of the organization. | Service infrastructure, social pathologies, regulatory and public services, grants and donations, supporting community projects | [68,73,74] |
| Respect for the law and policy | Enterprises comply with all laws and regulations of the country, assume legal obligations, and promote good social public morals. | Regulatory and public services, ethical issues and legal complain, power | [17,63,77,99,110] |
| Staff Training | The process of enhancing the skills, capabilities, and knowledge of employees for a particular job. | Flexible working arrangements, job opportunities, career development | [15,18,66,68] |
| Information disclosure | Providing information to stakeholders about the materials used, carbon emissions, toxins released during production, and so on. | Transparency, information publicity, voluntary disclosure, public disclosure | [4,7,29,43,63] |
| Child and forced labor | The employment of children in any work that deprives them of their childhood and ability to attend regular school. | Child labor avoidance | [7] |
| Primary Criteria | Second Grade Criteria | Explanations | Reference/Basis |
|---|---|---|---|
| Corporate Reputation (CR) | Position in industry * | The market appeal, voice and dominant ability. | [111] |
| Financial status | Funds-collection and application within a certain period, reflecting whether the capital flow is smooth. | [75,85] | |
| Contractual capacity * | The actual ability to perform economic contracts. | [112] | |
| Strategic alliance * | The compatibility of long-term strategies and plans. | [113] | |
| Operational Management (OM) | Business process management * | The ability to coordinate logistics, business, and information flow, and to discover, analyze, optimize, and automate business processes. | [114,115] |
| Technical support | The ability to use computer and network technology to make decisions. | [75,82] | |
| Quality management | Through quality planning, control, assurance and improvement to ensure product consistency. | [12,99] | |
| Learning * and Innovation | Through learning to enable firms to make continuous innovations, and improve their ability to adapt to the change. | [18,75] | |
| Product Advantage (PA) | Procurement cost | Constituted by the purchase price and the costs incurred for the purchase of goods. | [91,99] |
| Product quality | The embodiment of the use value of products, including the intrinsic quality and appearance quality. | [90] | |
| Supply flexibility | The ability to quickly respond to different product demands. | [101] | |
| Product market share | The proportion of a company’s sales volume (or sales profit) in the market. | [112,116] | |
| Service Capability (SC) | Responsiveness | The ability to quickly identify, react to, and recover from the changes. | [99] |
| Timely delivery | The ability to deliver goods on time, usually expressed on a timely delivery rate. | [88,99] | |
| Customer satisfaction * | How the products and services supplied by a company meet or surpass customer expectation. | [110,116] | |
| Maintenance and Compensation * | The after-sales service ability for defective products or equipment, including recall. | [16,18] | |
| Green Impact (GI) | Pollution production | Environmental pollution caused by the production of products. | [104,117] |
| Pollution control | Control and reduce the pollution caused by the production process. | [99] | |
| Energy consumption | The consumption of energy or power produced in the production. | [75,118] | |
| Ecologic design | Consideration of the environmental impact of the entire product life cycle at the design stage. | [85] | |
| Social Responsibility (SR) | Labor relations record | Historic records revealing the relationship between labor and enterprise. | [99] |
| Governmental relations * | The ability of an enterprise to be trusted, supported, and cooperated with the government | [110] | |
| Community welfare investment | Charity and welfare services to local communities. | [74] | |
| Shareholder contract * | Safeguarding the interests of shareholders and bringing value to the shareholders. | [119] |
| Methods | Extension | Forms | References |
|---|---|---|---|
| AHP | Fuzzy AHP | Fuzzy AHP | [77,125,126] |
| Integrated AHP | AHP and ANN | [127] | |
| AHP and GA 1 | [128] | ||
| AHP and DEA | [129] | ||
| AHP and GRA | [130] | ||
| AHP and MP | [126] | ||
| AHP and Fuzzy TOPSIS | [16,131,132] | ||
| AHP and VIKOR | [29] | ||
| AHP and Entropy and TOPSIS | [49] | ||
| ANP | Fuzzy ANP | Fuzzy ANP | [6,133] |
| Integrated ANP | ANP and DEA | [134] | |
| ANP and QFD 2 | [17] | ||
| ANP and IPA 3 | [135] | ||
| ANP and RST 4 | [104] | ||
| ANP and PROMETHEE | [136] | ||
| ANP and VIKOR | [137] | ||
| ANP and LP | [138] | ||
| DEMATEL | [139,140] | ||
| TOPSIS | [141] | ||
| Fuzzy ANP and SWOT 5 | [142] | ||
| DEA | Fuzzy DEA | Fuzzy DEA | [100,143] |
| DEA and ANN | [144] | ||
| DEA, ANP and ANN | [63] | ||
| DEA and MOLP 6 | [100] | ||
| DEA and RST | [5] | ||
| DEA and DE 7 and MODE 8 | [30] | ||
| GRA | Fuzzy GRA | Fuzzy GRA | [103] |
| Integrated GRA | GRA and AHP | [145] | |
| GRA and ANP | [2,146] | ||
| GS 9 and RST | [50] | ||
| GRA and DEMATEL | [147,148] | ||
| TOPSIS | Fuzzy TOPSIS | Fuzzy TOPSIS | [65,66,68,149] |
| Integrated TOPSIS | DEMATEL-ANP-TOPSIS | [76] | |
| TOPSIS and ANN | [72] | ||
| VIKOR | Fuzzy VIKOR | Fuzzy VIKOR | [25] |
| Integrated VIKOR | VIKOR and AHP | [29] | |
| VIKOR and NGT 10 | [109] | ||
| VIKOR and fuzzy ELECTRE | [150] |
| Linguistic Preference | Abbreviation | IVTFNs |
|---|---|---|
| Very poor | VP | (0, 0, 0, 1, 1.5) |
| Poor | P | (0, 0.5, 1, 2.5, 3.5) |
| Moderately poor | MP | (0, 1.5, 3, 4.5, 5.5) |
| Fair | F | (2.5, 3.5, 5, 6.5, 7.5) |
| Moderately good | MG | (4.5, 5.5, 7, 8, 9.5) |
| Good | G | (5.5, 7.5, 9, 9.5, 10) |
| Very good | VG | (8.5, 9.5, 10, 10, 10) |
| A1 | A2 | A3 | A4 | |
|---|---|---|---|---|
| Feature | Newly-built | Competitive | Longer established | Second largest |
| Strengths | Lower price Higher delivery | Substitutable Moderate in price | Good reputation Quality assurance | Quality assurance Strategic alliance |
| Weaknesses | Weaker voice in the supply chain | Substitute product | Weaker delivery and response | Smaller community contributions |
| Primary Criteria | Second Grade Criteria | Criteria Type | Data Type | Classification |
|---|---|---|---|---|
| CR (AS1) | Position in industry (c1) | Qualitative | Linguistic variable 1 | B |
| Financial status (c2) | Qualitative | Linguistic variable | B | |
| Contractual capacity (c3) | Qualitative | Linguistic variable | B | |
| Strategic alliance (c4) | Qualitative | Linguistic variable | B | |
| OM (AS2) | Business process management (c5) | Qualitative | Linguistic variable | B |
| Technical support (c6) | Qualitative | Linguistic variable | B | |
| Quality management (c7) | Qualitative | Linguistic variable | B | |
| Learning & Innovation (c8) | Qualitative | Linguistic variable | B | |
| PA(AS3) | Procurement cost (c9) | Quantitative | Interval number | C |
| Product quality (c10) | Qualitative | Linguistic variable | B | |
| Supply flexibility (c11) | Quantitative | Precise number | B | |
| Product market share (c12) | Quantitative | Precise number | B | |
| SC (AS4) | Responsiveness (c13) | Quantitative | Precise number | B |
| Timely delivery (c14) | Quantitative | Precise number | B | |
| Customer satisfaction (c15) | Qualitative | Linguistic variable | B | |
| Maintenance & Compensation (c16) | Qualitative | Linguistic variable | B | |
| GI (AS5) | Pollution production (c17) | Qualitative | Linguistic variable | C |
| Pollution control (c18) | Qualitative | Linguistic variable | B | |
| Energy consumption (c19) | Qualitative | Linguistic variable | C | |
| Ecologic design (c20) | Qualitative | Linguistic variable | B | |
| SR (AS6) | Labor relations record (c21) | Qualitative | Linguistic variable | B |
| Governmental relations (c22) | Qualitative | Linguistic variable | B | |
| Community welfare investment (c23) | Qualitative | Linguistic variable | B | |
| Shareholder contract (c24) | Qualitative | Linguistic variable | B |
| AS1 | AS2 | AS3 | AS4 | AS5 | AS6 | |
|---|---|---|---|---|---|---|
| AS1 | 0 | 2.95 | 3.15 | 3.25 | 3.05 | 3.25 |
| AS2 | 2.8 | 0 | 2.8 | 3 | 2.2 | 2.25 |
| AS3 | 3 | 2.5 | 0 | 2 | 2.25 | 2 |
| AS4 | 3.1 | 1.95 | 2.2 | 0 | 1.65 | 2 |
| AS5 | 2.25 | 2 | 2.7 | 2.05 | 0 | 2.3 |
| AS6 | 3 | 2.1 | 2.3 | 2.15 | 2.25 | 0 |
| AS1 | AS2 | AS3 | AS4 | AS5 | AS6 | |
|---|---|---|---|---|---|---|
| AS1 | 1.727 | 0.770 | 0.851 | 0.825 | 0.769 | 0.797 |
| AS2 | 0.778 | 1.526 | 0.740 | 0.724 | 0.644 | 0.663 |
| AS3 | 0.738 | 0.624 | 1.544 | 0.634 | 0.608 | 0.611 |
| AS4 | 0.709 | 0.569 | 0.634 | 1.489 | 0.550 | 0.581 |
| AS5 | 0.676 | 0.577 | 0.665 | 0.610 | 1.459 | 0.601 |
| AS6 | 0.739 | 0.605 | 0.672 | 0.641 | 0.608 | 1.498 |
| AS1 | AS2 | AS3 | AS4 | AS5 | AS6 | C | C+R | C-R | |
|---|---|---|---|---|---|---|---|---|---|
| AS1 | 0.727 | 0.770 | 0.851 | 0.825 | 0.769 | 0.797 | 4.738 | 9.105 | 0.372 |
| AS2 | 0.778 | 0.000 | 0.740 | 0.724 | 0.644 | 0.663 | 3.550 | 6.694 | 0.405 |
| AS3 | 0.738 | 0.624 | 0.000 | 0.634 | 0.608 | 0.611 | 3.214 | 6.776 | (0.348) |
| AS4 | 0.709 | 0.569 | 0.634 | 0.000 | 0.000 | 0.581 | 2.492 | 5.925 | (0.942) |
| AS5 | 0.676 | 0.577 | 0.665 | 0.610 | 0.000 | 0.601 | 3.129 | 5.758 | 0.499 |
| AS6 | 0.739 | 0.605 | 0.672 | 0.641 | 0.608 | 0.000 | 3.265 | 6.517 | 0.013 |
| R | 0.727 | 0.770 | 0.851 | 0.825 | 0.769 | 0.797 | - | - | - |
| AS1(0.112) | AS2(0.132) | |||||||
| c1 | c2 | c3 | c4 | c5 | c6 | c7 | c8 | |
| Local weight | 0.237 | 0.319 | 0.241 | 0.203 | 0.203 | 0.156 | 0.271 | 0.370 |
| Global weight | 0.033 | 0.044 | 0.033 | 0.028 | 0.029 | 0.022 | 0.038 | 0.052 |
| AS3(0.229) | AS4(0.150) | |||||||
| c9 | c10 | c11 | c12 | c13 | c14 | c15 | c16 | |
| Local weight | 0.311 | 0.268 | 0.230 | 0.191 | 0.419 | 0.144 | 0.297 | 0.140 |
| Global weight | 0.068 | 0.059 | 0.050 | 0.042 | 0.063 | 0.022 | 0.045 | 0.021 |
| AS5(0.147) | AS6(0.230) | |||||||
| c17 | c18 | c19 | c20 | c21 | c22 | c23 | c24 | |
| Local weight | 0.120 | 0.302 | 0.207 | 0.371 | 0.318 | 0.264 | 0.145 | 0.273 |
| Global weight | 0.016 | 0.039 | 0.027 | 0.048 | 0.071 | 0.059 | 0.032 | 0.061 |
| C9 (USD/box) | C11 (%) | C12 (%) | C13 (%) | C14 (%) | ||
|---|---|---|---|---|---|---|
| D1 | A1 | [9,13] | 30 | 8 | 80 | 96 |
| A2 | [11,15] | 18 | 14 | 78 | 92 | |
| A3 | [12,16] | 10 | 40 | 92 | 83 | |
| A4 | [13,17] | 15 | 32 | 81 | 86 | |
| D2 | A1 | [11,15] | 13 | 9 | 82 | 95 |
| A2 | [13,17] | 16 | 17 | 80 | 90 | |
| A3 | [15,19] | 12 | 37 | 90 | 86 | |
| A4 | [14,18] | 7 | 30 | 82 | 93 | |
| D3 | A1 | [8,12] | 9 | 7 | 81 | 94 |
| A2 | [10,14] | 14 | 18 | 82 | 88 | |
| A3 | [16,20] | 11 | 36 | 87 | 83 | |
| A4 | [10,14] | 8 | 29 | 83 | 90 | |
| D4 | A1 | [12,16] | 10 | 8 | 81 | 95 |
| A2 | [10,14] | 14 | 15 | 80 | 90 | |
| A3 | [17,21] | 13 | 39 | 91 | 88 | |
| A4 | [11,15] | 7 | 29 | 92 | 91 | |
| Criteria | D1 | D2 | D3 | D4 | ||||||||||||
|---|---|---|---|---|---|---|---|---|---|---|---|---|---|---|---|---|
| A1 | A2 | A3 | A4 | A1 | A2 | A3 | A4 | A1 | A2 | A3 | A4 | A1 | A2 | A3 | A4 | |
| C1 | F | MG | VG | VG | F | MG | VG | VG | F | MG | VG | VG | F | MG | VG | VG |
| C2 | F | F | G | G | MG | P | VG | G | F | F | MG | G | MP | MG | G | G |
| C3 | VG | MG | MG | MG | VG | F | G | MG | VG | G | F | F | VG | MG | MG | G |
| C4 | F | G | F | G | MG | MG | MG | VG | F | VG | MP | MG | F | G | F | G |
| C5 | P | F | MG | VG | VP | MP | F | VG | MP | MG | MG | VG | P | F | G | VG |
| C6 | F | F | F | VG | MP | F | F | VG | MG | MG | F | VG | F | MP | F | VG |
| C7 | P | MP | G | G | MP | P | G | VG | MP | MP | MG | MG | MP | MP | VG | G |
| C8 | VG | MG | MP | F | VG | G | MP | MG | VG | F | P | MP | G | MG | MP | F |
| C10 | MG | F | G | G | G | MG | VG | G | F | F | MG | G | MG | MP | G | G |
| C15 | MG | MP | MP | G | G | MP | MP | VG | F | MP | P | MG | MG | P | MP | G |
| C16 | VG | MG | MG | G | VG | G | F | G | VG | F | MG | G | VG | MG | G | MG |
| C17 | VG | MG | F | G | VG | G | MG | VG | G | F | MP | G | VG | MG | F | MG |
| C18 | MG | MG | MG | G | G | MG | F | G | G | F | MG | G | F | G | G | G |
| C19 | MG | F | MG | F | G | MG | G | F | F | MP | F | MG | MG | F | MG | MP |
| C20 | VP | F | G | MG | VP | MP | VG | G | VP | MG | G | F | VP | F | MG | G |
| C21 | G | MG | G | VG | VG | F | G | VG | MG | MG | VG | VG | G | G | MG | VG |
| C22 | MG | MP | MG | MG | G | P | G | MG | MG | MP | F | F | F | MP | F | G |
| C23 | MG | F | MG | VP | MG | MP | G | MP | F | MG | MG | P | G | F | F | VP |
| C24 | VG | MG | F | MG | VG | G | F | MG | VG | MG | MP | F | VG | F | MG | G |
| C1 | C2 | C3 | C4 | C5 | C6 | |
| A1 | [(2.5, 3.5), 5, (6.5, 7.5)] | [(2.38, 3.5), 5, (6.38, 7.5)] | [(8.5, 9.5), 10, (10.0, 10)] | [(3.0, 4.0), 5.5, (6.88, 8.0)] | [(0, 0.63), 1.25, (2.65, 3.5)] | [(2.38, 3.5), 5, (6.38, 7.5)] |
| A2 | [(4.5, 5.5), 7, (8.0, 9.5)] | [(2.38, 3.25), 4.5, (5.88, 7)] | [(4.25, 5.5), 7, (8.0, 9.13)] | [(6, 7.5), 8.75, (9.25, 9.88)] | [(2.38, 3.5), 5, (6.38, 7.5)] | [(2.38, 3.5), 5, (6.38, 7.5)] |
| A3 | [(8.5, 9.5), 10, (10, 10)] | [(6, 7.5), 8.75, (9.25, 9.88)] | [(4.25, 5.5), 7, (8.0, 9.13)] | [(2.38, 3.5), 5, (6.38, 7.5)] | [(4.25, 5.5), 7.0, (8, 9.13)] | [(2.5, 3.5), 5, (6.5, 7.5)] |
| A4 | [(8.5, 9.5), 10, (10, 10)] | [(5.5, 7.5), 9, (9.0, 10.0)] | [(4.25, 5.5), 7, (8.0, 9.13)] | [(6, 7.5), 8.75, (9.25, 9.88)] | [(8.5, 9.5), 10, (10.0, 10.0)] | [(8.5, 9.5), 10, (10.0, 10)] |
| C7 | C8 | C9 | C10 | C11 | C12 | |
| A1 | [(1.25, 2.5), 4, (5.5, 6.5)] | [(7.75, 9), 9.75, (9.88, 10)] | [(7.14, 7.69), 8.33, (9.09, 10.0)] | [(4.25, 5.5), 7, (8.0, 9.13)] | [(10, 10), 10, (10, 10)] | [(2.1, 2.1), 2.11, (2.1, 2.1)] |
| A2 | [(0.0, 1.25), 2.5, (4, 5.0)] | [(4.25, 5.5), 7, (8.0, 9.13)] | [(6.67, 7.14), 7.69, (8.33, 9.09)] | [(2.38, 3.5), 5, (6.38, 7.5)] | [(6.0, 6.0), 6, (6.0, 6.0)] | [(4.2, 4.2), 4.21, (4.2, 4.2)] |
| A3 | [(6, 7.5), 8.75, (9.25, 9.88)] | [(0.0, 1.25), 2.5, (4.0, 5.0)] | [(5.26, 5.56), 5.88, (6.25, 6.67)] | [(6, 7.5), 8.75, (9.25, 9.88)] | [(3.3, 3.3), 3.3, (3.3, 3.3)] | [(10, 10), 10, (10.0, 10.0)] |
| A4 | [(6, 7.5), 8.75, (9.25, 9.88)] | [(2.38, 3.5), 5, (6.38, 7.5)] | [(6.25, 6.67), 7.14, (7.69, 8.33)] | [(5.5, 7.5), 9, (9.5, 10.0)] | [(5.0, 5.0), 5.0, (5.0, 5.0)] | [(7.9, 7.9), 7.89, (7.9, 7.9)] |
| C13 | C14 | C15 | C16 | C17 | C18 | |
| A1 | [(9.0, 9.0), 9, (9.0, 9.0)] | [(10, 10.0), 10, (10, 10.0)] | [(4.25, 5.5), 7, (8.0, 9.13)] | [(8.5, 9.5), 10, (10.0, 10.0)] | [(7.75, 9), 9.75, (9.88, 10)] | [(4.5, 6.0), 7.5, (8.38, 9.25)] |
| A2 | [(8.9, 8.9), 8.89, (8.9, 8.9)] | [(9.5, 9.5), 9.47, (9.5, 9.5)] | [(0.0, 1.25), 2, 5, (4.0, 5.0)] | [(4.25, 5.5), 7, (8.0, 9.13)] | [(4.25, 5.5), 7, (8.0, 9, 13)] | [(4.25, 5.5), 7, (8.0, 9.13)] |
| A3 | [(10, 10.0), 10, (10, 10.0)] | [(8.9, 8.9), 8.95, (8.9, 8.9)] | [(0.0, 1.25), 2.5, (4.0, 5.0)] | [(4.25, 5.5), 7, (8.0, 9.13)] | [(2.38, 3.5), 5, (6.38, 7.5)] | [(4.25, 5.5), 7, (8.0, 9.13)] |
| A4 | [(9.1, 9.1), 9.11, (9.1, 9.1)] | [(9.5, 9.5), 9.47, (9.5, 9.5)] | [(6, 7.5), 8.75, (9.25, 9.88)] | [(5.25, 7), 8.5, (9.13, 9.88)] | [(6, 7.5), 8.75, (9.25, 9.88)] | [(5.5, 7.5), 9, (9.5, 10.0)] |
| C19 | C20 | C21 | C22 | C23 | C24 | |
| A1 | [(4.25, 5.5), 7, (8.0, 9.13)] | [(0.0, 0.0), 0, (1.0, 1.5)] | [(6, 7.5), 8.75, (9.25, 9.88)] | [(4, 25, 5.5), 7, (8.0, 9.13)] | [(4.25, 5.5), 7, (8.0, 9, 13)] | [(8.5, 9.5), 10, (10, 10)] |
| A2 | [(2.38, 3.5), 5, (6.38, 7.5)] | [(2.38, 3.5), 5, (6.38, 7.5)] | [(4.25, 5.5), 7, (8.0, 9.13)] | [(0.0, 1.25), 2.5, (4.0, 5.0)] | [(2.38, 3.5), 5, (6.38, 7.5)] | [(4.25, 5.5), 7, (8.0, 9.13)] |
| A3 | [(4.25, 5.5), 7, (8, 0, 9.13)] | [(6, 7.5), 8.75, (9.25, 9.88)] | [(6, 7.5), 8.75, (9.25, 9.88)] | [(4.25, 5.5), 7, (8.0, 9.13)] | [(4.25, 5.5), 7, (8.0, 9.13)] | [(2.38, 3.5), 5, (6.38, 7.5)] |
| A4 | [(2.38, 3.5), 5, (6.38, 7.5)] | [(4.5, 6), 7.5, (8.38, 9.25)] | [(8.5, 9.5), 10, (10.0, 10.0)] | [(4.25, 5.5), 7, (8.0, 9.13)] | [(0, 0.5), 1, (2.25, 3.0)] | [(4.25, 5.5), 7, (8, 9.13)] |
| Ranking | Ranking | Ranking | ||||||
|---|---|---|---|---|---|---|---|---|
| A1 | 0.499 | 0.057 | 0.306 | 2 | 0.372 | 2 | 0.437 | 2 |
| A2 | 0.728 | 0.071 | 1.000 | 4 | 1.000 | 4 | 1.000 | 4 |
| A3 | 0.518 | 0.070 | 0.962 | 3 | 0.723 | 3 | 0.484 | 3 |
| A4 | 0.321 | 0.050 | 0.000 | 1 | 0.000 | 1 | 0.000 | 1 |
© 2018 by the authors. Licensee MDPI, Basel, Switzerland. This article is an open access article distributed under the terms and conditions of the Creative Commons Attribution (CC BY) license (http://creativecommons.org/licenses/by/4.0/).
Share and Cite
Zhou, X.; Xu, Z. An Integrated Sustainable Supplier Selection Approach Based on Hybrid Information Aggregation. Sustainability 2018, 10, 2543. https://doi.org/10.3390/su10072543
Zhou X, Xu Z. An Integrated Sustainable Supplier Selection Approach Based on Hybrid Information Aggregation. Sustainability. 2018; 10(7):2543. https://doi.org/10.3390/su10072543
Chicago/Turabian StyleZhou, Xiongyong, and Zhiduan Xu. 2018. "An Integrated Sustainable Supplier Selection Approach Based on Hybrid Information Aggregation" Sustainability 10, no. 7: 2543. https://doi.org/10.3390/su10072543
APA StyleZhou, X., & Xu, Z. (2018). An Integrated Sustainable Supplier Selection Approach Based on Hybrid Information Aggregation. Sustainability, 10(7), 2543. https://doi.org/10.3390/su10072543