Article

Effects of Poultry-Litter Biochar on Soil Properties and Growth of Water Spinach (Ipomoea aquatica Forsk.)

1
Department of Agricultural Chemistry, National Taiwan University, Taipei 10617, Taiwan
2
Department of Soil and Water Conservation, National Chung Hsing University, Taichung 40227, Taiwan
3
Livestock Research Institute, Council of Agriculture, Tainan 71246, Taiwan
4
Department of Soil and Environmental Sciences, National Chung Hsing University, Innovation and Development Center of Sustainable Agriculture (IDCSA), National Chung Hsing University, Taichung 40227, Taiwan
*
Author to whom correspondence should be addressed.
Sustainability 2018, 10(7), 2536; https://doi.org/10.3390/su10072536
Submission received: 29 May 2018 / Revised: 11 July 2018 / Accepted: 17 July 2018 / Published: 19 July 2018

Abstract

:
Poultry-litter biochars (PLBs), which were prepared at two pyrolytic temperatures, were applied to the soils of croplands with four consecutive harvests of water spinach to assess the effects of PLBs on the soil properties and the growth of water spinach. The results show that PLB amendment resulted in an increase of soil pH. The electrical conductivity values, and the concentrations of extractable inorganic nitrogen, exchangeable potassium, and available phosphorus in the soils drastically increased in the 0.5% and 1% biochar-amended soils. However, most of the significant changes due to PLB amendment disappeared after four consecutive harvests of water spinach. The growth of water spinach was enhanced in the soils amended with PLBs, especially the one prepared at 350 °C. Nonetheless, the application of 1% PLBs to the soil resulted in an imbalance between calcium and magnesium in water spinach.

1. Introduction

A rapid increase in the global population in recent years has led to an increasing demand for agricultural and livestock products, which has caused the accumulation of large amounts of agricultural and livestock wastes [1]. In Taiwan, the annual production of livestock manure is as high as 2.3 million metric tons. Livestock manure, which contains higher levels of nitrogen (N) and phosphorus (P), was often applied to croplands to increase the content of soil organic matter and raise soil fertility for higher crop yield. However, the direct application of livestock manure to soil leads to environmental problems, such as the occurrences of odors and pathogens. Due to the potential environmental problems associated with the application of livestock manure to soils, a great quantity of poultry litter cannot be recycled and reutilized as fertilizers, consequently creating a waste disposal problem. On the other hand, the climate in Taiwan has a hot and rainy season [2], with an average annual rainfall of 2500 mm [3]. Under such a climate condition, continuous cultivation of crops can result in a fast rate of decrease in soil fertility. Therefore, the application of fertilizers is needed to maintain soil fertility for better crop yields. However, the production of chemical fertilizers needs to use non-renewable resources and is an energy consumption process. To achieve sustainable development of agriculture, the nutrients in livestock manure need to be recycled and reused to meet the need of fertilizers for crop production [4,5]; at the same time, methods of properly managing livestock manure need to be developed to avoid potential problems such as the emissions of odorous gases to local residential areas [6], and the release of heavy metals in livestock manure to the environment.
Biochar is a porous material that is produced through the pyrolysis of agricultural wastes and biological materials under oxygen-limited conditions [7,8,9,10,11,12]. The temperature and time of pyrolysis determine the physical and chemical properties of resultant biochars, including surface area, porosity and the type and content of surface functional groups [13,14]. The agronomic benefits of biochar amendment to soils has drawn international attentions [15]. Previous studies have revealed that adding biochar to soils can reverse soil fertility deterioration and increase crop yields. These beneficial effects of biochar are attributed to the adsorption capacity of biochar to soluble nutrients such as ammonium (NH4+), nitrate (NO3) [16], phosphate, and other ionic solutes [17]. The amendment of biochar to soils has been shown to change the biological composition and abundance of the soils [18,19]. The positive effects of biochar appear to be related to modifications in physical, chemical, and biological properties of soil, such as reduced acidity, increased cation exchange capacity (CEC), enhanced N retaining [20], increased microbiological activity [21], and increased mycorrhizal relationships [22,23] in the soil. Such changes may also influence nutrient cycling [21,24] and soil structure [25]; however, the research data on physical properties of soil are limited [16,26]. Moreover, the amendment of biochar to soils promotes plant growth [24,27], resulting in higher leaf quantity [26,28], plant height [24], and leaf growth/weight, and increasing total plant biomass [26]. Nonetheless, other studies in the literature demonstrated controversial results in terms of the effects of biochar amendment on soil-plant interactions and plant growth [15,27,29,30,31]. For example, Graber et al. [32] reported the positive effects of biochar amendment (1–5%) on the growths of tomato and pepper plants in a coconut fiber due to the change in microbial inhabitants and the increase in plant nutrition [33]. On the contrary, Belyaeva and Haynes [34] discovered no distinguishable changes in plant growth or nitrogen fertility levels after the addition of biochar. In short, limited information is available in the literature, with respect to the effects of biochar amendment on substrate properties and plant growth and the mechanisms behind the effects. In addition, the liming effects of biochar to soils has attracted much attention [35,36]. For example, in the work of Yuan and Xu [37], various biochars were produced from nine plant materials and amended to soils. The results showed that the pH values of the soils were increased with all nine biochars. The addition of biochar also increased exchangeable base cations, effective CEC, and base saturation, while soil exchangeable Al and exchangeable acidity were reduced.
Poultry litter can be used as one of the sources of nutrients for plant growth due to its high contents of nutrients, among which P is attracting the most attention. Phosphorus is one of the macro-nutrients for plants and is applied to farmland soils in large quantity. Because most of P used in fertilizer is mined primarily from phosphate rocks, there has been a great concern of phosphate rock shortage that is expected to occur in the next 30–100 years [38]. On the other hand, a large amount of P is discharged from farmlands to surface waters, which can result in the deterioration of water quality, such as eutrophication. Therefore, the effective use of P appears to be a critical issue in sustainable agriculture [39]. The pyrolysis of poultry litter can potentially convert P into less soluble forms in poultry-litter biochar (PLB). However, to the best of our knowledge, the release rate of nutrients from PLB after its application to farmland soils and the related mechanisms have not been well understood. This will hinder the development of methods for improving P recycling of poultry litter and utilizing PLB as an eco-friendly fertilizer. Therefore, the purpose of this study was to investigate the effects of PLBs produced at two different temperatures on the properties of soils amended with PLBs and the growth of water spinach (Ipomoea aquatica Forsk.) on the soils. The pH, electrical conductivity (EC), and the concentrations of available N and exchangeable cations of the soils were determined after four consecutive harvests of water spinach. The growth and accumulation of some essential elements in the water spinach under PLB treatments were also assessed. The results of this work could provide essential information for developing agronomical practices to reutilize the nutrients in poultry litter to grow crops to meet the goal of sustainable development.

2. Materials and Methods

The soil sample was air dried, ground, and passed through a 10-, 80-, or 100-mesh stainless steel sieve according to soil property analyzed. The soil was then analyzed to determine organic carbon content (OC) [40], CEC [41], and texture [42]. The results showed that the soil had a moderate content of OC (2.6 ± 0.2%), CEC (21.0 ± 2.0 cmolc/kg), and loamy texture (sand 32%, silt 46%, clay 22%). Poultry litter was heated to 350 and 600 °C for two hours to produce two types of PLBs. The total concentrations of various elements in the PLBs were determined using ICP-AES after aqua regia digestion [43]. According to the results, a higher pyrolytic temperature resulted in higher concentrations of these elements (Table 1).
The field experiments with the cultivation of water spinach (Ipomoea aquatica Forsk.) were conducted in central Taiwan from June 2016 to July 2017 and the treatments are listed below. The area of each block was 4 m2 and 60 blocks were planted in total. Three samples of surface soil (0–15 cm) were collected from each block of different treatments before planting in each cultivation (coded as SX-1, X = 1, 2, 3, and 4 for the 1st, 2nd, 3rd, and 4th cultivations, respectively) and homogenized as the represented sample for the block. According to the suggestion of the Council of Agriculture of Taiwan, the recommended amount of N, P2O5, and K2O for water spinach is 120, 60, and 120 kg/ha, respectively. Accordingly, raw poultry litter, poultry litter compost, and PLBs were applied to the soils before the beginning of each cultivation to meet the requirement of P (Treatments IV, V, VI, and IX). In addition, 0.5% and 1% of PLBs were applied to the soils in the beginning of the experiments and there was no PLB application afterward (Treatments VII and VIII). Commercial seeds of water spinach obtained from Know-You Seed Co., Ltd. (Kaohsiung, Taiwan) were sown in each block. Water was supplied from surrounding irrigation channels, and weeds were pulled up during the cultivations.
(I)
NP: no plant growth and no amendment
(II)
CK: plant growth with no amendment
(III)
CF: urea and monobasic potassium phosphate applied as N: P2O5: K2O = 120: 60: 120 kg/ha
(IV)
RPL: raw poultry litter applied as P2O5 = 60 kg/ha
(V)
350-1X, 350-0.5X, and 350-2X: 350 °C PLB applied as P2O5 = 60, 30, and 120 kg/ha, respectively
(VI)
600-1X, 60-0.5X, and 600-2X: 600 °C PLB applied as P2O5 = 60, 30, and 120 kg/ha, respectively
(VII)
350-0.5% and 350-1%: 350 °C PLB of 10 and 20 ton/ha, respectively, applied in the beginning of the experiments
(VIII)
600-0.5% and 600-1%: 600 °C PLB of 10 and 20 ton/ha, respectively, applied in the beginning of the experiments
(IX)
CC-1X: poultry-litter compost applied as P2O5 = 60 kg/ha
After growing for 32–35 days, at least 20 plants of mature water spinach were harvested from each block of treatments. The plants were rinsed with tap water and then deionized water, and divided into roots and shoots. The shoots were oven dried at 65 °C for 72 h and then weighed. Afterward, the shoots were ground with a grinder and then digested using HNO3/HClO4 method [44]. Besides plants, three samples of surface soil (0–15 cm) were collected from each block and homogenized as a represented sample for that block (coded as SX-2, X = 1, 2, 3, and 4 for the 1st, 2nd, 3rd, and 4th cultivations, respectively). After air drying, grinding, and passing through 10 mesh stainless steel sieves, the soil samples were analyzed for pH (w/v = 1/5) [45], ECw (w/v = 1/5) [46], 2 M KCl extractable concentrations of inorganic nitrogen [47], 1 M NH4OAc (pH 7.0) extractable concentrations of cations [41], and available concentration of P [48].
The statistical analysis was performed using SPSS (Statistical Package for Social Sciences, Armonk, NY, USA). A one-way analysis of variance (ANOVA) was performed to detect differences in soil and plants between treatments. The least significant difference (LSD) test was used to identify significant differences between means. A value of p < 0.05 denoted statistical significance.

3. Results

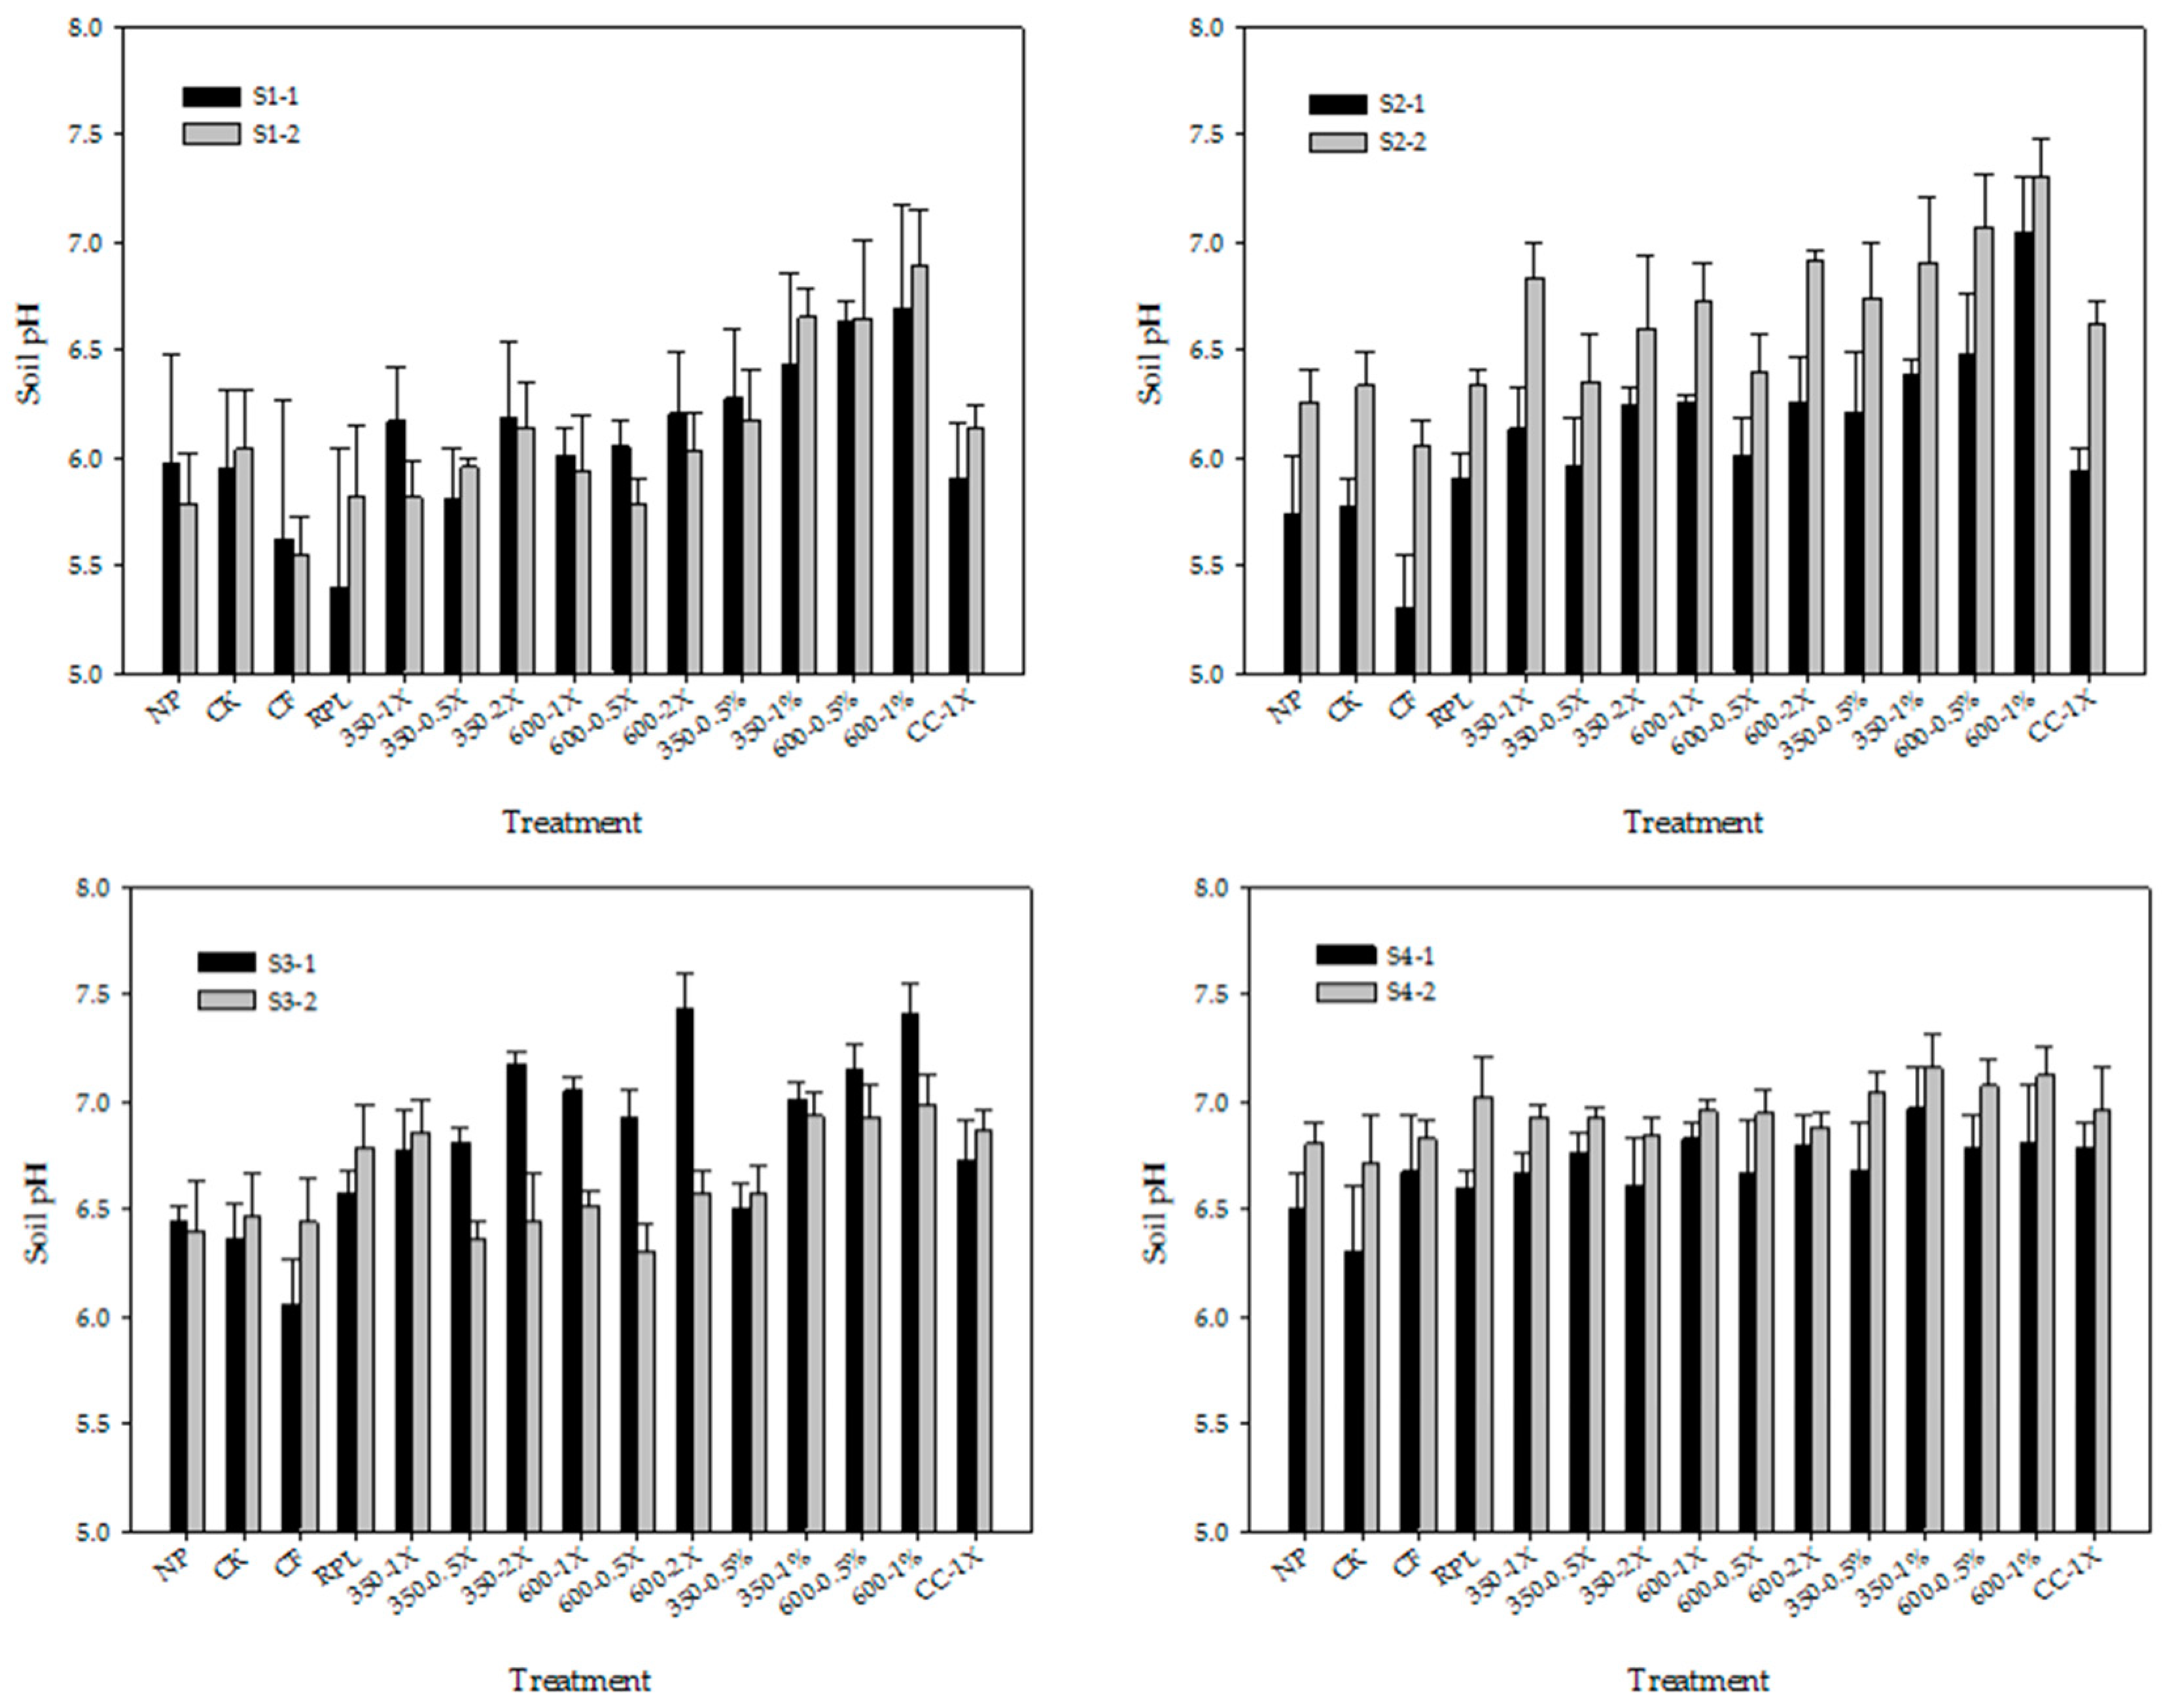
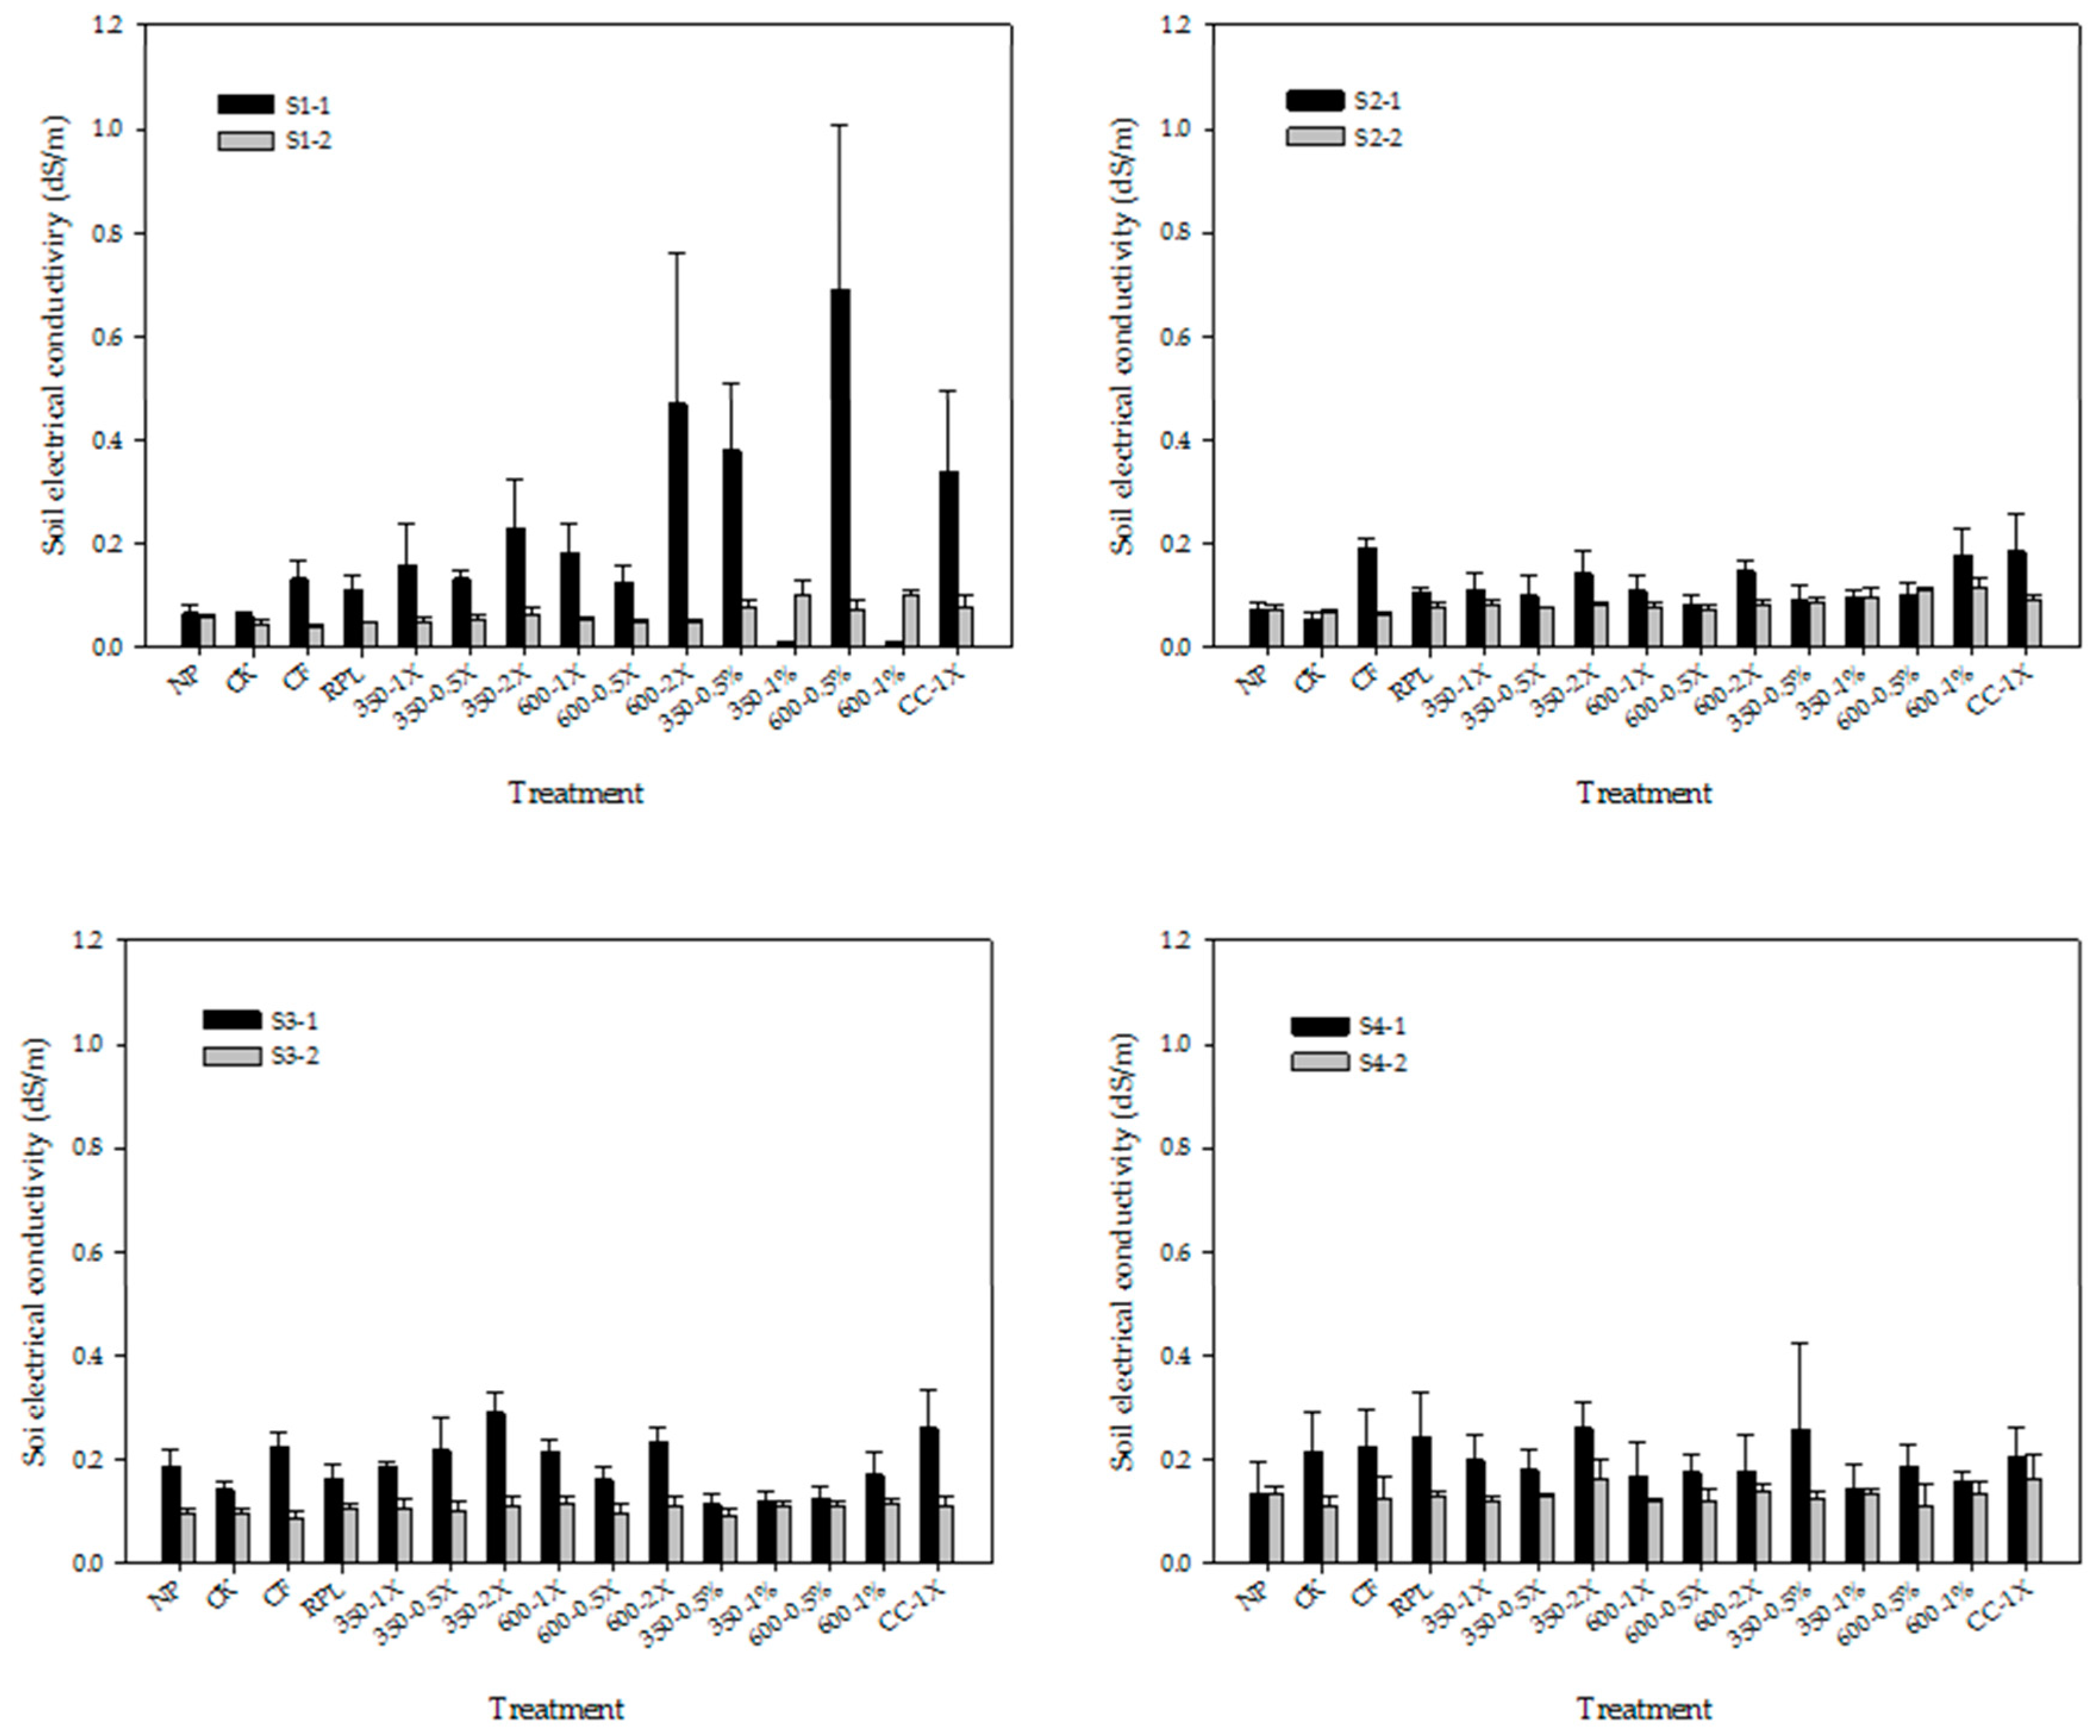
3.1. Soil pH and ECw

The initial pH values of the soils of different treatment (S1-1) ranged from 5.4 to 6.7. In comparison to the NP and CK treatments, the applications of CF, RPL, and CC lowered soil pH, while the amendments of PLBs resulted in increasing soil pH values. After the first harvest, the changes in the pH values of the soils (S1-2) were not statistically significant as compared to the initial counterparts (S1-1). The extents in the changes in the soil pH values were more significant after four harvests as the pH values of S4-2 were all higher than the counterparts of S1-1 (Figure 1). The differences between S4-2 and S1-1 of all treatments were at the levels of 0.4–1.7. Even in the NP and CK treatments, the soil pH values were increased from 5.98 ± 0.51 and 5.95 ± 0.37 (S1-1) to 6.80 ± 0.10 and 6.71 ± 0.23 (S4-2), respectively. Among the 15 treatments, the differences between the soil pH values of S1-1 and S4-2 were more significant in the treatments of CF, RPL, 350-0.5X, and CC-1X. The soil pH values of S4-2 in the treatments of 350-0.5%, 350-1%, 600-0.5%, and 600-1% were at the levels of 7.0–7.2, which were significantly higher than those of other treatments (p < 0.05). The highest value of soil pH was 7.16 ± 0.16, obtained in the 350-1% treatment. Comparatively, when two PLBs were applied with the amounts of 30–120 kg/ha to meet the requirement of P2O5 for growing water spinach, the pH values after four harvests (S4-2) were 6.8–7.0, which were 0.1–0.3 higher than that of the CK treatment. Therefore, the application of PLBs in accordance to the recommended amount of P2O5 did not drastically increase the soil pH values.
After four harvests, the ECw values of NP and CK also increased from 0.06–0.07 dS/m (S1-1) to 0.11–0.14 dS/m (S4-2). The EC value can reflect the total ion content and the base saturation percentage of the soil, and the soil pH often increased with increasing EC [49]. Due to a typhoon during this field experiment, we also analyzed the subsoil samples of S4-1 and S4-2. The results showed that the ECw values of subsoil samples were at the levels of 0.07–0.12 dS/m, which were all lower than those of surface soil samples (data not shown). This result revealed that the leached salts resulting from rainfall brought by the typhoon were not percolated to the subsoils.
In comparison to the NP and CK treatments, various treatments with PLB amendments generally resulted in increases of soil ECw value (S1-1 in Figure 2). In particular, the soil ECw of the 350-2X, 600-2X, 350-0.5X, 600-0.5X, and CC-1X treatments were 0.23–0.70 dS/m, which were significantly higher than those of the NP and CK treatments. However, the soil ECw of the treatments with different PLBs drastically decreased in S1-2 because there was a typhoon during the first harvest. After four harvests, the soil ECw values of various treatments (S4-2) were in the levels of 0.10–0.17 dS/m; the differences among the ECw values of different treatments were not significant except those of 350-2X and CC-1X.
The application of two PLBs as P2O5 at 30–120 kg/ha did not significantly change the EC values after four harvests in comparison to the CK and NP treatments. Even through the soil ECw values in the treatments of 350-2X and 600-2X were slightly higher than those of 350-0.5X, 350-1X, 600-0.5X, and 600-1X; however, the differences were less than 0.05 dS/m, which were relatively insignificant. In general, the changes of the soil ECw values from S1-1 (0.06–0.38 dS/m) to S4-2 (0.11–0.17 dS/m) were less than 0.18 dS/m, except for those of the 600-2X, 350-0.5X, and 600-0.5% treatments. During this trial, the highest value of soil ECw was 0.69 ± 0.32 dS/m, obtained with the 600-0.5% treatment, but this value decreased to 0.07 ± 0.01 dS/m after the first harvest and decreased to 0.11 ± 0.04 dS/m after four harvests.

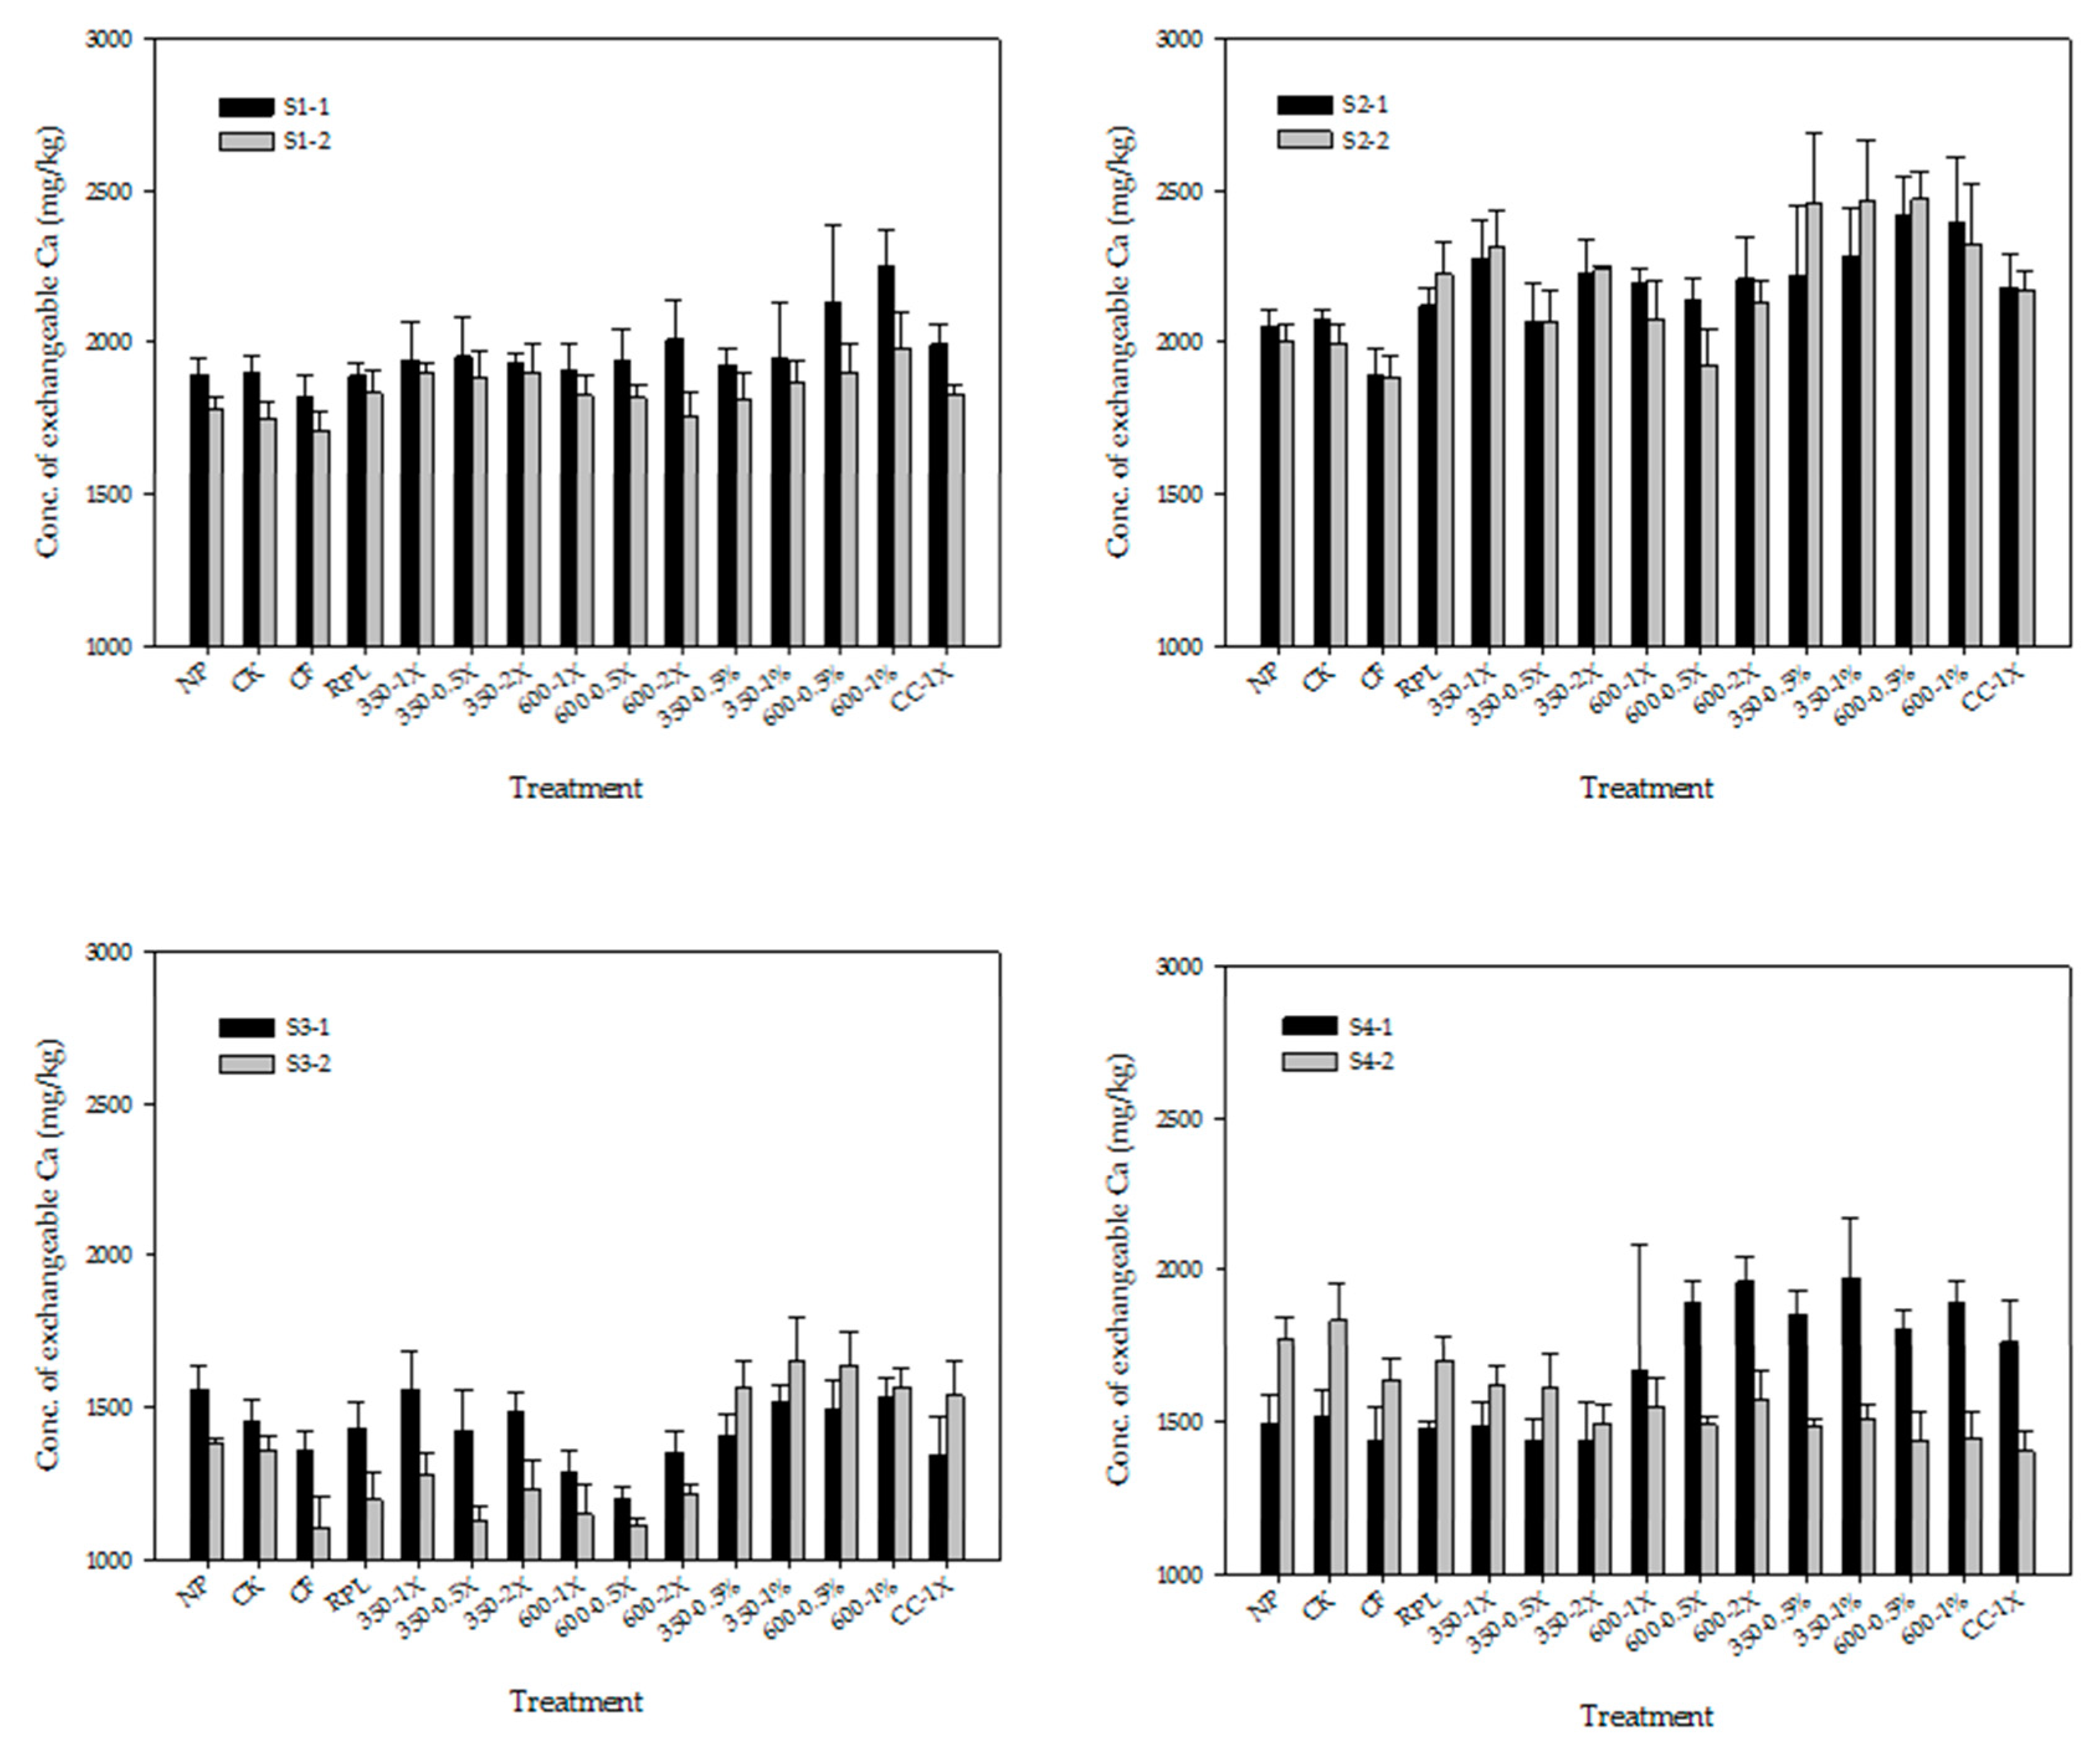
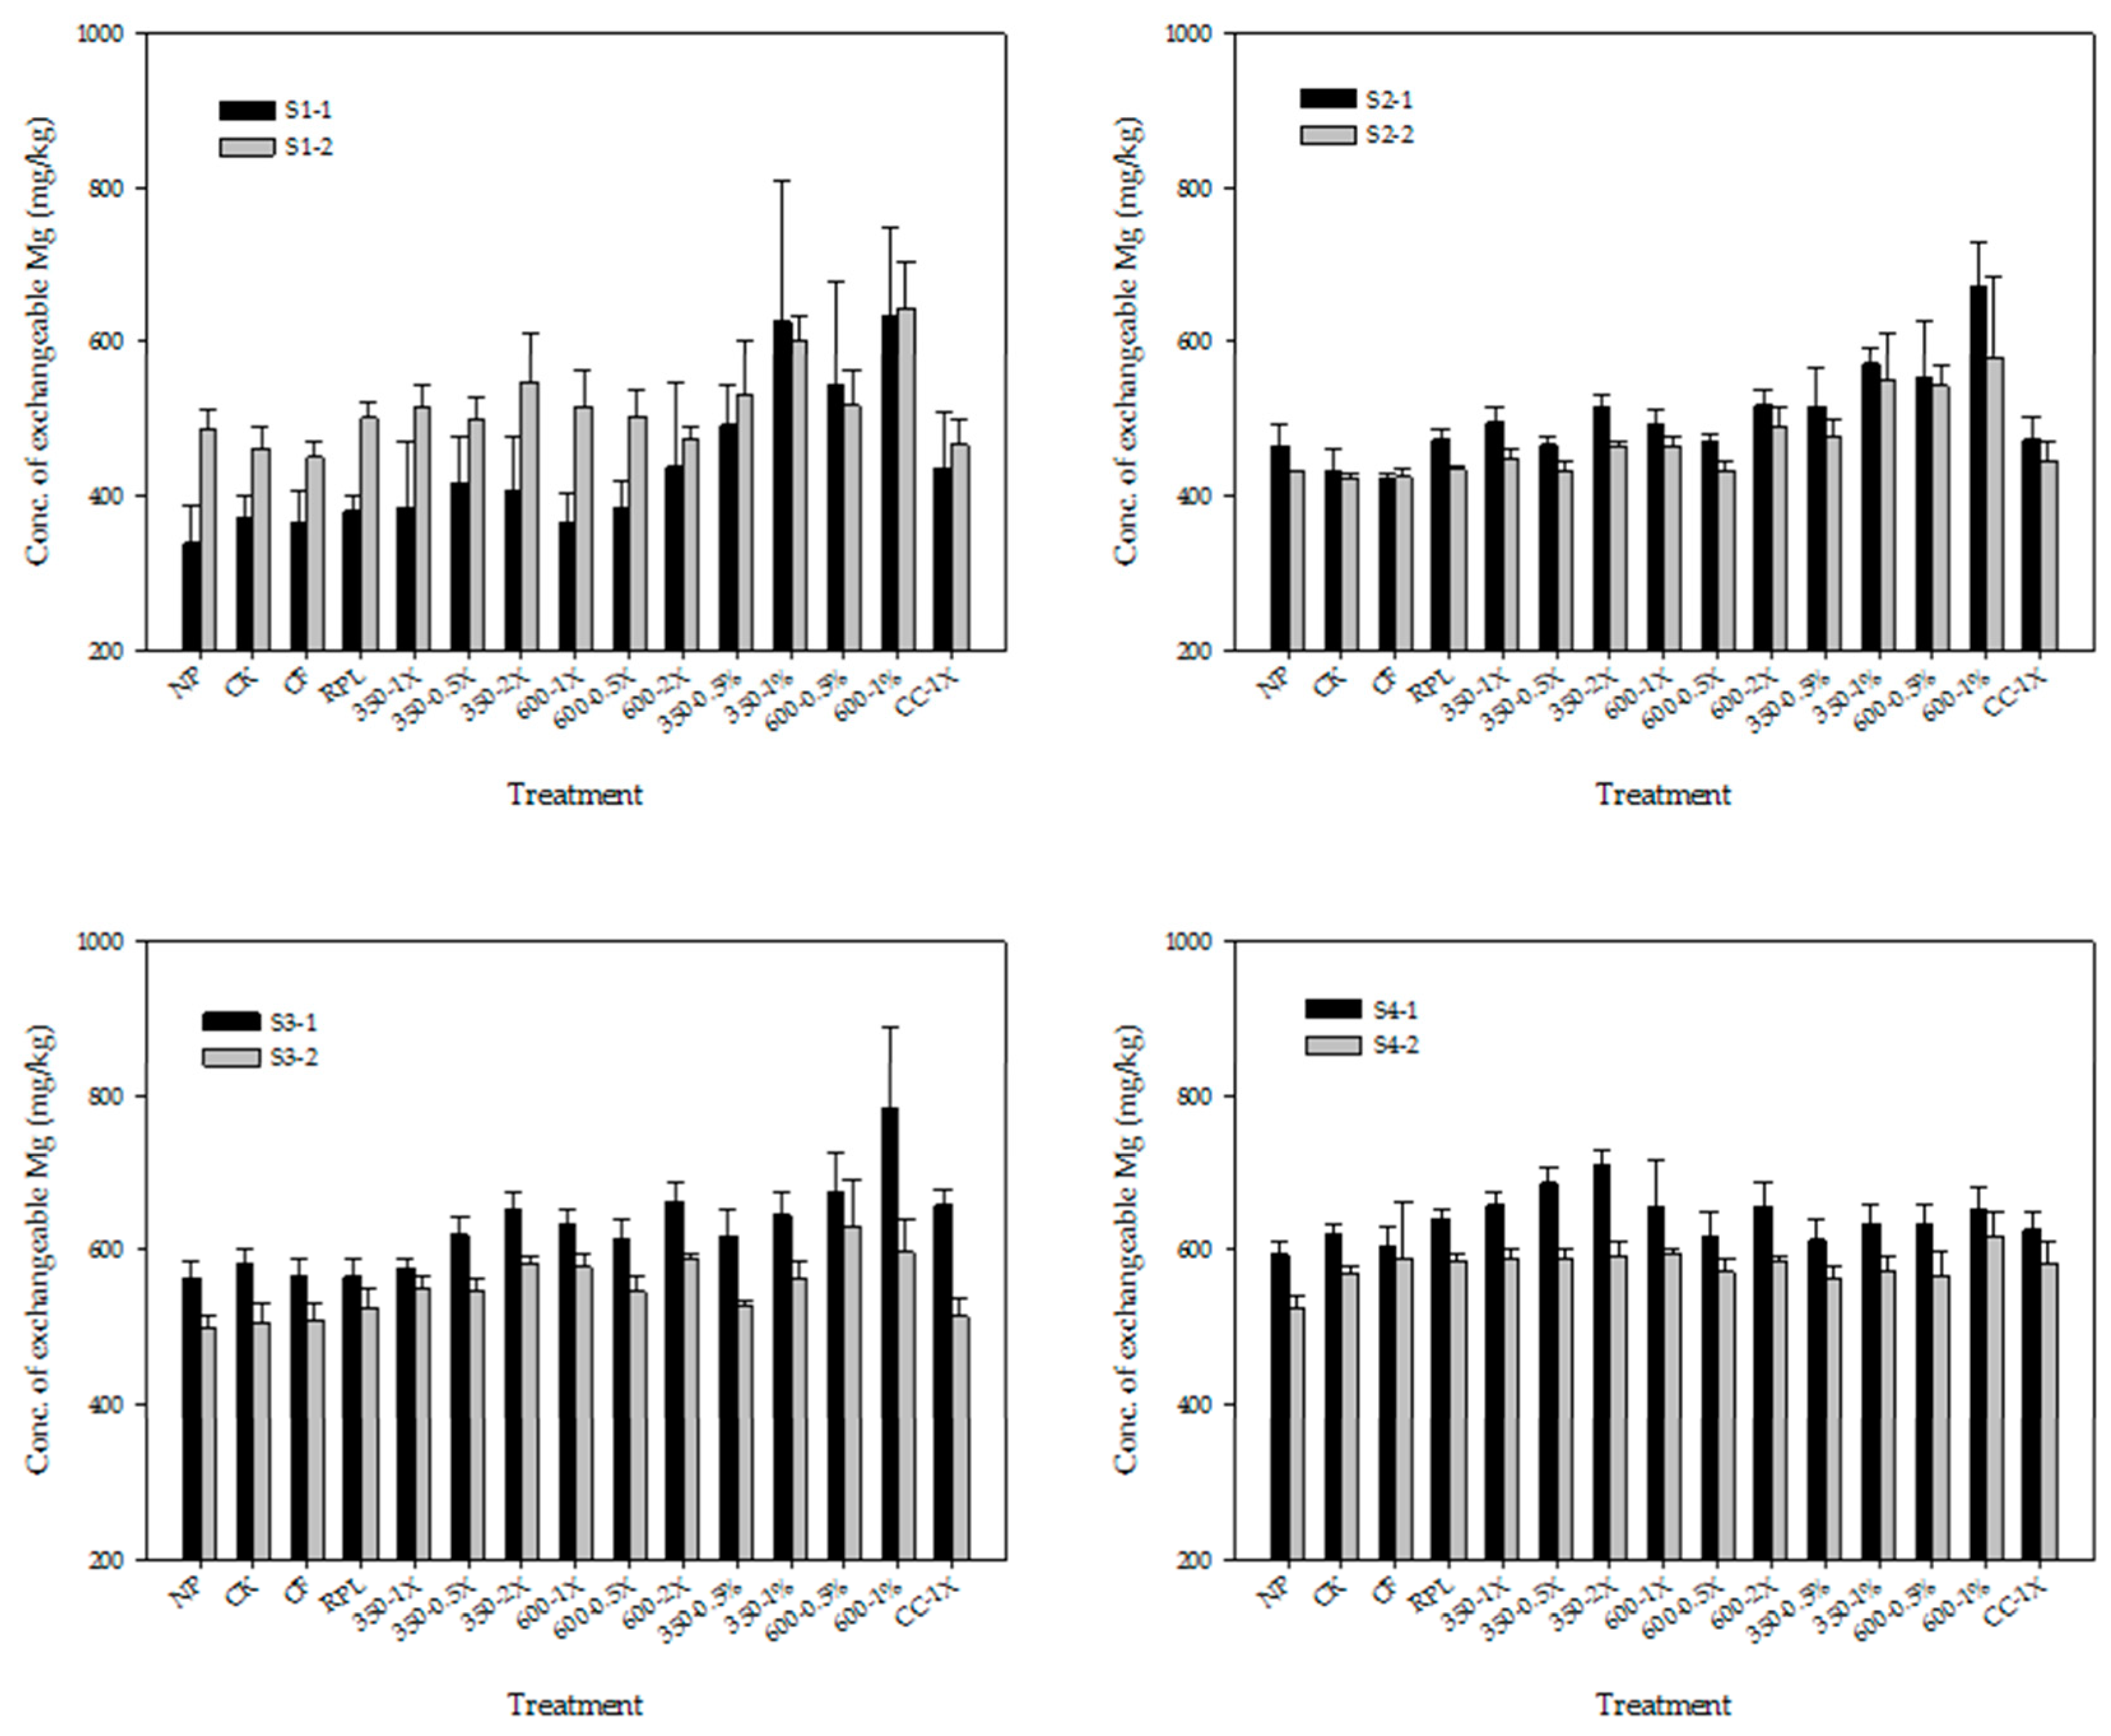
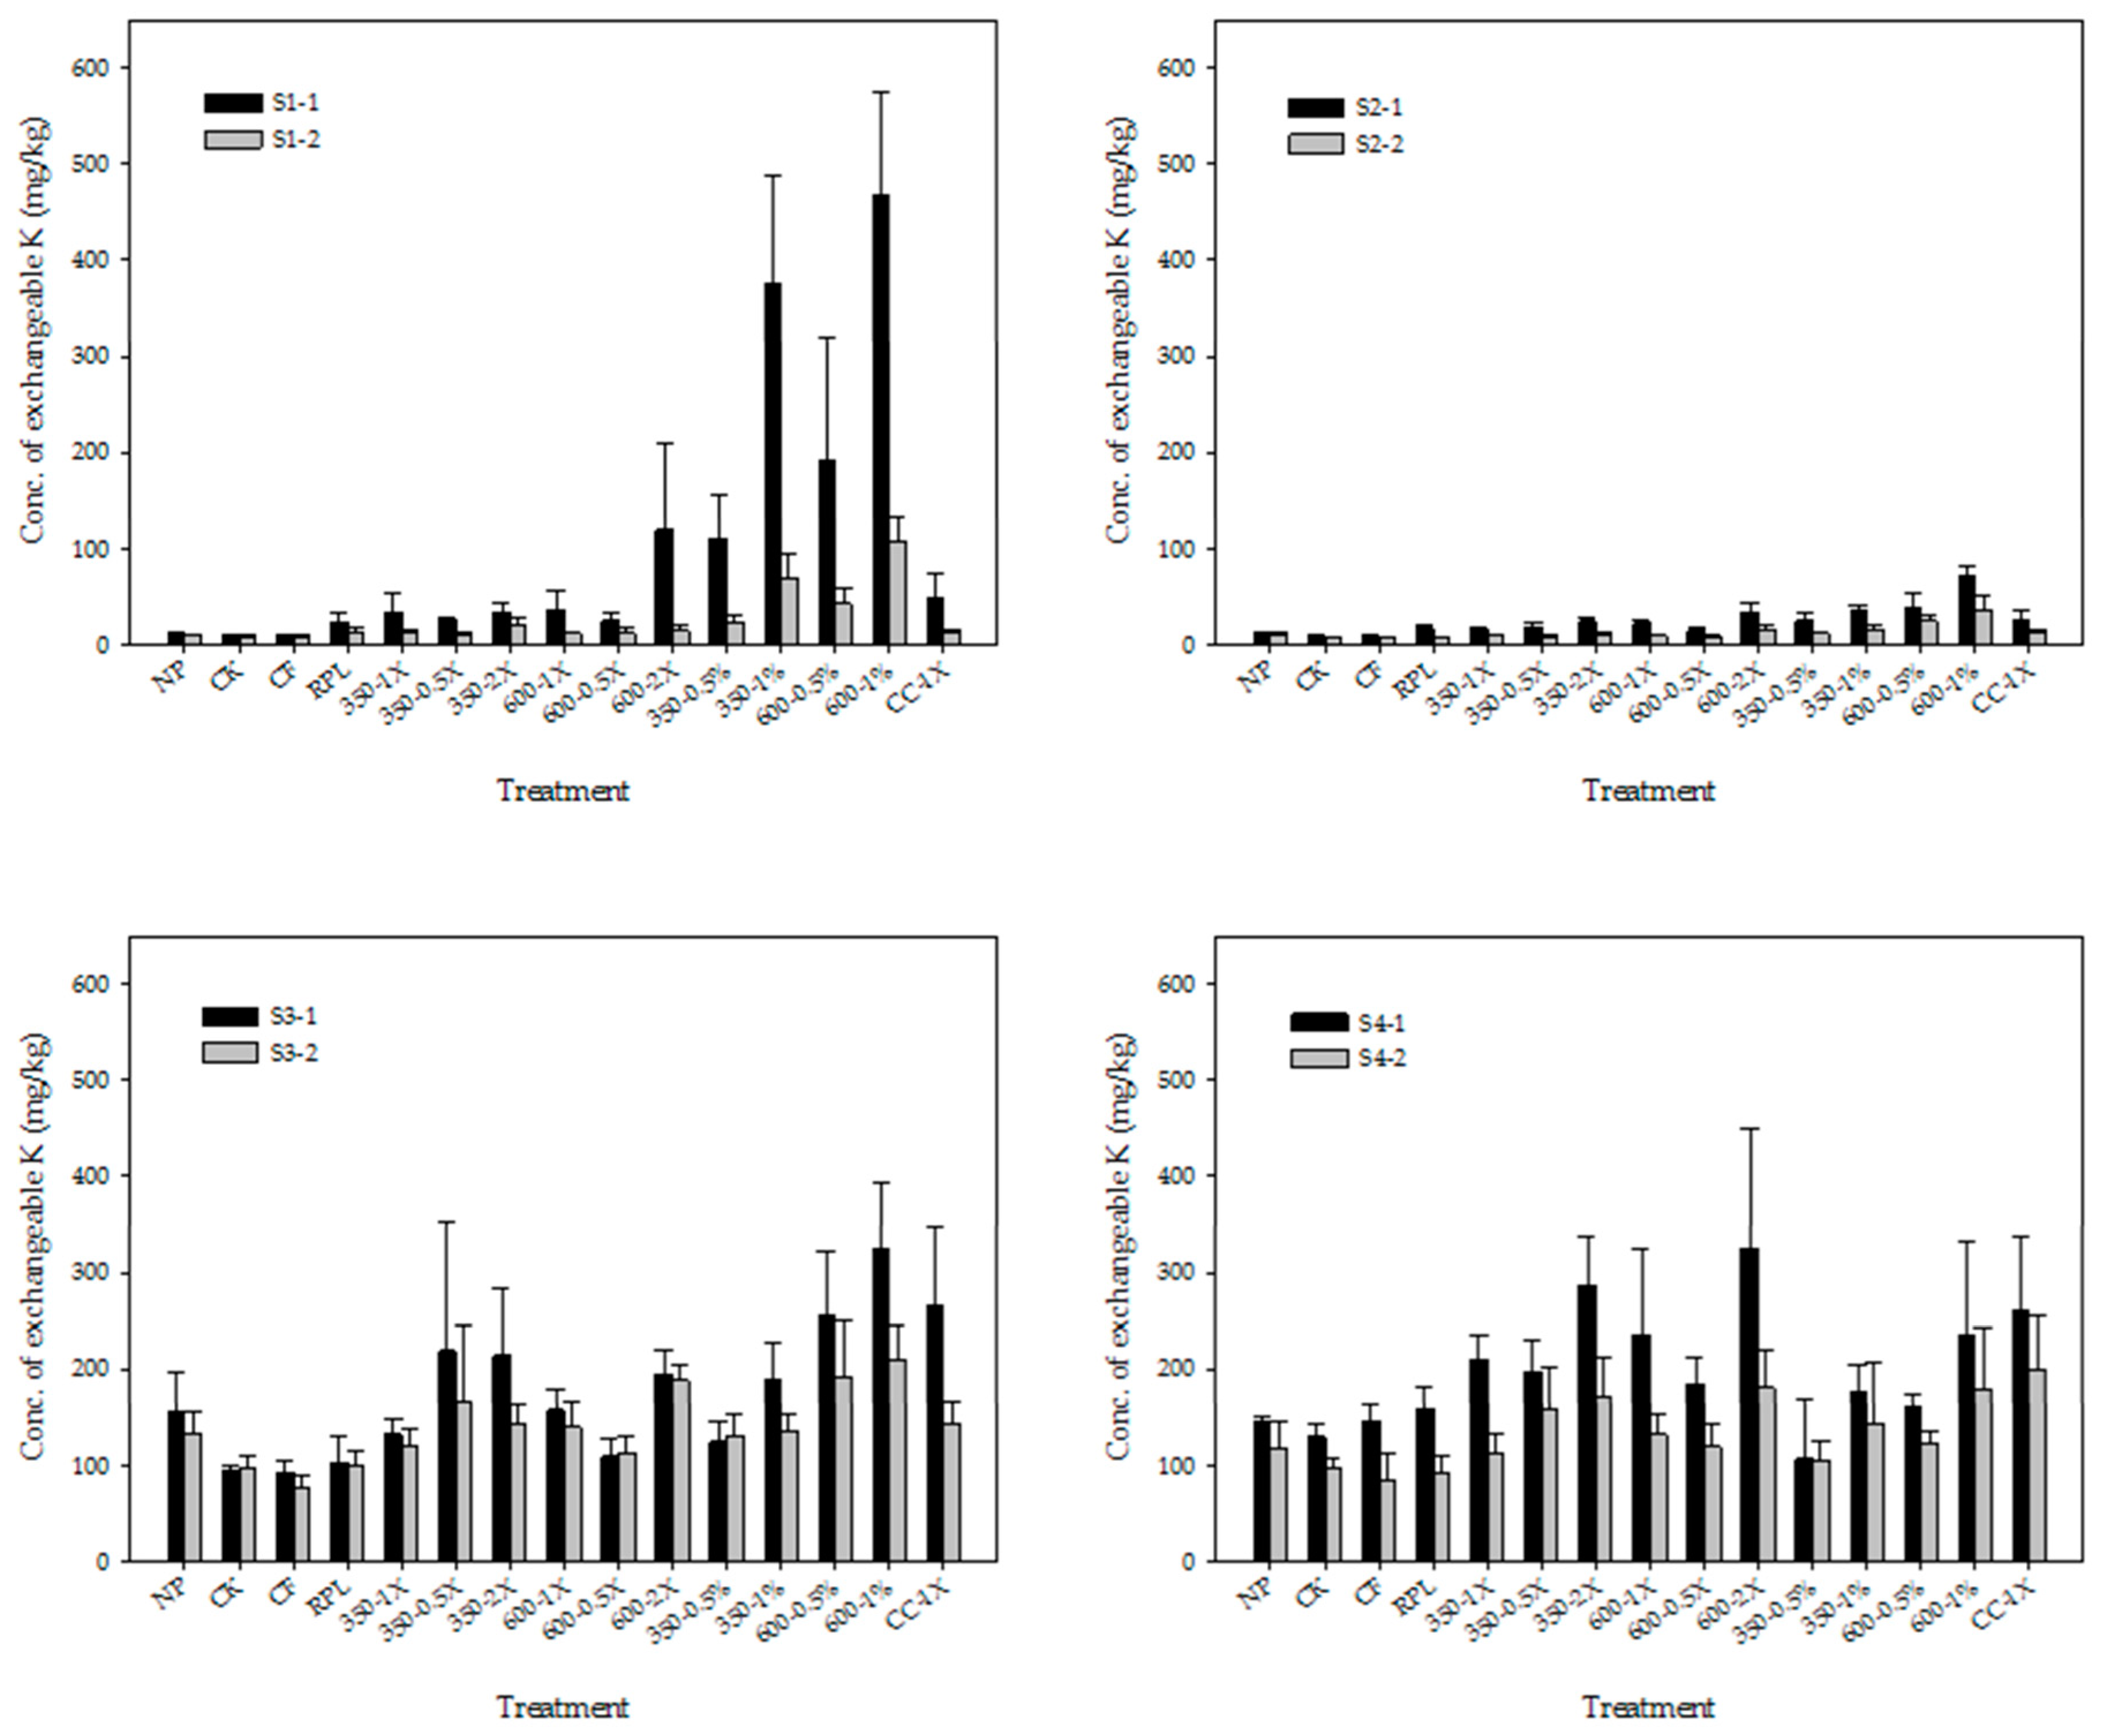
3.2. Exchangeable Cations

In comparison to NP and CK, there were generally no significant changes in the concentration of exchangeable Ca due to different treatments (Figure 3). The concentrations of exchangeable Ca in the various treatments of S1-1 were at the levels of 1800–2300 mg/kg. After four harvests, the concentrations of exchangeable Ca of all treatments in S4-2 were in the levels of 1400–1850 mg/kg, which were 16–36% lower than their counterparts in S1-1. Moreover, in S4-1 and S4-2, the concentrations of exchangeable Ca in the topsoil samples were 1.1–1.5 times higher than those of their subsoil counterparts (data not shown).
The treatments of 350-0.5%, 350-1%, 600-0.5%, and 600-0.5% significantly increased the concentrations of exchangeable Mg in S1-1 from 330–380 mg/kg (NP and CK) to 490–640 mg/kg (Figure 4). Among all the treatments in S1-1, the 600-1% treatment resulted in the highest concentration of exchangeable Mg (633 ± 114 mg/kg). After four harvests, however, the concentrations of exchangeable Mg in S4-2 were in the levels of 520–620 mg/kg with no significant differences among the treatments. The concentrations of exchangeable Mg in S4-1 and S4-2 of the surface soil and subsoil samples were in the levels of 520–710 and 460–580 mg/kg, respectively (data not shown). In the end of four harvests (S4-2), the application of two PLBs as P2O5 at 30–120 kg/ha did not significantly change the concentrations of exchangeable Ca and Mg compared to CK and NP. The differences between them were less than 340 and 75 mg/kg for exchangeable Ca and exchangeable Mg, respectively.
The 600-2X, 350-0.5%, 350-1%, 600-0.5%, and 600-1% treatments significantly (p < 0.05) increased the concentrations of exchangeable K from 10–11 mg/kg (NP and CK) to 110–470 mg/kg in S1-1 (Figure 5). However, the differences in the concentration of exchangeable K in S4-2 after four harvests were not significant. The exchangeable K concentrations of the S4-2 samples in the NP and CK treatments were 90–120 mg/kg, while those in the 350-2X, 600-2X, 600-1%, and CC-1X treatments were 171–197 mg/kg. These results revealed the positive effects of various PLB treatments on the exchangeable K content in the soil.

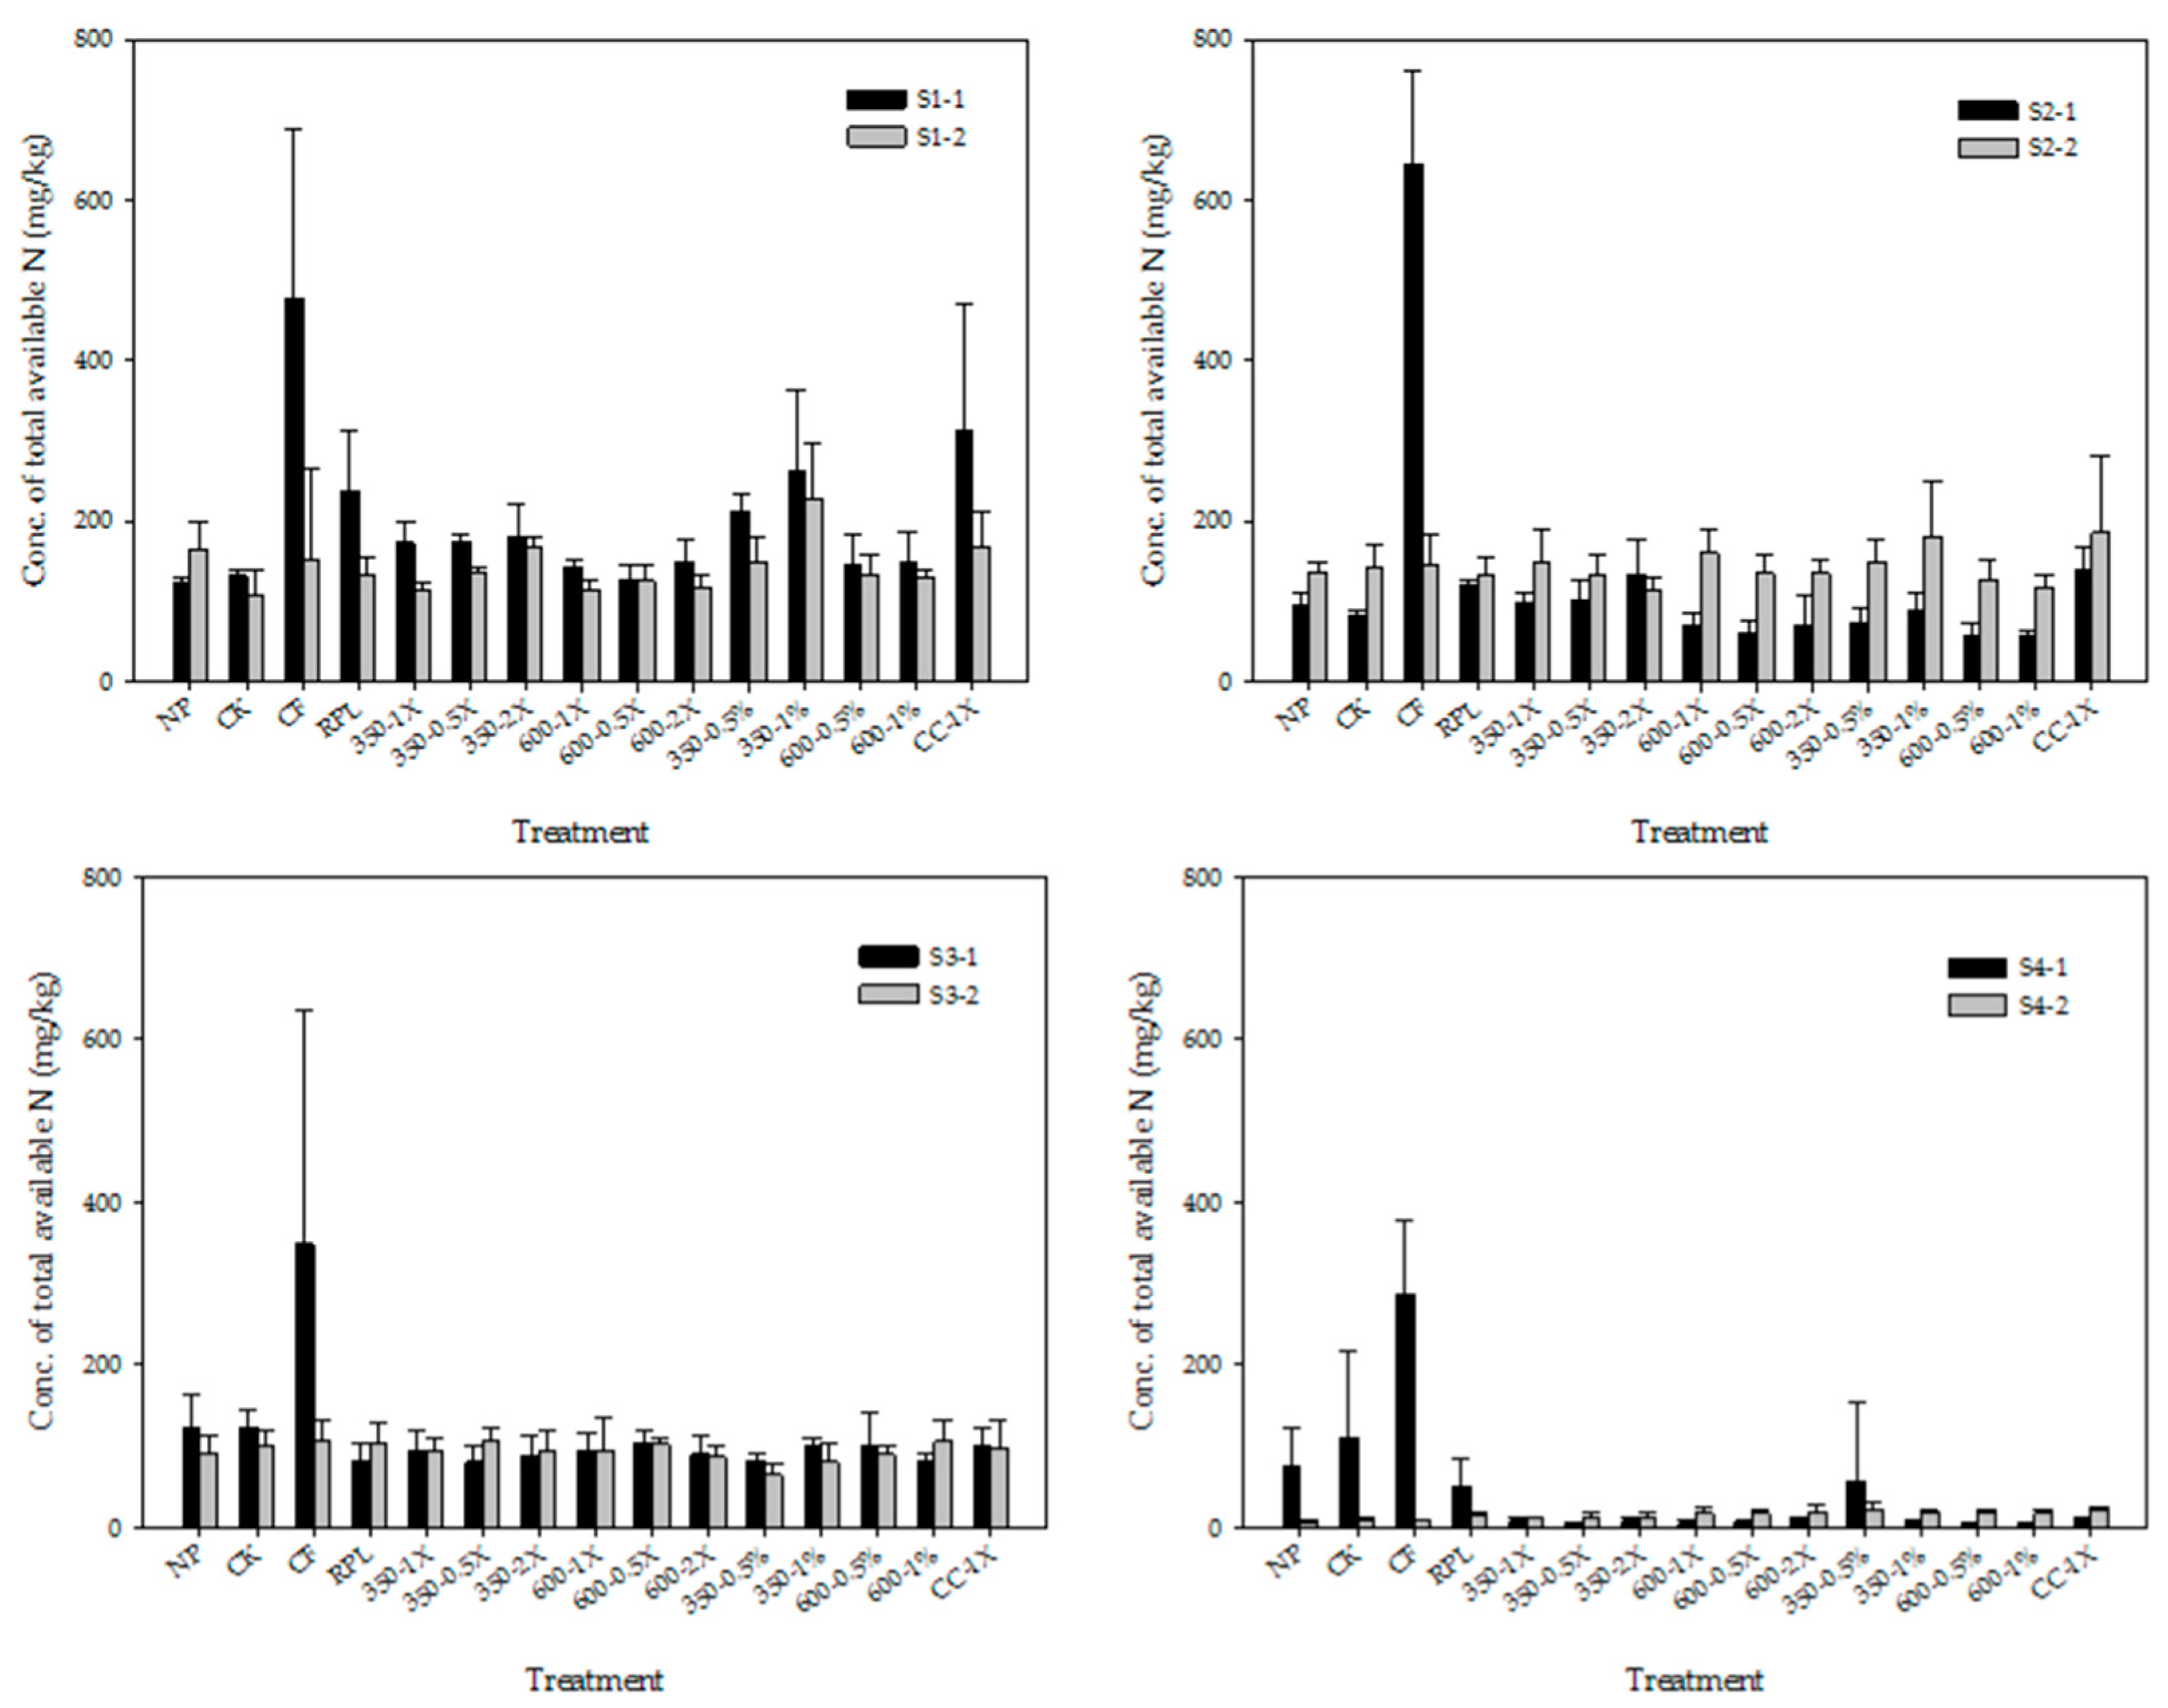
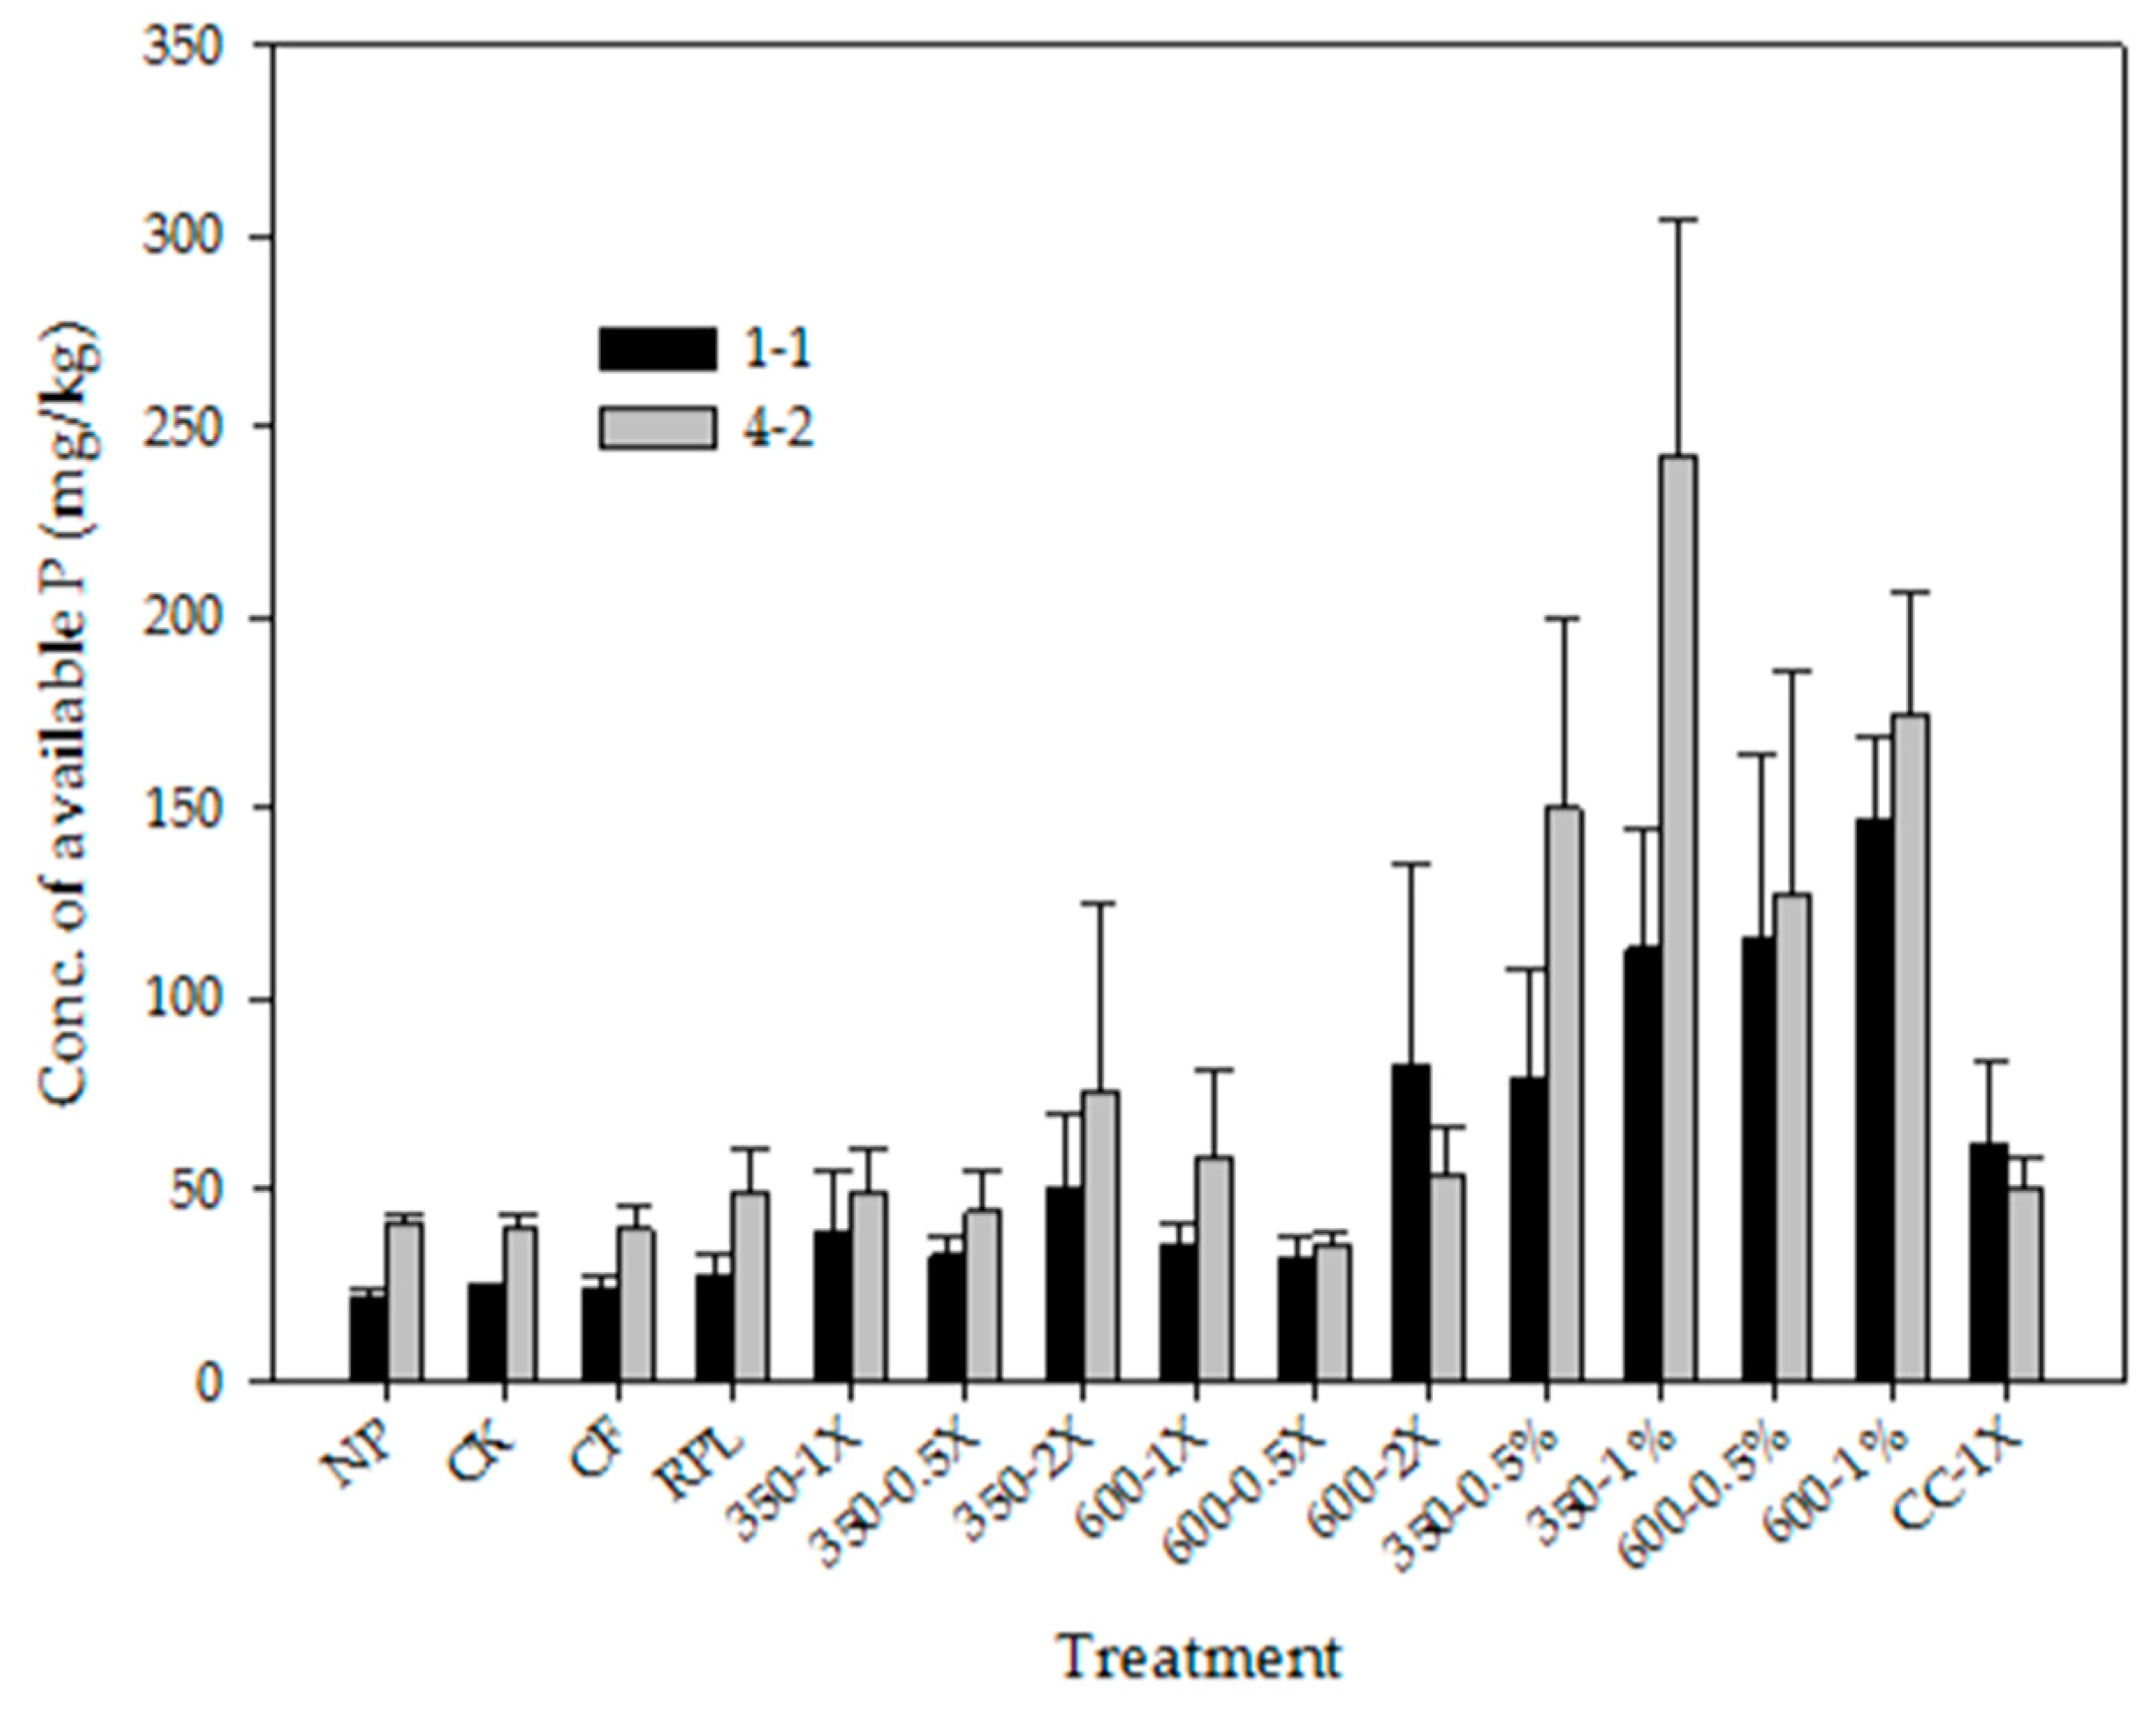
3.3. Available N and Available P
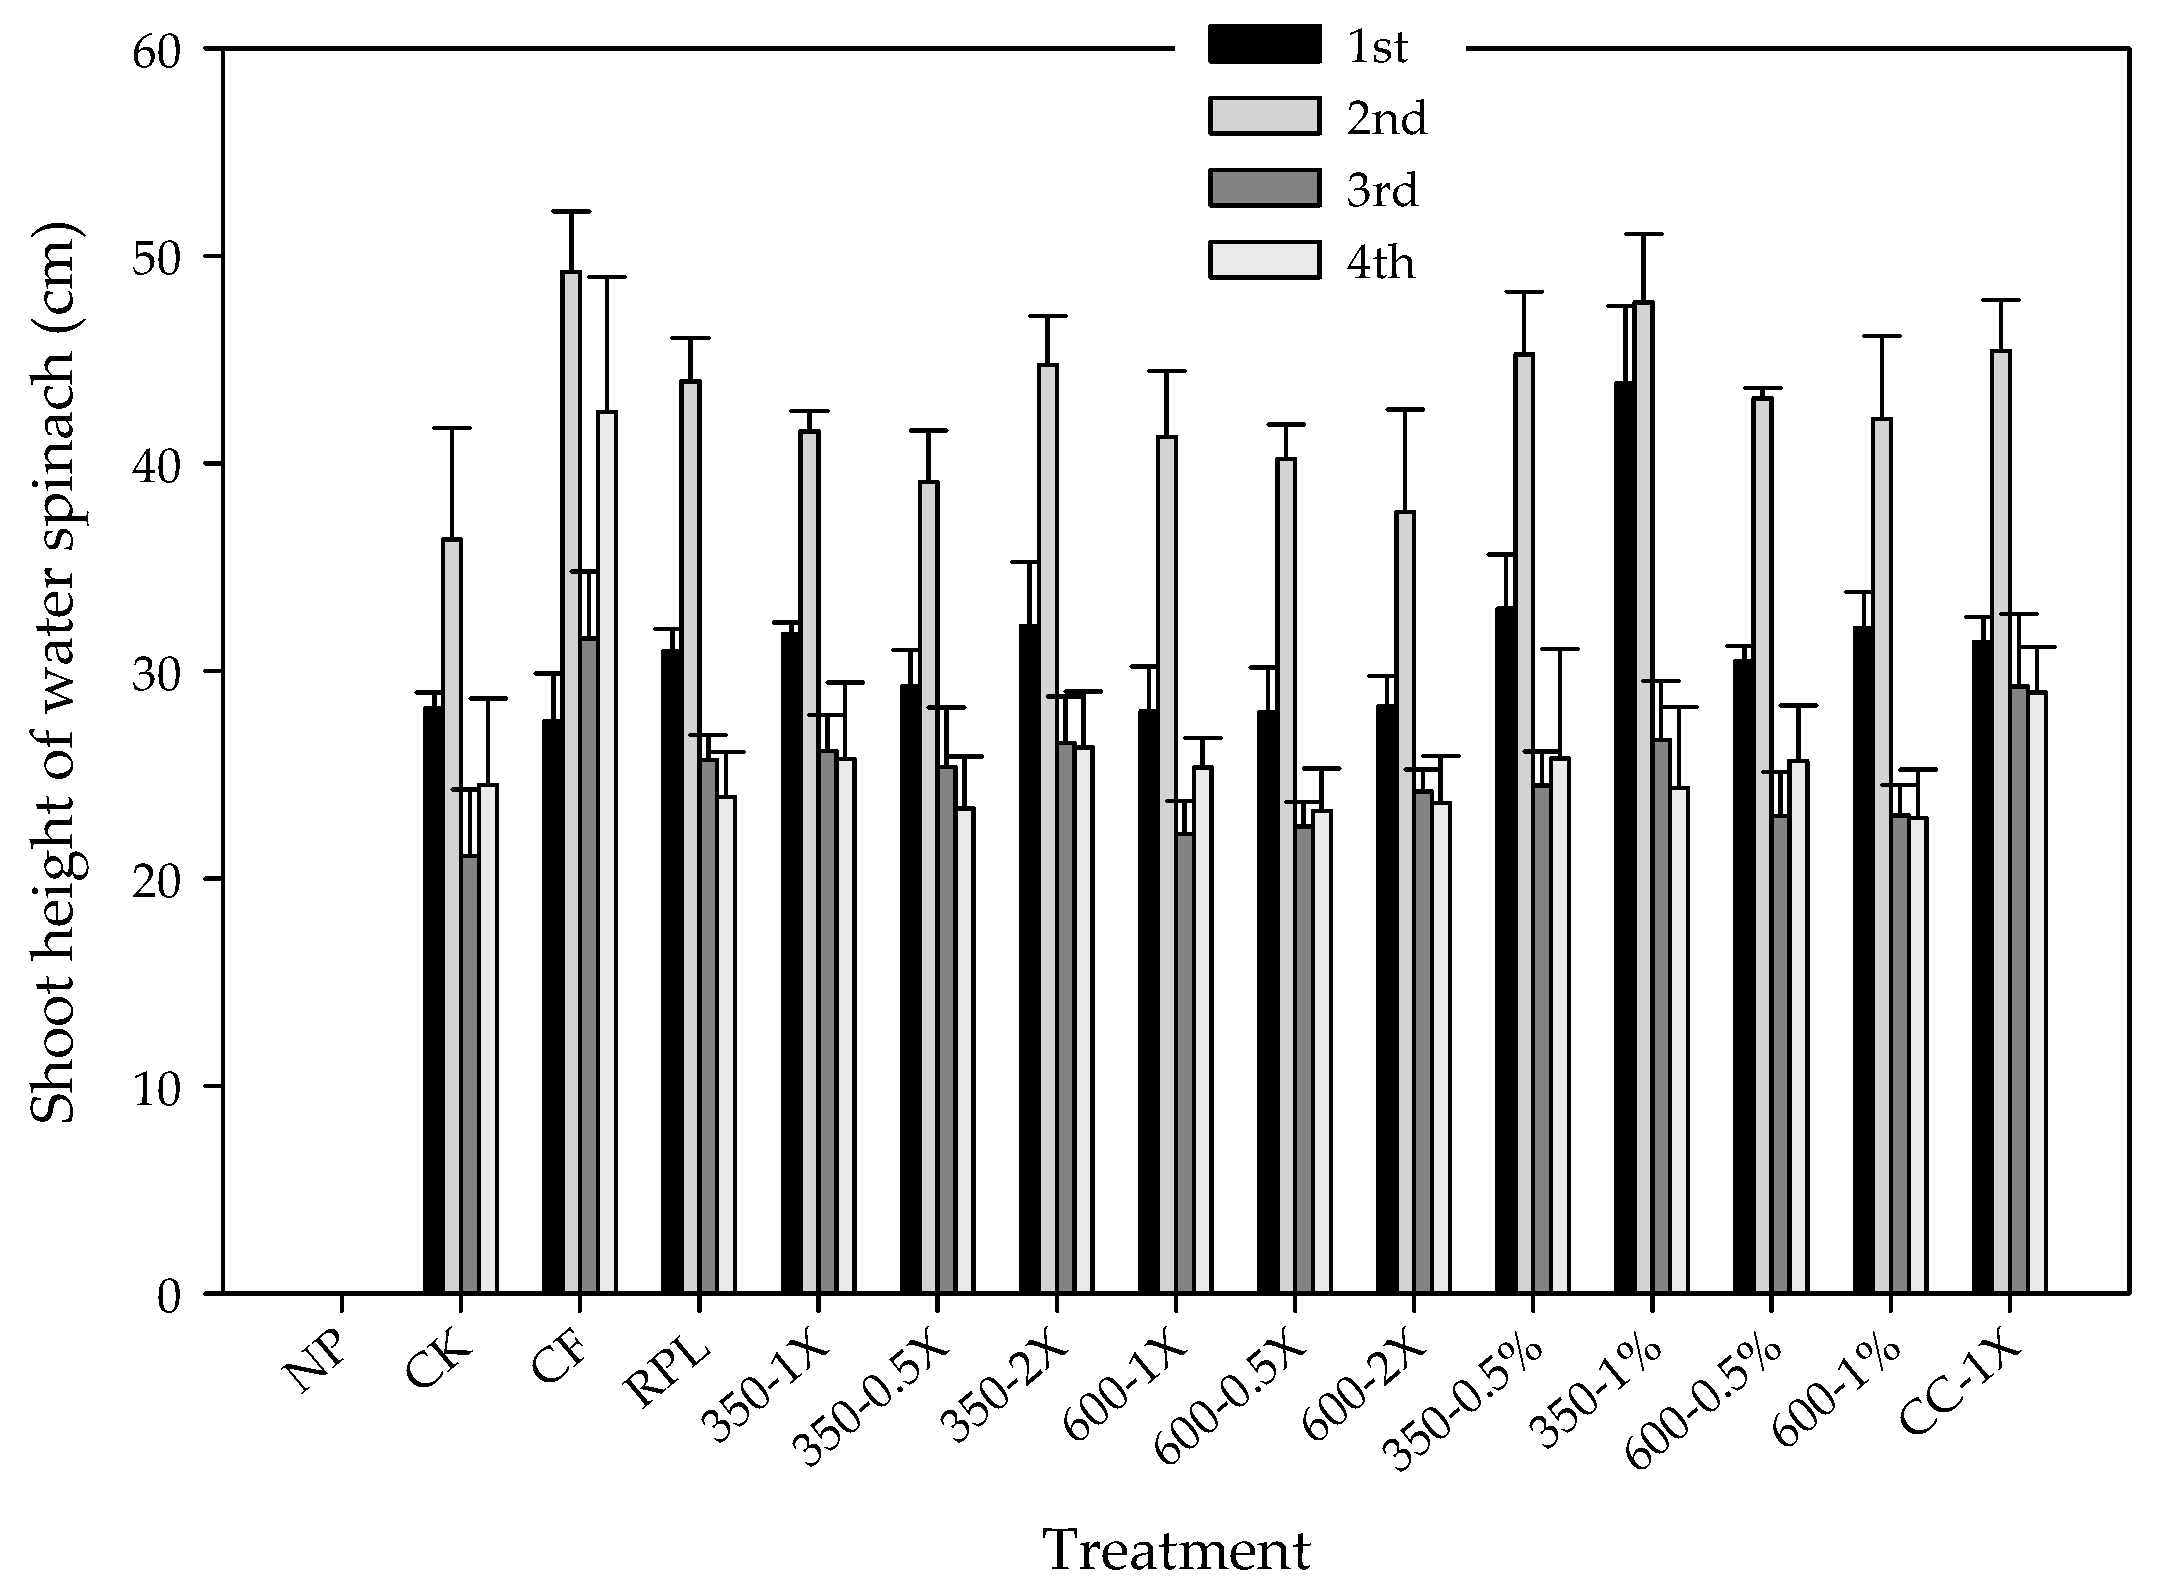
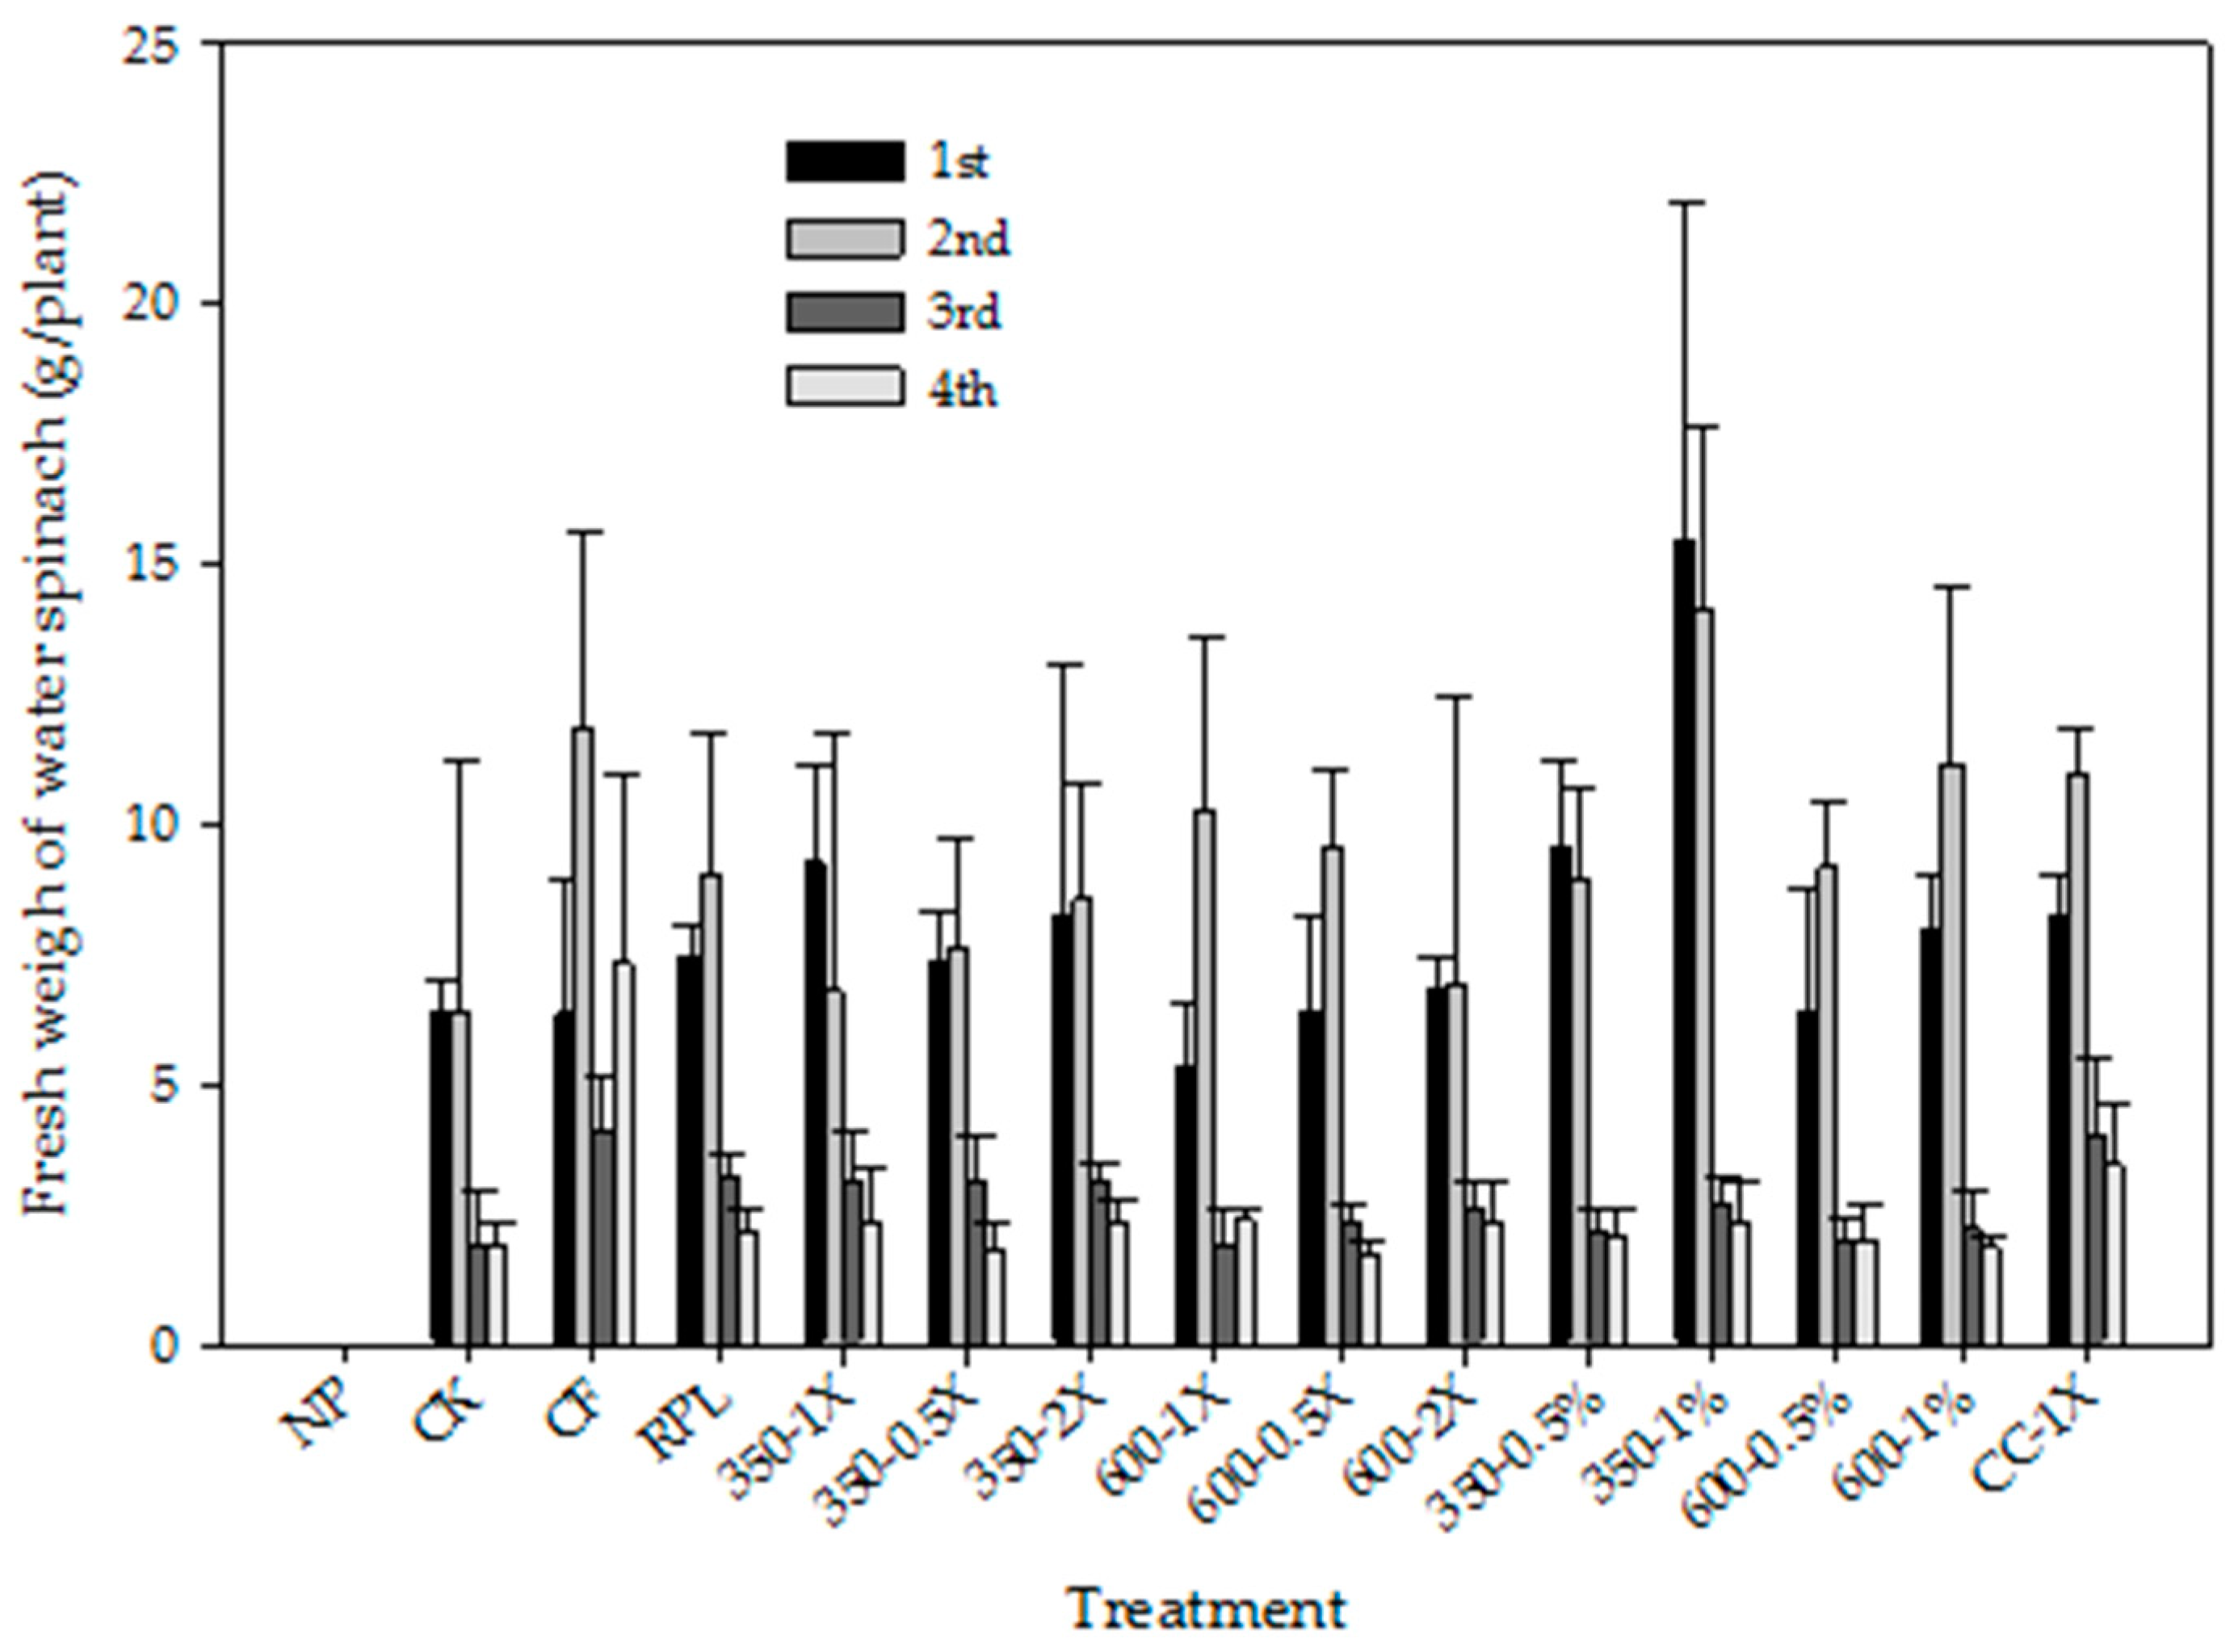
Among different treatments, the concentrations of available NH4+ and available NO3 in S1-1 were higher in the treatments CF, CC-1X, 350-1%, and 350-0.5% (Figure 6). These four treatments also significantly raised the total concentrations of available N in S1-1 from 122–140 mg/kg (NP and CK) to 210–480 mg/kg. However, the total concentrations of available N decreased to a similar level with NP and CK in S1-2, which may be attributed to the leaching effects of rainfall brought by a typhoon during the first cultivation. Nevertheless, it was found that the total concentration of available N in the S4-2 soil samples decreased to 6–25 mg/kg. The concentrations of available nitrate in the topsoil samples of S4-2 in the treatments NP (6.0 ± 2.0 mg/kg), CK (9.5 ± 2.0 mg/kg), and CF (8.6 ± 1.7 mg/kg) were lower those in the other treatments. The treatments of 350-0.5% and CC-1X had the higher concentration of available nitrate which was 22.4 ± 9.5 and 22.4 ± 3.3 mg/kg, respectively. Nitrate was the main inorganic N in the soils in the S1-1, S1-2, and S2-1 in general. After two harvests, however, NH4+ became the primary inorganic N in the amended soils. This might be a result of the significant amount of rainfall caused by the typhoon during the experimental period, which leached NO3 from the soils. After four harvests, the application of two PLBs as P2O5 at 30–120 kg/ha also significantly increased the total concentrations of available N to the levels of 12–19 mg/kg.
In the S1-1 samples of the 600-2X, 350-0.5%, 350-1%, 600-0.5%, 600-1%, and CC-1X treatments, the concentrations of available P (Figure 7) were significantly increased to 60–150 mg/kg compared to the values of 21–24 mg/kg in the NP and CK treatments (p < 0.05). The concentrations of available P in the S4-2 samples of the 0.5% and 1% treatments of two PLBs were in the levels of 120–250 mg/kg. After four harvests, the concentrations of available P in NP and CK slightly increased from 21–24 mg/kg (S1-1) to approximately 40–41 mg/kg (S4-2). The extents in the increases were more significant in the treatments of 350-0.5% and 350-1% even after four harvests. After four harvests, the application of two PLBs as P2O5 at 30–120 kg/ha increased the concentrations of available P in S4-2 in general. The simultaneous increases in the concentrations of exchangeable K, available N, and available P in these treatments promoted the growth of water spinach, illustrated in Section 3.4.

3.4. Plant Growth

As shown in Figure 8 and Figure 9, the treatments of CF, RPL, CC, and PLBs could promote the growth of water spinach compared with that in the CK treatment. The most significant effect was observed in the case of 350-1%. In the third and fourth harvests, however, insignificant differences among different treatments were observed. The growth of water spinach from the fourth harvest was generally lower than that from the first harvest, except for CF. This decline in growth (Figure 8 and Figure 9) in the treatment of 350-1% and other PLB treatments may be attributed to the leaching loss of available NO3 during the periods of four cultivations. Because of the increases in the concentrations of exchangeable K, available N, and available P under various treatments, the average fresh weights of water spinach collected from various PLB treatments were still higher than that from the CK treatment. The average fresh weights of water spinach grown in the treatments of two PLBs as P2O5 at 30–120 kg/ha were 1.0–1.3 times higher than that in the CK treatment.

4. Discussion

In the NP and CK treatments, the soil pH values were increased from 5.9–6.0 to 6.7–6.8 after four consecutive cultivations of water spinach, even though no amendments were added to the soils (Figure 1). The increases in the soil pH values may be contributed by native alkaline from the irrigation water. During the experimental period, the application of PLB as 350-1%, 600-0.5%, and 600-1% gradually increased the soil pH, which may affect nutrient availability in the soils [4]. Biochar has been documented to affect the availability of N and P in the rooting zone [50]. Depending on the temperature and feedstock properties of biochars, the amendment of biochars may contribute nutrients to the amended soil to different extents [51]. Meanwhile, the liming effects of biochar may cause the increase in soil pH, which plays a key role in determining nutrient availability in soils. The increase in soil pH also has a positive effect on the metal adsorption of biochar particles, since the negative charges on the surfaces of biochar particles increased with increasing pH [52,53,54].
In S1-1 treatment, the ECw values of the soils in the treatments of 350-2X, 600-2X, 350-0.5%, and 600-0.5% were 3.8–11.5 times of those in the NP and CK treatments (Figure 3). The higher EC values could potentially reduce the water potential of the soil water and thus inhibit plant growth [55]; however, the higher ECw did not restrict the growth of water spinach, as the corresponding shoot height and fresh weight still increased (Figure 8 and Figure 9). However, for EC-sensitive plants, cautions need to be taken to apply a suitable amount of PLB to soils to avoid salt stress to plants grown on the soils.
The drastically decreasing in the ECw values of the S1-2 samples was potentially attributed to a large amount of rainfall brought by a typhoon during the first harvest. According to data from the Central Weather Bureau of Taiwan, the total rainfall in the experimental area in June 2016 reached 218.5 mm. The high amount of rainfall could result in the leaching loss of salts and consequently the decrease of ECw in the S1-2 samples. The soil ECw values of all treatments were thus decreased to similar values after the first harvest. The ECw values of the subsoil (15–30 cm) samples of S4-1 and S4-2 were in the ranges of 0.07–0.12 and 0.07–0.10 dS/m, respectively. The ECw values of the surface soil (0–15 cm) samples of S4-1 and S4-2 were 1.2–3.5 times higher than those of the corresponding subsoil samples. This revealed that the application of PLB did not affect the ECw of subsoil although some exchangeable cations were leached out from the surface soil after continuing cultivations.
Essential base saturation percentage (EBSP) can be calculated using the ratio of the sum of exchangeable essential cations (Ca, Mg, and K) and CEC. The EBSP values of S1-1 and S4-2 in the treatments of NP and CK were 14.7–15.1% and 15.0–15.5%, respectively. The EBSP values were increased with the application rate of PLBs. For example, the treatments of 350-1%, 600-0.5%, and 600-1% resulted in the increase of the EBSP value of the S1-1 sample to 20.3–25.3%, which were significantly higher than those in the NP and CK treatments (p < 0.05). Even after four harvests (S4-2), the EBSP values in the treatments of 350-1% and 600-1% were 17.8–19.4%, which were still higher than the NP and CK counterparts. For most crops, the suggested molar ratio of Ca/Mg in soils is 2–5. The molar ratios of Ca/Mg in the S1-1 and S4-2 samples of the NP and CK treatments were in the ranges of 3.1–3.4 and 2.2–2.3, respectively. The treatments of 350-1% and 600-1% resulted in the increases in the concentrations of exchangeable Mg and, consequently, the corresponding molar ratios of Ca/Mg in the S4-2 samples were decreased to the values of 1.89 and 1.87, respectively. Comparatively, the Ca/Mg ratio in the other treatments were ranged from 2.0 to 3.4. These results indicated that the 1% application rate of two PLBs could result in the imbalance of Ca and Mg for the growth of plants. Because of the higher contents of Ca, Mg, and K of 600 °C PLB, the treatments of 600-0.5% and 600-1% had higher concentrations of exchangeable cations in comparison to 650–0.5% and 350-1% in S1-1. After four harvests, there were no significant differences in the concentrations of exchangeable Ca and Mg between different treatments; however, the concentrations of exchangeable K in the soil samples of the 350-2X, 600-2X, 600-1X, and CC-1X treatments were still higher than those of the CK and NP treatments (Figure 5). One possible reason for this phenomenon is the increases in the concentrations of available P due to PLB treatments (Figure 7). The exchangeable Ca and Mg resulted from the application of PLBs might form precipitations of Ca-P and Mg-P and thus decreased their exchangeable concentrations [56].
The results of S1-1, S2-1, S3-1, and S4-1 showed that CF was a stable supply of available inorganic N in the soil (Figure 6). The total concentrations of inorganic N in CF were 280–650 mg/kg and NO3 accounted for 59–81% of the total. The treatments of 350-0.5%, 350-1%, and CC-1X also provided similar concentrations of available NO3 as CF, even after the first two cultivations of water spinach. After four harvests, the amounts of available NO3 in the surface soils and subsoils were not detectable (data not shown), and available NH4+ accounted for 100% of the available N. This phenomenon is in agreement with Lehmann et al. [20] indicating that biochar reduced leaching of NH4+ and therefore maintained NH4+ level in the surface soil. There were three typhoons in Taiwan during June to October 2016, and the rainfall of June, August, and September were 218.5, 186.0, and 262.5 mm, respectively. A large amount of rainfall brought by these typhoons during the experimental periods could account for the percolation of NO3 downward from the soil profile. Since no available NO3 was detected in the subsoil in S4-2, and the texture of the study soil was loam, NO3 was possibly leached out of the subsoil to further depths of the soil profile. On the other hand, N is mainly taken up as NO3 by plants [57] and the concentrations of available NO3 in most treatments were deficient during the third and fourth harvests, except for CF. In general, the fresh weights of water spinach in the last two harvests were significantly lower compared to the first two harvests (p < 0.05). The CF could have replenished the leaching loss of available NO3, and thus had higher shoot height (Figure 8) and fresh weight (Figure 9) compared to CK in general.
Increased fertility of soil due to biochar application is likely to increase crop vigor and thus may enhance disease resistance [57]. In addition to soil fertility, the amendment of PLB to a soil could potentially enhance soil quality [57], especially through improving the physical properties of the soil such as soil porosity and air permeability. The improvement of the physical properties of a soil can render a more favorable environment for root growth [57,58]. Although the physical properties were not analyzed in this study, the increases in shoot height and fresh weight upon various PLB treatments could, in part, resulted from the improvement of the soil physical properties.
Agrafioti et al. [59] reported that an increase in pyrolytic temperature of a biochar results in a decrease in total N content, water sorption capacity, and CEC of the biochar [60,61,62], while the pH, carbon content [63], available nutrients [61], and heavy metal stability [64] of the biochar was increased. It is noted that the optimum pyrolytic temperature depends on the purpose of biochar application. Biochar produced at low temperatures is suitable for agricultural uses, while pyrolysis at higher temperatures can improve the porosity of the resultant biochar and thus enhance its effectiveness in adsorbing contaminants in soil [59]. As shown in this study, the shoot height and fresh weight of water spinach grown in the treatments of 350-0.5% and 350-1% were 1.1–1.5-fold higher than those in the treatments of 600-0.5% and 600-1%. This result was in agreement with a previous study [24]. Thus, in comparison to CK, the water spinach grown in various PLB treatments had a 1.0–1.3-fold higher average shoot height and a 1.1–2.1-fold higher average fresh weight. This revealed that PLB amendment could promote the growth of water spinach which resulted from the increases in the exchangeable K (Figure 5), available N (Figure 6), and available P (Figure 7) in the soils due to various PLB treatments. Among these PLB treatments, water spinach grown in 350-1% had higher shoot height and fresh weight; however, this treatment could result in the imbalance between Ca and Mg after four harvests and therefore is not recommended for growing water spinach or other crops. Although the CF and CC-1X treatments also have positive effects on water spinach grown in terms of shoot height and fresh weight, the conversion of poultry litter into PLB for soil application is a better option because this practice will increase the soil carbon sequestration and further alleviate greenhouse effect [54].

5. Conclusions

The application of PLBs to a soil increased the pH, EC, and concentrations of available inorganic N, available P, and exchangeable K in the soil, which consequently enhanced the growth of water spinach. The application of PLB in accordance with the recommended amount of P2O5 was also evidenced to improve the growth of water spinach. However, the application of 1% PLBs to soils resulted in higher EC values, higher EBSP, and the imbalance between Ca and Mg, which may have a negative effect on the growth of crops. The treatment of 350-0.5% is thus a more suitable PLB application when a large amount of PLB is amended to farmland soils for the purpose of enhancing soil carbon sequestration.

Author Contributions

Conceptualization, C.-H.Y., H.-Y.L., S.-L.W., and M.-P.C.; Methodology, C.-H.Y.; Investigation, H.-Y.L.; Writing—Original Draft Preparation, P.T.; Writing—Review and Editing, H.-Y.L. and S.-L.W.; and Supervision, H.-Y.L.

Funding

This research was funded by the Council of Agriculture of the R.O.C. grant number 105AS-2.4.3-AD-U1, 106AS-2.4.3-AD-U1, and in part by the Ministry of Education, Taiwan, R.O.C. under the Higher Education Sprout Project.

Acknowledgments

The authors are grateful to the students of the Soil Survey and Remediation Laboratory, Department of Soil and Environmental Sciences, National Chung Hsing University for their assistances in sample analyses.

Conflicts of Interest

The authors declare no conflict of interest.

References

  1. McMichael, A.J.; Powles, J.W.; Butler, C.D.; Uauy, R. Energy and health 5—Food, livestock production, energy, climate change, and health. Lancet 2007, 370, 1253–1263. [Google Scholar] [CrossRef]
  2. Hsu, H.H.; Chen, C.T. Observed and projected climate change in Taiwan. Meteorol. Atmos. Phys. 2002, 79, 87–104. [Google Scholar] [CrossRef]
  3. Chen, H.; Petley, D.N. The impact of landslides and debris flows triggered by Typhoon Mindulle in Taiwan. Q. J. Eng. Geol. Hydrogeol. 2005, 38, 301–304. [Google Scholar] [CrossRef]
  4. Tewolde, H.; Adeli, A.; Sistani, K.R.; Rowe, D.E. Mineral nutrition of cotton fertilized with poultry litter or ammonium nitrate. Agron. J. 2011, 103, 1704–1711. [Google Scholar] [CrossRef]
  5. Jn-Baptiste, M.; Sistani, K.R.; Tewolde, H. Poultry manure application time impact on corn grain production in a crider silt Loam. Soil Sci. 2012, 177, 47–55. [Google Scholar] [CrossRef]
  6. Petersen, S.O.; Sommer, S.G.; Beline, F.; Burton, C.; Dach, J.; Dourmad, J.Y.; Leip, A.; Misselbrook, T.; Nicholson, F.; Poulsen, H.D.; et al. Recycling of livestock manure in a whole-farm perspective. Livest. Sci. 2007, 112, 180–191. [Google Scholar] [CrossRef]
  7. Blasi, C.D.; Buonanno, F.; Branca, C. Reactivities of some biomass chars in air. Carbon 1999, 37, 1227–1238. [Google Scholar] [CrossRef]
  8. Schmidt, M.W.I.; Noack, A.G. Black carbon in soils and sediments: Analysis, distribution, implications and current challenges. Glob. Biogeochem. Cycle 2000, 14, 777–793. [Google Scholar] [CrossRef]
  9. Radovic, L.R.; Moreno-Castilla, C.; Rivera-Ulrilla, J. Carbon materials as adsorbents in aqueous solutions. Chem. Phys. Carb. 2001, 27, 227–405. [Google Scholar]
  10. Mandal, K.G.; Misra, A.K.; Hati, K.M.; Bandyopadhyay, K.K.; Ghosh, P.K.; Mohanty, M. Rice residue-management options and effects on soil properties and crop productivity. J. Food Agric. Environ. 2004, 2, 224–231. [Google Scholar]
  11. Haefele, S.M.; Knoblauch, C.; Gummert, M.; Konboon, Y.; Koyama, S. Black carbon (biochar) in rice-based systems: Characterization and opportunities. In Amazonian Dark Earths: Wim Sombroek’s Vision; Woods, W.I., Teixeira, W.G., Lehmann, J., Steiner, C., WinklerPrins, A., Rebellato, L., Eds.; Springer: Dordrecht, The Netherlands, 2009; pp. 445–463. ISBN 978-1-4020-9030-1. [Google Scholar]
  12. Beesley, L.; Moreno-Jimenez, E.; Gomez-Eyles, J.L.; Harris, E.; Robinson, B.; Sizmur, T. A review of biochars’ potential role in the remediation, revegetation and restoration of contaminated soils. Environ. Pollut. 2011, 159, 3269–3282. [Google Scholar] [CrossRef] [PubMed]
  13. Lehmann, J.; Gaunt, J.; Rondon, M. Bio-char sequestration in terrestrial ecosystems—A review. Mitig. Adapt. Strateg. Glob. Chang. 2006, 11, 403–427. [Google Scholar] [CrossRef]
  14. Verheijen, F.; Jeffery, S.; Bastos, A.; van der Velde, M.; Diafas, I. A critical scientific review of effects on soil properties processes and functions. In Biochar Application to Soils; European Communities: Luxembourg, 2010; pp. 1018–5593. [Google Scholar]
  15. Anyanwu, I.N.; Alo, M.N.; Onyekwere, A.M.; Crosse, J.D.; Nworie, O.; Chamba, E.B. Influence of biochar aged in acidic soil on ecosystem engineers and two tropical agricultural plants. Ecotoxicol. Environ. Saf. 2018, 153, 116–126. [Google Scholar] [CrossRef] [PubMed]
  16. Mukherjee, A.; Lal, R. Biochar impacts on soil physical properties and greenhouse gas emissions. Agron. J. 2013, 3, 313–339. [Google Scholar] [CrossRef]
  17. Amarasinghe, H.; Gunathilake, S.; Karunarathna, A. Ascertaining of optimum pyrolysis conditions in producing refuse tea biochar as a soil amendment. Proc. Food Sci. 2016, 6, 97–102. [Google Scholar] [CrossRef]
  18. Grossman, J.M.; O’Neill, B.E.; Tsai, S.M.; Liang, B.Q.; Neves, E.; Lehmann, J.; Thies, J.E. Amazonian anthrosols support similar microbial communities that differ distinctly from Those Extant in Adjacent, Unmodified Soils of the Same Mineralogy. Microb. Ecol. 2010, 60, 192–205. [Google Scholar] [CrossRef] [PubMed]
  19. Egamberdieva, D.; Wirth, S.; Behrendt, U.; Allah, E.F.A.; Berg, G. Biochar treatment resulted in a combined effect on soybean growth promotion and a shift in plant growth promoting rhizobacteria. Front. Microbiol. 2016, 7. [Google Scholar] [CrossRef] [PubMed]
  20. Lehmann, J.; da Silva, J.P.; Steiner, C.; Nehls, T.; Zech, W.; Glaser, B. Nutrient availability and leaching in an archaeological Anthrosol and a Ferralsol of the Central Amazon basin: Fertilizer, manure and charcoal amendments. Plant Soil 2003, 249, 343–357. [Google Scholar] [CrossRef]
  21. Steiner, C.; Glaser, B.; Teixeira, W.G.; Lehmann, J.; Blum, W.E.H.; Zech, W. Nitrogen retention and plant uptake on a highly weathered central Amazonian Ferralsol amended with compost and charcoal. J. Plant Nutr. Soil Sci. 2008, 171, 893–899. [Google Scholar] [CrossRef]
  22. Warnock, D.D.; Lehmann, J.; Kuyper, T.W.; Rillig, M.C. Mycorrhizal responses to biochar in soil—Concepts and mechanisms. Plant Soil 2007, 300, 9–20. [Google Scholar] [CrossRef]
  23. Gaskin, J.W.; Speir, A.; Morris, L.; Ogden, L.; Harris, K.; Lee, D.; Das, K. Potential for pyrolysis char to affect soil moisture and nutrient status of a loamy sand soil. In Proceedings of the 2007 Georgia Water Resources Conference, Athens, GA, USA, 27–29 March 2007. [Google Scholar]
  24. Zee, T.; Nelson, N.; Newdigger, G. Biochar and nitrogen effects on winter wheat growth. Kans. Agric. Exp. Stn. Res. Rep. 2017, 3, 6. [Google Scholar] [CrossRef]
  25. Xu, H.J.; Wang, X.H.; Li, H.; Yao, H.Y.; Su, J.Q.; Zhu, Y.G. Biochar impacts soil microbial community composition and nitrogen cycling in an acidic soil planted with rape. Environ. Sci. Technol. 2014, 48, 9391–9399. [Google Scholar] [CrossRef] [PubMed]
  26. Trupiano, D.; Cocozza, C.; Baronti, S.; Amendola, C.; Vaccari, F.P.; Lustrato, G.; Di Lonardo, S.; Fantasma, F.; Tognetti, R.; Scippa, G.S. The effects of biochar and its combination with compost on lettuce (Lactuca sativa L.) growth, soil properties, and soil microbial activity and abundance. Int. J. Agron. 2017, 2017, 3158207. [Google Scholar] [CrossRef]
  27. Vaccari, F.; Maienza, A.; Miglietta, F.; Baronti, S.; Di Lonardo, S.; Giagnoni, L.; Lagomarsino, A.; Pozzi, A.; Pusceddu, E.; Ranieri, R. Biochar stimulates plant growth but not fruit yield of processing tomato in a fertile soil. Agric. Ecosyst. Environ. 2015, 207, 163–170. [Google Scholar] [CrossRef]
  28. Carter, S.; Shackley, S.; Sohi, S.; Suy, T.B.; Haefele, S. The impact of biochar application on soil properties and plant growth of pot grown lettuce (Lactuca sativa) and cabbage (Brassica chinensis). Agronomy 2013, 3, 404–418. [Google Scholar] [CrossRef] [Green Version]
  29. Biederman, L.A.; Harpole, W.S. Biochar and its effects on plant productivity and nutrient cycling: A meta-analysis. GCB Bioenergy 2013, 5, 202–214. [Google Scholar] [CrossRef]
  30. Buss, W.; Mašek, O.; Graham, M.; Wüst, D. Inherent organic compounds in biochar—Their content, composition and potential toxic effects. J. Environ. Manag. 2015, 156, 150–157. [Google Scholar] [CrossRef] [PubMed]
  31. Domene, X.; Hanley, K.; Enders, A.; Lehmann, J. Short-term mesofauna responses to soil additions of corn stover biochar and the role of microbial biomass. Appl. Soil Ecol. 2015, 89, 10–17. [Google Scholar] [CrossRef]
  32. Graber, E.R.; Harel, Y.M.; Kolton, M.; Cytryn, E.; Silber, A.; David, D.R.; Tsechansky, L.; Borenshtein, M.; Elad, Y. Biochar impact on development and productivity of pepper and tomato grown in fertigated soilless media. Plant Soil 2010, 337, 481–496. [Google Scholar] [CrossRef]
  33. Atkinson, C.J.; Fitzgerald, J.D.; Hipps, N.A. Potential mechanisms for achieving agricultural benefits from biochar application to temperate soils: A review. Plant Soil 2010, 337, 1–18. [Google Scholar] [CrossRef]
  34. Belyaeva, O.N.; Haynes, R.J. Comparison of the effects of conventional organic amendments and biochar on the chemical, physical and microbial properties of coal fly ash as a plant growth medium. Environ. Earth Sci. 2012, 66, 1987–1997. [Google Scholar] [CrossRef]
  35. Novak, J.M.; Lima, I.; Xing, B.; Gaskin, J.W.; Steiner, C.; Das, K.; Ahmedna, M.; Rehrah, D.; Watts, D.W.; Busscher, W.J. Characterization of designer biochar produced at different temperatures and their effects on a loamy sand. Ann. Environ. Sci. 2009, 3, 195–206. [Google Scholar]
  36. Zhu, Q.H.; Peng, X.H.; Huang, T.Q.; Xie, Z.B.; Holden, N.M. Effect of biochar addition on maize growth and nitrogen use efficiency in acidic red soils. Pedosphere 2014, 24, 699–708. [Google Scholar] [CrossRef]
  37. Yuan, J.H.; Xu, R.K. The amelioration effects of low temperature biochar generated from nine crop residues on an acidic Ultisol. Soil Use Manag. 2011, 27, 110–115. [Google Scholar] [CrossRef]
  38. Weikard, H.P.; Seyhan, D. Distribution of phosphorus resources between rich and poor countries: The effect of recycling. Ecol. Econ. 2009, 68, 1749–1755. [Google Scholar] [CrossRef]
  39. Cordell, D.; Drangert, J.O.; White, S. The story of phosphorus: Global food security and food for thought. Glob. Environ. Chang. 2009, 19, 292–305. [Google Scholar] [CrossRef]
  40. Nelson, D.W.; Sommers, L.E. Total carbon, organic carbon, and organic matter. In Methods of Soil Analysis: Part 3; Sparks, D.L., Page, A.L., Helmke, P.A., Loeppert, R.H., Soltanpour, P.N., Tabatabai, M.A., Johnston, C.T., Sumner, M.E., Eds.; SSSA Book Series No. 5, SSSA and ASA; SSSA Inc.; ASA Inc.: Madison, WI, USA, 1996; pp. 961–1010. [Google Scholar]
  41. Sumner, M.E.; Miller, W.P. Cation exchange capacity and exchange coefficients. In Methods of Soil Analysis: Part 3; Sparks, D.L., Page, A.L., Helmke, P.A., Loeppert, R.H., Soltanpour, P.N., Tabatabai, M.A., Johnston, C.T., Sumner, M.E., Eds.; SSSA Book Series No. 5, SSSA and ASA; SSSA Inc.; ASA Inc.: Madison, WI, USA, 1996; pp. 1201–1230. [Google Scholar]
  42. Gee, G.W.; Bauder, J.W. Particle-size analysis. In Methods of Soil Analysis. Part 1. Physical and Mineralogical Method; Klute, A., Ed.; ASA Inc.; SSSA Inc.: Madison, WI, USA, 1986; pp. 383–412. [Google Scholar]
  43. EPA/Taiwan. Method Code No: NIEA S321.64B; Environmental Protection Administration of Taiwan ROC: Taipei, Taiwan, 2015.
  44. Jones, J.B.; Case, V.W. Sampling, handling and analyzing plant tissue samples. In Soil Testing and Plant Analysis; Westerman, R.L., Ed.; SSSA Inc.: Madison, WI, USA, 1990; pp. 389–427. [Google Scholar]
  45. Thomas, G.W. Soil pH and soil acidity. In Methods of Soil Analysis: Part 3; Sparks, D.L., Page, A.L., Helmke, P.A., Loeppert, R.H., Soltanpour, P.N., Tabatabai, M.A., Johnston, C.T., Sumner, M.E., Eds.; SSSA Book Series No. 5, SSSA and ASA; SSSA Inc.; ASA Inc.: Madison, WI, USA, 1996; pp. 475–490. [Google Scholar]
  46. Rhoades, J.D. Salinity: Electrical conductivity and total dissolved solids. In Methods of Soil Analysis: Part 3; Sparks, D.L., Page, A.L., Helmke, P.A., Loeppert, R.H., Soltanpour, P.N., Tabatabai, M.A., Johnston, C.T., Sumner, M.E., Eds.; SSSA Book Series No. 5, SSSA and ASA; SSSA Inc.; ASA Inc.: Madison, WI, USA, 1996; pp. 417–435. [Google Scholar]
  47. Mulvaney, R.L. Nitrogen—Inorganic forms. In Methods of Soil Analysis: Part 3; Sparks, D.L., Page, A.L., Helmke, P.A., Loeppert, R.H., Soltanpour, P.N., Tabatabai, M.A., Johnston, C.T., Sumner, M.E., Eds.; SSSA Book Series No. 5, SSSA and ASA; SSSA Inc.; ASA Inc.: Madison, WI, USA, 1996; pp. 1123–1184. [Google Scholar]
  48. Kuo, S. Phosphorus. In Methods of Soil Analysis: Part 3; Sparks, D.L., Page, A.L., Helmke, P.A., Loeppert, R.H., Soltanpour, P.N., Tabatabai, M.A., Johnston, C.T., Sumner, M.E., Eds.; SSSA Book Series No. 5, SSSA and ASA; SSSA Inc.; ASA Inc.: Madison, WI, USA, 1996; pp. 869–919. [Google Scholar]
  49. Weil, R.R.; Brady, N.C. The Nature and Properties of Soil; Pearson Education: Upper Saddle River, NJ, USA, 2017; pp. 438–481. ISBN 978-0-13-325448-8. [Google Scholar]
  50. Prendergast-Miller, M.T.; Duvall, M.; Sohi, S.P. Biochar-root interactions are mediated by biochar nutrient content and impacts on soil nutrient availability. Eur. J. Soil Sci. 2014, 65, 173–185. [Google Scholar] [CrossRef]
  51. Rillig, M.C.; Thies, J.E. Characteristics of biochar: Biological properties. In Biochar for Environmental Management; Joseph, S., Lehmann, J., Eds.; Routledge: London, UK, 2012; pp. 117–138. [Google Scholar]
  52. Huang, J.H.; Hsu, S.H.; Wang, S.L. Effects of rice straw ash amendment on Cu bioavailability in flooded rice paddy soils. J. Hazard. Mater. 2011, 186, 1801–1807. [Google Scholar] [CrossRef] [PubMed]
  53. Hsu, S.H.; Wang, S.L.; Huang, J.H.; Huang, S.T.; Wang, M.K. Effects of rice straw ash amendment on Cd solubility and distribution in a contaminated paddy soil under submergence. Paddy Water Environ. 2015, 13, 135–143. [Google Scholar] [CrossRef]
  54. Liao, I.H.; Huang, J.H.; Wang, S.L.; Cheng, M.P.; Liu, J.C. Adsorptions of Cd(II) and Pb(II) in aqueous solution by rice-straw char. Desalin. Water Treat. 2015, 57, 21619–21626. [Google Scholar] [CrossRef]
  55. Lee, S.-E.; Ahn, H.-J.; Youn, S.-K.; Kim, S.-M.; Jung, K. Application effect of food waste compost abundant in NaCl on the growth and cationic balance of rice plant in paddy soil. Korean J. Soil Sci. Fertil. 2000, 33, 100–108. [Google Scholar]
  56. Havlin, J.L.; Tisdale, S.L.; Nelson, W.L.; Beaton, J.D. (Eds.) Soil Fertility and Fertilizers; Pearson Inc.: Upper Saddle River, NJ, USA, 2014; pp. 185–221. [Google Scholar]
  57. Major, J.; Steiner, C.; Downie, A.; Lehmann, J.; Joseph, S. Biochar effects on nutrient leaching. In Biochar for Environmental Management: Science and Technology; Joseph, S., Lehmann, J., Eds.; Earthscan: London, UK, 2009; p. 271. [Google Scholar]
  58. Mikan, C.J.; Abrams, M.D. Altered forest composition and soil properties of historic charcoal hearths in Southeastern Pennsylvania. Can. J. For. Res. 1995, 25, 687–696. [Google Scholar] [CrossRef]
  59. Agrafioti, E.; Bouras, G.; Kalderis, D.; Diamadopoulos, E. Biochar production by sewage sludge pyrolysis. J. Anal. Appl. Pyrolysis 2013, 101, 72–78. [Google Scholar] [CrossRef]
  60. Antal, M.J.; Grønli, M. The art, science, and technology of charcoal production. Ind. Eng. Chem. Res. 2003, 42, 1619–1640. [Google Scholar] [CrossRef]
  61. Gaskin, J.W.; Steiner, C.; Harris, K.; Das, K.C.; Bibens, B. Effect of low-temperature pyrolysis conditions on biochar for agricultural use. Trans. ASABE 2008, 51, 2061–2069. [Google Scholar] [CrossRef]
  62. Guo, M.X.; Shen, Y.F. Quality variations of poultry litter biochar generated at different pyrolysis temperatures. J. Am. Chem. Soc. 2011, 94, 138–145. [Google Scholar]
  63. Demirbas, A. Effects of temperature and particle size on bio-char yield from pyrolysis of agricultural residues. J. Anal. Appl. Pyrolysis 2004, 72, 243–248. [Google Scholar] [CrossRef]
  64. He, Y.D.; Zhai, Y.B.; Li, C.T.; Yang, F.; Chen, L.; Fan, X.P.; Peng, W.F.; Fu, Z.M. The fate of Cu, Zn, Pb and Cd during the pyrolysis of sewage sludge at different temperatures. Environ. Technol. 2010, 31, 567–574. [Google Scholar] [CrossRef] [PubMed]
Figure 1. Effects of various treatments on the soil pH (NP: no plant growth and no amendment; CK: plant growth with no amendment; CF: urea and monobasic potassium phosphate were applied as N: P2O5: K2O = 120:60:120 kg/ha; RPL: raw poultry litter was applied as P2O5 = 60 kg/ha; 350-1X, 350-0.5X, and 350-2X: applied 350 °C PLB as P2O5 = 60, 30, and 120 kg/ha, respectively; 600-1X, 60-0.5X, and 600-2X: applied 600 °C PLB as P2O5 = 60, 30, and 120 kg/ha, respectively; 350-0.5% and 350-1%: applied 10 and 20 ton/ha of 350 °C PLB, respectively; 600-0.5% and 600-1%: applied 10 and 20 ton/ha of 600 °C PLB, respectively; CC-1X: applied poultry-litter compost as P2O5 = 60 kg/ha).
Sustainability 10 02536 g001
Figure 2. Effects of various treatments on soil electrical conductivity (ECw). (Meanings of abbreviations are the same as Figure 1).
Sustainability 10 02536 g002
Figure 3. Effects of various treatments on the concentrations of exchangeable Ca in the soils. (Meanings of abbreviations are the same as Figure 1).
Sustainability 10 02536 g003
Figure 4. Effects of various treatments on the concentrations of exchangeable Mg in the soils. (Meanings of abbreviations are the same as Figure 1).
Sustainability 10 02536 g004
Figure 5. Effects of various treatments on the concentrations of exchangeable K in the soils. (Meanings of abbreviations are the same as Figure 1).
Sustainability 10 02536 g005
Figure 6. Effects of various treatments on the concentrations of total available N in the soils. (Meanings of abbreviations are the same as Figure 1).
Sustainability 10 02536 g006
Figure 7. Effects of various treatments on the concentrations of available P in the soils. (Meanings of abbreviations are the same as Figure 1).
Sustainability 10 02536 g007
Figure 8. Effects of various treatments on the shoot height of water spinach. (Meanings of abbreviations are the same as Figure 1).
Sustainability 10 02536 g008
Figure 9. Effects of various treatments on the fresh weight of water spinach. (Meanings of abbreviations are the same as Figure 1).
Sustainability 10 02536 g009
Table 1. The pH, EC, and the total concentrations of different elements of two types of PLBs used in this study.
Pyrolysis TemperatureUnit
350 °C600 °C
pH 18.137.78-
EC 110.0716.18dS/m
Carbon (C)23.4321.07%
Hydrogen (H)3.141.13%
Oxygen (O)27.9820.91%
Nitrogen (N)2.601.79%
Phosphorus (P)1.973.00%
Potassium (K)2.293.44%
Calcium (Ca)7.068.16%
Magnesium (Mg)1.401.91%
Sulfur (S)1.321.57%
Iron (Fe)8022137mg/kg
Manganese (Mn)543772mg/kg
Copper (Cu)91126mg/kg
Zinc (Zn)8031061mg/kg
Nickel (Ni)ND 2NDmg/kg
Arsenic (As)NDNDmg/kg
Cadmium (Cd)NDNDmg/kg
Chromium (Cr)NDNDmg/kg
Lead (Pb)NDNDmg/kg
1w/v = 1/5; 2 not detectable.

