1. Introduction
The circular economy represents a main concept for the sustainability of the EU economy representing the creation of certain models of economy where minimum or no environmental negative impacts are created, thus respecting the triple bottom line, namely people, planet and profit. In the current society, the recycling efficiency issues especially of municipal waste, as well as the circular material usage are two of the main subjects of debate for the political, economic and social fields. These two aspects, as well as the design of non-waste generating products and services represent some of the main elements for an efficient implementation of the circular economy in the production and consumption process. In the present study, we will focus mostly on the recycling issue of the circular economy. According to Yamamoto and Yamamoto [
1], circular economy refers to the recycling based economy of 3R (“reduce, reuse and recycle”) comparing to the classical model of mass production, consumption and disposal, thus referring to the waste management strategies and redesigning the whole economic model towards resource reintegration and a thorough minimization of waste generation.
In order to stimulate this sector, contributing to a circular economy, the European waste policy was created to form the necessary framework to support waste management strategies. Today, legal regulations, such Extended Producer Responsibility standards, further add to the sustainability requirements in the business field, as they impose to producers to organize and pay for the treatment and reintegration of their products at the end of the life cycle, being considered as effective for contributing to circular economy [
2]. While the striving towards sustainability and green energy has become one of the main issues of debate, waste management is still a problem when it comes to reducing the amount of waste produced on a global scale, as well as its reuse, repair or reintegration further in other production and consumption processes. Valuable resources, such as metal, wood, glass, paper and other, can be reused after the main lifecycle of a product, bringing more value than the main life cycle of a product or material. For example, Cetiner and Shea [
3] mention the importance of materials, such as bio-based natural fibre materials such as cork, cotton, wood fibre, and hemp, which are already preferred by clients and designers, who are more environmentally conscious. Van Ewijk et al. [
4] underline the importance of used materials, especially paper, as well as their recycling ratios decrease, underlining also the significance of consumers contribution to the sustainable behavior overall. Guo et al. [
5] mention other sources of waste, such as electric and electronic equipment, that generate approximately 20 tonnes per year). However, due to different waste management efficiency in different regions, lacking legal supportive frameworks in the sense of supporting waste management and poor stimulation of the households, industries and economic sectors towards contributing to reintegration or repairing waste in several countries, waste management still is a main strategic issue on a global scale. Other authors have inquired different aspects of the waste treatment and recycling, such as Yadav and Samadder [
6], who emphasize landfilling as a main method used, but one of the least preferred in terms of circular economy. Rada et al. [
7] emphasize the evaluation of the efficiency of the circular economy through another indicator, namely the selective collection quality indexexpressed in terms of percentage with respect to the total amount of waste is conditioned by certain main factors, staring with the typology of tariff details. As the need for a circular economy becomes a usual standard within the business field, studies concerning consumers’ behavior towards sustainable production and consumption have started to emerge, such as the one of Lakatos et al. for the Romanian market [
8], which revealed the interviewed sample of respondents between 35–44 years old, was mostly concerned about less impact on the environment through sustainable business and consumption model in comparison to the younger generations from 18–35 years old.
Recycling represents a key factor in the circular economy in terms of waste management strategies, which implies material recycling or biological treatment, namely composting and anaerobic digestion according to [
9]. Currently, recycling is one of the main strategic issues globally, as more waste is generated and lacking regulations in several regions, education in the field and other related problems reduce the amount of waste that is recycled and thus, that is disposed of in the environment, causing negative effects for the planet, climate, fauna and ultimately for mankind. Regarding circular economy, the concept refers thus to cleaner production, industrial ecology and ecological modernization as according to Yuan et al. [
10]. Lewandowski [
11] proposed a new business model canvas referring to a circular economy, which comprises the nine building blocks of Osterwalder and Pigneur, namely: value proposition, main activities, main customer segments, main customer relationship, key resources, channels, cost structure, revenue streams, key partners by adding two more components take back management system and adoption factors, such as organizational capabilities and political, economic, social and technological factors. The author underlines the importance of offering non-tangible services, where possible in order to avoid waste creation, as well as the take back management system for reintegration of products and materials at the end of the life cycle. The circular economy has become a main challenge for business today, as structural changes are needed for the integration of this concept within the activities of companies, as well as of the consumers. While the ensuring maintenance, repairing, replacement and recycling of the used products or product parts is already starting to become a more frequent strategy of companies to ensure their and their customers sustainability, the tendency towards offering more facilities through intangible goods has also started to become a main trend in the sense of implementing circular economy in the business and social activities. However, recycling is a main strategy of solving partly the problem of non-sustainable behavior through waste generation.
The recycling rate of municipal waste is a main indicator of recycling efficiency, being calculated as a ratio between tonnage recycled from municipal waste divided by total municipal waste arising. In terms of municipal waste, this refers to “a large extent of waste generated by households, but may also include similar wastes generated by small businesses and public institutions and collected by the municipality; this latter part of municipal waste may vary from municipality to municipality and from country to country, depending on the local waste management system” [
12]. Therefore, the main objective of the current paper was to elaborate models for determining the dependency between the main selected indicator recycling rate of municipal waste and the other five mentioned in the methodology and findings parts. While similar indicators have been measured in the past decade frequently, few studies regarding regression models in the direction of circular economy and recycling of municipal waste have been published in the scientific literature, being a subject of interest for researchers and the business field as well.
The objective of the present study is to analyze the impact of circular material use, research and development expenditure resource productivity and domestic material consumption, trade in recyclable raw materials, environmental tax revenues of the countries of the European Union on the recycling rate of municipal waste through the estimation of a panel regression model, where the latter indicator is the dependent variable. The present study adds to the scientific literature by estimating the link between new economic and circular economy indicators on the recycling rate of municipal waste variable, which has not been done previously in other studies.
2. Literature
In the past ten years, the traditional model of “buy, consume and dispose” started to gradually be replaced by more sustainable thinking, that imposes slowly the concept of circular economy. The Ellen McArthur Foundation [
13] describes the term of circular economy as “as system that is restorative or regenerative by intention and design that can be achieved by eliminating waste through the superior design of materials, products, systems and, within this, business models”. The circular economy is thus a restructuring of whole economic and social systems, which imply a redesign of the products and services offered from their conceiving phase.
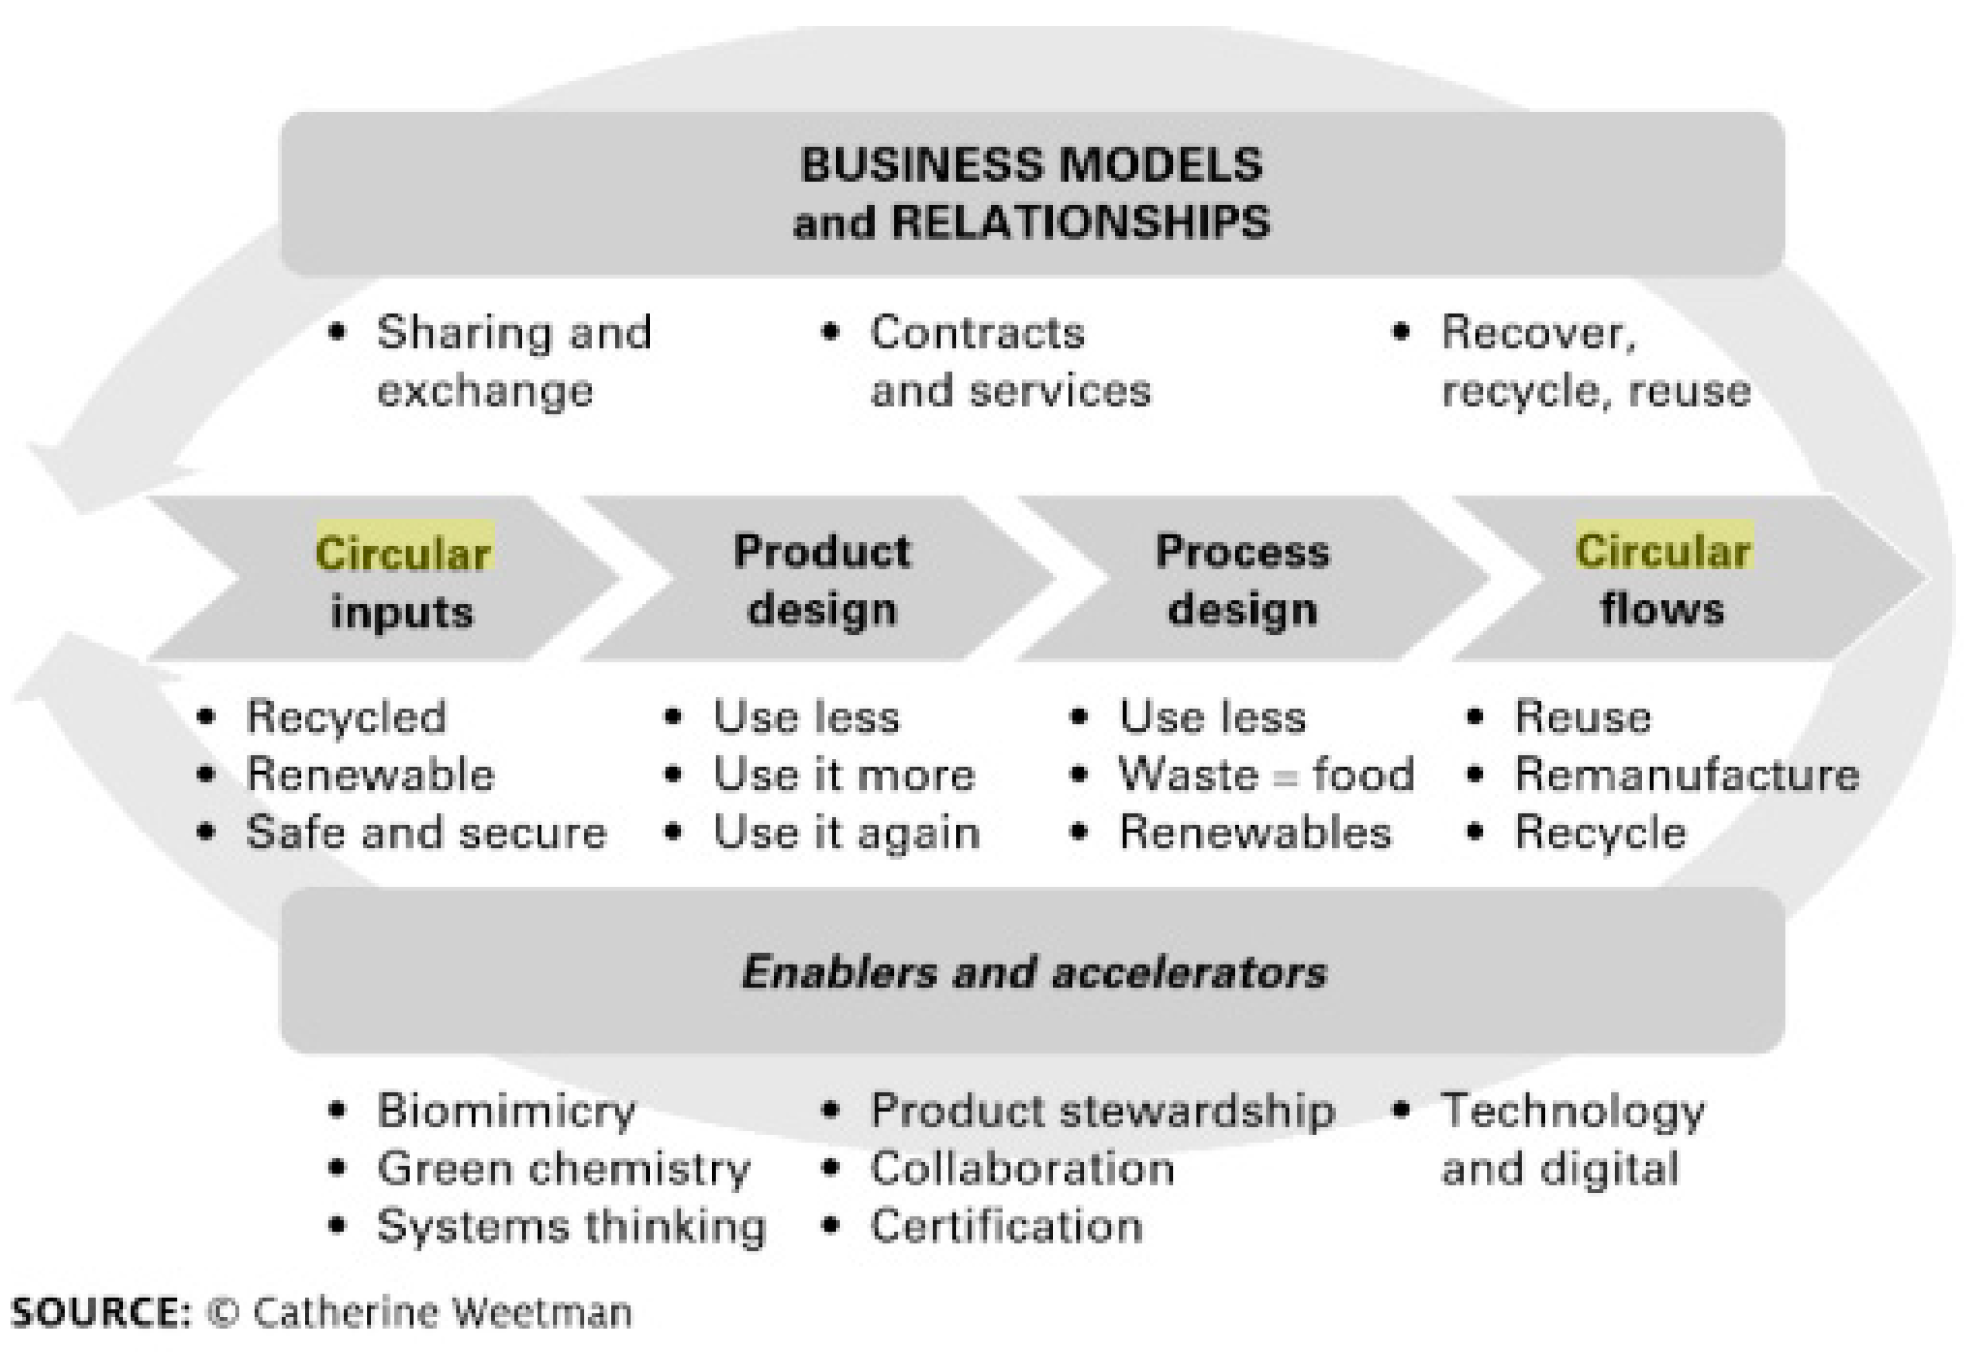
As shown in
Figure 1, Weetman [
14] summarizes the six necessary factors of the circular economy framework, which translate the four principles of this concept, namely:
Circular economy design meaning designing products from the beginning of the production to enable product reuse or recycling or cascading in the sense of becoming input for another product at the end of one life cycle;
New, innovative business models to facilitate the transition from the buy, consume, dispose principle to the sustainability principles mentioned at point 1;
Reverse cycles, meaning providing efficient, innovative systems for new materials and product cascades as well as return of used materials to soil or to production. This implies logistics, collections, sorting, treatment and segmentation;
Enablers and accelerators, namely market mechanisms can encourage reuse of materials and higher resource productivity, such as educational institutions, policymakers, financing in the field, etc. According to Vasallo [
15], a circular economy shifts the focus to reusing, repairing, refurbishing and recycling existing materials and products.
When referring to circular economic models, Kiørboe et al. [
16] mention the following: product design, service and function based models, reuse, repair and collaborative consumption, in the sense that products should be designed from the beginning with the scope of being reintegrated after the life cycle for reuse or repair in order not to become waste. Other authors have provided several other definitions for the concept of a circular economy, such as Benton et al. [
17] that mentioned a circular economy is “one, where the resources coming into the economy are not allowed to become waste or lose their value”. These resources should therefore be recovered and used for as long as possible in production processes. As mentioned by several authors, the term of circular economy is strongly linked to the concept of waste management in the sense of diminishing or eliminating waste after the main cycle of consumption has been fulfilled. Within the meaning of the concept “waste management”, Lemann [
18] includes the formation, treatment and disposal of waste materials and their resulting products, whether resulting from households or industry. Furthermore, van Buren et al. [
19] mention the nine elements of the circular economy: refuse or preventing the use of raw materials; reduce in the sense of reducing the use of raw materials; product reuse (second-hand, sharing of products); repair or maintenance and repair; refurbishing a product; remanufacture or creating new products from (parts of) old products; repurpose meaning product reuse for a different purpose; recycle or processing and reuse of materials; recover energy through incineration of residual flows.
Thus, this definition also emphasizes the need to minimize waste by reuse and repair referring ultimately to the concept of circular economy. Waste can have several meanings depending on the fields of activity, that cause it or debate on it. However, there are some main types of main waste, such as: household waste, namely the unwanted materials produced by families, homes or apartment complexes; commercial waste, originating from the business field or retail establishments; e-waste from electronics; hazardous waste, that is toxic, reactive, corrosive, ignitable; industrial waste from different industries, such as construction and mining; agricultural waste; and medical waste Vaughn [
20].
More indicators are used to measure effectiveness of waste management measures in several fields, as the issue of waste diminishing has become a strategic issue. For example, Cifrian et al. [
21] mention treatment of municipal solid waste (MSW) (recycling, composting, incineration and landfill), the recycling rates of glass, paper and cardboard and packaging wastes (metals, plastics and wood) and the landfill of bio-waste as indicators for municipal solid waste management effectiveness.
One of the main indicators used to calculate the amount of waste generated per community is the recycling rate of municipal solid waste including residential (single or multi-family), commercial (office buildings, retail companies, restaurants), institutional (schools, hospitals, etc.), industrial (packaging, administrative) and municipal origins Pichtel [
22]. Recycling as a concept includes material recycling, composting and anaerobic digestion and in certain cases incineration with energy recovery according to Williams [
23].
The recycling rate of municipal waste is a main indicator of recycling efficiency, being calculated as a ratio between tonnage recycled from municipal waste divided by total municipal waste arising. In terms of municipal waste, this refers to the main waste generated by households, by small businesses and public institutions, which is collected by the municipality [
24].
Regarding methods of reintegrating or diminishing waste, several processes can be considered such as: repairing, reuse of products or product components in other production processes, transformation of waste into energy, recycling materials, and redesigning processes from the beginning in order to ensure recyclable products and/or reuse of product, materials or components. Furthermore, several institutions have already begun to offer instead of a one-time buy product, that is later disposed, subscriptions that ensure the maintenance of the products, repair and/or replacement after consumption while the old product is recycled by the company itself. This innovative approach of redesigning the classical economic system of “buy, consume, and dispose” to a sustainable system of continuous use and reintegration represents one of the main strategic issues of the current business sector today. Other authors, such as Lewandowski [
11] also emphasize the recycled material used product value after a certain period of use as a key indicator for measuring the decreasing of ecological foot print and the obtained direct financial value through recovery of materials and assets. The relationship of municipal waste in terms of its generation and relationship to economic drivers, such as income and socioeconomic and policy factors, has been analyzed through a panel regression by Mazzantti et al. [
25] resulting in an empirical evidence in this sense. Thus, this indicator in terms of its generation and recycling is one of the main factors used in the field of measuring progress in the field of circular economy.
Other authors inquired different parts of sustainable development of the economy through variables, such as trade impact on GDP growth and employment level as in the case of Miron et al. [
26]. Currently, the internationalization process finds itself in a dynamic rhythm [
27] and adds more pressure towards implementing practically the efforts for a sustainable economic development and restructuring of the business field in order to reduce waste generation. Practices, such as corporate social responsibility measures directed towards environmental friendly actions, as well as clearer legislations, clusters for cooperation of several institutions [
28] and partnerships between the academic field and the business environment [
29] are considered to be contributing to the efforts in the sense of a sustainable approach for the environment protection in the sense of diminishing waste from the beginning of the production process, as well as after consumption of the product. In order to reduce generation of waste or emissions, new approaches and methods are starting to be implemented in the business field, such as in the case of reducing or treatment of municipal waste or reducing the CO
2 emissions from the iron and steel processes [
30].
Although there are several indicators and management methods in the sense of waste diminishment, there is still progress needed in the sense of joint efforts from the side of institutions, populations and business in order to reduce the gaps to increased efficiency of these measures.
3. Methodology
For the present research, we used six variables, namely: recycling rate of municipal waste (%) (RRMW), circular material use rate (%), environmental taxes (revenues in million Euro), R&D expenditure (in million Euro), trade in recyclable raw materials (tonne) and resource productivity and domestic material consumption (Euro per kg). The countries included for the selection were the 28 countries of the European Union between the years 2010–2014. The statistical data was taken from Eurostat 2018.
Regarding the variables used, we include the following definitions, which are conformed to the data collected from Eurostat. The circular material use rate is measured in % and represent the degree of circular or secondary materials in the economy divided by the overall material use. For this indicator, the quantity of secondary raw materials is approximated by the amount of waste treated in domestic recovery plants, minus imported waste destined for recovery, plus exported waste destined for recovery abroad. Recycling rate of municipal waste (%) is calculated as the ratio between recycled municipal waste (that include also material recycling, composting and anaerobic digestion) in the total municipal waste generation. Resource productivity and domestic material consumption (Euro per kilogram) quantify the resource productivity of gross domestic product in relation with the domestic material consumption. Trade in recyclable raw materials (tonnes) indicate the quantities of selected wastes and by products that are shipped across intra- and extra EU borders. The environmental taxes in our calculations are measured in million Euro. The last indicator that is analyzed in this research is the R&D expenditure (in million Euro). This indicator calculates the expenditure in all sectors of performance, respectively business, government, higher education sector and private non-profit sector.
In order to analyze the correlations among the variables, we used the Pearson coefficient, where E(X), E(Y) are means of the variables X, Y and the division factors include the standard deviations of X and Y, as mentioned by Coryn [
31]:
The values of the Pearson coefficient can be between −1 and 1, whereas there can be negative and positive correlations maximizing with: −1 meaning total negative linear correlation, 1 meaning full positive linear correlation or no linear correlation if it is the value of 0. The correlation measures the intensity of a relationship between two variables.
To analyse the dataset further and to analyse the behavior of countries over time, a panel data set is used so that it allows us to account for individual hetereogenity so that it controls for the unobserved differences among countries or changes over time. In our data set, the panel consists of an entity (the country) and time (per year). We used an ordinary least square (OLS) regression method, where we analyzed the impact the following explanatory variables: environmental taxes (revenues in million Euro), R&D expenditure (in million Euro), trade in recyclable raw materials (tone) and resource productivity and domestic material consumption (Euro per kg) on the dependent variable recycling rate of municipal waste on the dependent (the explained) variable: recycling rate of municipal waste (%), We used the following specifications for this panel data regression model, as mentioned by Stock and Watson [
32]:
where X
it includes the explanatory variables, the i represents the cross-section dimension (the country) and t represents the time-series dimension (the year) and
is the abbreviation for recycling rate of municipal waste, namely the dependent variable. The OLS panel regression is estimated using the statistical package Stata in which the panel variable (denoted as i in the above specification) is set as country and the time variable (denoted as t in the above formulae) is set as year. An estimation method by using dummy variables for each country to control for differences between entities would lead to equivalent estimated coefficients (β). In the first estimation, we will assume that there are no unique characteristics between entities and that no general effects exist across time, i.e., independently pooled panels.
The assumption of independently pooled panels does not have to be valid, therefore also a fixed effects model and a random effects model is specified. In a fixed affects model, it is assumed that the entities have unique characteristics (the countries) that do not change over time. In a random effects model, it is assumed that unique and time constant characteristics of entities exist that do not correlate with the explanatory variables.
For the fixed effects model, we used the following specifications:
= + + , where is the unobserved variable that is assumed to be time-invariant (and for which we do not have data) and is the abbreviation for recycling rate of municipal waste, namely the dependent variable.
The actual model we regress is:
RRMW
it =
+
+
, where
is the intercept for each country [
32]. An equivalent method is to add binary (dummy) variables for
n − 1 countries (i), which led to the following model [
32,
33]:
= + +, where are the entities (the countries).
For the random fixed effects, the following model specification is used, see Stock and Watson [
32] and Maki [
33]:
where
is the intercept for all countries and
is the within entity (country) error and
is the between entity (country error). The random effects model assumes that the entity’s error does not correlate with the explanatory variables.
To test whether the fixed effects model or the random effects model is statistically more efficient, we applied the Durbin–Hausman–Wu test (Hausman test), which tests whether the unique errors between entities (
are correlated with the explanatory variables, for which we have the following hypothesis:
where Cov stands for covariance [
33].
After the Hausman test, the H0 is accepted or rejected. If it is rejected, it means the fixed effects model is statistically more significant. Stata has a built-in procedure to calculate the Hausman statistic, which is then accepted or rejected under a chi-distribution while applying a significance level of p < 0.05.
4. Findings and Results
The first part of the study focused on finding potential correlations between the recycling rate of municipal waste with the other selected indicators, which were presented in the research methodology.
The paper analyzed correlations between the recycling rate of municipal waste and the other selected indicators, namely circular material use rate (%), R&D expenditure (million Euro), environmental taxes (million Euro), trade in recyclable raw material (tone, imports), resource productivity and domestic material consumption (Euro per kilogram), as shown in
Table 1. The highest correlation was between the recycling rate of municipal waste and resource productivity and domestic material consumption throughout the years from 2010 to 2014, reaching a correlation level of 0.714 in 2014, and thus a strong intensity of the relationship between these two variables. Another strong positive correlation was found between recycling rate of municipal waste and trade in recyclable raw materials, namely in the period 2010–2012 with a level of approximately 0.66, while, between 2013–2014, this level of correlation decreased to 0.51. According to the results based on the Eurostat data, Germany had the highest level of trade in recyclable raw materials for the analyzed period.
The other correlations between the recycling rate of municipal waste and the other three variables were average correlations. Thus, between recycling rate of municipal waste and R&D expenditure, there was an average correlation throughout 2010–2014 except 2012 when the correlation level was low (0.35). This would imply that an increase in R&D correlates with an increase of the recycling rate of municipal waste.
Regarding the regression model, first we made the estimations for the OLS panel regression for the European Union countries in the period 2010–2014. The dependent variable of the model was the recycling rate of municipal waste, while the rest of the indicators mentioned in
Table 2 were independent variables.
The results of the regression indicated that, between the years 2010–2014, four coefficients on the dependent variable, respectively R&D expenditure, resource productivity and domestic material consumption, trade in recyclable raw materials and environmental tax revenues were statistically significant with a p-level lower than 0.05 as indicated in
Table 2. The highest coefficient was that of 6.424522 implying that if resource productivity and domestic material use increases with one Euro per kilogram, it is associated with an increase of 6.42% of the recycling rate of municipal waste. Furthermore, as shown in
Table 2, a one percent increase in circular material use rate is associated with an increase of 0.35% of the recycling rate of municipal waste. In terms of trade in recyclable raw materials, the regression indicates that a one tonne increase in trade in recyclable raw materials is associated with an increase of 0.00000153 in the recycling rate of municipal waste.
Adjusted R-Square is around 58% in the analyzed model, indicating that the estimated models have a moderate explanatory power. That implies that about 58% of the changes in the recycling rate of the municipal waste are explained by the five independent variables: circular material use rate, R&D expenditure, resource productivity and domestic material use, trade in recyclable raw materials, and environmental tax revenues, while only about 42% are explained by other factors not taken into consideration in this paper, which are captured by the error term.
Based on the regression results, we can state that, if the increase of recycling rate of municipal waste is intended, the factors that can contribute to this boost are for example an increase of resource productivity and domestic material consumption, as well as the decrease of environmental tax revenues.
Secondly, we estimated a regression with fixed effects through which we can control for time invariant variables, that differ across countries, but are constant over time—for example, institutional and cultural factors towards recycling and sustainability, these factors are almost impossible to observe and are country-specific. A specific example can be Germany, which could have a different institutional attitude towards recycling than Spain. In the case of fixed effects, we assume that country-specific effects correlate with the independent variables and this will cause an omitted variable bias. To correct for this omitted variable bias, we estimate a fixed-effects regression model. This is not different than adding a dummy variable for each country (except one to avoid multicollinearity) to the regression model as described in the methodology section. The OLS assumptions require that the errors for each entity (country) are uncorrelated over time. Below in
Table 3, the results are presented. The estimated coefficients are different than in the regular OLS regression because, by estimating a fixed-effect regression model, the effect for each country on the dependent variable has been removed from the coefficients in
Table 3, which was previously captured by the coefficients of the independent variables (in
Table 2).
Thirdly, we estimate a random-effect regression model (see
Table 4). This model differs from the fixed effect regression model because it assumes that the country-specific effects are uncorrelated with the independent variables.
It captures the deviation of dependent variable in an individual year from the average of the specific country. To test whether this assumption hold, we perform a Durbin–Wu–Hausman test so that we can conclude whether the random or fixed model leads to efficient estimators.
To decide which model generates more efficient estimators, we performed a Durbin–Wu–Hausman test. Under the null hypothesis as described in the methodology, it is stated that the random effects model is valid. It tests whether the errors (u
i) are correlated with the regressors. The estimators of both the fixed-effects and random-effects model regressions are used to calculate the Hausman statistic (
Table 2 and
Table 3). This results in the outcome of Prob > chi2 = 0.7288, as one can notice in
Table 5, while applying a significance level of
p ≤ 0.05, the null hypothesis cannot be rejected and it has to be concluded that the errors are correlated with the independent variables.
The random effects regression model is clearly a better model than the fixed effects regression model. Differently phrased, the country-specific effects do exist, but they are not correlating with the coefficients on the other dependent variables.
5. Discussion
The present research connects with the theoretical literature; however, there were no studies, that inquired the relationship of the recyclable rate of municipal waste with other indicators through regression models, as most studies refer only to the general term. As Stofova [
12] mentioned, the municipal waste was also defined in the case of European Union countries as “a large extent of waste generated by households but may also include similar wastes generated by small businesses and public institutions and collected by the municipality; this latter part of municipal waste may vary from municipality to municipality and from country to country, depending on the local waste management system”. Furthermore, the recycling rate of municipal solid waste was regarded as Pichtel [
22] mentioned, namely as including residential (single or multi-family), commercial (office buildings, retail companies, restaurants), institutional (schools, hospitals, etc.), industrial (packaging, administrative) and municipal origins.
The study focused on the estimation of panel regression models between the recyclable rate of municipal waste and four other independent variables, namely the circular material use, R&D expenditure, resource productivity and domestic material consumption, trade in recyclable raw materials, and environmental tax revenues for the European Union countries between 2010–2014. As mentioned in the findings and results, the highest coefficient was that of resource productivity and domestic material consumption (6.424522), being followed by the coefficient of the circular material use rate.
The study has its limitations based on the sample of variables mentioned; however, it contributes to the scientific literature through the regression models, which were estimated and that were not previously studied in other papers.
Regarding future objectives of further connected to the present research to this study, we intend to expand the research by introducing more uncorrelated variables and adding lags, in order to determine further factors that could contribute to the causality with the recycling rate of municipal waste.
6. Conclusions
The OLS panel regression model demonstrated the majority of the independent variables are significantly influencing the main indicator of the circular economy, which was analyzed in this paper as a dependent variable. The selected circular economy indicator was the recycling rate of municipal waste, which is the dependent variable of the model. Thus, the coefficients of the independent variables, namely: R&D expenditure, trade in recyclable raw materials, environmental taxes, resource productivity and domestic material consumption were significant within the regression model in relationship to the dependent variable, namely the recycling rate of municipal waste.
In the non-pooled regression, the dependent variable recycling rate has a significant relationship with four of the five independent variables; while applying a random effects model, these significances disappear and only resource productivity and domestic material consumption stay significant with the municipal waste recycling.
We can conclude that resource productivity and domestic material consumption has a strong statistical relationship with municipal waste recycling and that an increase is associated with a positive change in municipal waste recycling. Further research is necessary to give advice on any policy changes, but policies that can affect resource productivity can be associated with a positive effect on recycling of municipal waste.
In the research, the proposed panel regression model estimated that another indicator frequently encountered in scientific studies regarding circular economy did not have a significant influence in our case upon the recycling rate of municipal waste.
As a result, the case of EU countries in the analyzed period, the highest relevant coefficient was that of resource productivity and domestic material consumption. Thus, in this model, the recycling rate of municipal waste was significantly influenced by resource productivity and domestic material consumption.
The second part of the study, which included the Durbin–Hausman–Wu test, indicated that the model with the random effects is statistically more significant than the fixed effects model.
The present research can serve as a basis for future studies in the field of circular economy as more variables to quantify the efficiency of this transition process will also emerge and the existing ones will continue to develop. As recycling is a main method currently of an efficient reintegration of waste or of an environmental friendly disposal of waste, the product design from the beginning of the production process in the direction of producing zero or minimal negative impacts on the environment already started to gain importance and could be the primary strategy of implementing a circular economy in the future, thus reducing the need of recycling from the beginning. It is an interesting cause to observe in future developments globally in order to determine the most efficient solutions towards a sustainable future. Regarding future developments, the main trends expected are as mentioned—the redesigning of production–consumption processes, redesigning of products from the beginning, in order to generate no or less waste, transformation of waste into energy source, such as biomass, as well as the introduction of new technologies to diminish damaging waste to the environment. These are future objects of future research as the need for increased sustainable measures has become a significant part of the business, political and social behavior currently.


