Article

Evaluating Nitrogen Oxides and Ultrafine Particulate Matter Emission Features of Urban Bus Based on Real-World Driving Conditions in the Yangtze River Delta Area, China

1
School of Automotive Studies, Tongji University, Shanghai 201804, China
2
Shanghai Environmental Monitoring Center, Shanghai 200235, China
*
Authors to whom correspondence should be addressed.
Sustainability 2018, 10(6), 2051; https://doi.org/10.3390/su10062051
Submission received: 17 April 2018 / Revised: 7 June 2018 / Accepted: 14 June 2018 / Published: 16 June 2018

Abstract

:
A Portable Emission Measurement System was used in this study to evaluate the exhaust emission characteristics of nitrogen oxides (NOx), ultrafine particulate matter (PM), and ultrafine particulate number (PN) from buses in the Yangtze River Delta, China. Results showed that NOx emission factor (unit: g·km−1) increased from 5.0 to 19.1, and PM emission factor (unit: g·km−1) increased from 0.001 to 0.189. A nonlinear model was established based on scientific statistical method, which showed that NOx and PM emission factors significantly decreased with speed increasing. The model also showed a “long tail effect” of NOx and PM emission factors beyond 30 km·h−1. Furthermore, hybrid bus exhausted less NOx, PM, and PN emissions compared to conventional bus in the acceleration condition. Exhaust rates of NOx, PM and PN emissions (unit: g·s−1) increased with speed increasing under steady state driving condition, while PN emissions commonly showed a unimodal distribution at the speed of 20 km·h−1.

Graphical Abstract

1. Introduction

Previous research showed traffic induced emissions are important contributors to the urban emission inventory [1,2]. For example, recent study in Shanghai concluded Nitrogen Oxides (NOx) from mobile source emissions is responsible for about 37.6% of total emission and 45% of Particulate Matter (PM) in its central areas. The PM emission from urban bus is mainly ultrafine particles, of which diameters are less than 0.1 μm. Recent studies show that particulate number (PN) is more harmful to human health, compared to PM mass [3]. Meanwhile, hydrocarbons (HC) and NOx in the vehicle exhaust gas can actively form ozone (O3) via photochemical reaction causing secondary air pollution problem. Among different vehicle categories, urban bus has unique operational characteristics due to their specific driving conditions with much more frequent starting, braking, idling, and low-speed driving time compared with passenger cars due to the bus stops and signal intersections.
To study the bus emission characteristics in urban driving conditions, on-road Portable Emission Measurement System (PEMS) has been used predominantly in different cities to link the vehicle driving condition and the emissions [4,5,6,7,8,9,10]. Previous studies can be divided into two parts. The first part focuses on the influence factors on bus emissions, including road types, speed and bus-stop. Fu, M. et al. (2013) found that the NOx emission factors of two Euro IV buses during freeway driving are lower than those during urban and suburban driving [4]. Hao, Y. et al. (2012) found that the diesel transit bus emissions decrease from the city center to the outbound direction gradually and the highest emissions occurred on minor arterial roads and the lowest emissions occur on expressways [5]. Wu, X. et al. (2012) estimated bus emission rates of pollutants with the consideration of the impacts of speed and acceleration of bus [6]. Yu, Q. et al. (2014) collected the real-world on-road emissions data near bus stops using PEMS [7].
The second part focuses on the comparison between different vehicle types and different fuel types. Hallmark, S. L. et al. (2013) collected on-road using PEMS for three hybrid and two control buses [8]. They found average NOx emissions were higher for all VSP bins for the hybrid buses than for the control buses. NOx emissions from two Euro V diesel, two Euro IV diesel hybrid, nine compressed natural gas (CNG) and two liquefied natural gas (LNG) buses were measured on-road using PEMS by Zhang, S. et al. (2014) [9]. Zhang, Y. H. et al. (2018) investigated particulate emissions from an urban bus fueled with 20% biodiesel from waste cooking oil and 80% diesel by volume using PEMS [10]. They found that, compared with a D100 (pure diesel), B20 reduced PN and PM emission rates of the bus by 13.9% and 24.3% under cruise control, respectively. Under transient condition, B20 reduced the PN and PM emission rates by 18.4% and 16.3%. B20 decreased the total PN concentration by 6.6%.
These studies have been carried out independently in different cities with wide variation of the climatic conditions, roadway features and activity patterns. However, there is a lack of understanding on the impact of different city traffic characteristics on the bus emissions using the same real-world measurement protocols. The purpose of this study was to evaluate emissions features of urban buses in the Yangtze River Delta region. NOx, PM and PN emissions from the buses in Shanghai, Hangzhou and Suzhou are tested using PEMS. The effects of driving condition and fuel type on emission features of hybrid and conventional buses are investigated in this study.

2. Methods

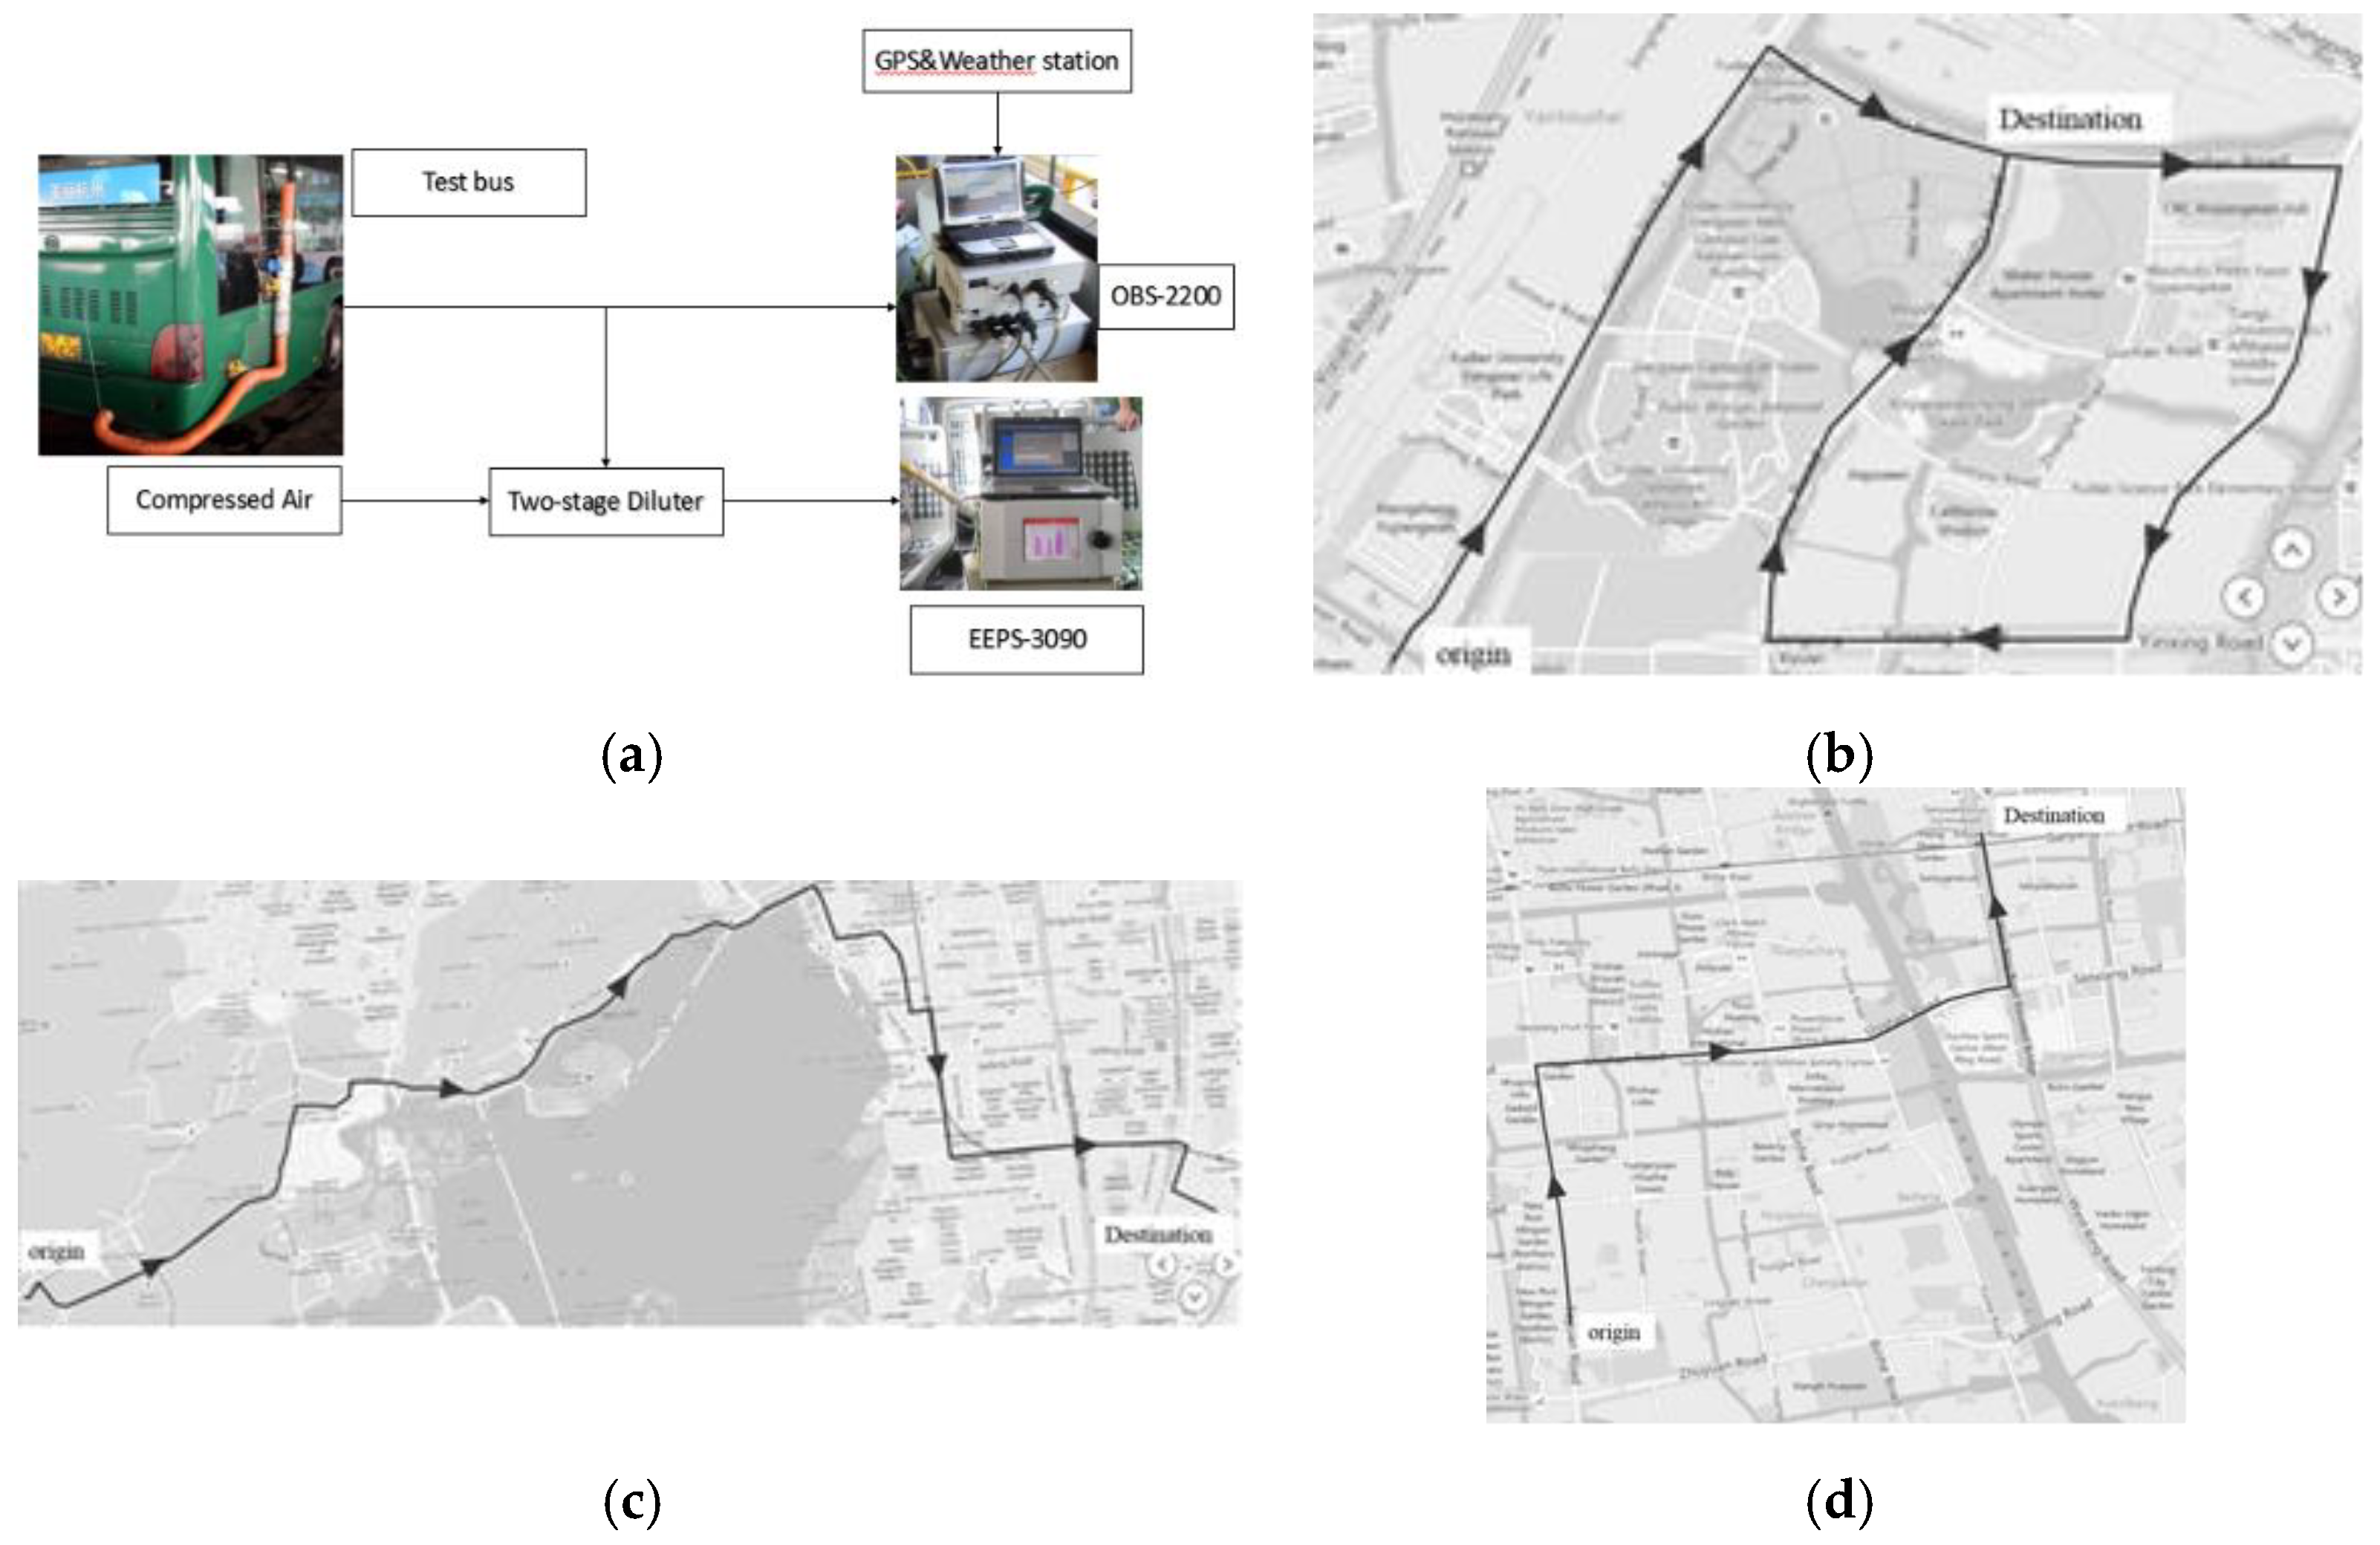
2.1. The PEMS Platform for Data Collection

As shown in Figure 1a, a PEMS consisting of an OBS-2200, an EEPS-3090 and some relevant accessories was employed in this study.
The OBS-2200 produced by Horiba Company (Kyoto, Japan) in Japan was used to measure gaseous pollutants [11,12,13,14,15,16,17,18]. The instrument was mainly composed of a host, a power control unit (PCU), an external signal input unit (EIU), Pitot tube flowmeter, sensors and computer. The instrument was able to test NOx by Chemiluminescence detection (CLD). A weather station to detect ambient temperature, humidity and pressure was connected to the OBS-2200. A Global Positioning System (GPS) was also used to obtain the traveling speed, latitude and longitude of tested buses. In addition, an exhaust flow meter (Pitot tube flowmeter) (0–30 m3·min−1) was installed behind the exhaust port measuring the exhaust flow rate and exhaust temperature. Particle testing equipment was TSI company’s EEPS-3090 exhaust particle number and particle size analyzer [6,11,16,19,20]. This analyzer can be used to quickly measure the particle number concentration and particle size distribution of motor vehicle exhaust. The analyzer could measure the particle size ranging from 5.6 nm to 560 nm, which could also be used to obtain a complete particle size distribution map in the 0.1 s, and the particle numbers and distribution data of the 32 particles path were simultaneously output. This analyzer satisfied the requirements of motor vehicle transient test. DI-2000 dilution channel was used to dilute the particles in the exhaust gas. The statistics of the EEPS-3090 are calculated for the interval defined by the upper and lower bounds selected from the entire range of the instruments (see Table 1). By means of the volume concentration and flow rate of particulate emissions, the built in algorithm (default matrix) could be used to calculate the emission. Combined with the mileage data, the unit mileage emission of each vehicle’s particulate emissions could be further obtained. Note that the dilution ratio of the DI-2000 was 67.6. The compressed air was heated. The dilution factor was checked during the tests. The dilution ration was corrected for the different fuels density, pression and temperature.
To ensure the accuracy of data collection, the OBS-2200 and EEPS-3090 were zeroed and calibrated before each separate test.

2.2. Tested Buses and Testing Routes

Eight buses were selected for on-road emissions test: Euro III diesel buses from Suzhou, Hangzhou, Shanghai (abbreviated to A–C); Euro III diesel bus from Shanghai equipped with Diesel Oxidation Catalyst + Diesel Particulate Filter (DOC + CDPF) after-treatment (abbreviated to D); Euro IV LNG buses from Suzhou (abbreviated to E); Euro IV hybrid electric bus from Suzhou (abbreviated to F); and Euro IV diesel buses from Hangzhou, Shanghai (abbreviated to G and H) with Selective Catalytic Reduction(SCR) after-treatment. The basic parameters of such eight buses are shown in Table 2. Commercially available national diesel and LNG were used for on-road buses tests. Note that the grade of test road in the Yangtze River Delta Area is regarded as zero, thus was not considered for buses emissions. The speed limit of buses in China is less than 60 km·h−1. Note that there were only five people on the buses when operating the test system, and the air-conditioner was off during the test period. Test buses used less than 50-ppm sulfur diesel and LNG.

2.3. Statistical Methods

Bus driving characteristics included average speed, idle speed, acceleration, uniform speed, deceleration time ratio, average acceleration, etc. With the speed distribution of the actual bus test conditions, the driving speed could be divided into four types: idle speed, V = 0 km·h−1; low speed, 0 < V ≤ 20 km h−1, corresponding to the running state of traffic jams; medium speed, 20 km·h−1 < V ≤ 40 km·h−1; and high speed, 40 km·h−1 < V ≤ 60 km·h−1. The acceleration less than 0.1 m·s−2 was considered as steady state. The vehicle speed was divided into different sections according to the interval of 10 km·h−1, and then the pollutant emissions were analyzed and compared at the different speeds.
Vehicle specific power (VSP) of bus was a kind of comprehensive operating parameter used for telemetry data analysis proposed by Andrei, P. [8,21,22]. The parameter considered the effect of velocity, acceleration and slope on the emission, consistent with motor vehicle fuel consumption and pollutant emissions. Its formula is described follows:
VSP = ν × ( a + 9.807 × s i n θ + 0.09199 ) + 0.000169 × ν 3 ,
where VSP is vehicle specific power (kW·t−1); ν is traveling speed (m·s−1); a is the vehicle acceleration (m·s−2); and θ is road slope (°).
Due to the little change of the slope in the Yangtze River Delta region, the road slope was considered as 0 in the data analysis.
Using the second-by-second emissions for PM and NOx combined with simultaneous driving condition data [4,23], it was possible to estimate the distance consumption specifically related to emissions (i.e., units in g·km−1), as shown by Equation (2):
E F d i s = i = 1 n M i V i D R i i = 1 n S i
where E F d i s is the distance-based PM/NOx emission factors (g·km−1); M i is the corrected PM/NOx concentration for episode i (minute or second; g·m−3); V i represents the exhaust gas volume for episode i (m−3); represents the instantaneous dilution ratio for episode i ( (NOx) is 1); and S i is the distance traveled during episode i (km).

3. Results and Discussion

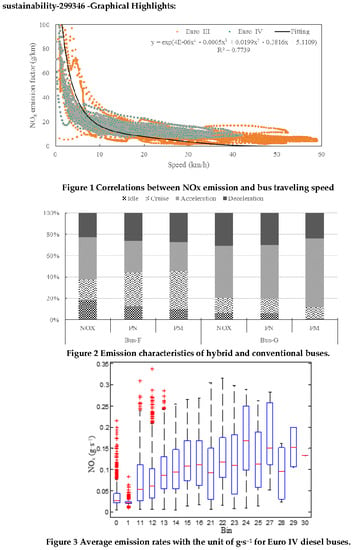
3.1. Bus Driving Characteristics

The average speed of eight test buses ranged 14–31 km·h−1. Driving mode distributions of the eight test buses are shown in Table 3, comparing Euro III and Euro IV, along with four unique driving characteristics. Overall, the proportion of idle driving mode was between 10.7% and 33% and the proportion of acceleration and deceleration mode ranged 34.3–68.9%. The characteristics of real-world driving buses are on low average-speed, high proportion of idle-speed, and frequent acceleration and deceleration driving mode.

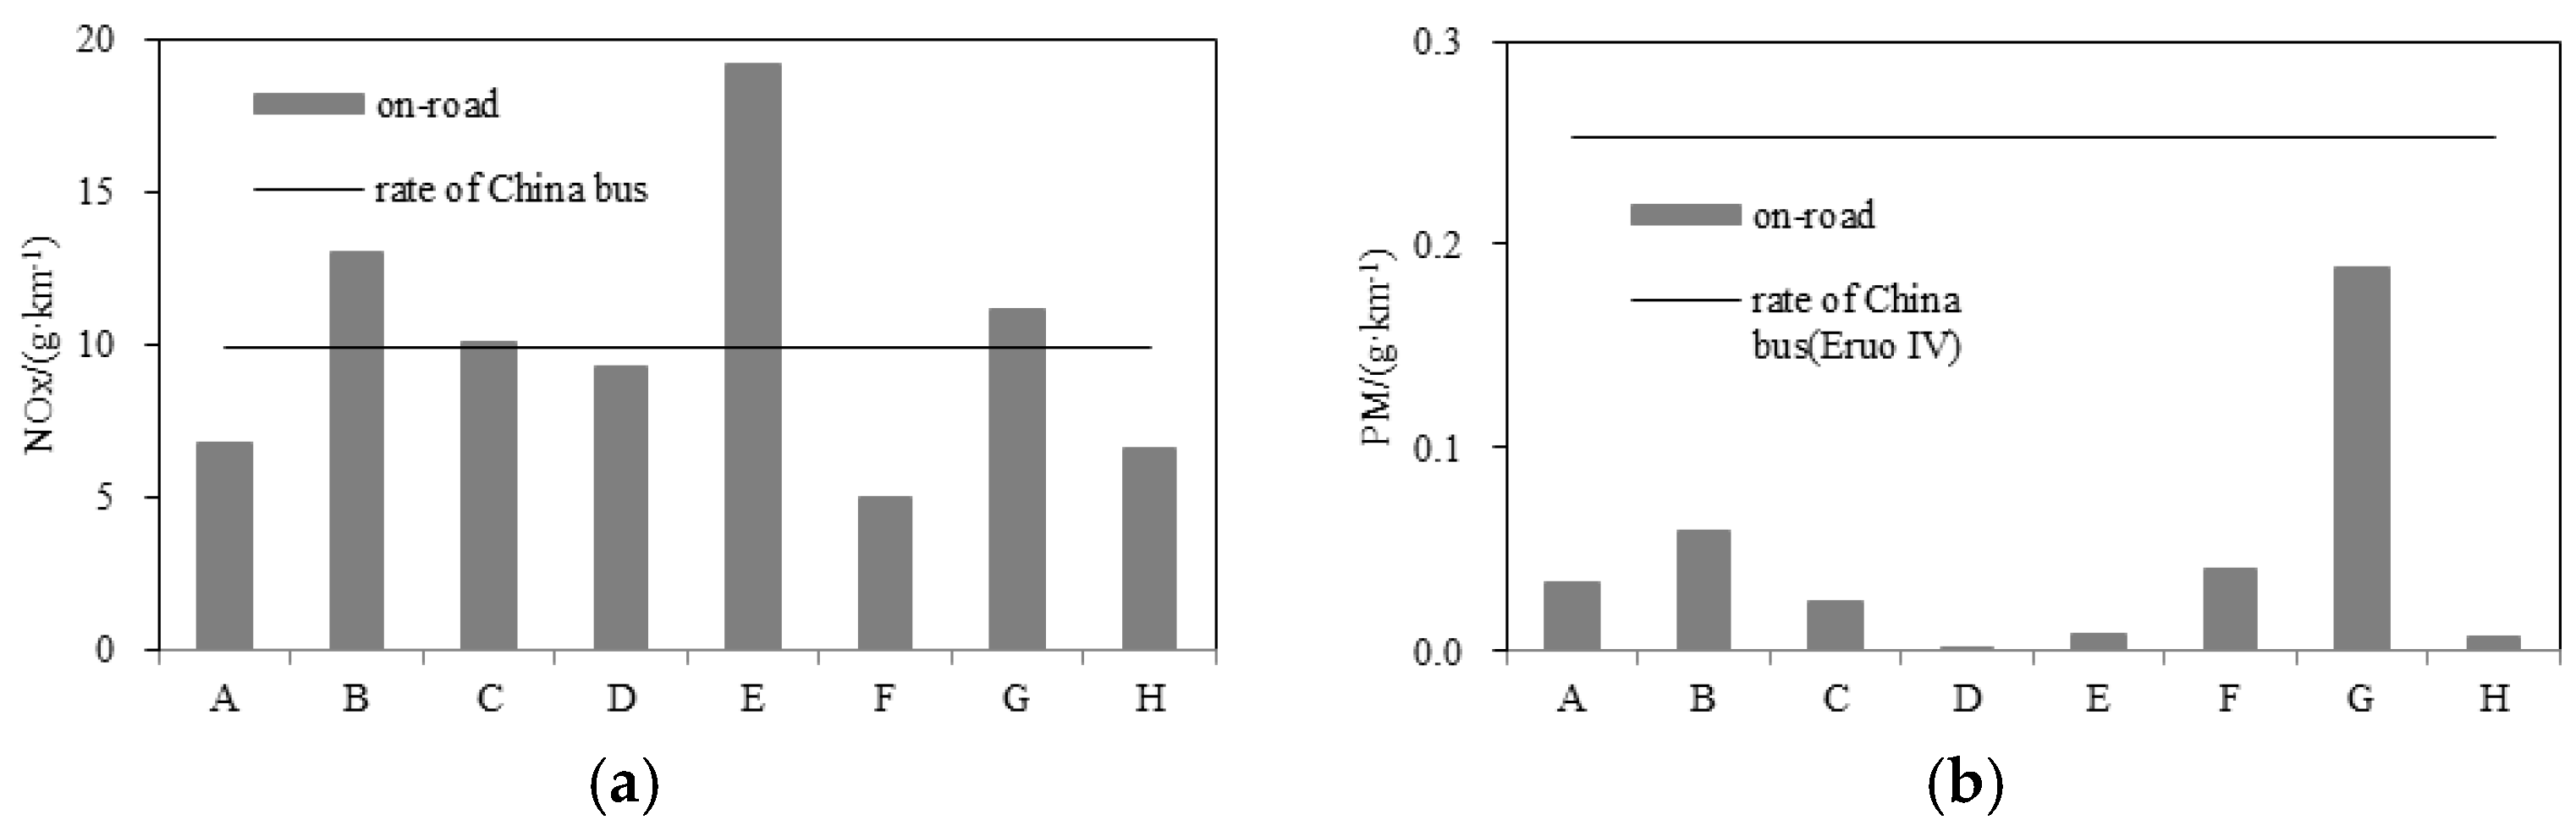
3.2. Comprehensive Emission Factor for Different Buses

Emission factors with the unit of g·km−1 are shown in Figure 2. As shown in Figure 2a, NOx emission factors are in the range 5–19.1 g·km−1. The largest total emission is Bus E without the control of NOx after-treatment. The lowest total emission is Bus F. The NOx emission factors of diesel vehicles are in good agreement with those reported by Hu et al. [1], Fan et al. [24], Gao et al. [25], and Xu et al. [26]. However, the results obtained from Buses B, C, E, and G are all higher as compared with recommended value reported in the “road motor vehicle air pollutant emission inventory preparation guide” (hereinafter referred to as “the guide” (MEPC, 2015)). On the other hand, the NOx emissions results obtained from Buses A, D, F and H are all lower than the recommended values reported in the guide. The highest value is observed from Bus B while the lowest values is observed from Bus A. With the equipment of SCR, Bus F’s NOx emission factor is the smallest value. Exhaust gas temperatures of Buses F–H are 175 °C, 173 °C, and 166 °C, respectively. SCR of Bus F reduced NOx. Exhaust gas temperatures of Buses G and H sometimes did not reach the right temperature of SCR; perhaps, the SCR system does not work.
The composite PM emission factors of buses are demonstrated in Figure 2. It can be seen in Figure 2b that the PM emission factors are in the range from 0.001 g·km−1 to 0.189 g·km−1 [10,16]. PM emission factors of the eight buses are all lower as compared with recommended value reported in the guide (MEPC, 2015)). The largest total emission is Bus G while the lowest total emission is Bus D. High PM emission factors are related with the high frequency usage, vehicle age, driving conditions and the degree of maintenance of the buses. The PM emission factors of Bus D (Euro III) equipped with DOC + CDPF after-treatment reach lowest level and drop by 97% compared with the original buses, which demonstrates that the PM emission reduction effects of Euro III bus with after-treatment installed are remarkable.

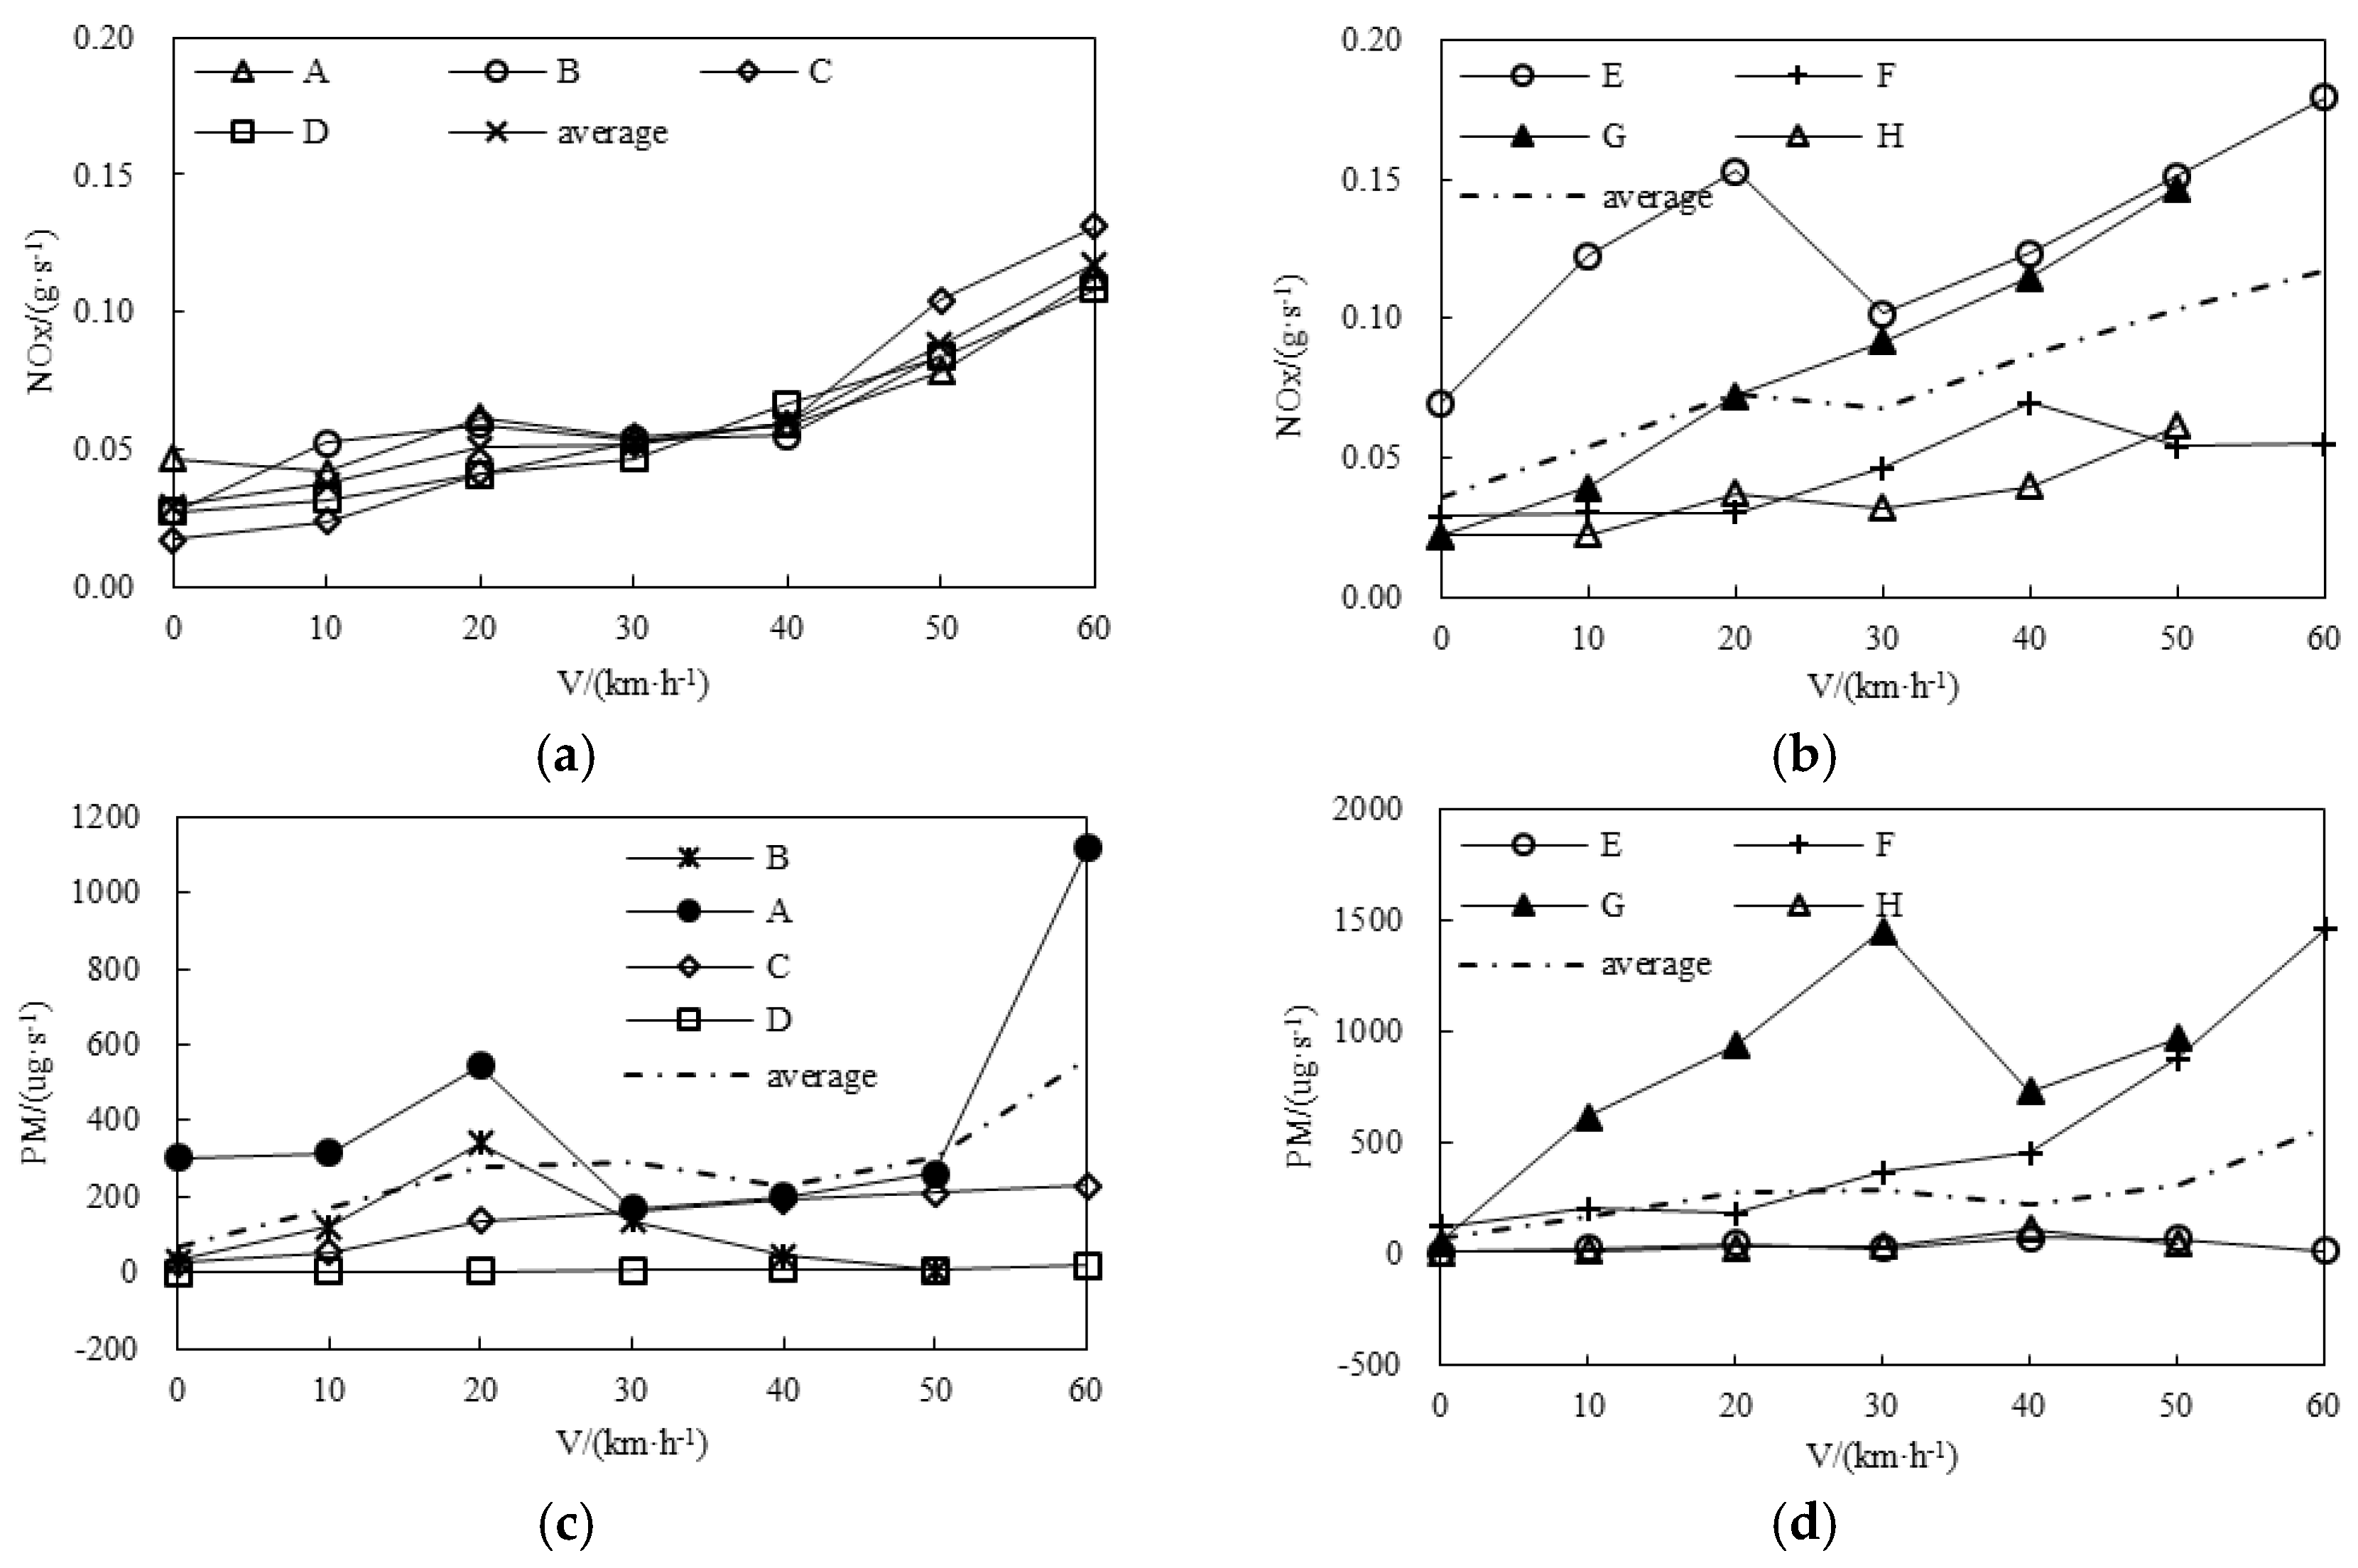
3.3. Emission Characteristics under the Steady State Driving Conditions

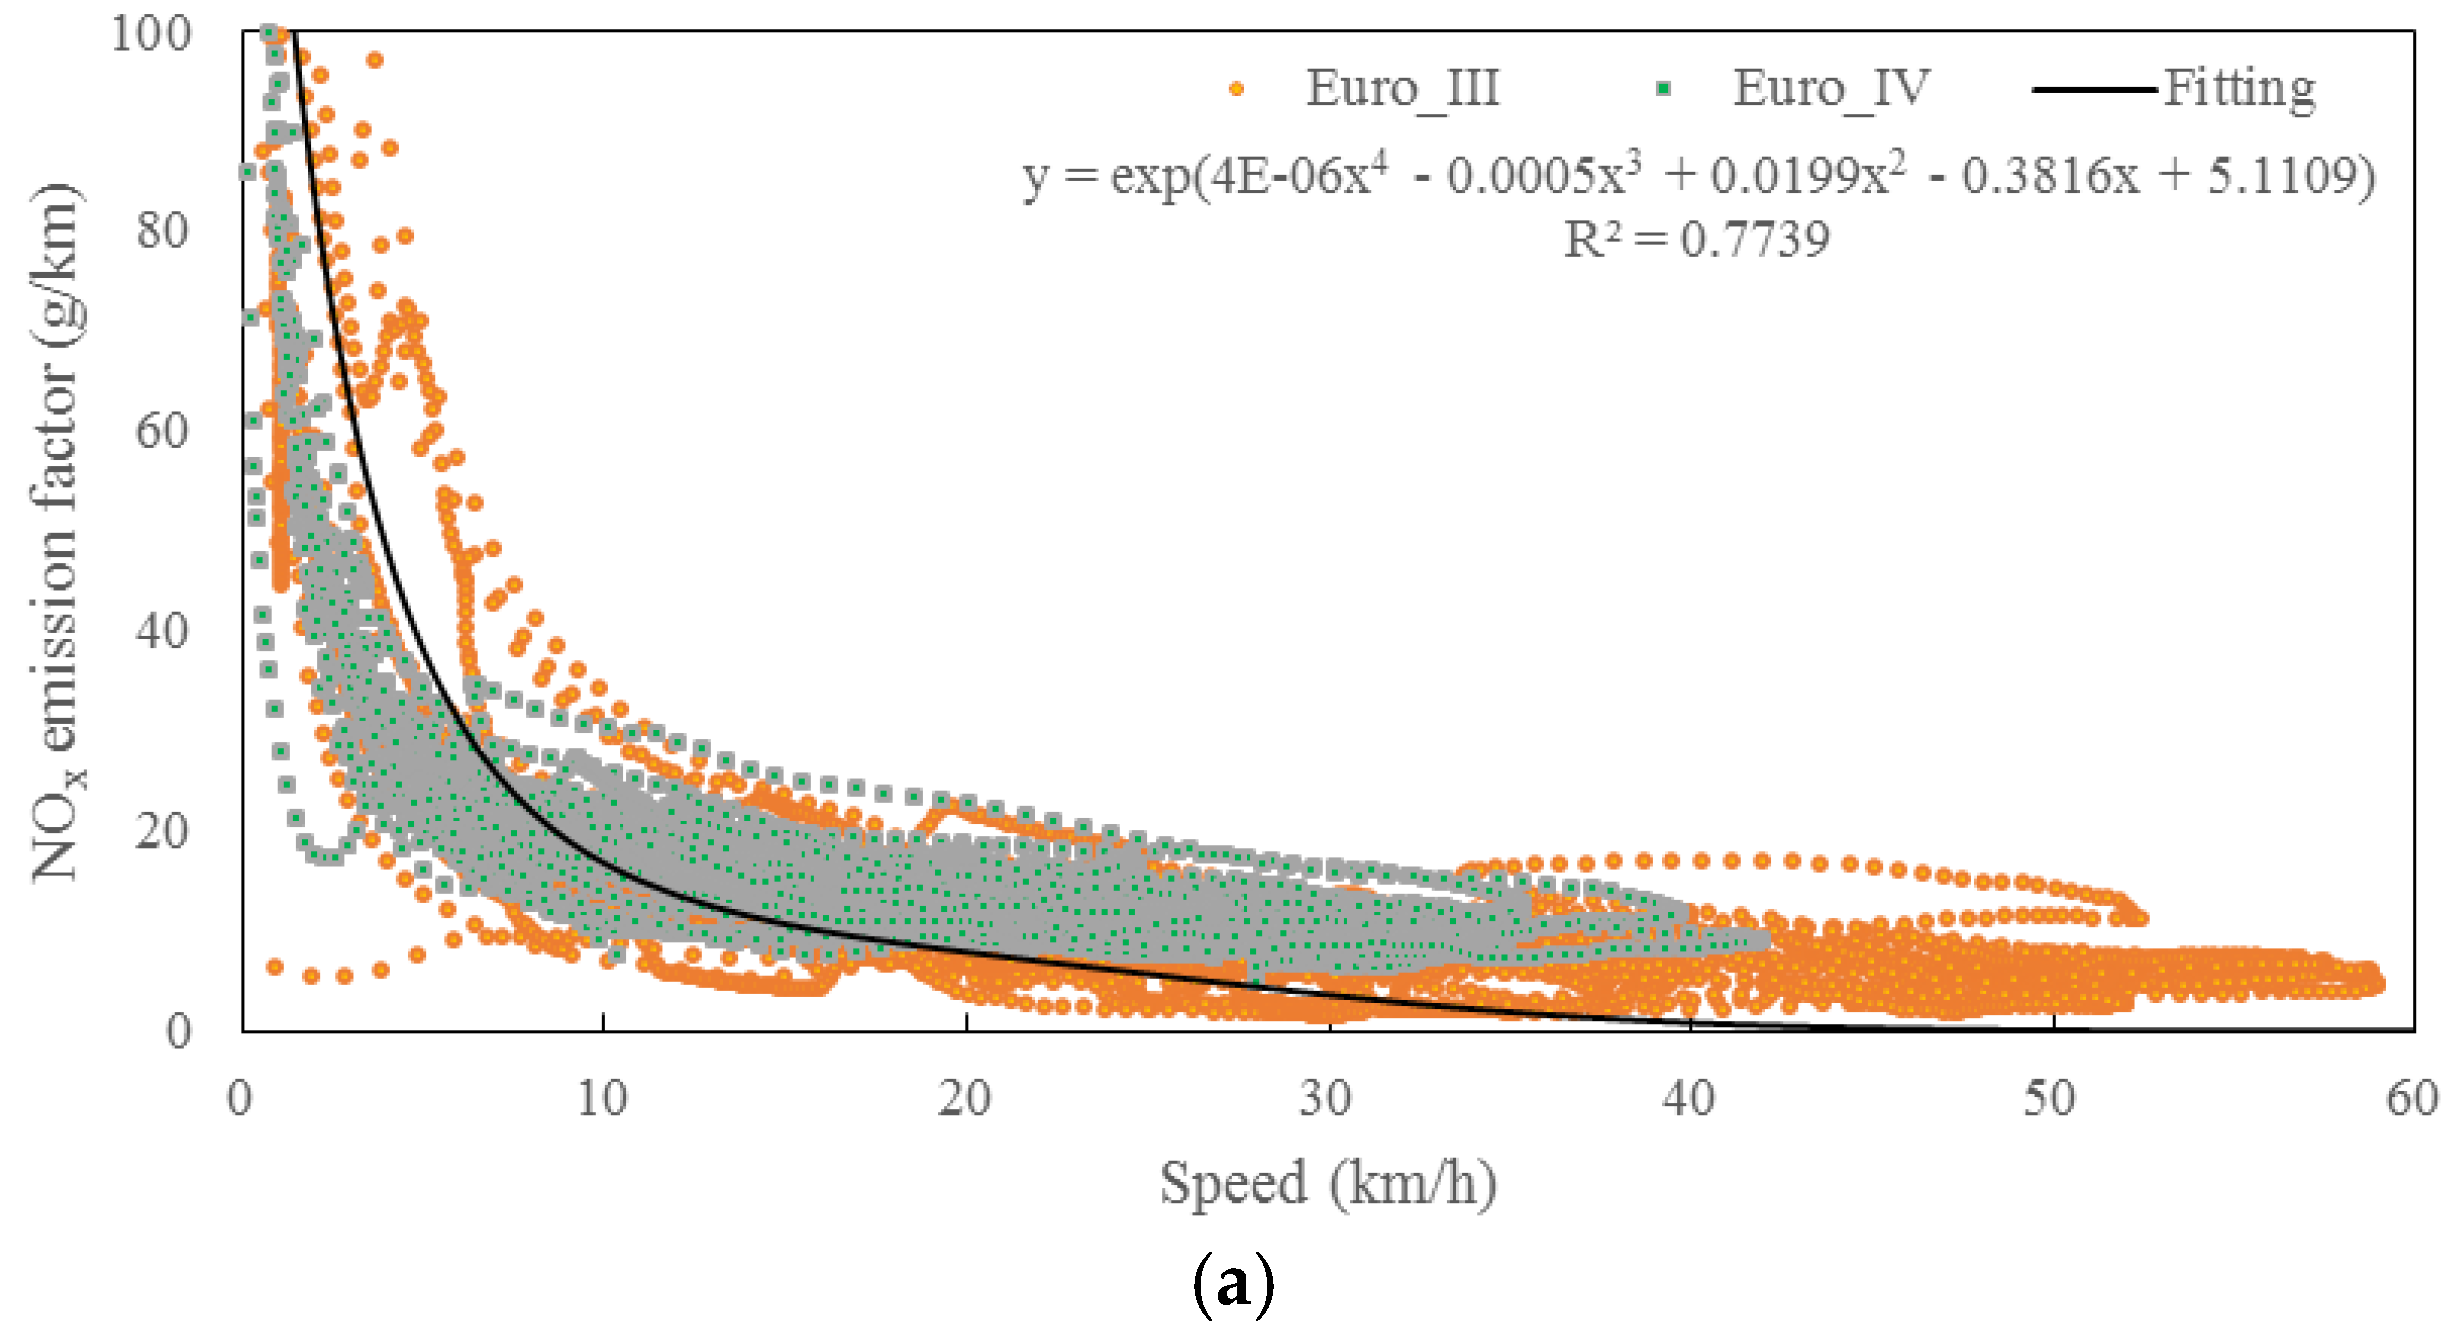
3.3.1. Emission Characteristics of NOx

NOx emission rates of buses under steady state driving condition with the acceleration rate less than 0.1 m·s−2 at different speeds are shown in Figure 3. It can be seen in Figure 3a that, with the increase of vehicle speed, the NOx emission rate of Euro III bus shows a gradually increasing trend. When the speed is 10 km·h−1, 20 km·h−1, 30 km·h−1, 40 km·h−1, 50 km·h−1 and 60 km·h−1, the mean NOx emission rates are 0.037 g·s−1, 0.051 g·s−1, 0.052 g·s−1, 0.060 g·s−1, 0.088 g·s−1 and 0.117 g·s−1, respectively [13]. This is related to the formation conditions of NOx in diesel engines. With the increase of vehicle speed, engine load is increasing, resulting in the increase in the cylinder temperature, and, hence, the engine NOx emissions increases. Meanwhile, the increase of the vehicle speed can add the working frequency of the engine, which would further increase the NOx emissions rate.
As shown in Figure 3b, the NOx emission rate of the Euro IV diesel bus shows the same increasing trend compared with Euro III diesel bus under the steady state driving condition. When the speed is 10 km·h−1, 20 km·h−1, 30 km·h−1, 40 km·h−1, 50 km·h−1 and 60 km·h−1, the average NOx emission rates are 0.054 g·s−1, 0.073 g·s−1, 0.068 g·s−1, 0.087 g·s−1, 0.104 g·s−1, and 0.117 g·s−1, respectively [13]. In the range 10–20 km·h−1 (low speed condition), NOx emission rates of Euro IV diesel buses are lower than those of the Euro III diesel vehicles, while, in the range 30–40 km·h−1 (medium speed), NOx emission rates of Euro IV buses are higher than those of Euro III buses.
As shown in Figure 3b, at 10–20 km·h−1 low speed, with the increase of bus speed, Bus E NOx emissions show a gradual increasing trend with the values of 0.123 g·s−1 and 0.153 g·s−1 respectively. At >20 km·h−1, with the increase of speed, NOx emission rates are gradually increased. At the speeds of 30 km·h−1, 40 km·h−1, 50 km·h−1 and 60 km·h−1, the NOx emission values are 0.102 g·s−1, 0.123 g·s−1, 0.151 g·s−1, and 0.179 g·s−1, respectively, which is related to the engine combustion control strategy [13]. LNG bus NOx emissions are higher than those of the Euro IV and Euro III diesel buses, which is mainly due to the higher cylinder temperature of LNG engine compared with diesel engine.

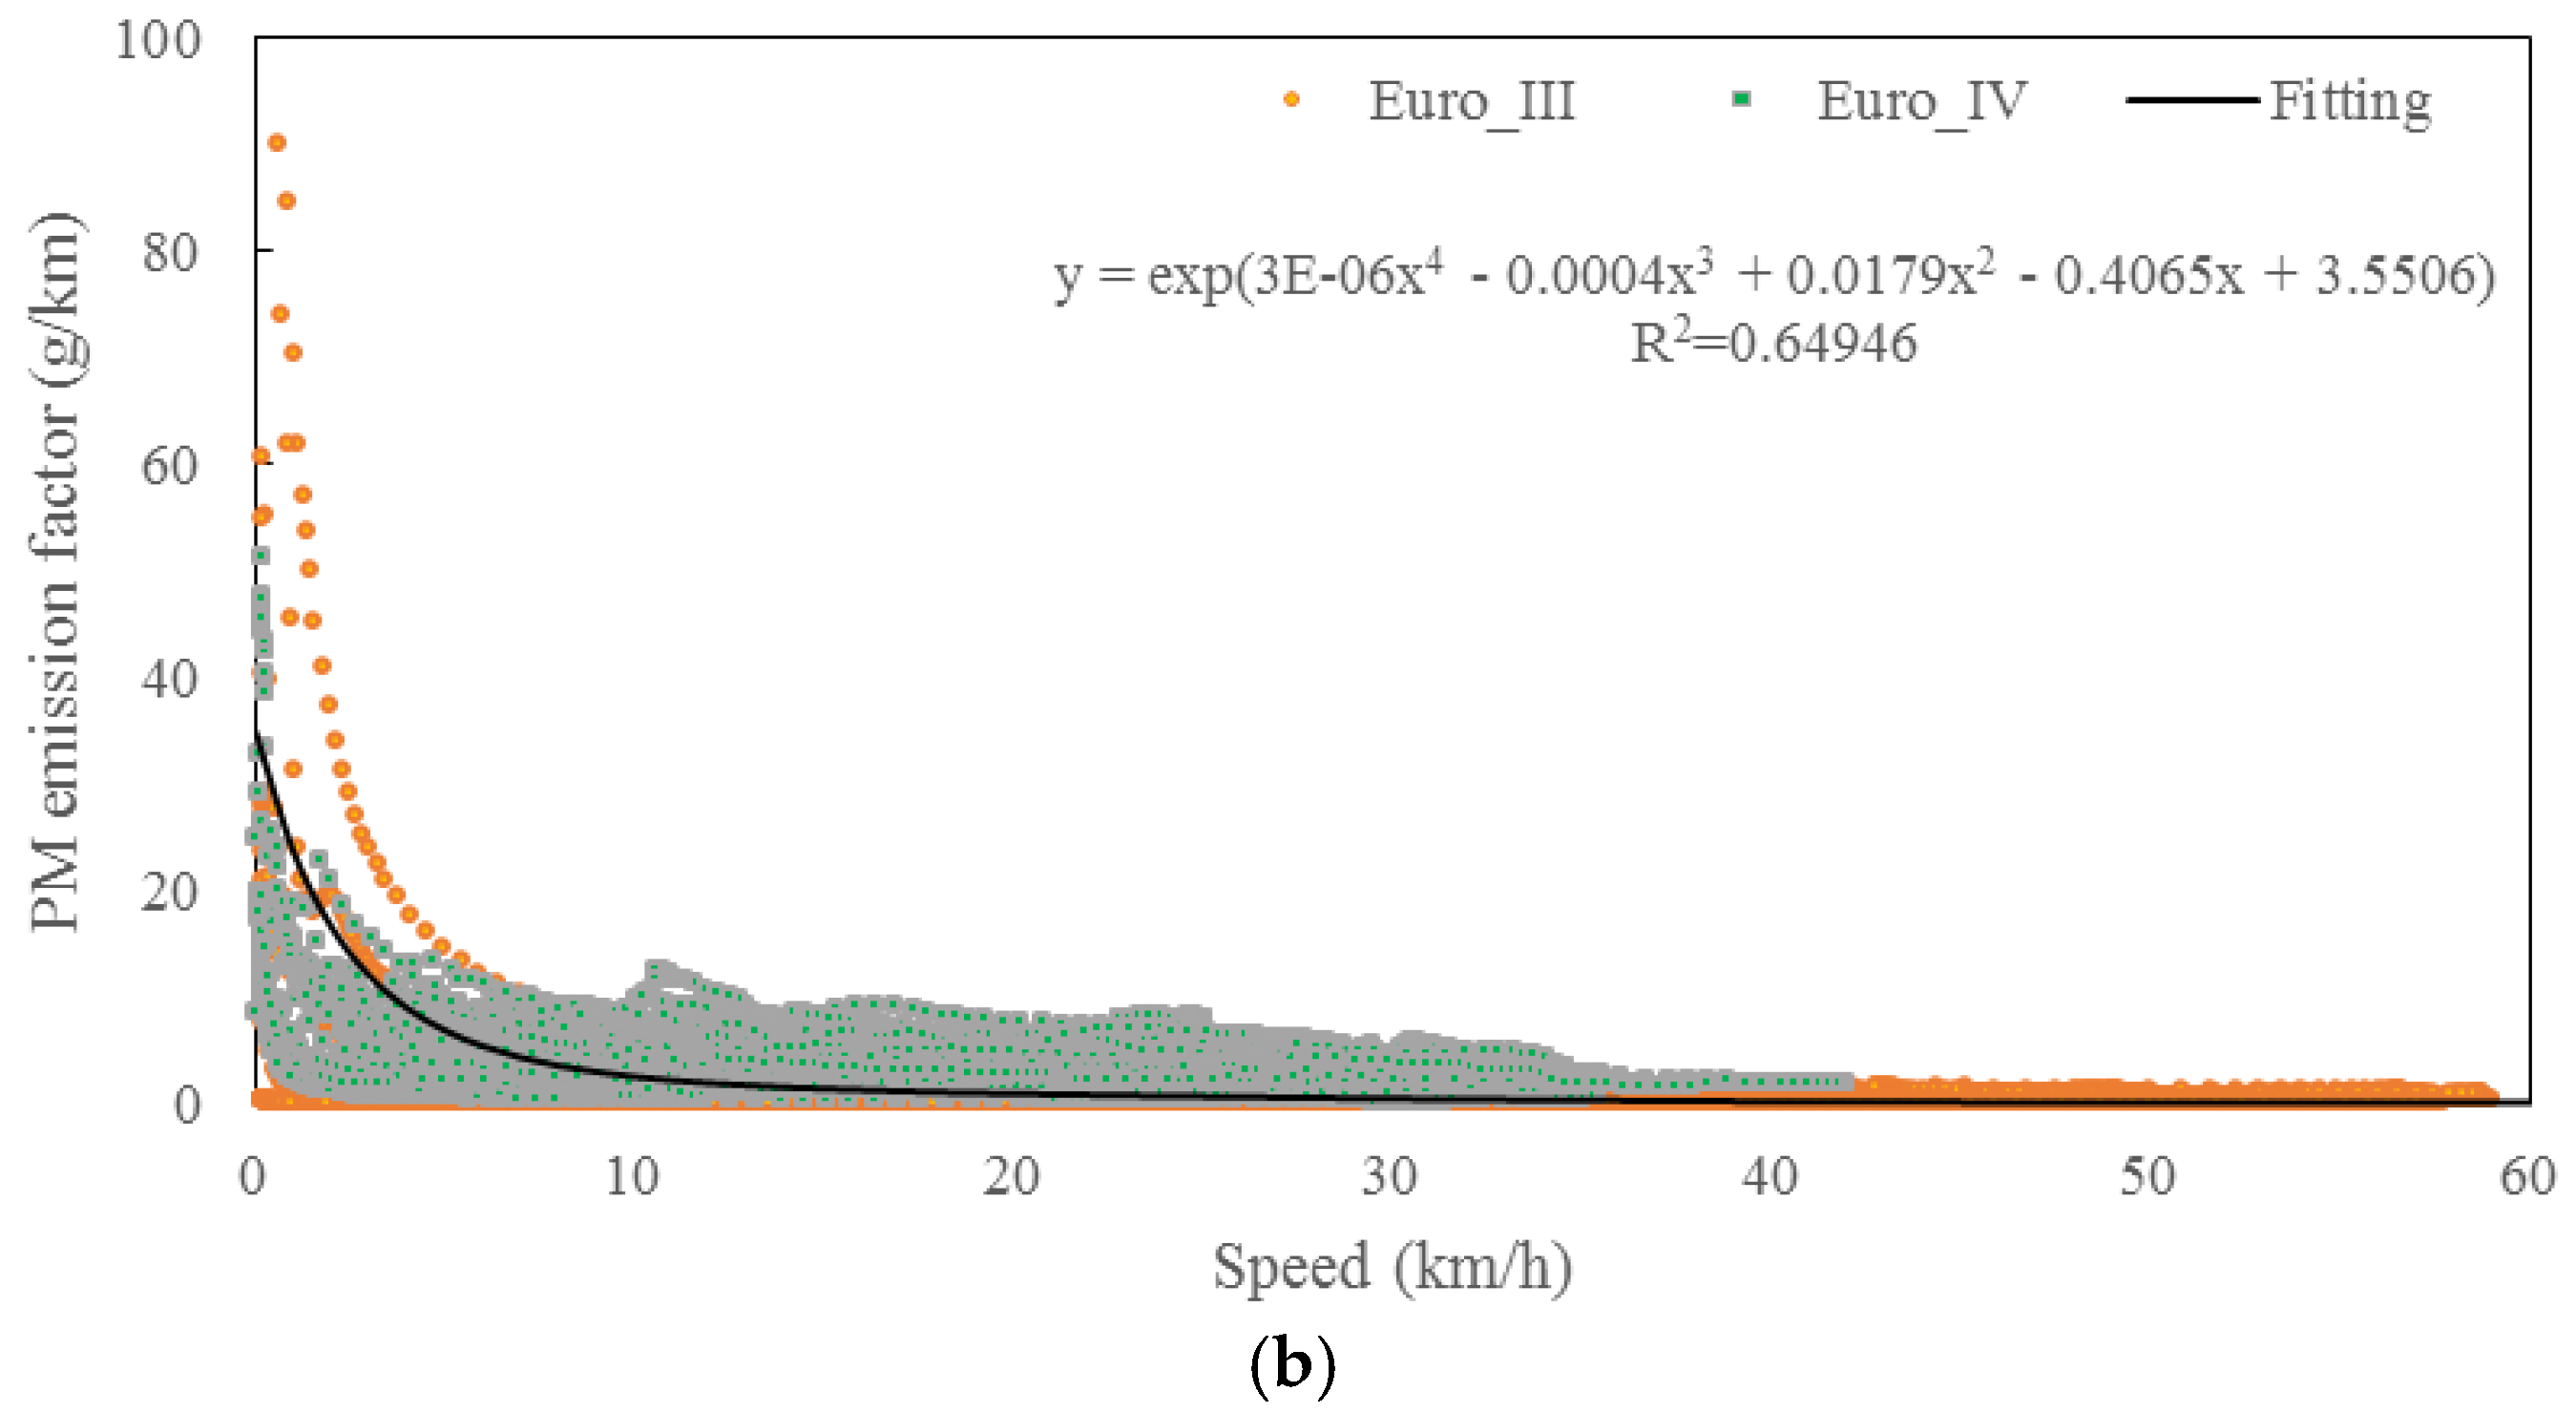
3.3.2. Emission Characteristics of Ultrafine PM

The PM emission ratios of buses increase gradually with the decrease of vehicle speed, as demonstrated in Figure 3c,d. The average bus PM emission is 170 μg·s−1, 278 μg·s−1, 294 μg·s−1, 228 μg·s−1, 306 μg·s−1 and 567 μg·s−1 when the vehicle speed is 10 km·h−1, 20 km·h−1, 30 km·h−1, 40 km·h−1, 50 km·h−1 and 60 km·h−1, respectively [10]. Generally, the engine load rate and PM emissions will increase in most cases when the vehicle is under the acceleration driving mode. In addition, the engine’s work per unit time tends to increase with the acceleration of the vehicle speed, resulting in the rise of PM emissions. The PM emissions of Buses C, D, E and H are lower than the average value, while Buses A, B and F are higher than the average PM emission. Due to the deterioration factors and relatively low driving speed, Bus G has poor PM emissions. The phenomenon that the PM emission rate decreased significantly from 30 km·h−1 to 40 km·h−1 needs to be further studied. The reason may be that the engine revolution speeds are different at different vehicle speeds.

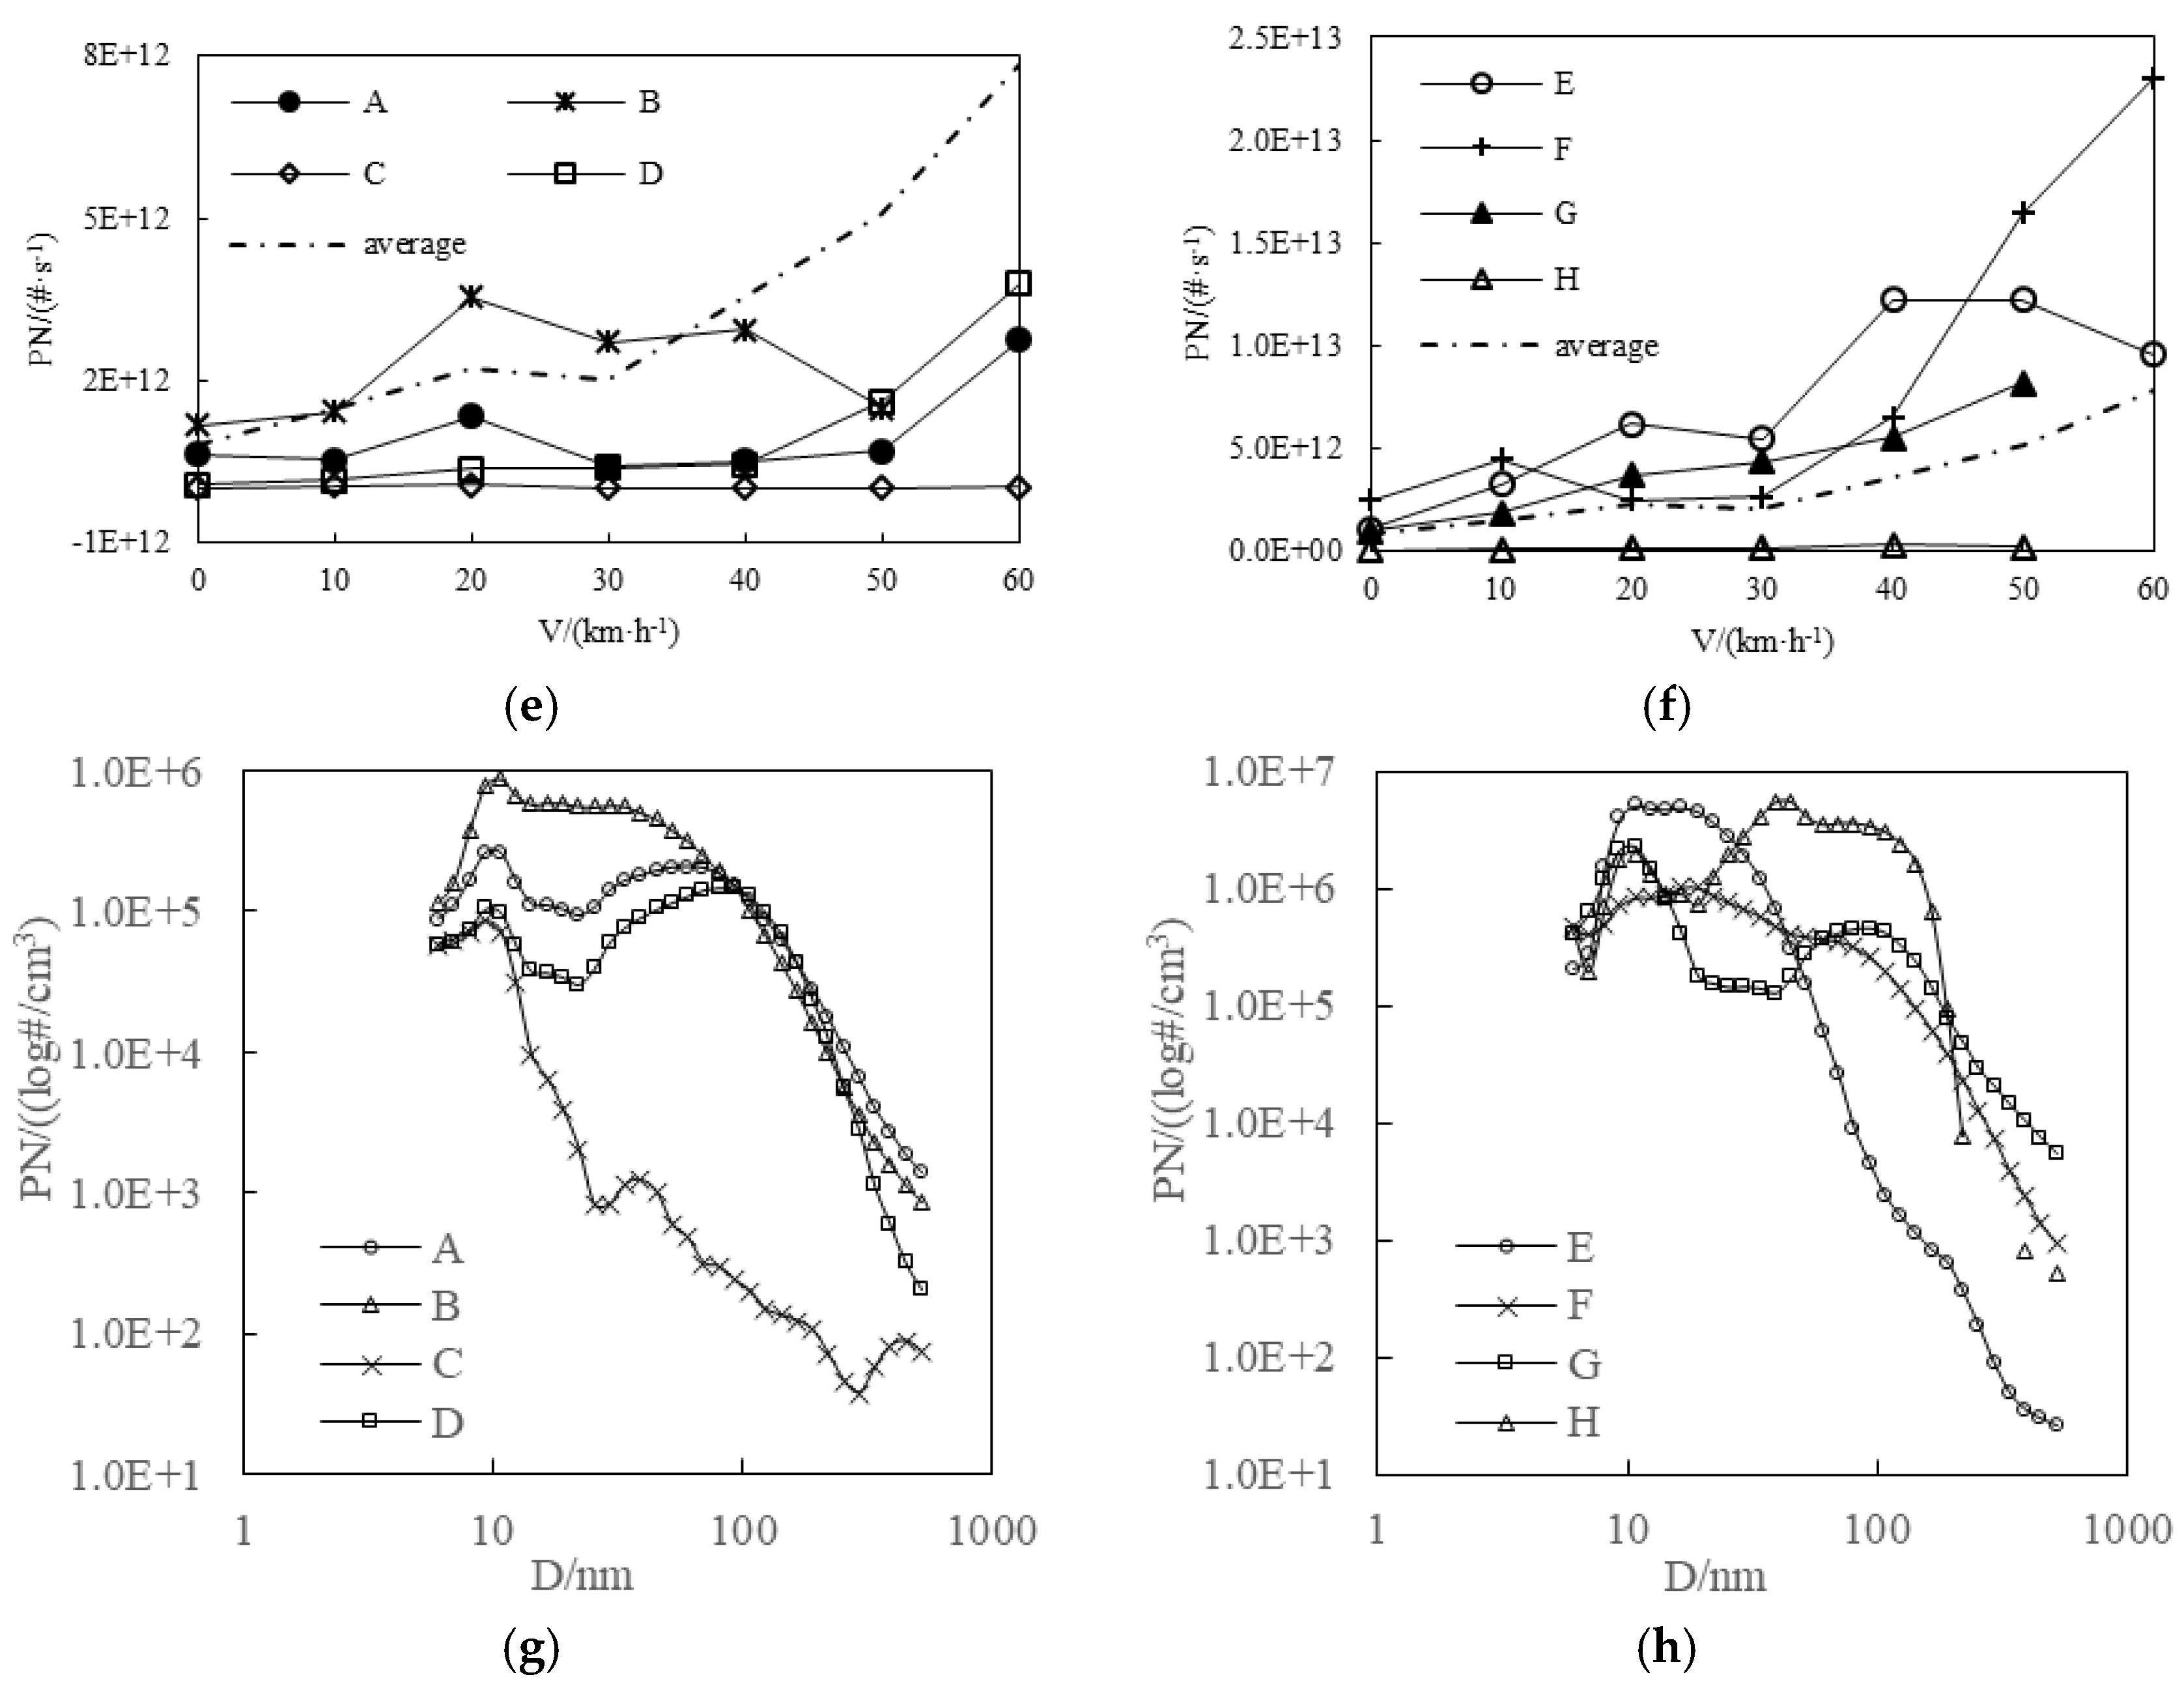
3.3.3. Emission Characteristics of PN

PN emission ratio of buses is shown in Figure 3e,f. Overall, PN emission increases gradually with the increase of vehicle speed. The average bus PN emissions are 1.5 × 10¹² #·s−1, 2.2 × 10¹² #·s−1, 2.0 × 10¹² #·s−1, 3.5 × 10¹² #·s−1, 5.1 × 10¹² #·s−1 and 7.8 × 10¹² #·s−1 when the vehicle speed is 10 km·h−1, 20 km·h−1, 30 km·h−1, 40 km·h−1, 50 km·h−1 and 60 km·h−1, respectively [10]. The PN emissions of Buses A, C, D and H are lower than the average PN emission, while Buses B, E and F are higher than the average PN emission.
This can be seen in Figure 3g,h, which demonstrates the bus PN concentration of different particle sizes at the speed of 20 km·h−1. With respect to the speed of 20 km·h−1, the reason is that the average speed of urban buses is around 20 km·h−1 in the Yangtze River Delta Area, China. It was found that the PN concentrations of Buses A, C, and H show the bimodal distribution feature. For Bus A, the emission particle sizes are 9.3 nm and 60.4 nm, an PN emission sizes are 2.0 × 10⁶ #·cm−3 and 2.1 × 10⁵ #·cm−3, respectively. For Bus H, the emission particle sizes are 10.8 nm and 45.3 nm, and PN emission sizes are 2.0 × 10⁶#·cm−3 and 5.3 × 10⁶#·cm−3, respectively. For Bus C, the emission particle sizes are 9.3 nm and 80.6 nm, and PN are 1.0 × 10⁶#·cm−3 and 2.1 × 10⁵#·cm−3, respectively. The remaining five buses have the same particle size value (10.8 nm), and PN emission sizes within the range of 0.085–5.1 × 10⁶#·cm−3. Bus E shows the largest PN emission sizes among these five buses, demonstrating that LNG buses emit relatively higher number of ultrafine particles.

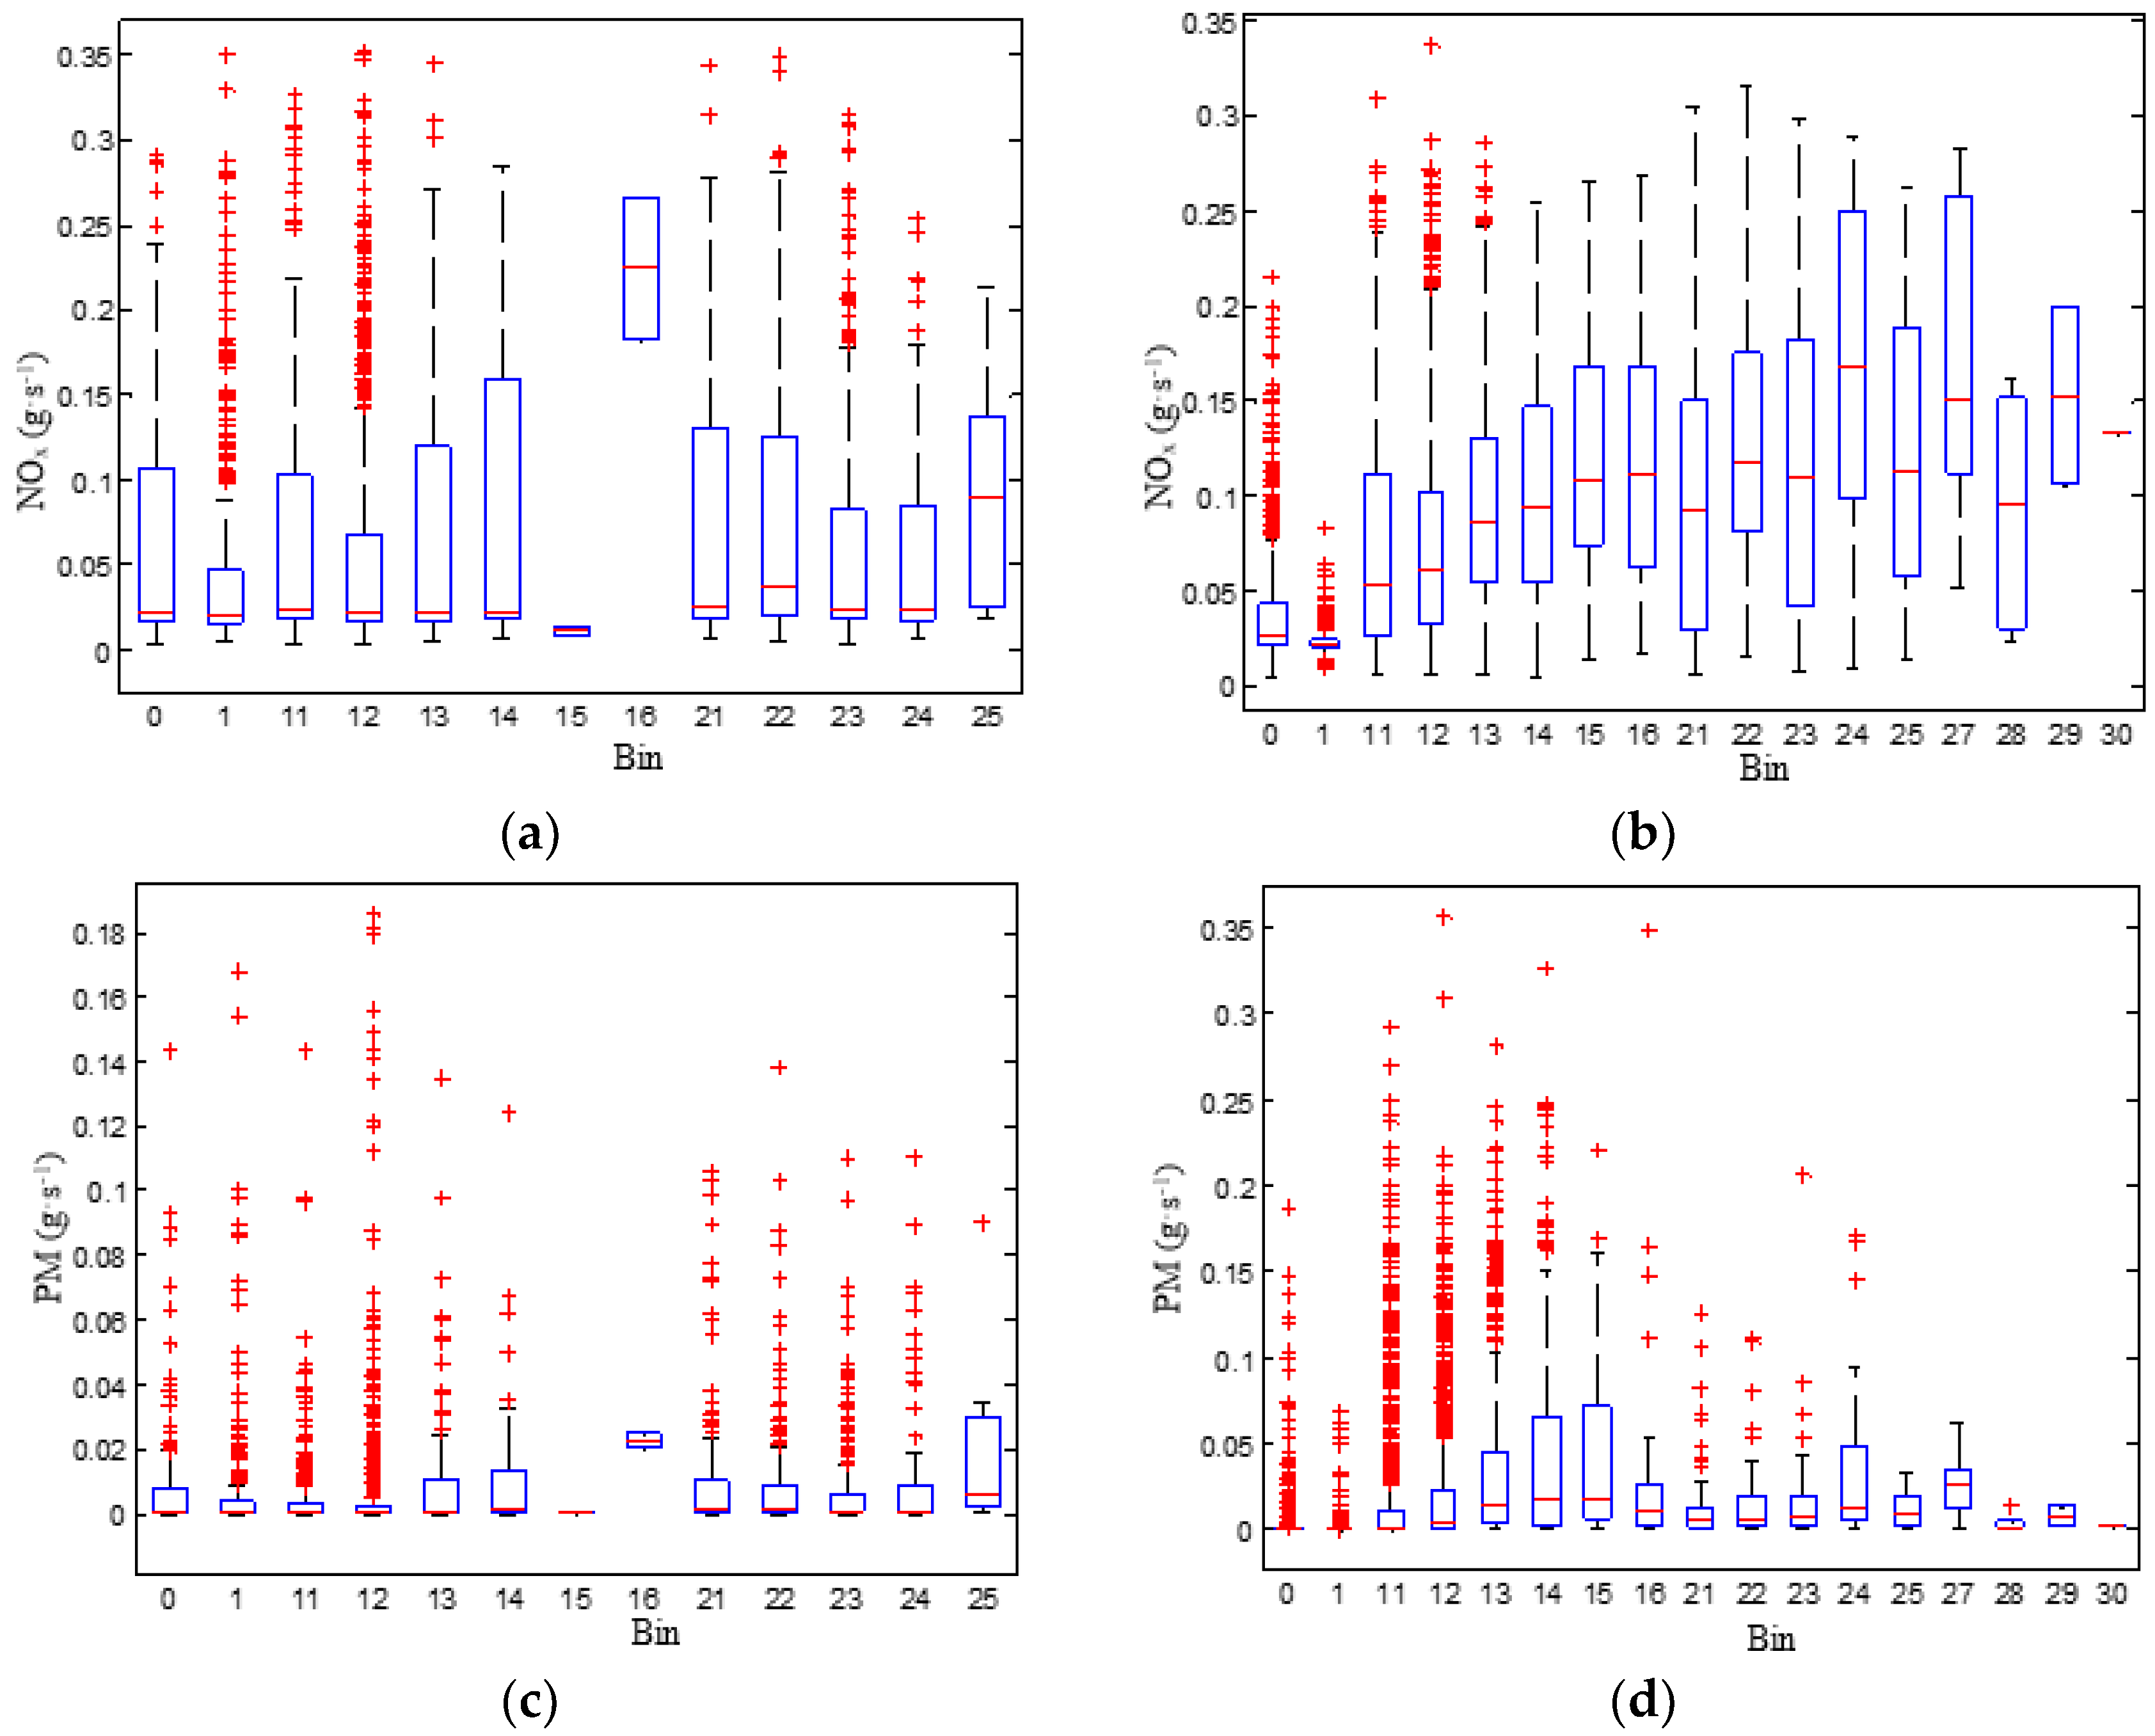
3.4. Instantaneous Emission Rates by Operating Modes

According to accumulated data regarding heavy-duty diesel vehicle (HDDV) driving conditions in China, 23 operating mode bins with reference to the MOVES model were eventually constructed: a deceleration mode (Bin 0), an idling mode (Bin 1) and 21 modes representing cruise or acceleration ranges that could be further categorized into three speed ranges (Table 4).
The average emission rates by different operating modes based on the second-by-second test profiles of bus is presented in Figure 4. In general, the average NOx emission rates for all the emission standard categories increase with VSP at both speed ranges [27,28]. Euro III Bus operating mode includes Bin 0, Bin 1, Bin 11, Bin 12, Bin 13, Bin 14, Bin 15, Bin 16, Bin 21, Bin 22, Bin 23, Bin 24 and Bin 25. More emission rate distributions with lower mediums, especially on Bin 15 and Bin 16 due to the lack of observed data, were found. For lower speed operating modes, average NOx emission rate increased from 0.0645 ± 0.0747 g·s−1 in Bin 11 to 0.2244 ± 0.0596 g·s−1 in Bin 16, corresponding to a 3.5-fold increase. Extreme values that deviated significantly from the medium emerged for Bin 1, Bin 12 and Bin 23. Euro IV bus operating mode includes Bin 0, Bin 1, Bin 11, Bin 12, Bin 13, Bin 14, Bin 15, Bin 16, Bin 21, Bin 22, Bin 23, Bin 24, Bin 25, Bin 27, Bin 28, Bin 29 and Bin 30. It was found VSP provided a wider dispersion of emission rates. For medium speed operating modes, extreme values that deviated significantly from the medium emerged for Bin 0, Bin 1, Bin 11, Bin 12 and Bin 13. Extreme PM emission rate that deviated significantly from the medium emerged for the 23 operating mode bins.

3.5. Impact of Traffic Conditions

Figure 5 presents the relationship between the relative NOx and PM emission factors and average speeds during all 1 min traffic episodes to illustrate the impact of traffic congestion on buses emissions. The results are calculated using Equation (2).
As shown in Figure 5a, when traffic conditions become extremely congested with an average speed lower than 30 km·h−1, NOx emission factors significantly increase as speed decreases. When the average speeds range from 30 km·h−1 to 60 km·h−1, NOx emission factors gradually decrease with increasing traveling speed. The nonlinear function y = exp(0.000004x4 − 0.0005x3 + 0.0199x2 − 0.3816x + 5.1109) has been identified as the best fitting curve, where x and y are the average speed (km·h−1) and relative NOx emission factors (g·km−1), respectively. The correlation coefficient R2 is as high as 0.77, indicating that changes in vehicle speeds exerted strong impacts [4,10].
As Figure 5b indicates, when traffic conditions become extremely congested with an average speed lower than 15 km·h−1, PM emission factors significantly increase as speed decreases. When the average speeds range from 30 km·h−1 to 60 km·h−1, PM emission factors become less sensitive to changes in traffic conditions. The nonlinear function y = exp(0.000003x4 − 0.0004x3 + 0.0179x2 − 0.4065x + 3.5506) has been identified as the best fitting curve, where x and y are the average speed (km·h−1) and relative PM emission factors (g·km−1), respectively. The correlation coefficient R2 is as high as 0.65, indicating that changes in vehicle speeds exerted strong impacts.
Overall, high NOx and PM emission distributed at low speed range while higher speed yields more stable but lower emissions, mimicking an interesting “long tail effect”. The emission from the bus with speed greater than 30 km·h−1 should not be ignored. There might be some measurement error in Figure 5, as only few points were documented for lower speed bus. These might be attributed to our experiment device or data collection method. For future work, enhancing this to conduct more accurate and complete experiments would be interesting. Because of intersections, the speed of buses is less than 60 km·h−1 on arterial roads, resulting in the lack of emission data with the high speed.

3.6. Emission Characteristics of Hybrid and Conventional Buses

Data for Buses F and G were collected under the real-world bus routes and stop at the bus stations. Bus F (Hybrid bus) idle ratio was 23.4%, cruise ratio was 16.1%, acceleration ratio was 33.7%, and deceleration ratio was 26.8%. Bus G (Diesel, conventional bus) idle ratio was 19.1%, cruise ratio was 12.0%, acceleration ratio was 36.0%, and deceleration ratio was 32.9%.
As Figure 6 indicates, NOx emissions of Bus F (Hybrid) idle ratio was 18.1%, cruise ratio was 19.5%, acceleration ratio was 39.9%, and deceleration ratio was 22.5% [8]. NOx emissions of Bus G (Diesel) idle ratio was 6.6%, cruise ratio was 13.6%, acceleration ratio was 49.0%, and deceleration ratio was 30.8%. PM emissions of Bus F (Hybrid) idle ratio was 9.9%, cruise ratio was 35.5%, acceleration ratio was 27.1%, and deceleration ratio was 27.5%. PM emissions of Bus G (Diesel) idle ratio was 1.0%, cruise ratio was 10.8%, acceleration ratio was 64.2%, and deceleration ratio was 24.1%. PN emissions of Bus F (Hybrid) idle ratio was 12.5%, cruise ratio was 31.7%, acceleration ratio was 29.7%, and deceleration ratio was 26.1%. PN emissions of Bus G (Diesel) idle ratio was 6.0%, cruise ratio was 13.7%, acceleration ratio was 50.1%, and deceleration ratio was 30.1%.
Based on the evidence above, it was observed that hybrid bus had fewer emissions of NOx, PM, and PN compared to diesel bus when bus was in the acceleration condition. Specifically, ratio emission of PM and PN were almost half of that of diesel bus.

4. Conclusions

In this study, NOx, PM and PN emissions from the buses in Shanghai, Hangzhou and Suzhou were tested using PEMS. The exhaust emission characteristics of hybrid and conventional buses using different fuels were investigated.
It was shown that hybrid bus exhausted fewer NOx, PM and PN emissions compared to conventional bus in the acceleration condition. PM emission ratio of hybrid bus was almost half of that of conventional bus. NOx emission factors (unit: g·km−1) were in the range of 5–19.1, and PM emission factors (unit: g·km−1) were in the range of 0.001–0.189.
A nonlinear model was established based on scientific statistical method, which showed that NOx and PM emission factors significantly decreased with increasing speed below 30 km·h−1, while gradually flattened beyond 30 km·h−1.
NOx, PM and PN emission rates increased with speed increasing under steady state driving condition. Particularly, NOx emission rates of bus fueled with LNG showed a fluctuation characteristic, and was higher than that of the conventional bus. For PN emission, Buses A, F and G showed a bimodal distribution under steady state driving condition at 20 km·h−1, while others showed a unimodal distribution.
In general, the average NOx emission rates increased as VSP increased. It was found that there were a few limitations associated with extreme values of emission rate in 30 bins. The robustness of current results derived from our experiments should be tested in further research. Furthermore, the cluster analysis of VSP based on filed observations in China should be explored to show the operation mode distribution characteristics.

Author Contributions

Conceived and designed the paper: D.L. (Dengguo Liu) and D.L. (Diming Lou). Collected, analyzed data and wrote the paper: D.L. (Dengguo Liu), D.L. (Diming Lou), J.L., L.F., and W.H.

Fundings

This research was funded by Science and Technology Commission of Shanghai Municipality (Grant Nos. 16DZ1206700 and 16DZ1203000).

Conflicts of Interest

The authors declare no conflict of interest.

References

  1. Hu, Z.; Qin, Y.; Tan, P.; Lou, D. On-road NOx and ultrafine particle emission characteristics of China IV diesel bus in Shanghai. J. Tongji Univ. (Nat. Sci.) 2015, 43, 286–292. [Google Scholar]
  2. Ye, X.; Xu, C.; Hong, S.; Jiao, L.; Shen, J.; Zhang, T.; He, X. Emission inventory and characteristics of air pollutants in Hangzhou. Environ. Monit. China 2015, 31, 5–11. [Google Scholar]
  3. Mason, B.; Bradley, W.; Pezouvanis, A.; Ebrahimi, K. Repeatable steady-state measurement of particulate number emissions in engine experiments. Int. J. Engine Res. 2016, 17, 1108–1117. [Google Scholar] [CrossRef]
  4. Fu, M.; Ge, Y.; Wang, X.; Tan, J.; Yu, L.; Liang, B. NOx emissions from Euro IV busses with SCR systems associated with urban, suburban and freeway driving patterns. Sci. Total Environ. 2013, 222, 452–453. [Google Scholar] [CrossRef] [PubMed]
  5. Hao, Y.; Yu, L.; Song, G.; Xu, Y.; Wang, H. Analysis of driving behavior and emission characteristics for diesel transit buses using PEMS’ measurements. J. Clin. Nurs. 2010, 17, 2741–2749. [Google Scholar]
  6. Wu, X.W.; Peng, M.C.; Fang, R.H.; Li, J.F.; Cai, M.T. Emission test and analysis for diesel transit bus using PEMS. Environ. Sci. Technol. 2012, 35, 146–149. [Google Scholar]
  7. Yu, Q.; Li, T. Evaluation of bus emissions generated near bus stops. Atmos. Environ. 2014, 85, 195–203. [Google Scholar] [CrossRef]
  8. Hallmark, S.L.; Wang, B.; Sperry, R. Comparison of on-road emissions for hybrid and regular transit buses. J. Air Waste Manag. Assoc. 2013, 63, 1212–1220. [Google Scholar] [CrossRef] [PubMed] [Green Version]
  9. Zhang, S.; Wu, Y.; Hu, J.; Huang, R.; Zhou, Y.; Bao, X.; Fu, L.; Hao, J. Can Euro V heavy-duty diesel engines, diesel hybrid and alternative fuel technologies mitigate NOX, emissions? New evidence from on-road tests of buses in China. Appl. Energy 2014, 132, 118–126. [Google Scholar] [CrossRef]
  10. Zhang, Y.H.; Lou, D.M.; Tan, P.Q.; Hu, Z. Particulate emissions from urban bus fueled with biodiesel blend and their reducing characteristics using particulate after-treatment system. Energy 2018, 155, 77–86. [Google Scholar] [CrossRef]
  11. Huang, C.; Chen, C.; Lou, D.; Zhen, X.H.; Tan, P.Q.; Hu, Z.Y. Real world fuel consumption and emissions simulation and its application for heavy duty diesel vehicles. Acta Sci. Circumst. 2010, 30, 2369–2373. [Google Scholar]
  12. Nakamura, H. Vehicle-installed exhaust gas analyzing apparatus. U.S. Patent 6865472, 8 March 2005. [Google Scholar]
  13. Liu, D.; Liu, J.; Lou, D. On-road NOx emission measurement of urban bus in Yangtze River Delta. Environ. Monit. Manag. Technol. 2016, 28, 14–18. [Google Scholar]
  14. Lou, D.M.; Wang, W.G.; Hu, Z.Y.; Tan, P.Q. Real road emission characteristics of CTL bus based on operating parameters. Chin. Intern. Combust. Engine Eng. Available online: https://www.researchgate.net/publication/290246233 (accessed on 15 June 2018).
  15. Lou, D.; Cheng, W.; Feng, Q. On road particle emission characteristics of a Chinese phase IV natural gas bus. Environ. Sci. 2014, 35, 864–869. [Google Scholar]
  16. Lou, D.; Zhu, Z.W.; Tan, P.Q.; Hu, Z.Y. Characterization of the particle emissions from diesel transit bus equipping diesel particulate filter with fuel burner. Adv. Mater. Res. 2014, 864–867, 1386–1393. [Google Scholar] [CrossRef]
  17. Parashar, D.C.; Gadi, R.; Mandal, T.K.; Garg, S.C. Emissions of carbonaceous aerosols from biofuels in India. Atmos. Environ. 2005, 39, 7861–7871. [Google Scholar] [CrossRef]
  18. Qu, L.; Li, M.; Chen, D.; Lu, K.; Jin, T.; Xu, X. Multivariate analysis between driving condition and vehicle emission for light duty gasoline vehicles during rush hours. Atmos. Environ. 2015, 110, 103–110. [Google Scholar] [CrossRef]
  19. Xue, J.; Li, Y.; Wang, X.; Durbin, T.D.; Johnson, K.C.; Karavalakis, G.; Asa-Awuku, A.; Villela, M.; Quiros, D.; Hu, S.; et al. Comparison of vehicle exhaust particle size distributions measured by SMPS and EEPS during steady-state conditions. Aerosol Sci. Technol. 2015, 49, 984–996. [Google Scholar] [CrossRef] [Green Version]
  20. Takahashi, J.; Hama, N.; Funato, K. Fast measurement applying the operating principle of dma: A new instrument, eeps(engine exhaust particle sizer). J. Jpn. Air Clean. Assoc. 2005, 42, 31–36. [Google Scholar]
  21. Andrei, P. Real World Heavy-Duty Vehicle Emissions Modeling; West Virginia University: Morgantown, WV, USA, 2001. [Google Scholar]
  22. Wang, H.T.; Yu, L.; Hao, H.; Song, G.H.; Guo, Y. Calculation of vehicle specification power for heavy-duty Vehicles. Saf. Environ. Eng. 2011, 18, 124–128. [Google Scholar]
  23. Zheng, X.; Wu, Y.; Jiang, J.; Zhang, S.; Liu, H.; Song, S.; Li, Z.; Fan, X.; Fu, L.; Hao, J. Characteristics of on-road diesel vehicles: Black carbon emissions in Chinese cities based on Portable Emissions Measurement. Environ. Sci. Technol. 2015, 49, 13492–13500. [Google Scholar] [CrossRef] [PubMed]
  24. Fan, S.; Li, G.; Tian, G.; Cheng, S.Y. On-road emission characteristics of China IV diesel bus. J. Beijing Univ. Technol. 2012, 38, 1565–1569. [Google Scholar]
  25. Gao, J.D.; Qin, K.J.; Liang, R.L.; Li, M.L. An experimental study on PM and NOx emission characteristics of public bus in real driving condition in Beijing. Autom. Eng. 2011, 33, 757–760. [Google Scholar]
  26. Xu, Y.; Li, J.; Li, M.; Sun, L.A. An experimental study on the NOx emission characteristics of State-IV city bus. Autom. Eng. 2011, 33, 947–950. [Google Scholar]
  27. Song, G.; Zhou, X.; Yu, L. Delay correction model for estimating bus emissions at signalized intersections based on vehicle specific power distributions. Sci. Total Environ. 2015, 514, 108–118. [Google Scholar] [CrossRef] [PubMed]
  28. Soylu, S. The effects of urban driving conditions on the operating characteristics of conventional and hybrid electric city buses. Appl. Energy 2014, 135, 472–482. [Google Scholar] [CrossRef]
Figure 1. Schematic diagram of test system and the schematic diagram of testing routes. (a) Schematic diagram of test system, (b) Shanghai route, (c) Hangzhou route and (d) Suzhou rout.
Sustainability 10 02051 g001
Figure 2. Average emission factors of buses based on mileage. (a) NOx factor; (b) PM factor.
Sustainability 10 02051 g002
Figure 3. Emission Characteristics under the Steady State Driving Condition. ((a) Euro III, (d) Euro IV, (c) Euro III, (d) Euro IV, (e) Euro III, (f) Euro IV, (g) Euro III, and (h) Euro IV.)
Sustainability 10 02051 g003aSustainability 10 02051 g003b
Figure 4. Average emission rates with the unit of g·s−1 for diesel buses in different operating modes (+ denotes extreme values). ((a) Euro III, (b) Euro IV, (c) Euro III, and (d) Euro IV.)
Sustainability 10 02051 g004
Figure 5. Emission factor with traveling speed. (a) NOx emission factor with traveling speed; (b) PM emission factor with traveling speed.
Sustainability 10 02051 g005aSustainability 10 02051 g005b
Figure 6. Emission characteristics of hybrid and conventional buses.
Sustainability 10 02051 g006
Table 1. Statistics of the EEPS-3090.
StatisticNumber (#)Volume (m3)Mass (g)
Concentrationn = (c×DR)/(t×Q×η)v = nπDp3/6m = ρ v
Total concentrationN = l u n V = l u v M = l u m
Notes: The symbols used in the formulas are defined as: c is particle counts per channel, n is number weighted concentration testing per channel, v is volume weighted concentration testing per channel, m is mass weighted concentration testing per channel, η is sample efficiency factor per channel, DR is sample dilution ratio, Dp is particle diameter(channel midpoint), N is total particle concentration, V is total volume concentration, M is total mass concentration, Q is sample flowrate, t is the sample time, ρ is sample density, l is lower channel boundary, and u is upper channel boundary.
Table 2. Basic parameters of the eight buses.
BusFuel/Engine TypeMass (Tone)Mileage (104 km)Rated Power (kw)After-TreatmentTest Route (Time Length)
ADiesel/EuroIII16.512.9170-Figure 1d (2.0 h)
BDiesel/EuroIII18.042.3191-Figure 1c (2.0 h)
CDiesel/EuroIII16.028.6177-Figure 1b (1.5 h)
DDiesel/EuroIII16.028.6177DOC + CDPFFigure 1b (1.5 h)
ELNG/EuroIV17.010.0187DOCFigure 1d (2.0 h)
FDiesel hybrid/Euro IV18.013.5162SCRFigure 1d (2.0 h)
GDiesel/EuroIV18.048.6206SCRFigure 1c (1.5 h)
HDiesel/EuroIV17.519.6213SCRFigure 1b (2.0 h)
Table 3. Real-world driving features of the eight buses.
BusDistance (km)Average Speed (km·h−1)Idle Ratio (%)Uniform Ratio (%)Acceleration Ratio (%)Deceleration Ration (%)
A62.03110.737.830.820.7
B27.413.73312.728.825.5
C44.829.917.727.434.120.8
D38.525.715.849.921.412.9
E34.617.331.36.833.328.6
F40.820.423.416.133.726.8
G26.017.319.112.036.032.9
H52.02611.938.828.420.9
Table 4. Bin distribution based on VSP and speed in MOVES model.
Braking (Bin 0)
Ideling (Bin 1)
VSP (Kw/Tone)/Speed (mph)0–2525–50>50
<0 kW/toneBin 11Bin 21
0–3Bin 12Bin 22
3–6Bin 13Bin 23
6–9Bin 14Bin 24
9–12Bin 15Bin 25
>12Bin 16
12–18 Bin 27Bin 37
18–24 Bin 28Bin 38
24–30 Bin 29Bin 39
>30 Bin 30Bin 40
6–12 Bin 35
<6 Bin 33

