Article

Exploring a Stakeholder Based Urban Densification and Greening Agenda for Rotterdam Inner City—Accelerating the Transition to a Liveable Low Carbon City

1
Faculty of Architecture and the Built Environment, Department of Urbanism, Chair of Landscape Architecture, Delft University of Technology, Julianalaan 134, 2628BL Delft, The Netherlands
2
Faculty of Architecture and Design, Institute for Architecture and Planning, Norwegian University of Science and Technology, 7491 Trondheim, Norway
3
DSA Doepel Strijkers Architecture, Schiedamsesingel 129a, 3012 BA Rotterdam, The Netherlands
4
Stadsontwikkeling Gemeente Rotterdam, afdeling Ruimte en Wonen, Wilhelminakade 179, 3072AP Rotterdam, The Netherlands
*
Author to whom correspondence should be addressed.
Sustainability 2018, 10(6), 1927; https://doi.org/10.3390/su10061927
Submission received: 31 March 2018 / Revised: 25 May 2018 / Accepted: 27 May 2018 / Published: 8 June 2018

Abstract

:
Work on a liveable low carbon city has often been approached in a technocratic way, not linking to other disciplines and urban practices at a large scale. This paper explores a stakeholder based urban agenda for a more liveable low carbon city by densifying and greening with the case study of Rotterdam inner city. Rotterdam presents a unique European case with a modernistic inner city. Like many North American cities, the inner city for a long time mainly served as a business or shopping district with few inhabitants and few synergetic links between flows, urban functions, and areas. In line with other cities, Rotterdam aims to reduce carbon emissions and provide a high quality of life. To address this, the hypothesis ‘densifying and greening leads to a more sustainable inner city’, was tested and applied with stakeholders using transition management combined with urban data, modelling, and design. With sustainability indicators, geographic information system (GIS) mapping, and urban models, a baseline study was completed and expected outcomes were described and, where possible, validated in reality. The outcomes confirmed the stated hypothesis and showed that linking design, GIS mapping, and city data to transition management proved successful.

1. Introduction

1.1. Densification and Greening in an Urban Quality of Life, Liveable Low Carbon Context

Uncertainty and impacts of demographic changes, multiculturalism, globalisation of trade, environmental degradation, as well as climate change are pressing forces, which urban planning has to consider when drafting a liveability and low-carbon agenda for the short-term and long-term action of a city.
At the start of the low carbon city agenda presented by the city of Rotterdam in 2007, many projects on a low-carbon city were approached in a technocratic way, resulting in the first years in available technical solutions which did not find their way quickly into urban practices or projects. At the same time, there was a lot of knowledge developed, and is still developing, on how to work on a transition towards a low carbon city, addressing social, economic, as well as environmental issues [1,2,3]. Bringing together these issues was an obvious step to be taken and lead to this study. This paper explores a stakeholder-based urban agenda for a more sustainable low-carbon city that improves the quality of life/liveability of the area as well as its sustainability performance. How can this be measured and enhanced using urban data?
The low-carbon focus is on the built environment, for which simulation models are used, based on design strategies. The outcomes presented in this paper will be mainly descriptive (based on data of the existing models) rather than quantitative.
Rotterdam presents a unique European case with a post-World War II modernistic inner city. Like many North American cities, for a long time the inner city mainly served as a business or shopping district with few inhabitants and few synergetic links between processes, urban functions, and spatial patterns. In line with many other cities, Rotterdam’s long-term vision consists of issues such as reduction of carbon emissions, becoming more sustainable, and providing a high quality of life. To address these goals as well as to create synergetic links between them, they need to be applied in projects.
One of the bigger project ideas at hand is the densification and greening of the inner city.
The International Architecture Biennale Rotterdam 2012 (IABR2012) named ‘Making City’ and the European INTERREG IVB project Music (Mitigation in Urban Areas Solutions for Innovative Cities) served as a platform for this project idea as well as its actual application [4]. Right now, the topic of densification and greening in a sustainable way is very relevant since a new urgency has emerged and many cities in the world have to densify to accommodate new inhabitants. CPB, Centraal Planbureau, Netherlands Bureau for Economic Policy Analysis and PBL, Planbureau voor de Leefomgeving, Netherlands Environmental Assessment Agency (2015) [5] presented two scenarios: a high and low one; both expect population growth as well as growth of housing need. This varies from 250,000 to more than 1 million houses for the Randstad area till 2030. This means that cities like Rotterdam need to add tens of thousands of new houses in the coming decade. The outcomes of this study can help in all these tasks.
To bridge the gap with the technocratic approach applied in the city until then, a governance approach, namely transition management [3], was used and enriched using urban data, modelling, and design throughout the process.
A set of sustainability indicators is used in a baseline study, geographic information system (GIS) mapping and urban simulation models, to predict expected outcomes of the presented plans.

1.2. Government as a Stakeholder: From ‘Blueprint’ Planning to Facilitating

The urge to create a more sustainable city that offers a high quality of life, a city where actively engaged inhabitants are required, showed that ‘blue print’ or top-down planning alone, could not be used as a model as it was too strict and left little space for experiments and bottom-up initiatives. As such, the role of the government’s planning approach is under study. Which strategy should be followed? How to act? In order to build a stakeholder-based urban agenda for the Rotterdam inner city, challenges and opportunities need to be defined, also taking the historical context into account.

1.3. Concise History of the Rotterdam Inner City

Until 1940 the centre was a bustling city. However, after 1945 it was characterised by functionality. The bombing of 1940 unwillingly led to the fulfilment of another cherished desire, which was to become a new modern city. A complete new centre with modern architecture was introduced. However, this was accompanied by an almost anti-urban experiment with the separation of functions, based on a typical model of society at that time: the city as a sum of separate functional clusters, which had nothing to do with each other. As a result, new housing was not part of the inner city and was planned outside the city in one of the new-green-neighbourhoods. Essential for the city was also the vibrant, cultural (night) life that was gone. It turned out that the new ‘functionalism’ approach did not offer a good breeding ground for this. In the 1970s and 1980s, the gloss of modernity, so typical of the period of reconstruction after the war, was gone. The ever so modern Lijnbaan shopping mall in the centre of the city had become outdated. There were large bare spots in the city centre and in the evening the streets were deserted. Since 1985, more housing has been planned in the inner city area. The famous cube houses of Piet Blom were built in those days (Figure 1).
Apartment buildings were built and in the following years high rises were permitted as well. In a few years’ time the Rotterdam skyline changed. A high-rise policy was implemented. Slowly, the city regained some allure. In fact, in the Netherlands, it was nicknamed ‘Manhattan on the Maas’. However, this didn’t change much at street level at first. It was only after the city implemented a public space strategy with a lot of attention at street level, that public life in the streets started to emerge faster. Instead of skyscraper, this strategy was called ‘groundscraper’ [6].
The idea that the inner city was mainly for business and shopping and not so much for living was left in the late seventies, but only banned in the past twenty years. At the moment, there is a very clear idea that to become a successful sustainable city, the city also needs an attractive heart, and that includes inner city living. The modernistic separation of urban functions from the reconstruction period after World War II is still present in the inner city. Due to the efforts of the last twenty years, the glass is half full, but there is still a backlog in critical mass, amenities, child friendliness, good public space, and green. That is why it is vital for Rotterdam to continue to densify the inner city. It might take another two decades to reach the population density of an average Dutch city, but those parts of the city that are already densely densified, such as the Scheepvaartkwartier and the Laurenskwartier, show a buzz of urban life. For example, the Veerhaven and surroundings and De Meent are an attractive entertainment area.

1.4. A Facilitating Government

The Rotterdam inner city has the scale of a district or neighbourhood. These scales are crucial as they are the best scales for realising sustainability ambitions in a city: small enough to take quick action and large enough to make an impact.
There has, however, been a shift in approach for urban-area development: a shift from a strong focus on top-down planning and master plans towards bottom-up approaches accompanied by room for initiatives. “The question is how to combine the step towards a sustainable world with the exploitation of forces in an energetic city. This is not about top-heavy committees that launch proposals of the likes of the Delta Works, but about an administration that attempts to channel social energy in the right direction” [7].
Rotterdam left behind its long-cherished, post-war reconstruction mentality. The municipality has been moving towards a facilitating role. With that, a new way of working is introduced in which frameworks play an important role. Defining frameworks is a first step. Another crucial aspect is the competence required for their application, such as regulations. Regulation is an extremely complicated exercise of equilibrium. “Too much regulation will put a check on things. Too little may lead to derailment. Moreover, regulation can be interpreted wrongly or inadequately supervised, and thus miss its goal. The conclusion is that cooperation or this way of working requires socially intelligent civil servants” [8]. This change within the municipality could provide opportunities for a multitude of initiatives from inhabitants and businesses.

1.5. Challenges and Aims

1.5.1. Challenges: Underperformance and Lack of Synergies

Urban regions are the engine of our economy, with inner cities playing a leading role in this. In the history of the Rotterdam inner city, the background of the main challenge was described: increase urban living in a modernistic inner city where for a long time the focus was on businesses, offices, and shopping, where housing was not a priority. In this context, the Municipality of Rotterdam is expected to set priorities and the inner city is at the top of the list. As yet, the potential of Rotterdam’s inner city has not been fully exploited. This is in large part a consequence of the relatively small number of inhabitants the inner city currently accommodates. A confident inner city is vital for the quality of life of the city as a whole. Synergy is an important aspect in this: synergy between the enterprising inhabitants of inner cities and employment, and culture and, for example, culinary meeting points [9]. This is why the Municipality of Rotterdam values inner-city densification with more dwellings and apartments.

1.5.2. Aims

To get from a project idea of densification and greening to realisation, politicians and policymakers had to be convinced of its values as well as its potential of realistic realisation. The question is also if it will lead to a more sustainable city, as Florida (2010) and Glaeser (2011) and other authors suggest [10,11,12,13].
Densification is usually a step-by-step process. Rotterdam has already shown that densification can contribute to creating a successful city; the Laurenskwartier district is an example of this where more inhabitants fuelled amenities and good street life. When comparing the inner city of Amsterdam to Rotterdam, twice as many people live on the same surface area in Amsterdam as in Rotterdam. Would it be possible to house twice as many people in Rotterdam’s inner city and increase its population from 30,000 to 60,000? To give insight if this is a realistic number within the Rotterdam context, but also to study if this could improve quality of life, small scale densification studies were done.
To follow up on this, the research question is: What are potential densification and greening strategies and a stakeholder based urban agenda, which improves the quality of life/liveability of the area as well as its sustainability performance? How can this be measured and enhanced using urban data?
Within this context, the objectives of this paper are:
  • To test if densification and greening of the inner city of Rotterdam can lead to a more sustainable city with a higher quality of life.
  • To present the outcome of a transition management process as realised in the city of Rotterdam from the problem delineation to agenda setting.
  • To determine how to measure sustainability in a sustainability profile. What is the baseline and what are expected results?
  • To determine how these data can be used in transition management and a stakeholder environment to explore potential synergies and vision making.

2. Materials and Methods: A Stakeholder-Based Urban Densification and Greening Agenda and Building a Validation Tool

2.1. Organisation and Planning

IABR 2012, the International Architecture Biennale Rotterdam which served as a platform for this study, describes that ‘by linking urban issues, political decision making and design in an interactive and direct way, it promoted more flexible forms of cooperation and alliances, design instruments and governance’ [14]. These are the ingredients of the methodology of this paper (Figure 2).

2.2. Inventory, Pre-Studies, and Stakeholder Analysis

The first part of the study is an inventory, background, and history of the area. This is also useful for knowing more about the urban challenges in the area related to social, economic, or spatial structures. Next is a system analysis, studying facts and figures about the urban challenges ahead. A last step is a first link to exploring synergies using design. Design is used to show stakeholders potential solutions to one or more challenges, what it can look like if it fits and if it evokes a positive or negative experience. In a fast changing world, there is a big need for information and data, but also participation. To help strengthen the inventory phase, but also to have an overview of which stakeholders to select for a good embeddedness to make the transition happen, a range of stakeholders were selected in meetings. From bottom-up to top-down, from government to business. In this process, three focus group meetings were organised with stakeholders in the city. The first group were the (future) inhabitants. As the topic is densification and greening, the main focus was what kind of city (future) inhabitants wished to have; who were the clients who would live there? The future inhabitants were identified through housing brokers and their clients in the city. This was a mix of young families living in neighbouring cities but working in Rotterdam, graduating students, former immigrants making a career, and pensioners. A second group was a mix of shopkeepers, business people, and designers such as (landscape) architects. These people were all connected or members of the ‘van der Leeuwkring’, an organization concerned about the quality of the public space of the inner city. The third group were market parties and inhabitants who were already setting up initiatives and doing things themselves.

2.3. GIS Analysis and Transition Management

Transition management depends in part on the role of the participants in the process, as well as on good, detailed information.
The development of GIS tools such as urban energy maps provided the participating stakeholders in the transition management workshops with valuable information on, for instance, CO2 reduction potentials. These tools also allowed for measuring energy consumption and the outputs of the actions that were formulated in the transition management action plan. The stakeholders, therefore, acquire a good insight in the real impact of their actions and pilots, and will be able to compare them with alternatives. The GIS maps and data feed the stakeholder process. A stakeholder process without accurate data and mapping allows for some stakeholders to take the over in a discussion or for incorrect assumptions to be incorporated in a discussion. A stakeholder process with accurate data and maps levels the playing field better and can quickly check disputable assumptions. Of course, this depends strongly on the accessibility of the data and maps and requires a good discussion leader and data specialists. There are also other low-tech ways to collect data such as fieldwork with observing situations and interviewing locals. Either way, this way of working has additional values when combined with GIS technologies as it gives extra information and knowledge.

2.4. Transition Arenas

As a start, interviews were held with various stakeholders to find out who as engaged inhabitants and entrepreneurs wished to participate (or should be invited) in giving form to Rotterdam’s future inner city. Trend-setters among this group, along with cultural leaders and trend-setters from the Municipality of Rotterdam, participated in transition arenas. Ideas, initiatives, obstacles, and problems were debated at these meetings with the aim of reaching consensus on a common vision.
In transition arenas, the urban challenge of densification plus greening in a sustainable way is discussed, elaborated, designed, altered, and finally put into a long-term vision with an agenda of actions. The transition arenas were organised to build the densification and greening agenda from vision to implementation.
Three components fed the transition arenas. Firstly, the pre-studies such as historical background, challenges, and opportunities. Secondly, the three focus group meetings with housing brokers, clients, shopkeepers, entrepreneurs, and designers. Thirdly, an important extra component, as explained earlier, was the use of information coming from GIS maps and the city to give direct feedback to (wrong or right) assumptions. In this way, the proposed change can be based on facts (quantitative), wishes, opportunities, stories, and design (qualitatively). Stakeholders can see and understand different scenarios or transition paths and choose accordingly. This way the transition strategy and agenda was formed posing for long-term ambitions and short-term innovative actions to go hand in hand.

2.5. Validation Tool, Sustainability Profile for Measuring

The concept of sustainability is often criticised for its lack of clarity and expressiveness. Sustainability can be explicit though. Data, software tools, and sound theoretical context are put to use in order to present condensed analyses of important selected sustainability aspects that are related to this case of densification and greening.
The concept of sustainability originally stems from ecology, where it refers to ecological and environmental boundaries that should be respected to ensure preservation of stock of fish and forests for future generations [15]. In 1987 the Brundtland report, “Our Common Future” [16], broadened the concept of sustainability to socio-economic aspects and the balanced development of social, economic, and environmental factors; later it was rephrased as people, planet, profit (prosperity).
In this chapter, the impact of densification of the inner city of Rotterdam on sustainability is investigated with the help of a newly developed sustainability profile.
As a first step, a framework consisting of 35 indicators was built for eight chosen themes. Figure 3 shows an overview of the different themes and indicators. These themes were seen as priority issues by the city at the time. The themes distinguished cover a broad definition of sustainability, and thus include social and economic aspects as well as ecological and environmental ones (people, planet, prosperity). The subdivision into themes and indicators is based on earlier studies of TNO (toegepast-natuurwetenschappelijk onderzoek; the Netherlands organisation for applied scientific research), with sustainability measuring at the regional level. In this case, the benchmark of the province of Utrecht for its new spatial vision and a visualisation of chances for more sustainability for the province of Overijssel was used [17].

Indicator Selection

The selection of indicators was based on priority issues formulated by the city, their relation with urban densification, and on the availability of data. Subsequently, a baseline of the Sustainability Profile was set for these themes in the inner city. Following this, the densification strategies and designs were imported into the model Urban strategy [18] and GIS; the values of the 35 indicators were calculated for 2040 or for the moment the proposed densification and greening is completed. To assess the impact of the proposed densification, the outcomes were interpreted qualitatively by visual comparison, and quantitatively by summarising results and making additional calculations. After that, the values of the individual indicators were combined for all distinguished themes. The outcomes were presented in a spider diagram which was called The Sustainability Profile.
The Urban Strategy model provided the energy, traffic as well as the noise and air pollution modules [19] to assess the impact of the densification proposals on eight sustainability themes. Other models were used in addition: Regina, the regional economic model [20], SOLWEIG (Solar and Longwave Environmental Irradiance Geometry Model), the heat stress model [21], as well as the ‘Hoogwater Informatie Systeem’ or Flooding information system [22].

3. Results

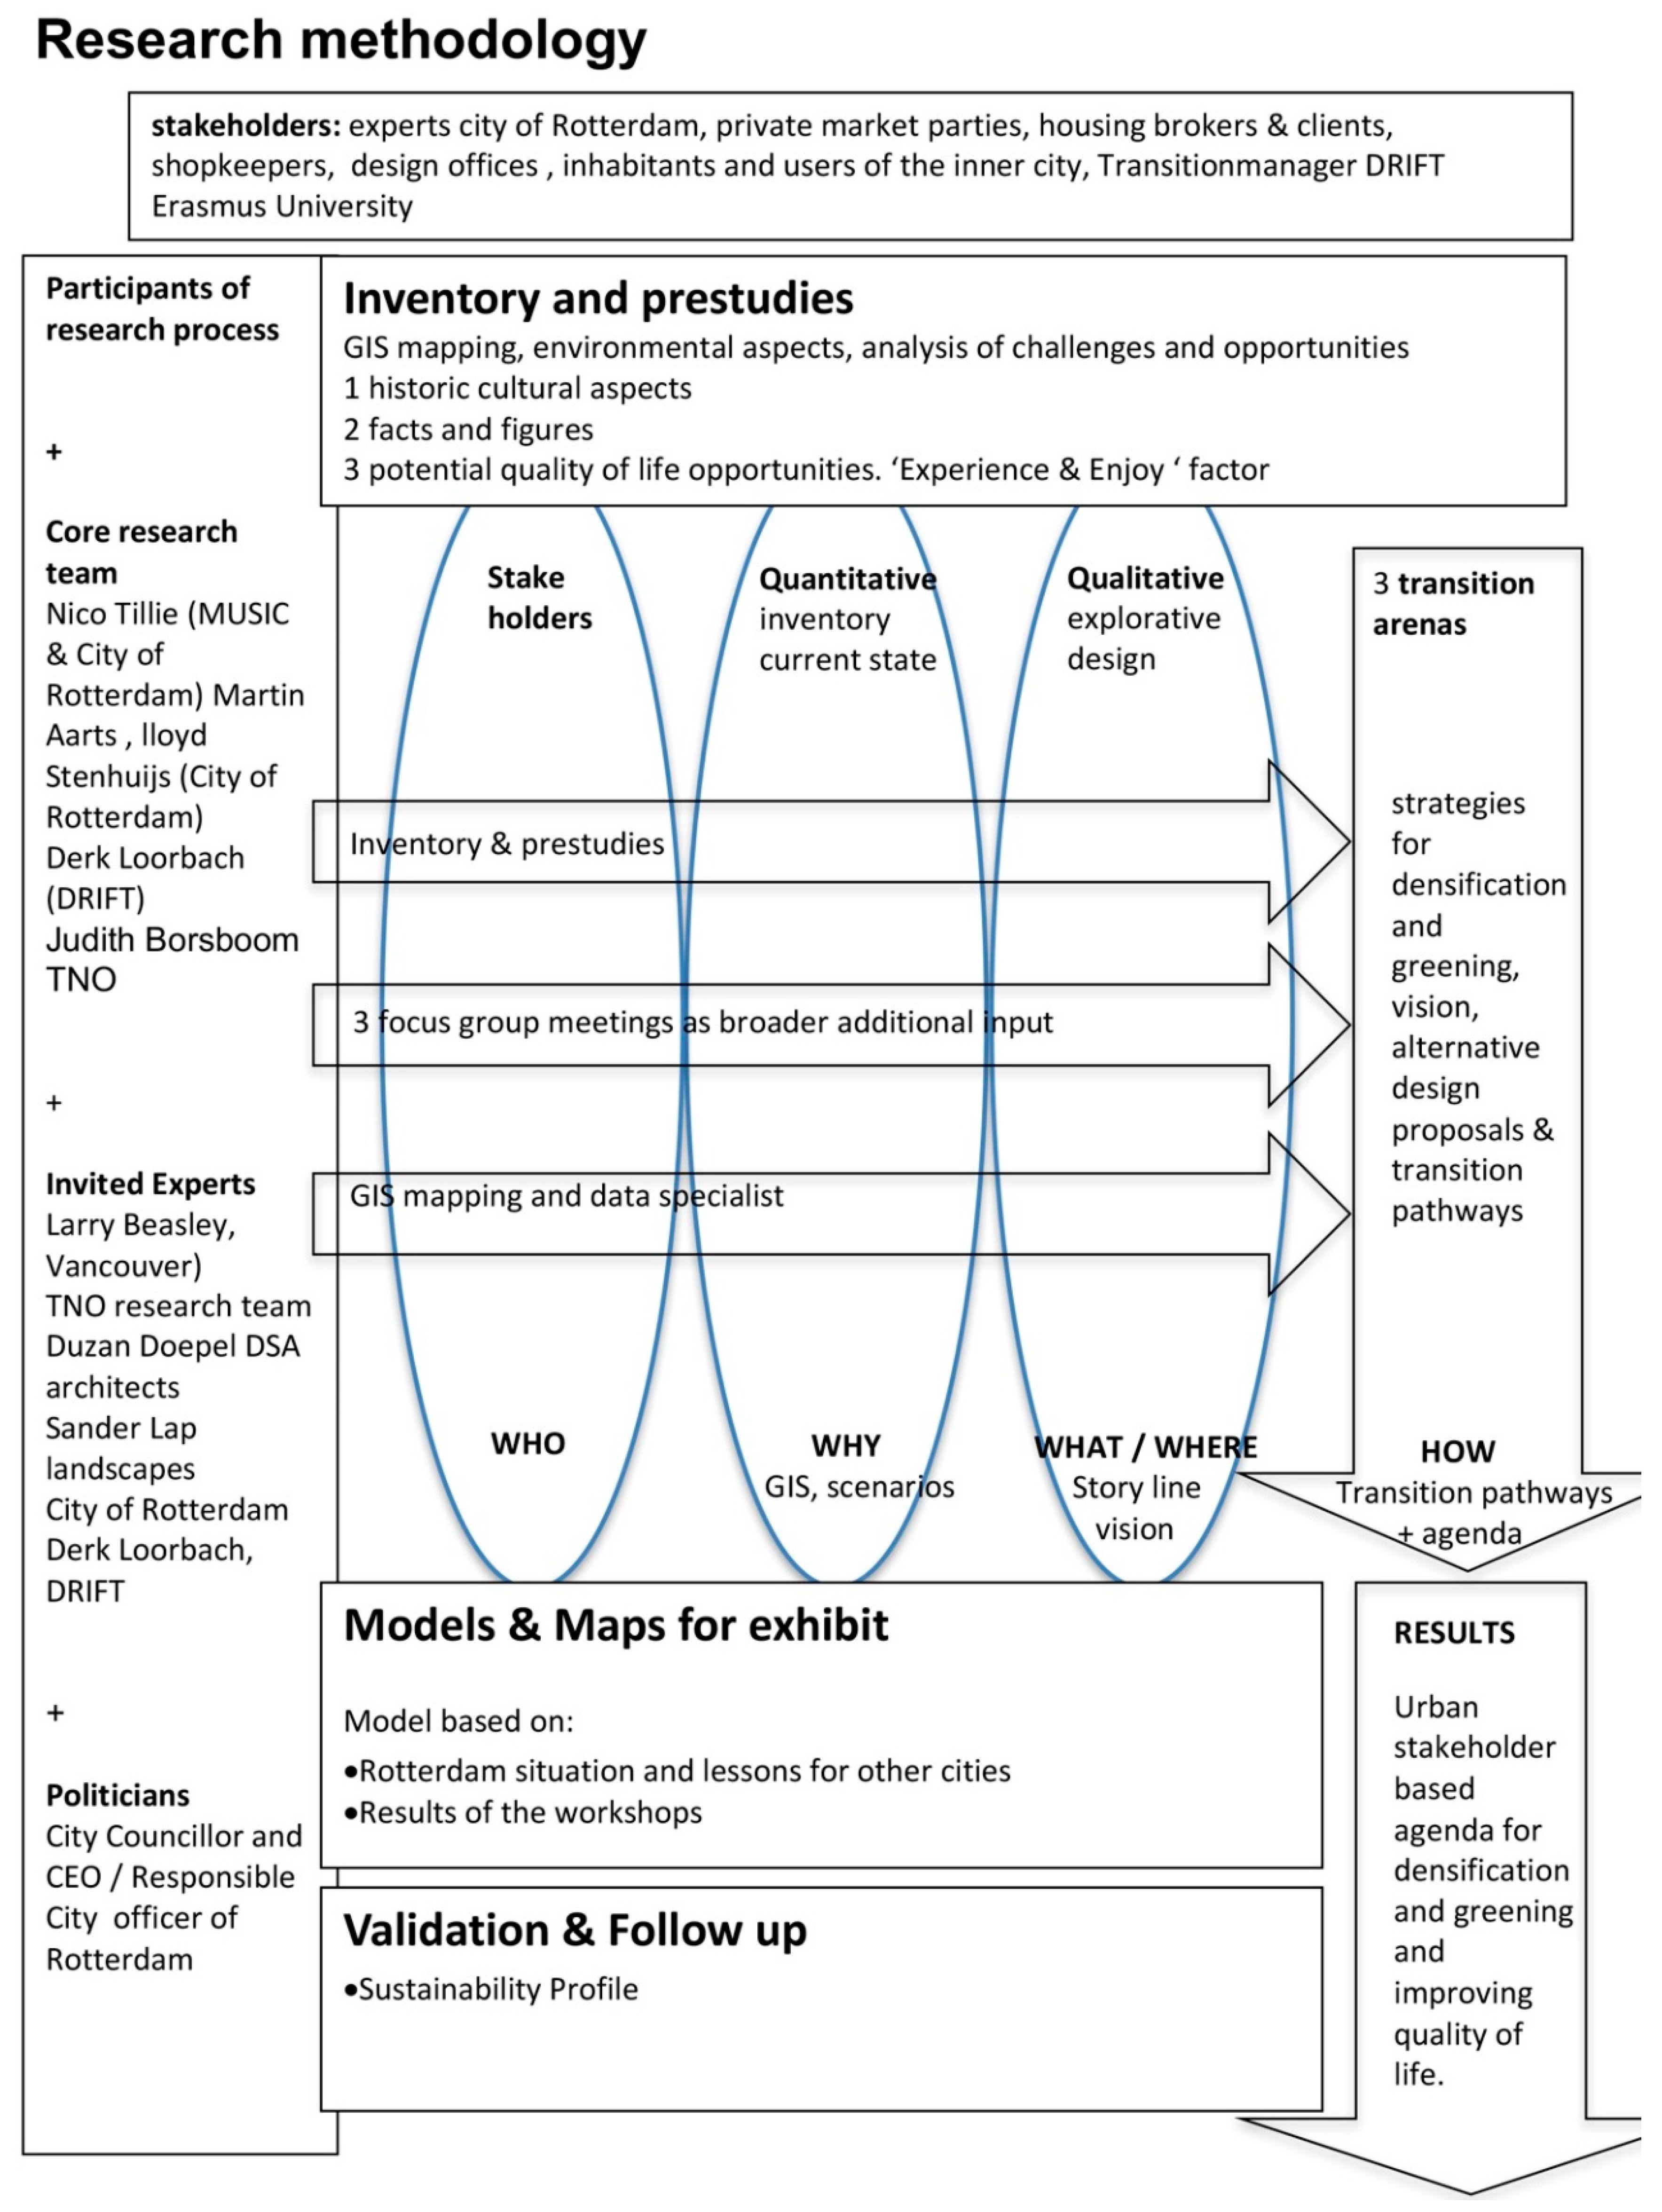
3.1. Focus Group Meetings and Transition Arena Objectives

The first focus group meeting was for framing challenges and exploring potential synergies with stakeholders. The launch of a research project was a stakeholder meeting to search for possibilities as well as requirements for densification of Rotterdam’s inner city. A common belief among the 20 stakeholders was the crucial role of the quality of life of the (future) inhabitants.
Furthermore, it was emphasised that creating attractive conditions for families is important, even if they only form a small percentage of the total number of inhabitants. It was expected that families would make up 20% of the inhabitants (after densification). Several architects presented their work. In addition to the existing high-rise strategy, what also emerged was that there are at least six alternative densification strategies to be distinguished for this group of enterprising inner-city inhabitants. A follow-up issue that arose from the stakeholder meeting, as former director of planning of the city of Vancouver, Larry Beasley described it, was to find out whether these bottom-up initiatives would also contribute significantly to the desired numbers as well as attractiveness of the inner city. To avoid the inner city becoming very “stony”, greening strategies were developed together with the densification strategies.
The City Councillor for urban development chaired the second focus group meeting with the ‘Van der Leeuwkring’, an organisation concerned with the quality of public space.
During the third meeting, the new ideas as well as existing and built plans were shared among each other to show a possible end goal.
After these focus group meetings, the transition arenas took place, during which a transition vision was created.
Table 1 shows an overview of the different topics addressed. Figure 4, shows the proposition or vision for densification and greening. In this long-term vision, densification and greening strategies are defined.

3.2. Densification and Synergies

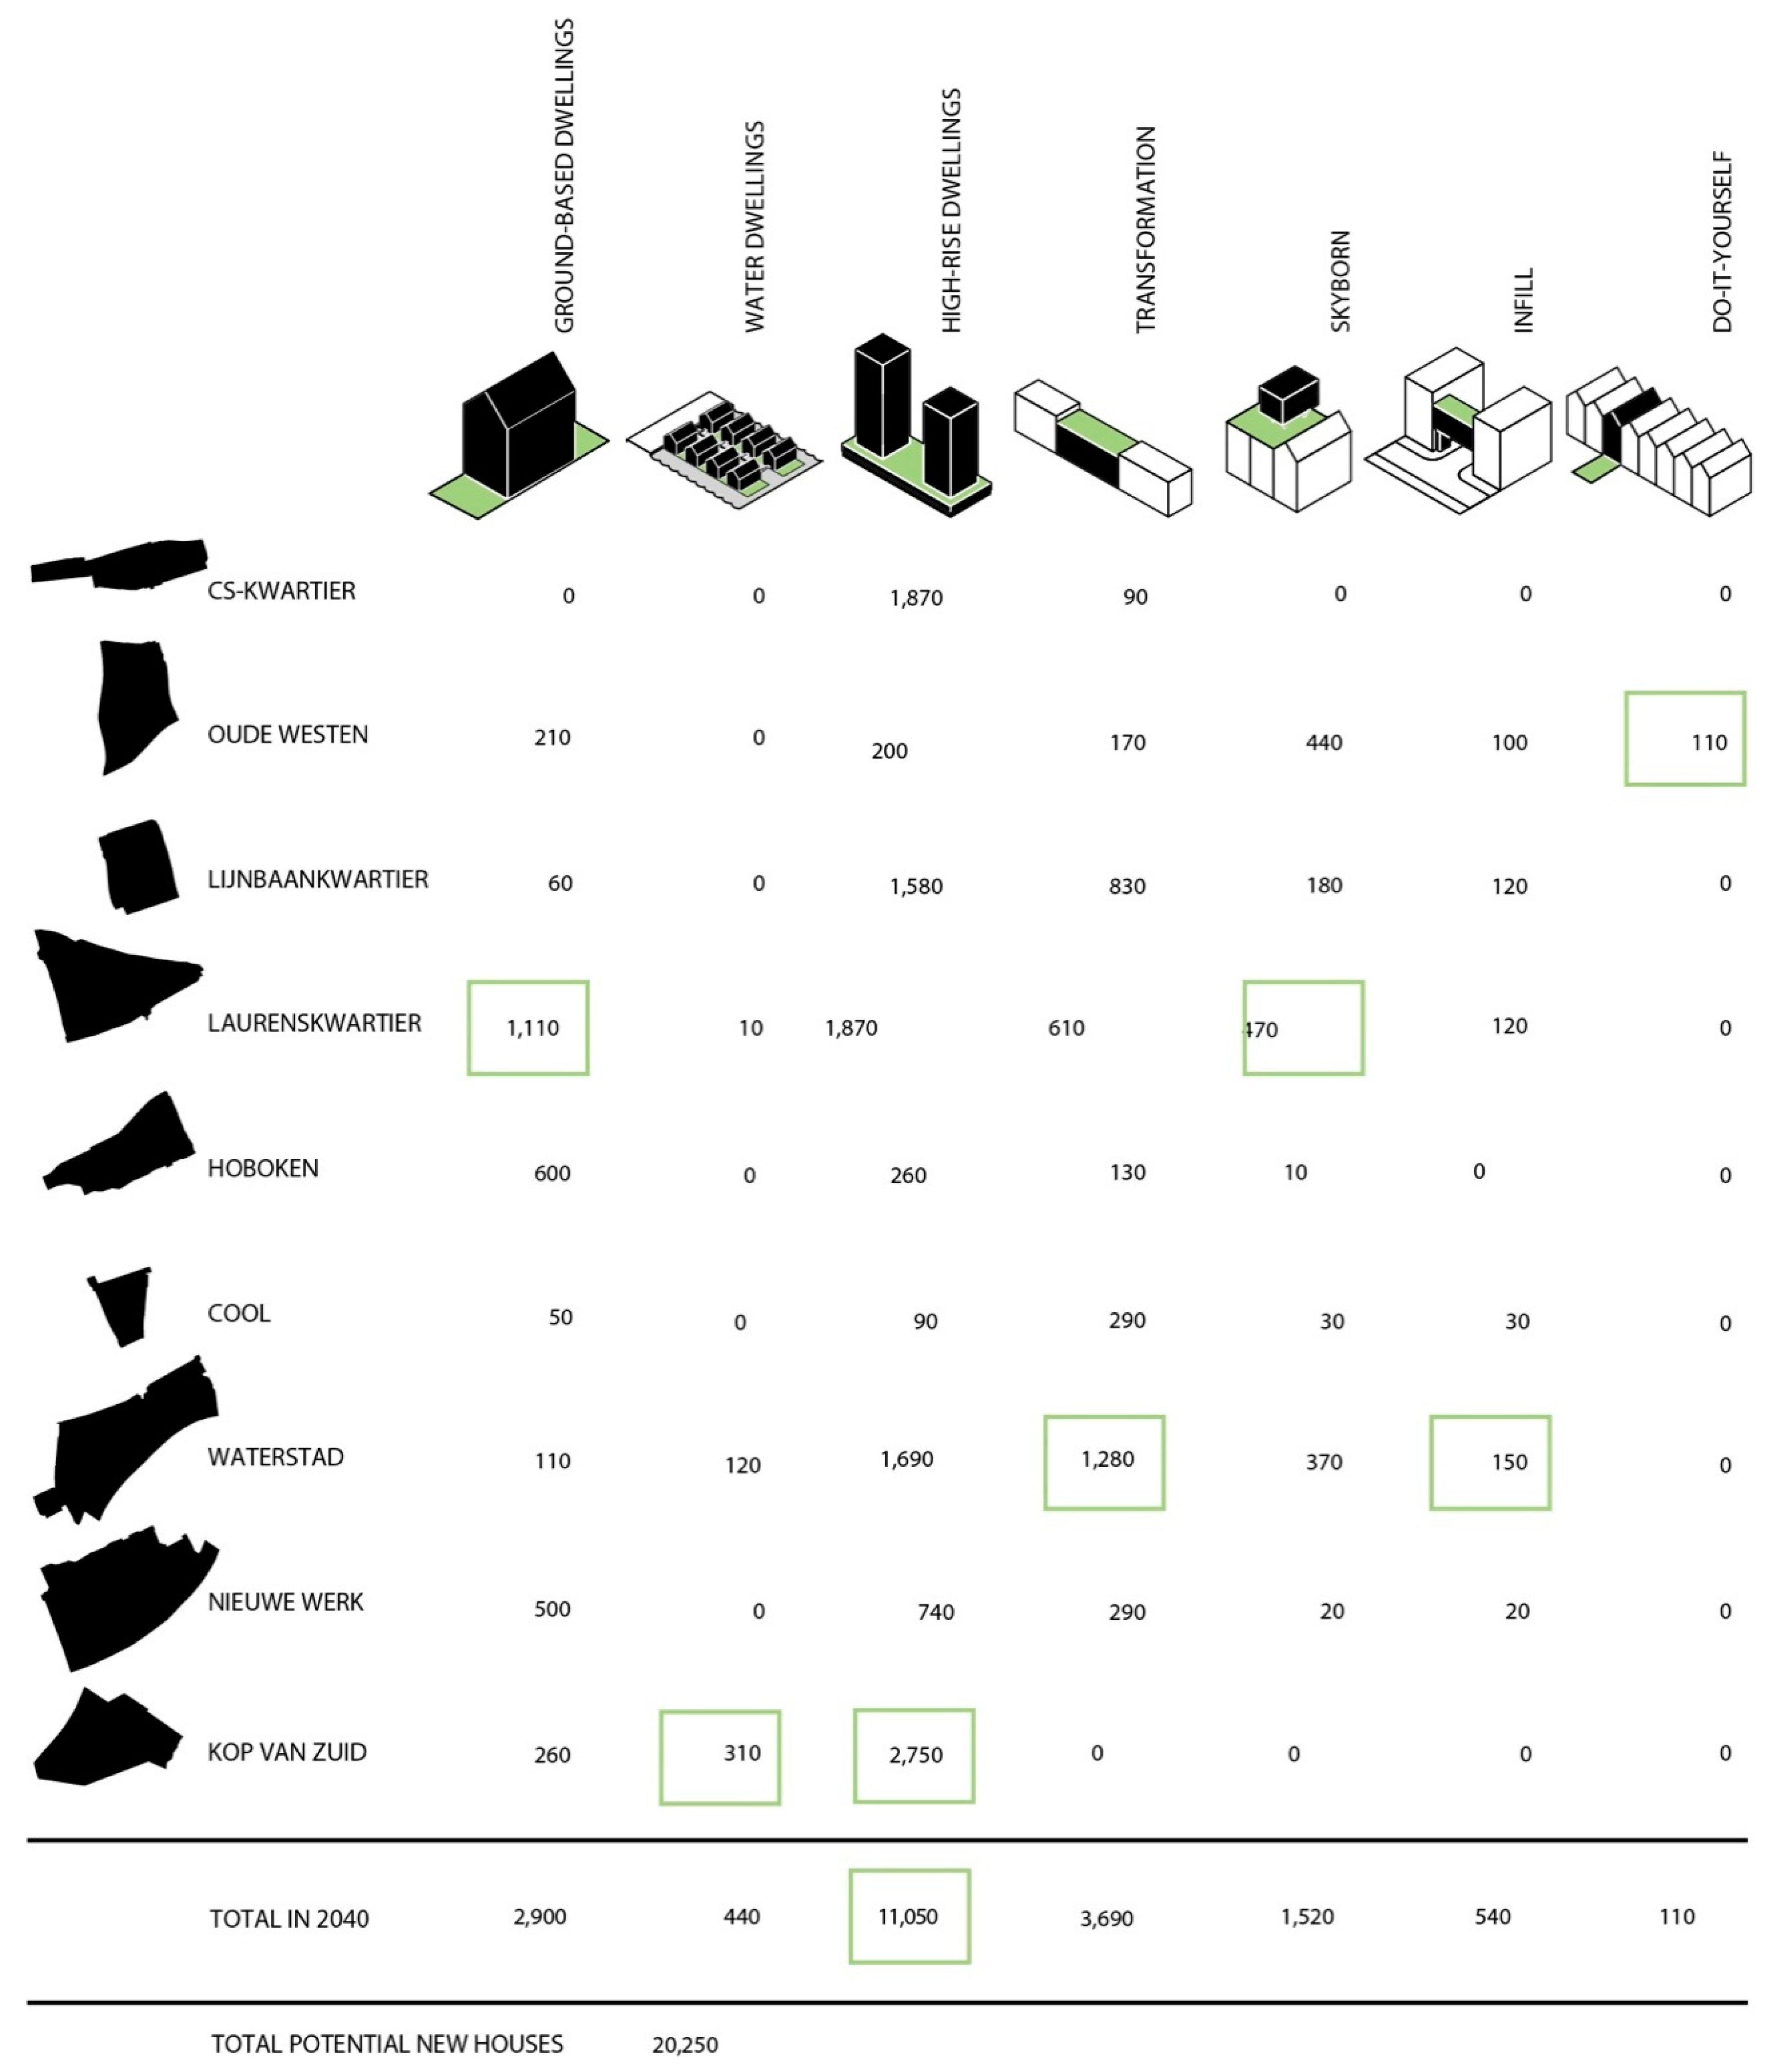
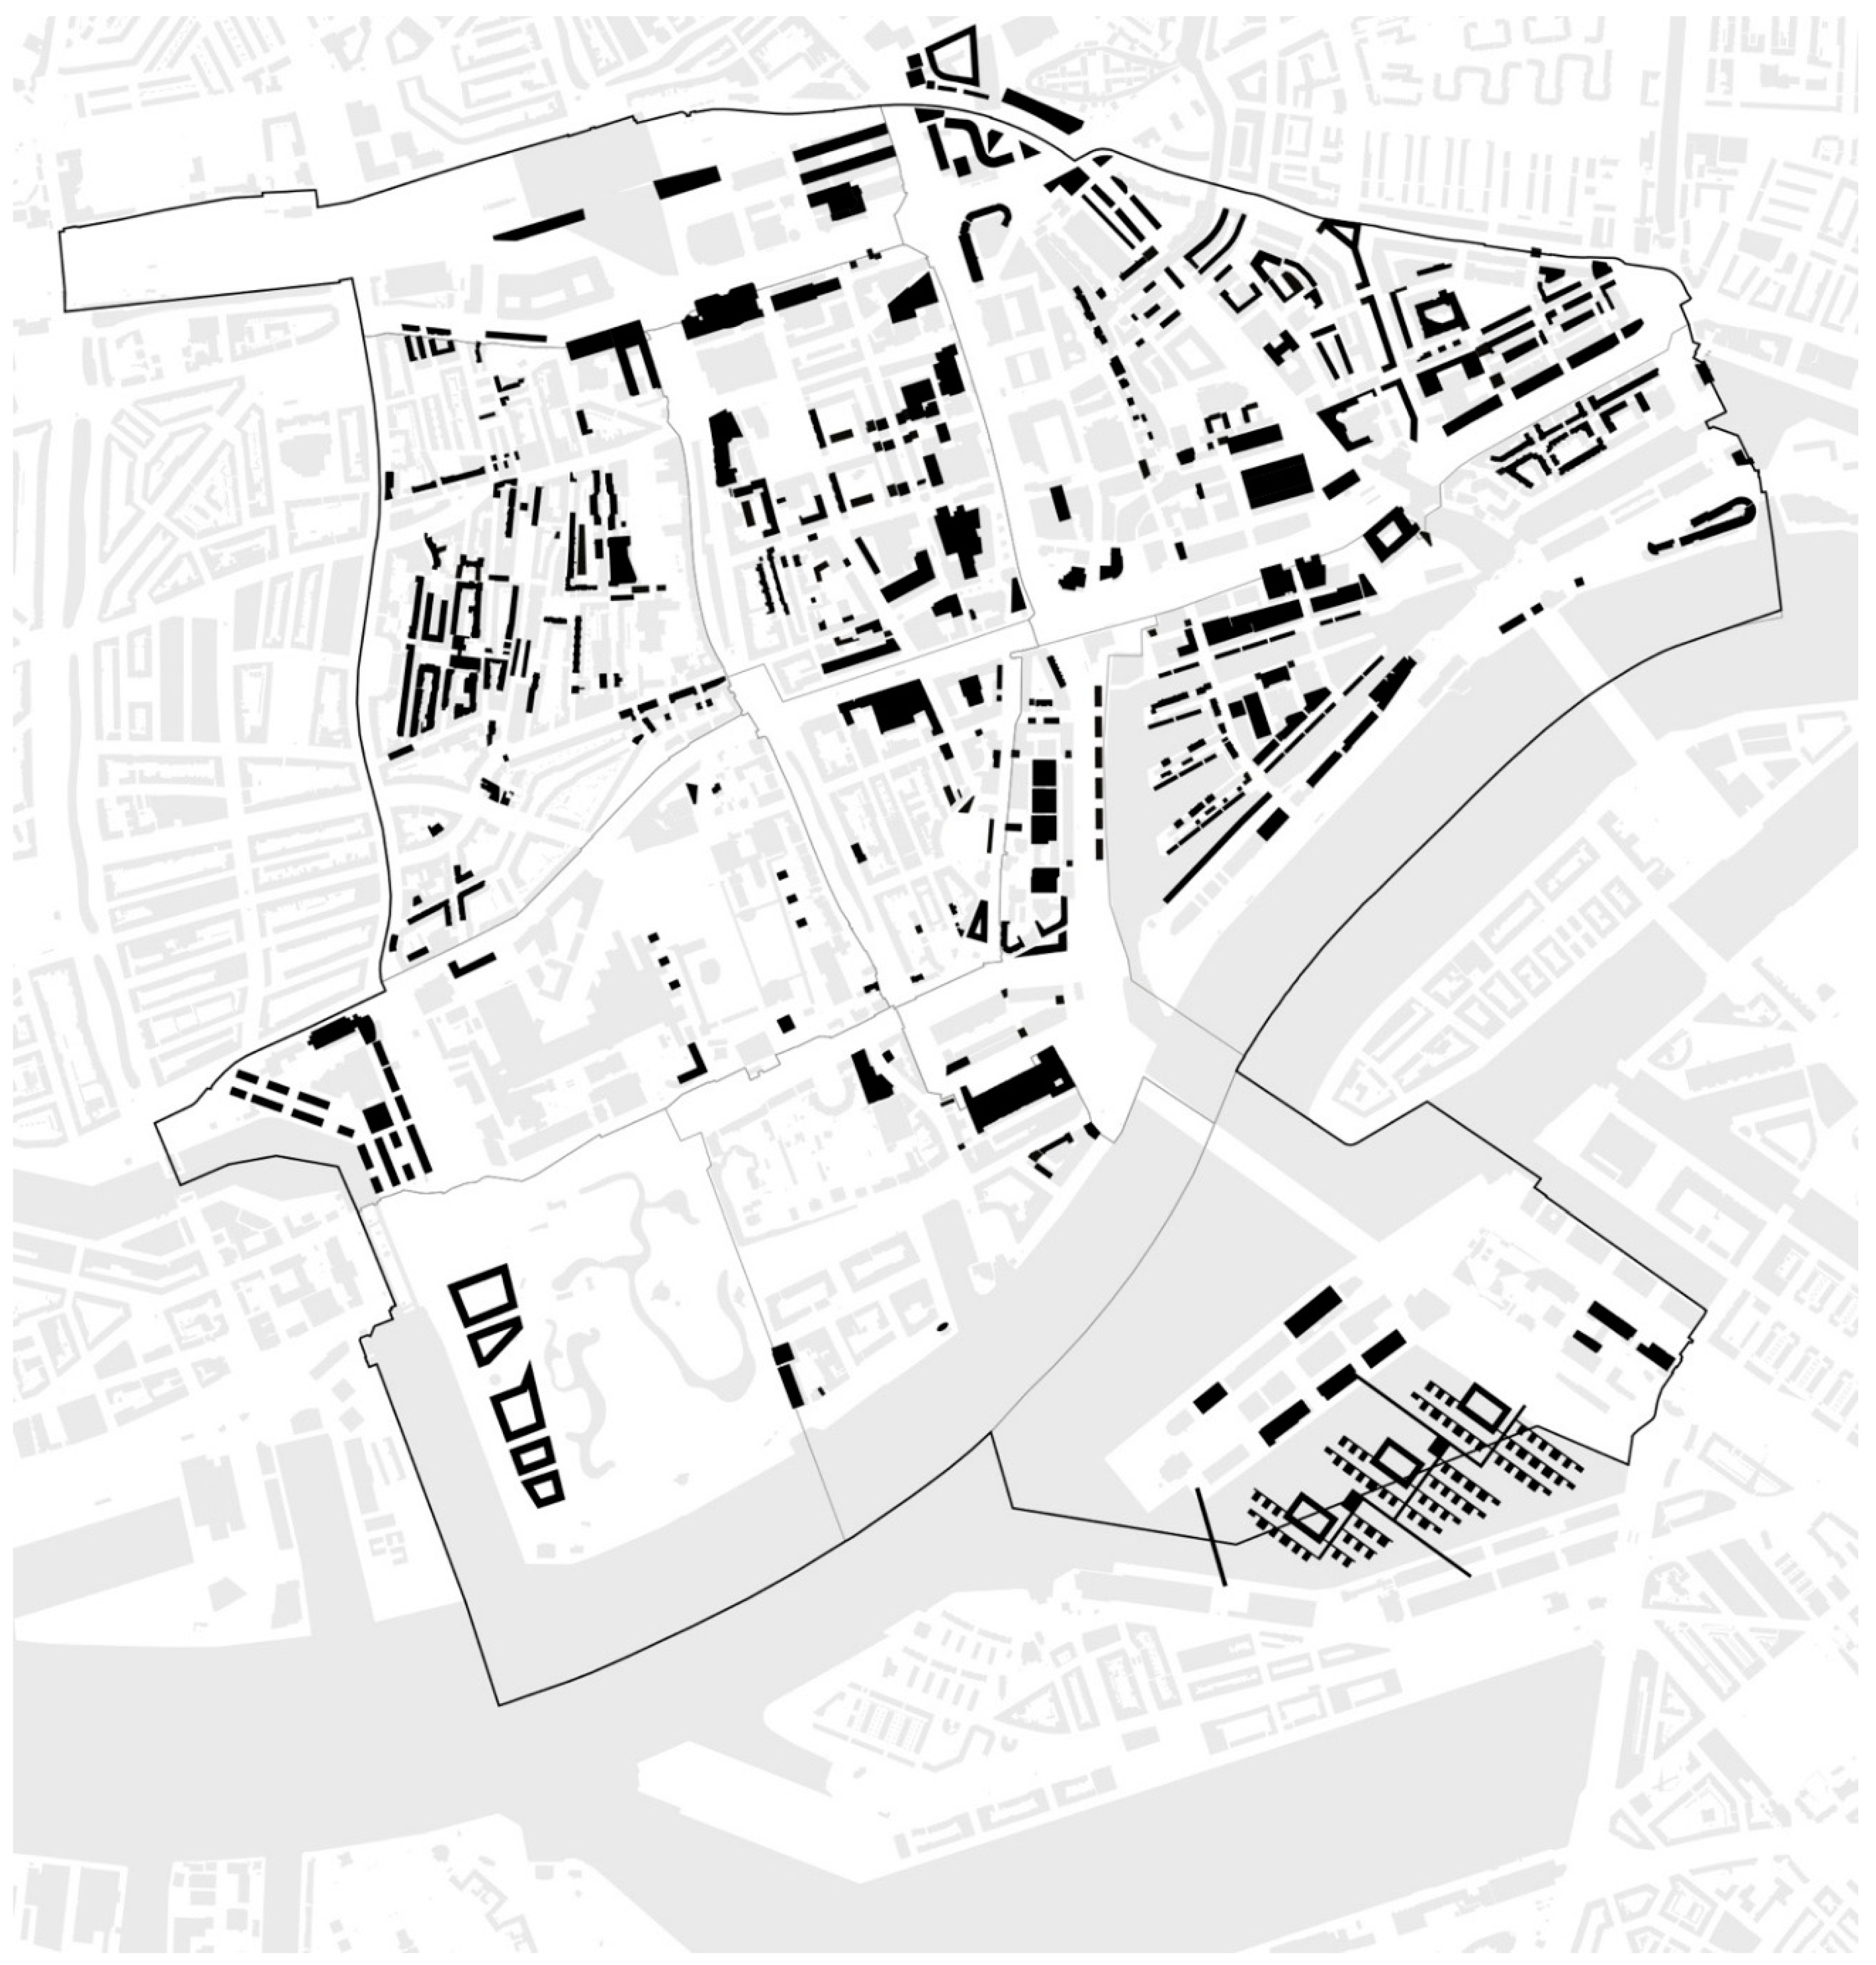
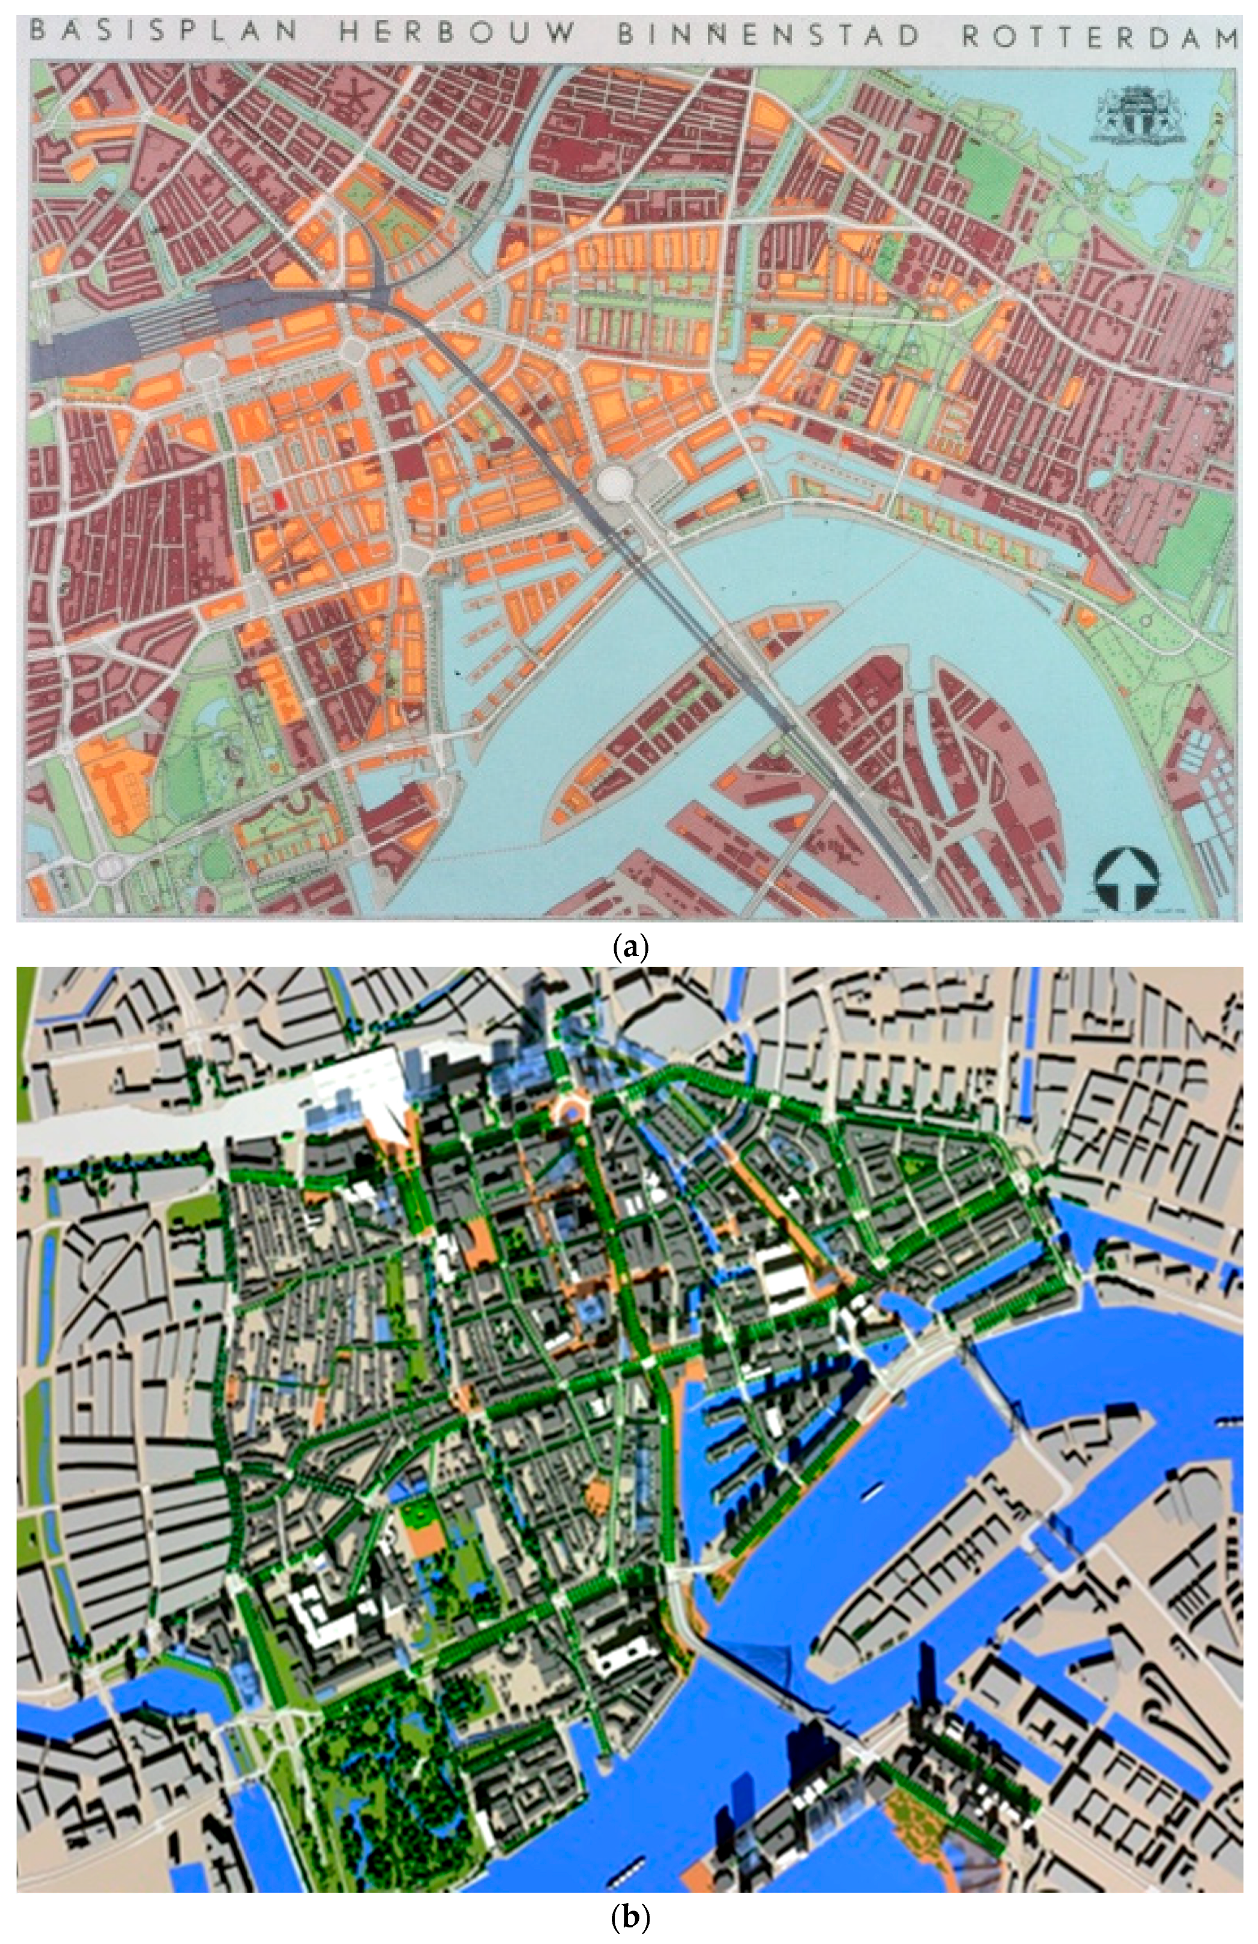
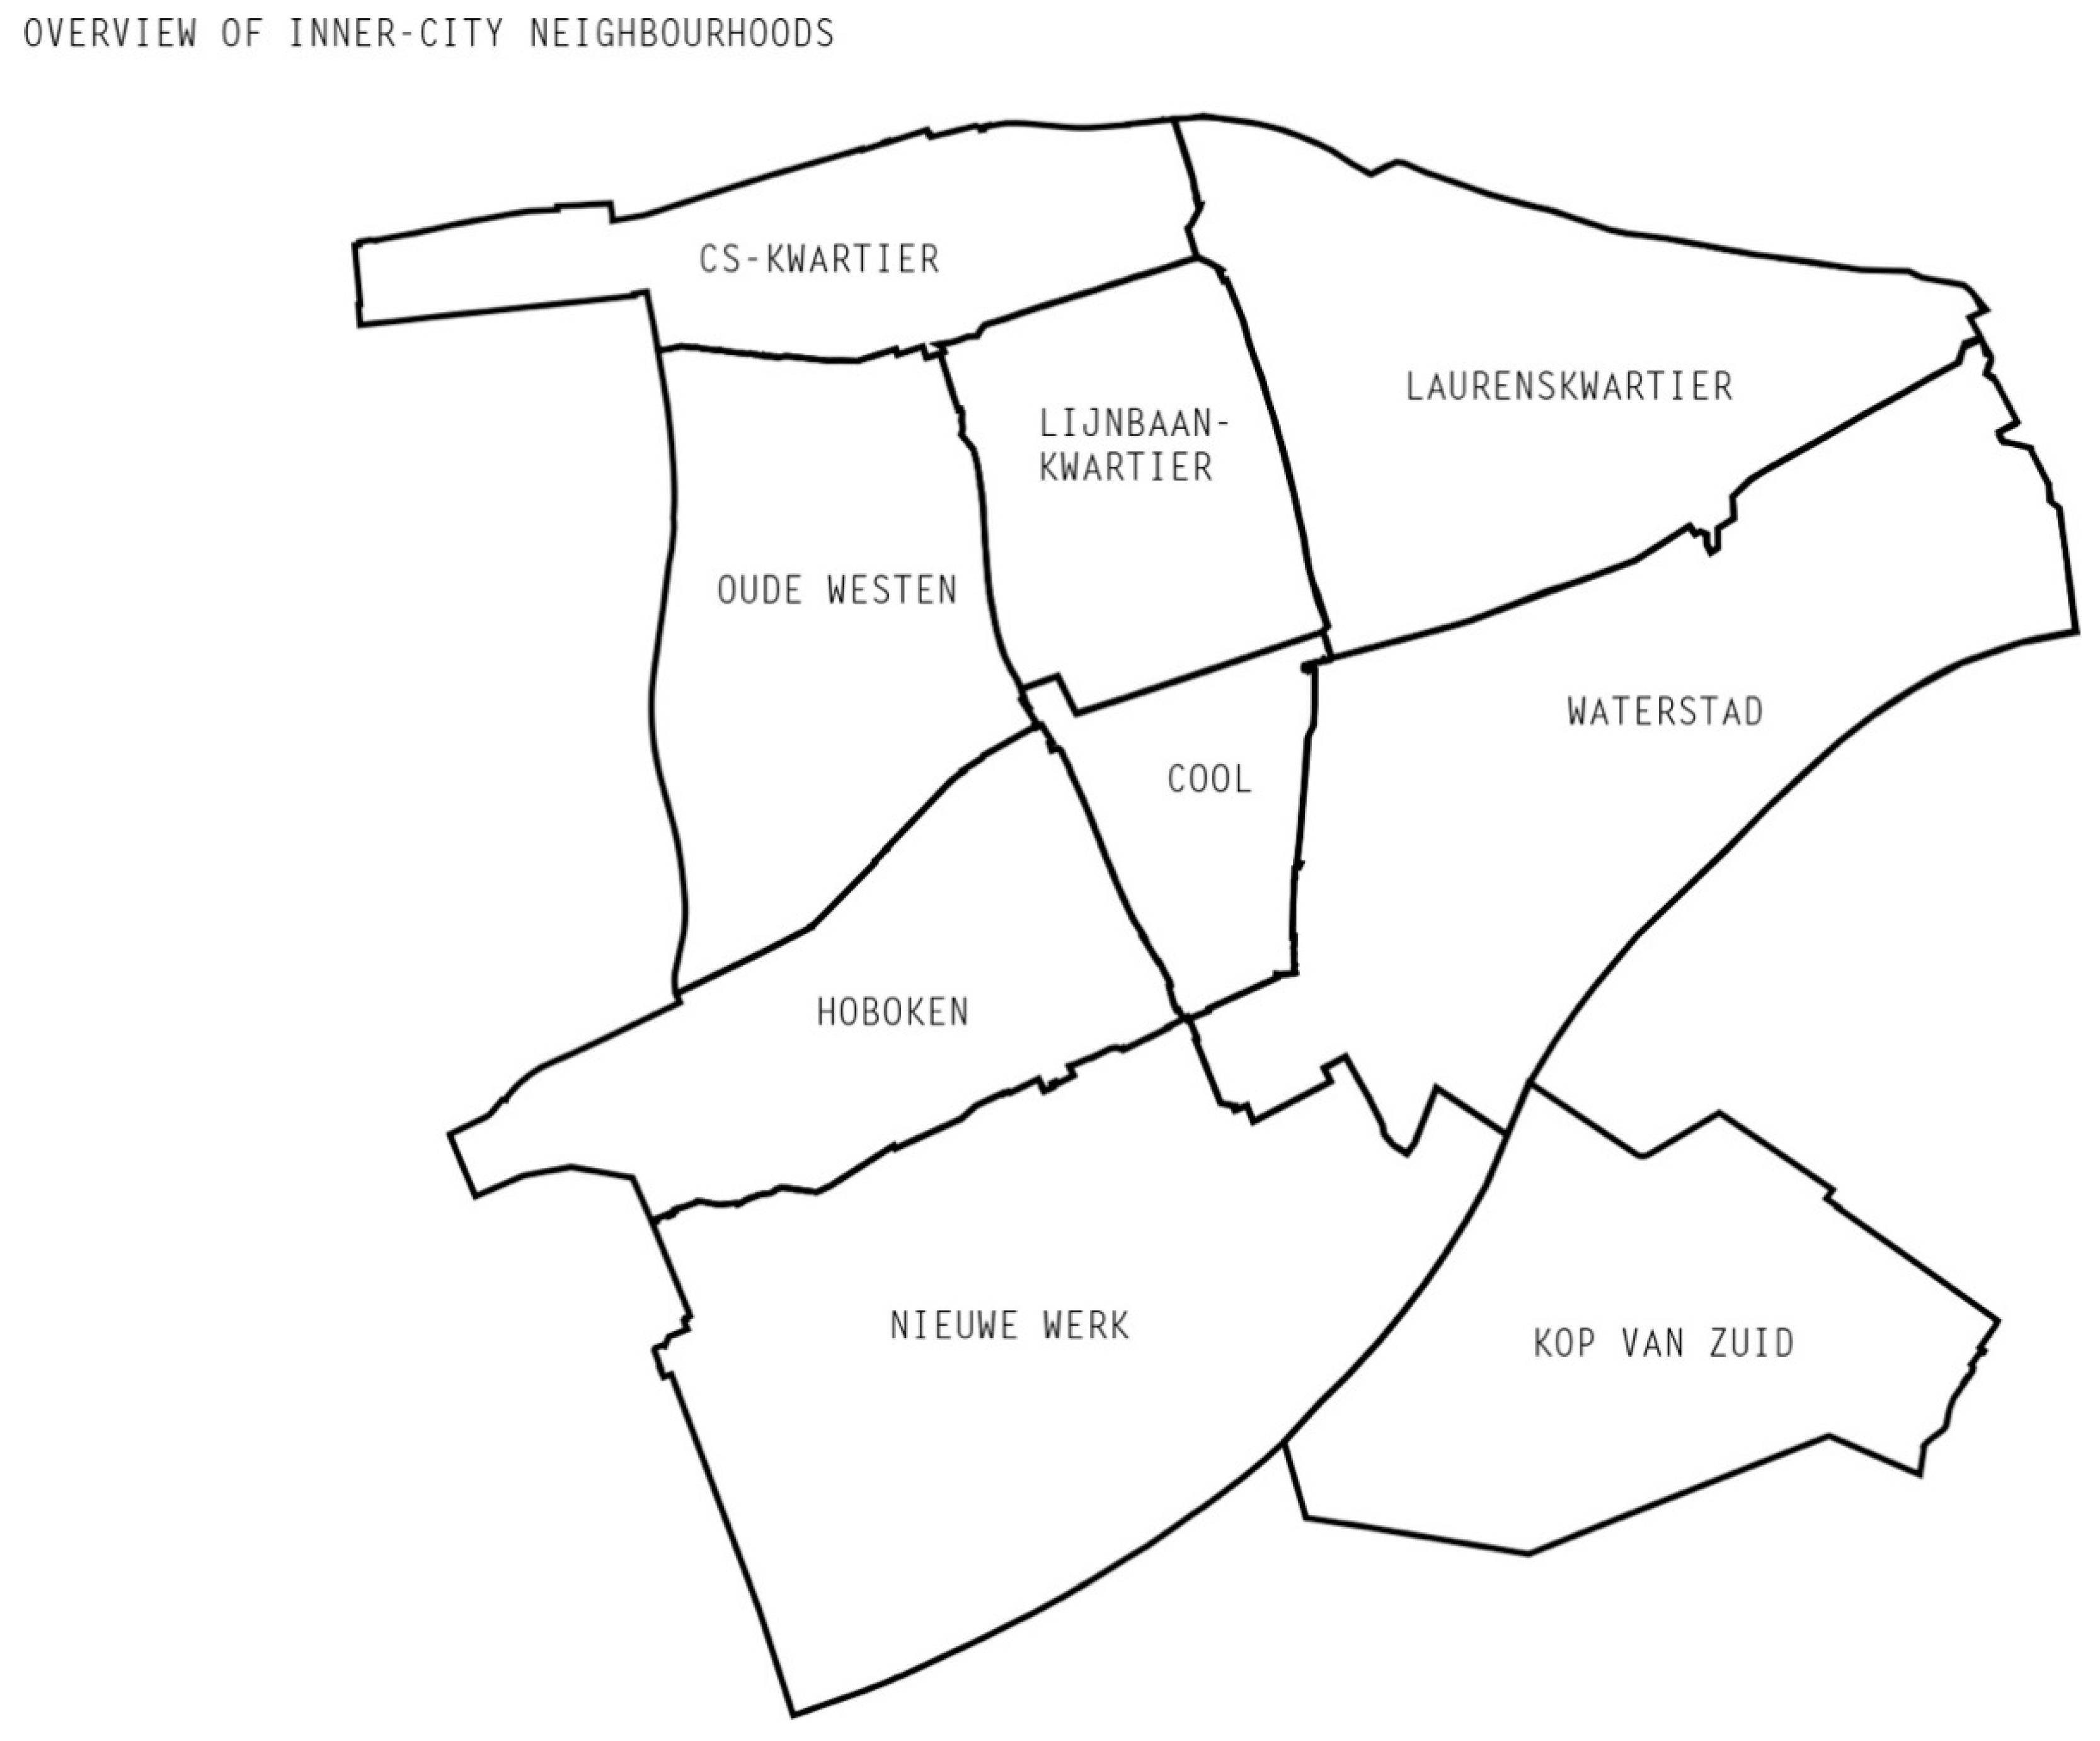
For this research, seven densification strategies, which were identified during the stakeholder sessions, have been explored in terms of their spatial potentials. The ambition of this exploration is not to generate a master plan for densification of the nine neighbourhoods in the inner city (Figure 5); rather, the intention is to demonstrate that there is more available space in the inner city than one may think, and that, in theory, doubling the number of inner-city inhabitants is spatially realistic without diminishing the existing quality of life. To use realistic data for this research on densification, housing typologies characteristic for certain areas in Rotterdam were used. People tend to live were other people of their own peer group live. An example is that people with children want to live where already other people with children are living [24]. So, the strategy was to start with successful areas which were already present. Below in Figure 6, the densification strategies are listed in a matrix. For each strategy, the number of potential units are listed per neighbourhood in the inner city district.

3.2.1. Ground-Based Dwellings

Access at ground level makes street-facing, ground-based housing particularly attractive, not only because it contributes to the individual dwelling, but also since it increases the liveability of a neighbourhood. Undeveloped plots of land and large public outdoor spaces are useful for this form of densification. A garden and access at street level is what makes this densification strategy particularly attractive for families.

3.2.2. Water Dwellings

There are two sites that form natural, potential locations for water-based housing: the old and the former harbours. Not hindered by zoning of land and existing building lines, a multitude of different dwelling types are possible: quay blocks at the interface of city and water, jetty dwellings, pole houses, and floating housing make optimal use of this dynamic environment.

3.2.3. High-Rise Dwellings

The potential for high-rise dwellings can be realised where regulations and ground conditions allow for it. This should be fully in line with the Rotterdam skyline strategy. These dwellings are situated in the most urbanised areas (high-rise zones), the inhabitants of such dwellings benefit from the proximity of amenities. At ground level, the human scale of the building is important and should be carefully designed. In Rotterdam, the term ‘groundscraper’ was introduced to plan for a good relation between buildings and public space.
Transformations of the inner city’s offices were mapped by Zandbelt and van den Berg. There are a lot of short- and long-term term vacancies all over the city, with a concentration in the post-war office areas. As housing is less sensitive to economic conditions, a mix of dwellings with offices could provide a more stable backbone for an attractive inner city.
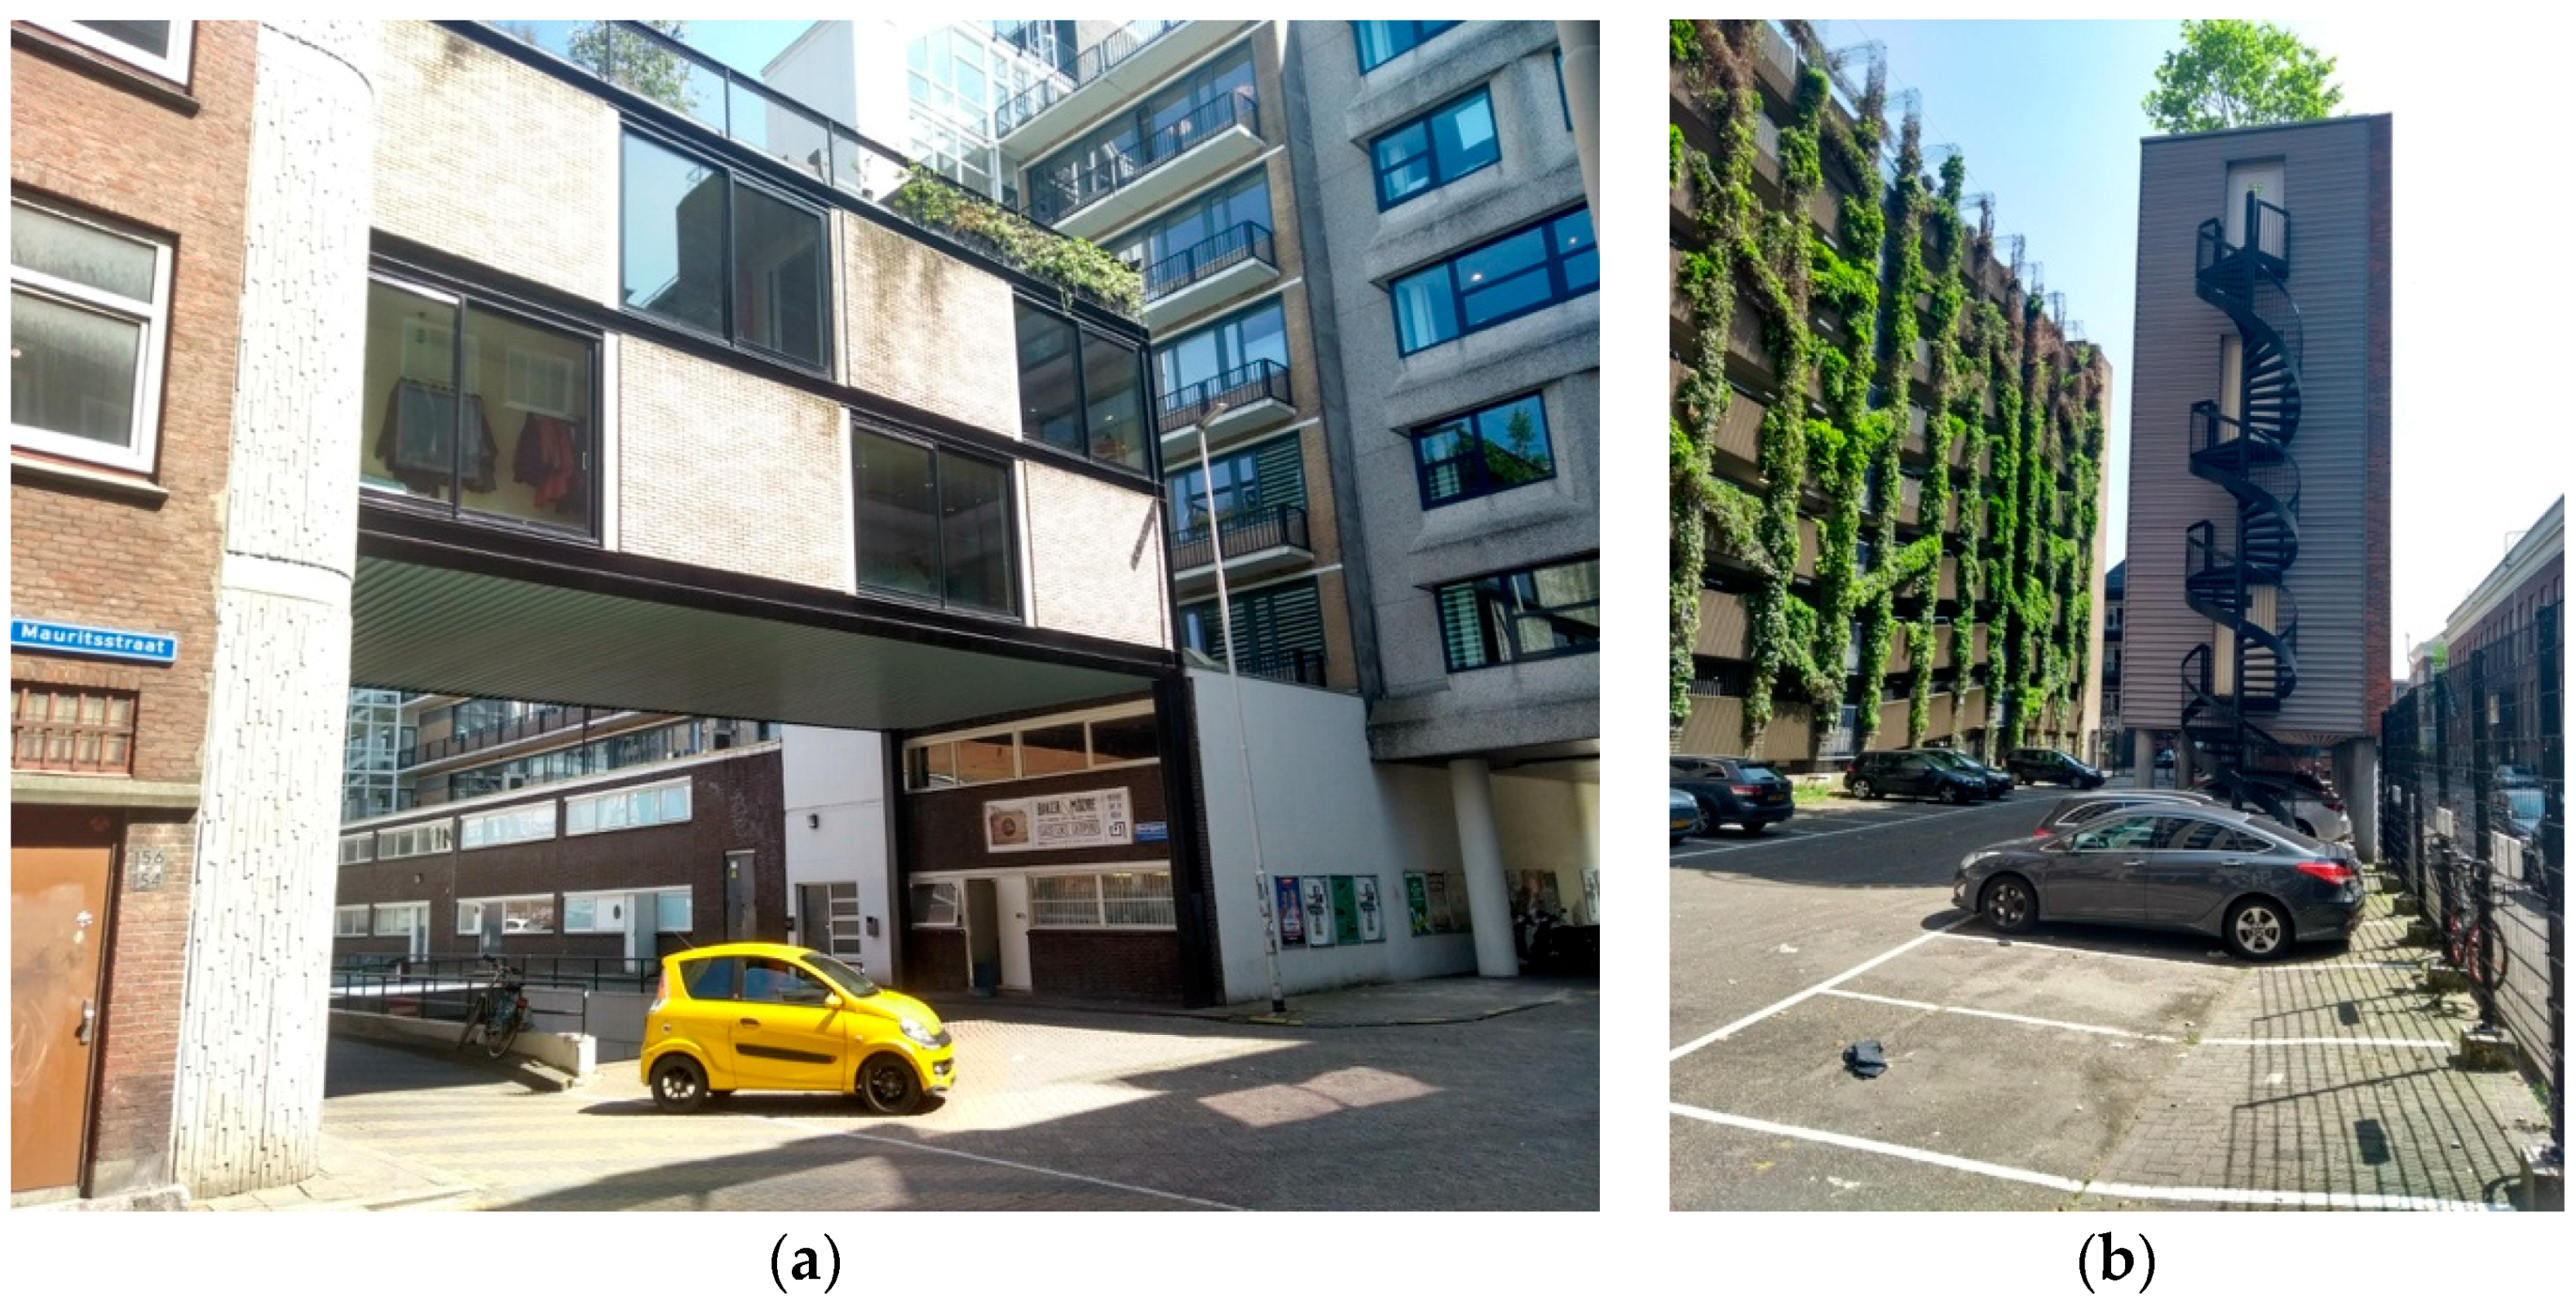
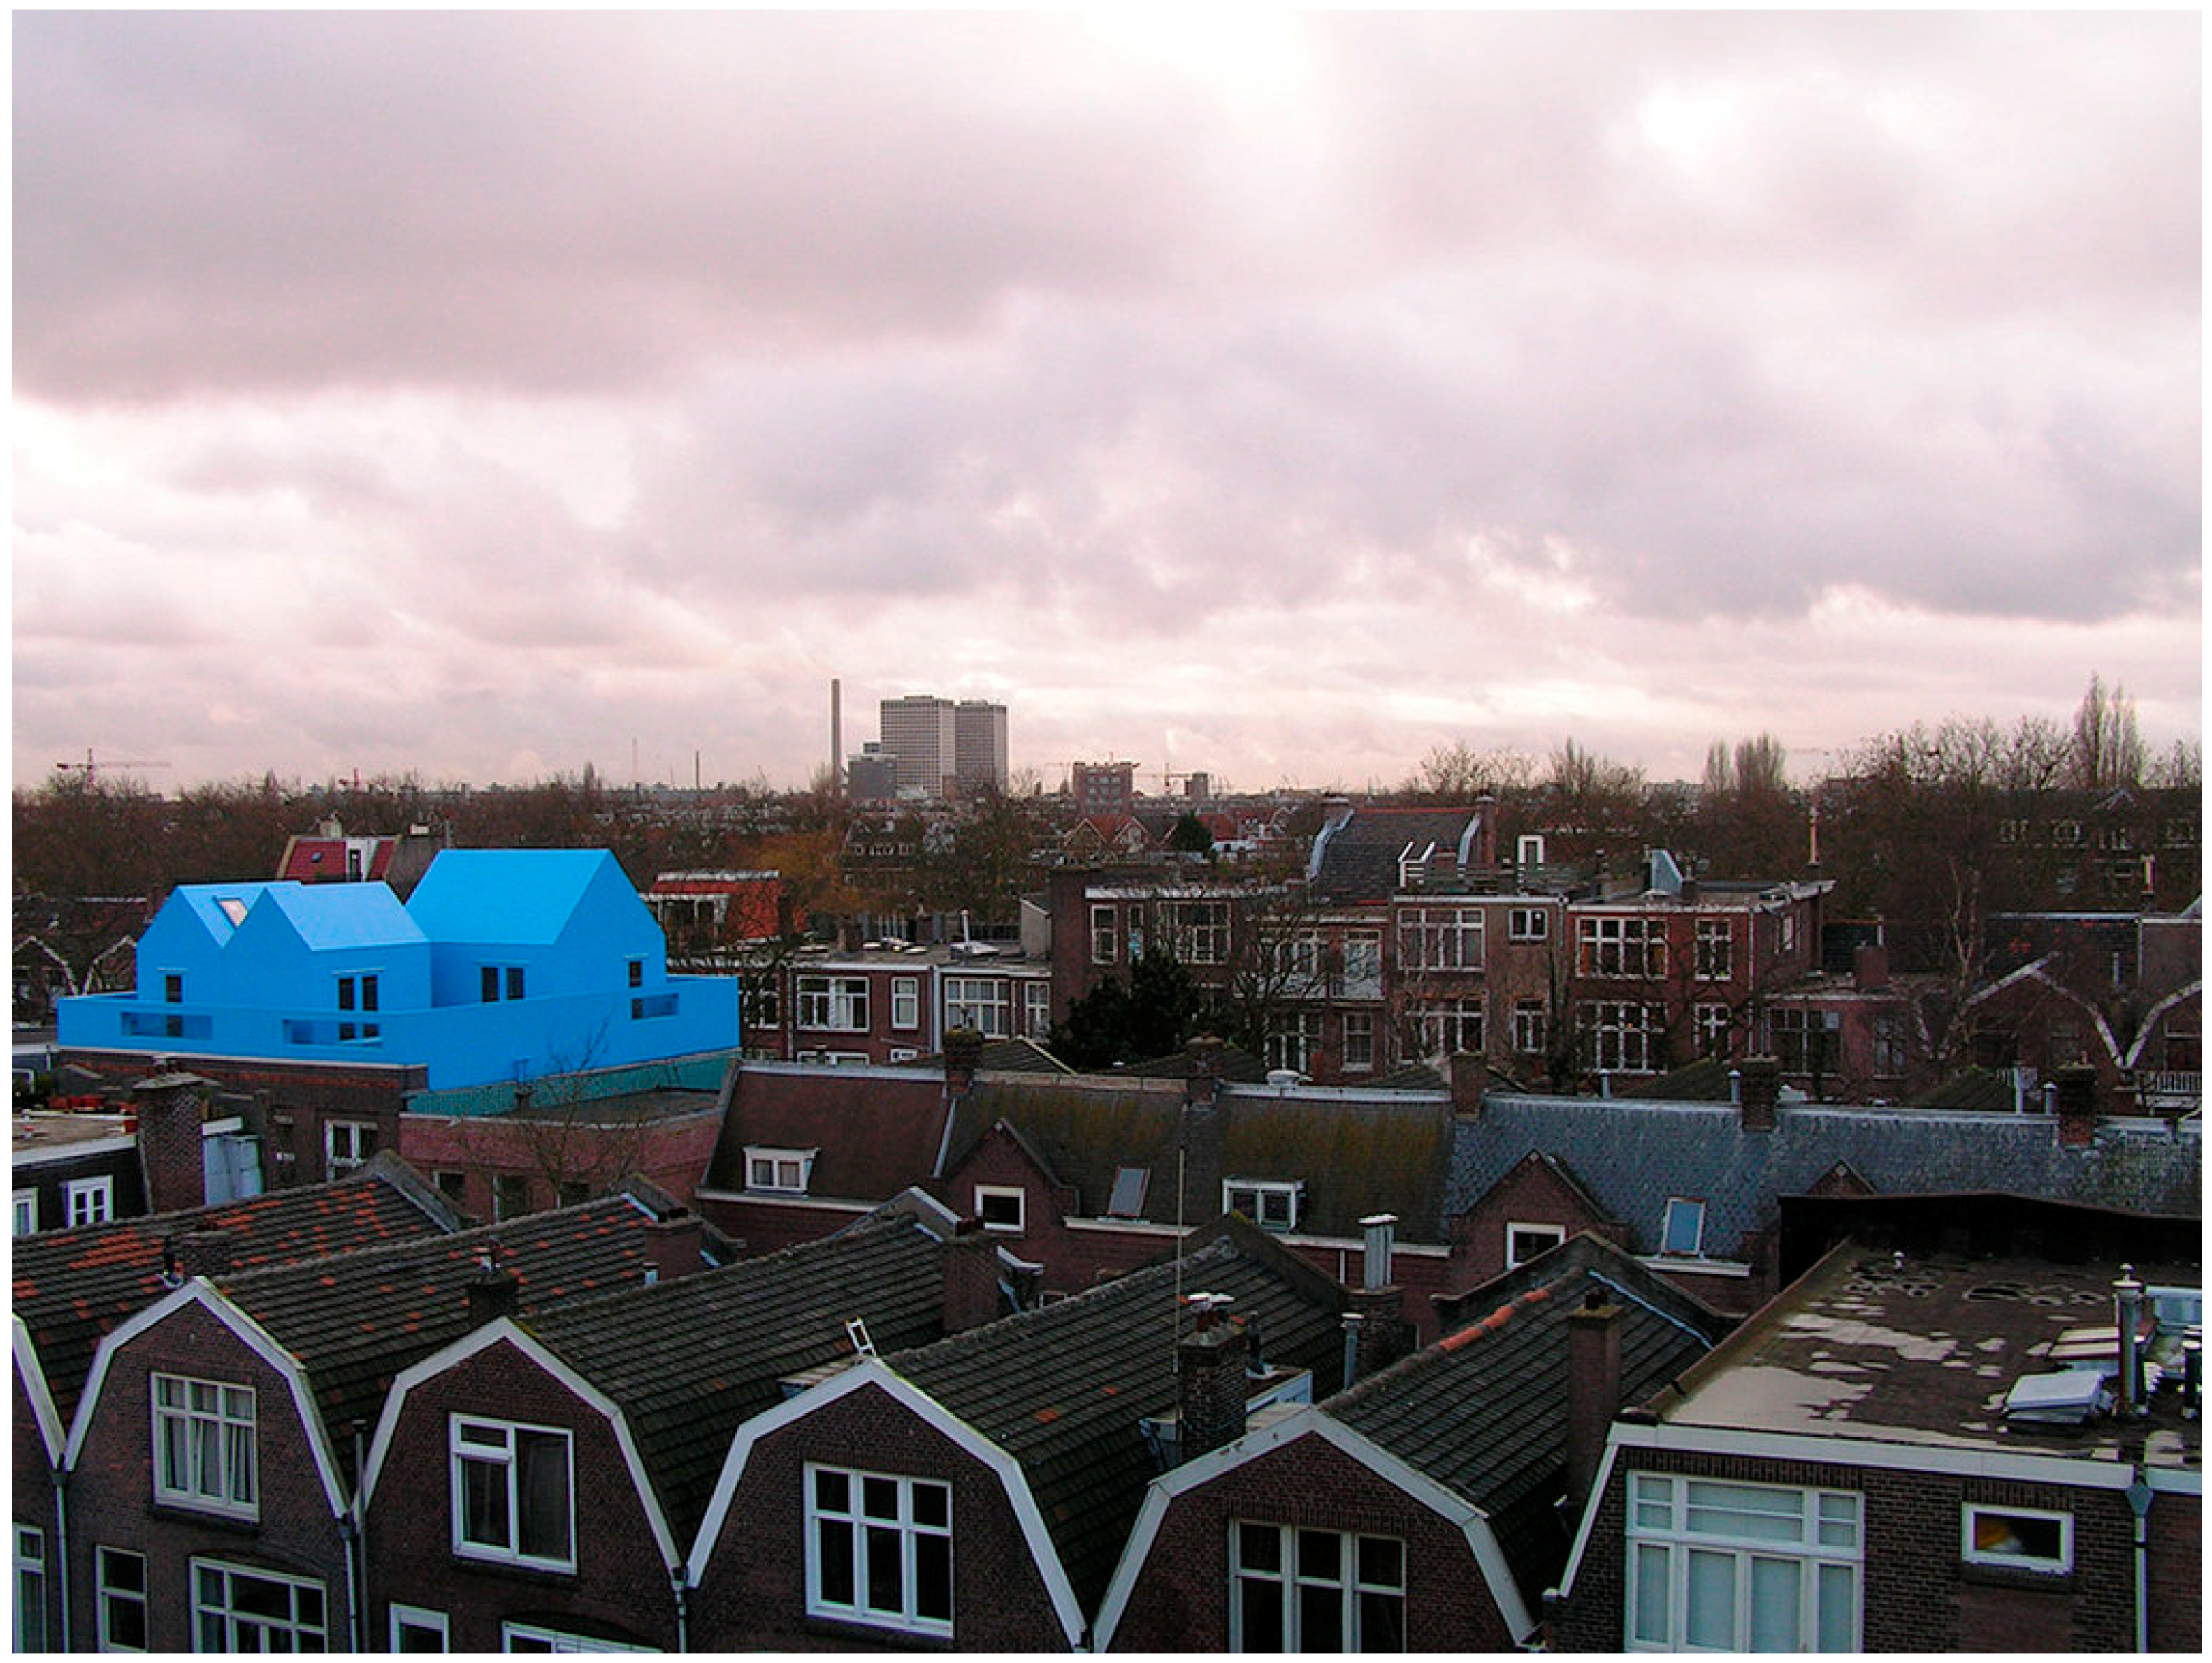
3.2.4. Skyborn

This is a strategy where existing buildings with a solid construction are suitable for densification by “topping-up” (Figure 7). This is mostly done with houses built after 1950, as they have a concrete or steel structure and flat roofs. The skyborn densification strategy optimally exploits the proximity of urban amenities and green infrastructure. Since new dwellings need to adapt to existing substructures, this strategy encompasses a large diversity of building typologies: from roof villages with a communal character, to individual penthouses. Collective green outdoor space can be created at roof level, with additional private outdoor areas in the form of large balconies or patios. In time, the green roofs, sloping buildings, and bridges will create a new layer in the city.

3.2.5. Infill

Infill housing is fit in with great precision (Figure 8). Gaps above narrow delivery streets, undeveloped plots of land, and large courtyards can be filled in with dwellings that cross the street like a bridge. Especially around the so-called ’WWII Fire Boundary’, where the border between old and new city is most apparent, infill is a valuable strategy. In doing so, the identity of the urban fabric can be strengthened, increasing the diversity and attractiveness of a neighbourhood.

3.2.6. Do-It-Yourself (DIY)

DIY-housing is part of the nineteenth century housing stock with their characteristic facades. These houses appeal to a large group of buyers. Often in a poor state of repair, and way too small to meet current spatial demands, houses of this type can be adapted to suit the lifestyles of young professionals and families. This best practice is now also used in other cities and old apartment blocks. Sometimes it is not about densification in terms of square metres, but rather about the adaptation of building blocks to house more inhabitants. In other areas of the city, housing associations or developers ensure that the foundations are stable and the roof is watertight, while the new home owners are responsible for an interior structure that suits their individual lifestyle. These dwellings are extremely suitable for young families.
In Figure 9, a mapped overview is given of all the densification strategies discussed.

3.3. Greening and Synergies

The city’s wish to attract more inhabitants and visitors to its city centre will only work if the city offers a pleasant living environment that develops along with the densification. The public realm plays an important role in this. Research has shown that an attractive public realm, one in which green amenities are the essence, is an important prerequisite for city life, in terms of day-to-day living and for the work and leisure environment [25]. The more attractive this public realm, the more people would like to spend time there. In this research hypothesis, 5000 new trees should be added and along with other green covering will cover a total area of 150 football pitches (90 ha).
The Municipality of Rotterdam [26,
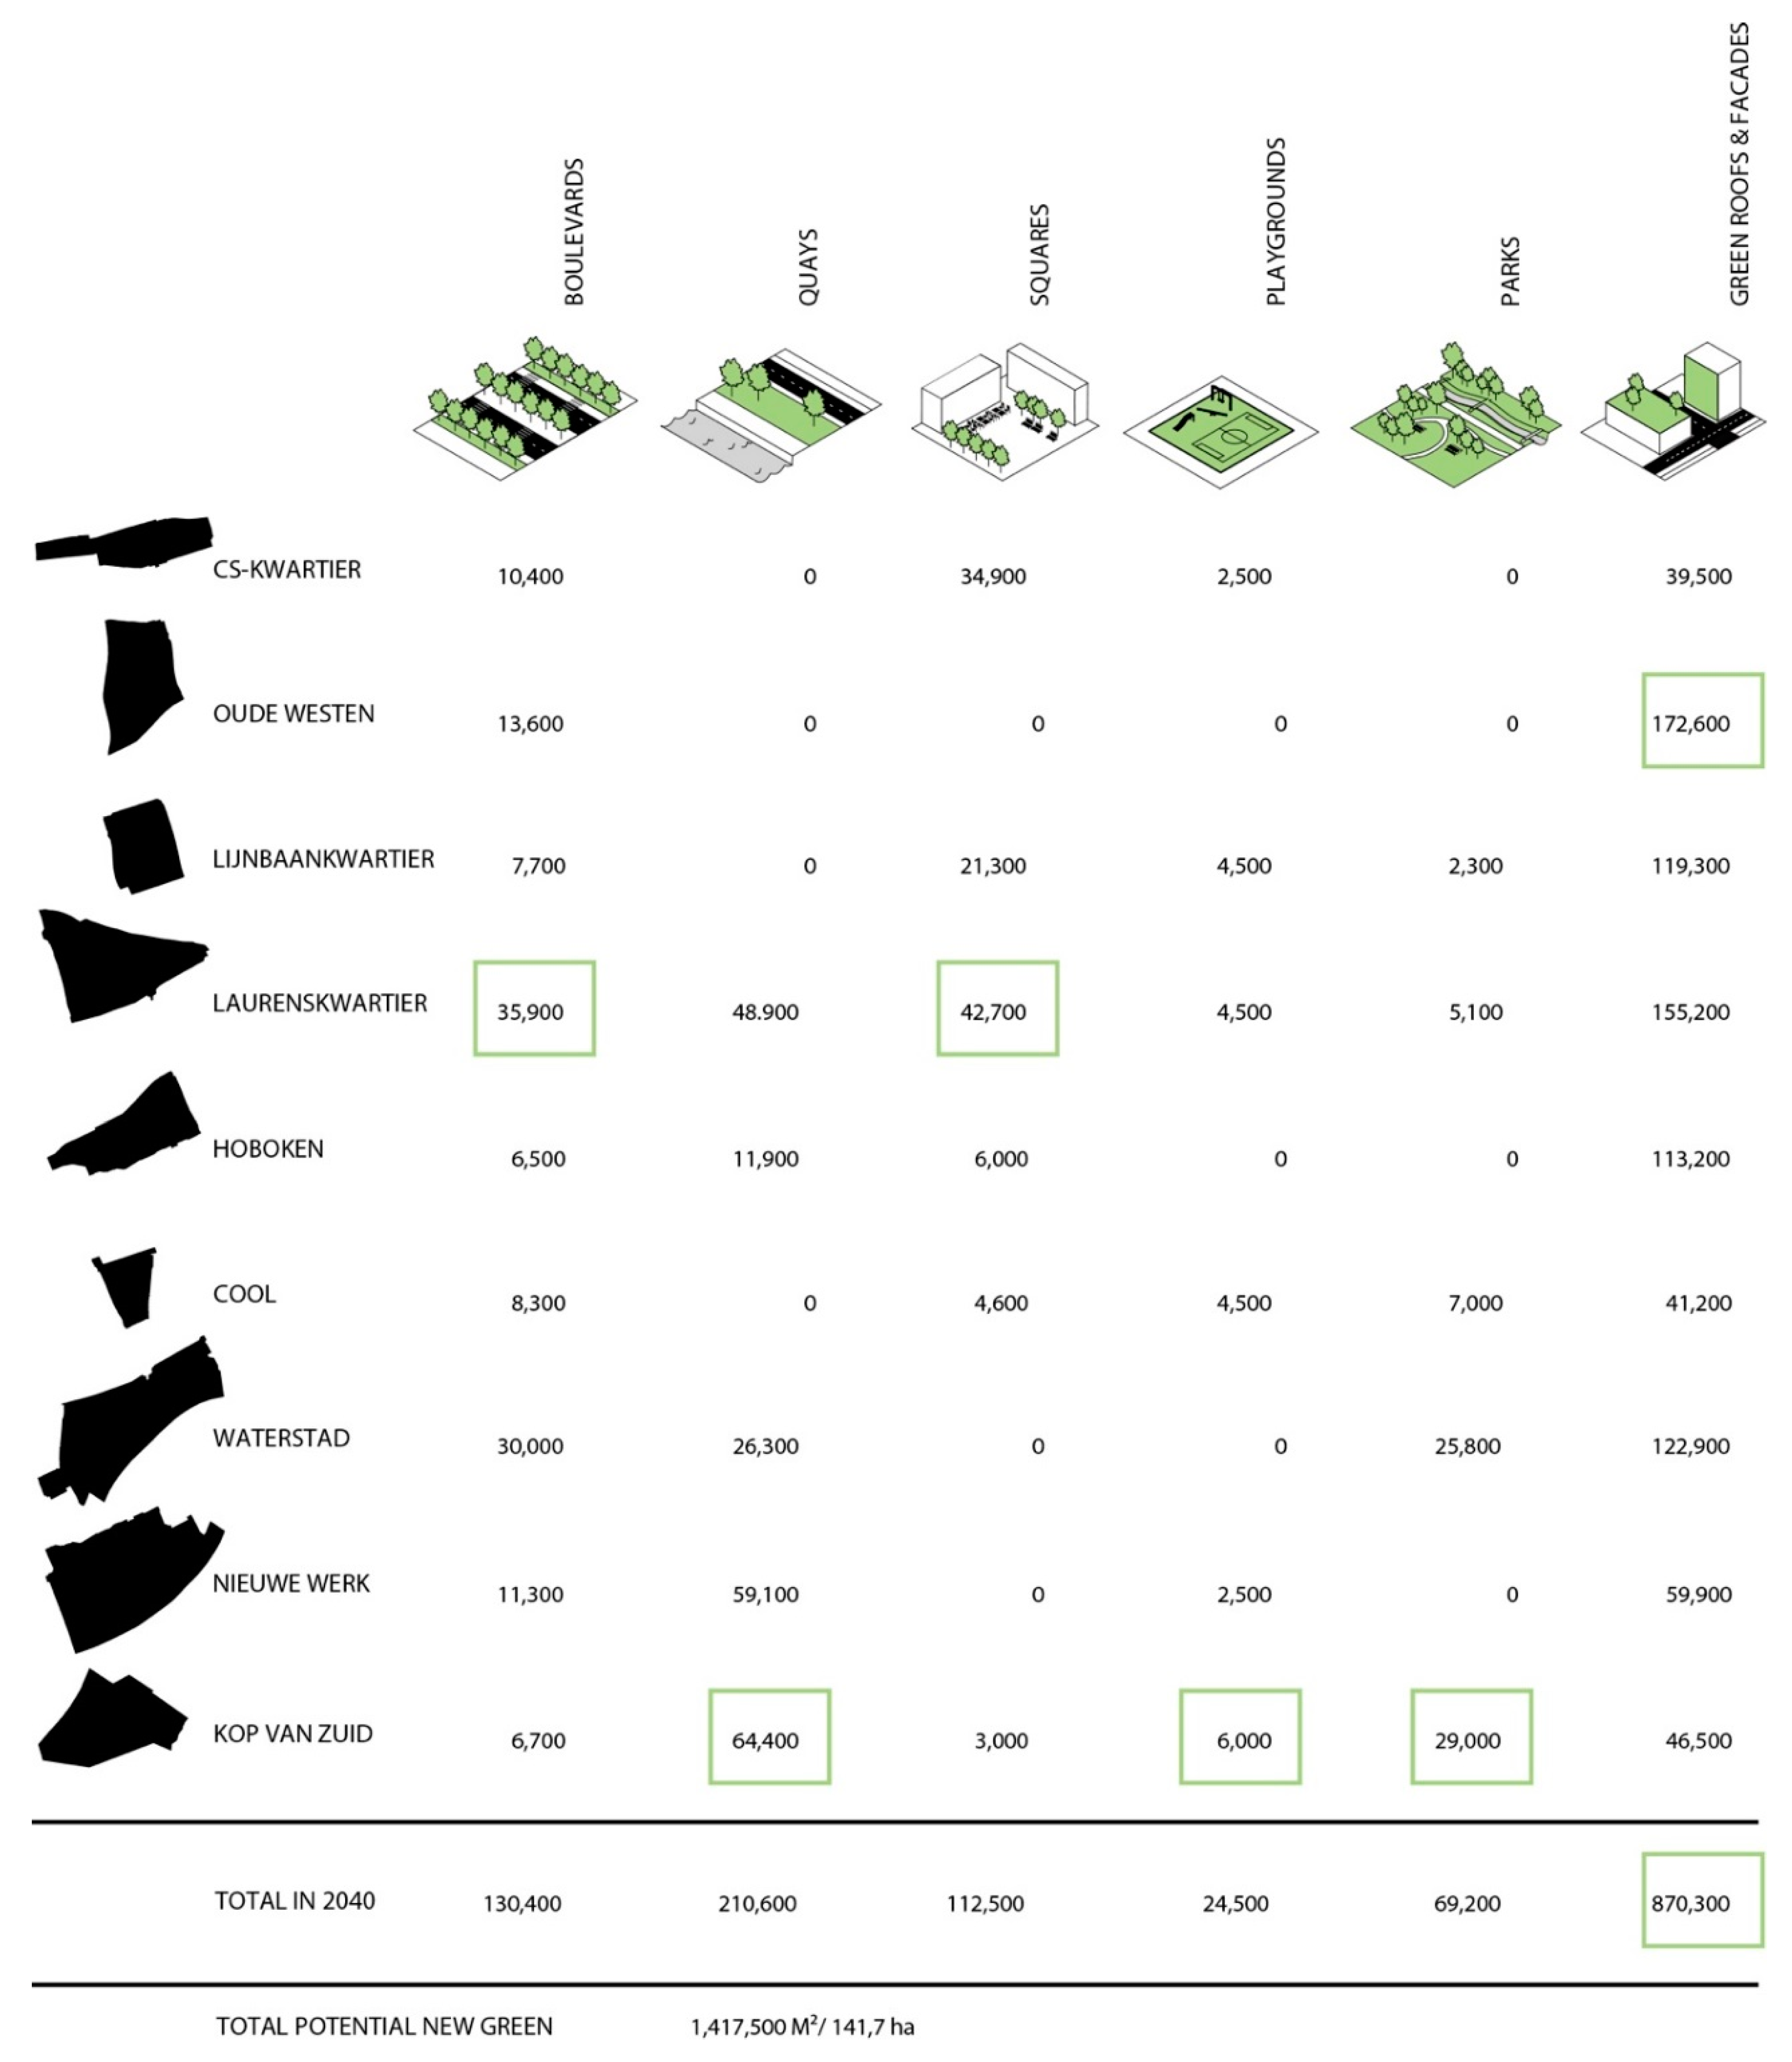
27] notes that more green space in the inner city is desired, as well as greater diversity in the green space and a better quality of green design and management. This implies that the construction of new dwellings should be accompanied by the provision of extra high-quality urban green, to compensate for previously unmet or future demand. In any case, to welcome the inhabitants that come with new dwellings, as well as for people living there already, more and better quality urban green is needed. An attractive green infrastructure in the inner city is conditional to the popularity of living in the inner city. The current green infrastructure needs to be expanded and complemented with new qualities. Below in Figure 10, the greening strategies are listed in a matrix. For each strategy, the number of potential m2 of green is listed per neighbourhood in the inner city district.

3.3.1. Boulevard

The boulevard strategy aims to complete the tree structure along main roads. The diversification in tree stock creates more variety and reduces vulnerability for species-specific diseases and aging. Trees and grass on roadsides and alongside and in-between tram tracks make roads and streets more attractive and improves the microclimate of the city. Green streets and roads invite people to walk and cycle and provide routes leading to green areas a high-quality flowscape.

3.3.2. Quay

The quay strategy aims to transform the riverbanks and stony quays into an attractively connected, green recreational landscape. This is all about a new perception of the river Maas, the old river mouths, and old harbours. Getting rid of car parking on the quays wherever possible and designing new green spaces will create a continuous walking and cycling route along the river with connections in the direction of the inner harbours and the areas beyond them. The city is once again connected with the water.

3.3.3. Square

The square strategy aims to give each square, in a way, its own character with various uses: a palette of different squares. Squares function best when surrounded by buildings with mixed programmes at street level and amenities in the form of terraces or attractively decorated public places [28]. Trees and attractive green in the form of scented flowering bushes and plants attracting insects can play an important role in providing a square with a pleasant ambiance, as well as contributing to its identity and character. Sculptures and playing facilities also play an important role in this. Flexible use of space can also provide opportunities for inhabitants to have a barbecue, a children’s party, or have other events.

3.3.4. Parks

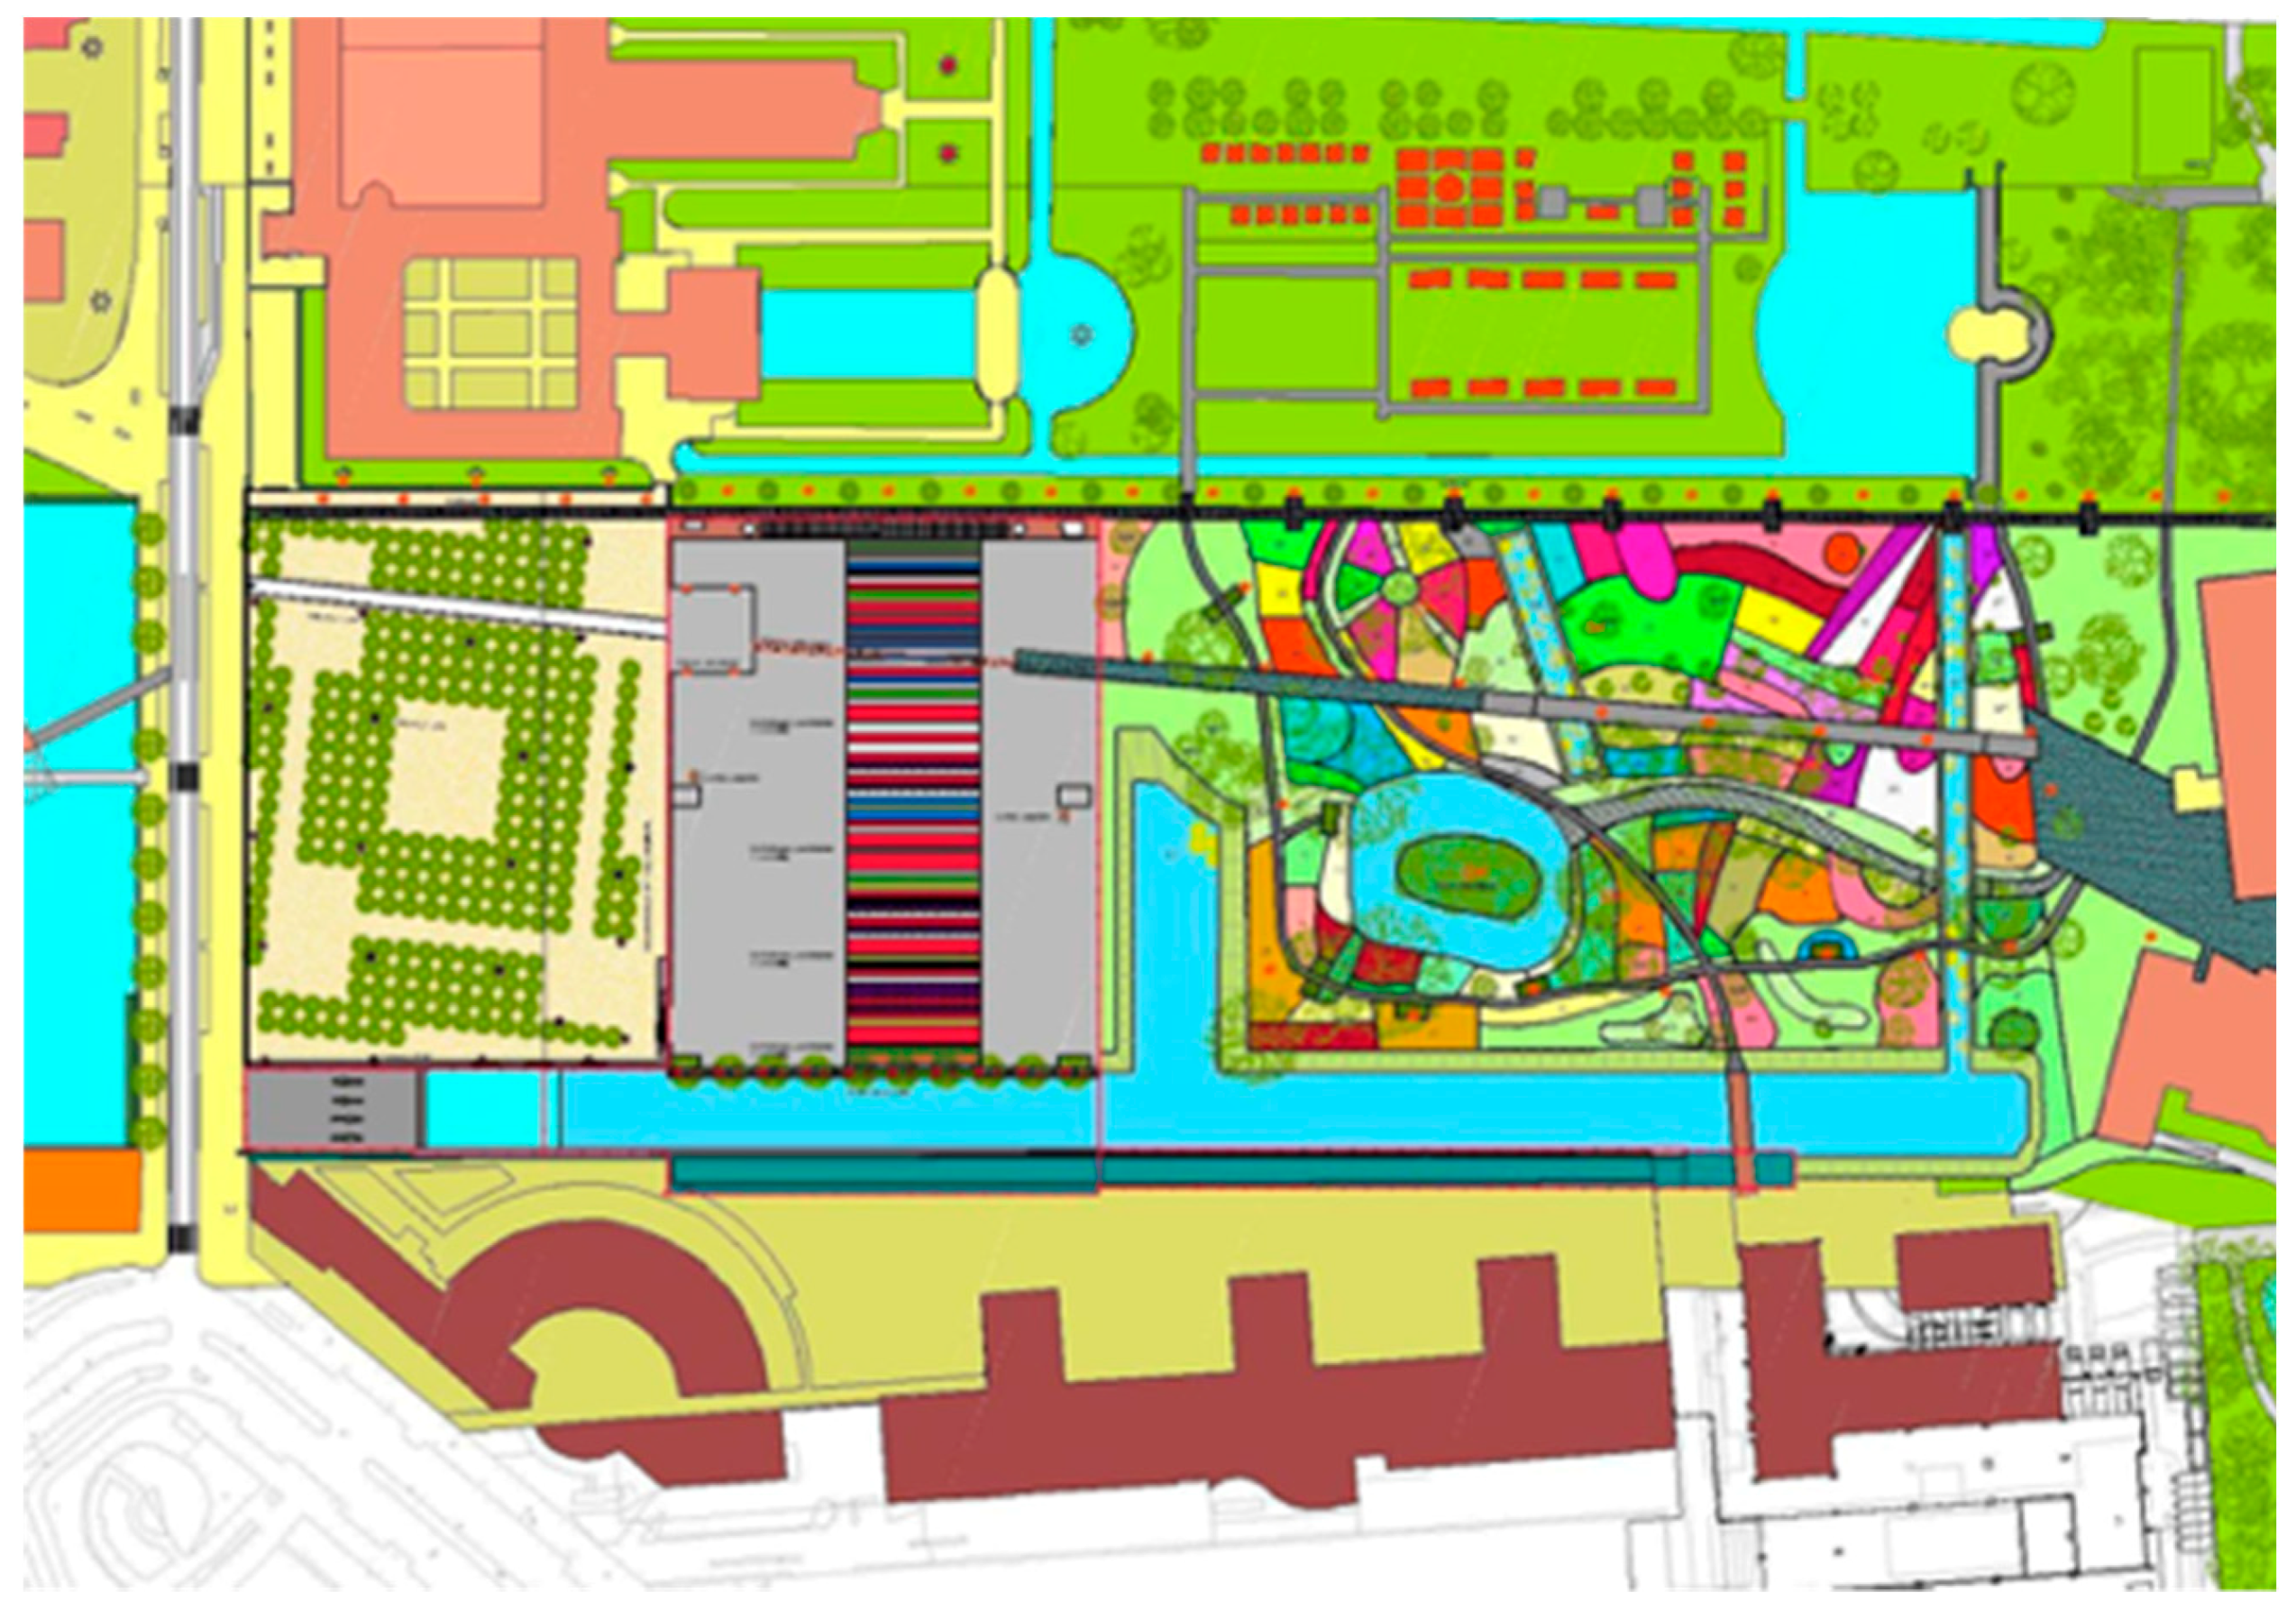
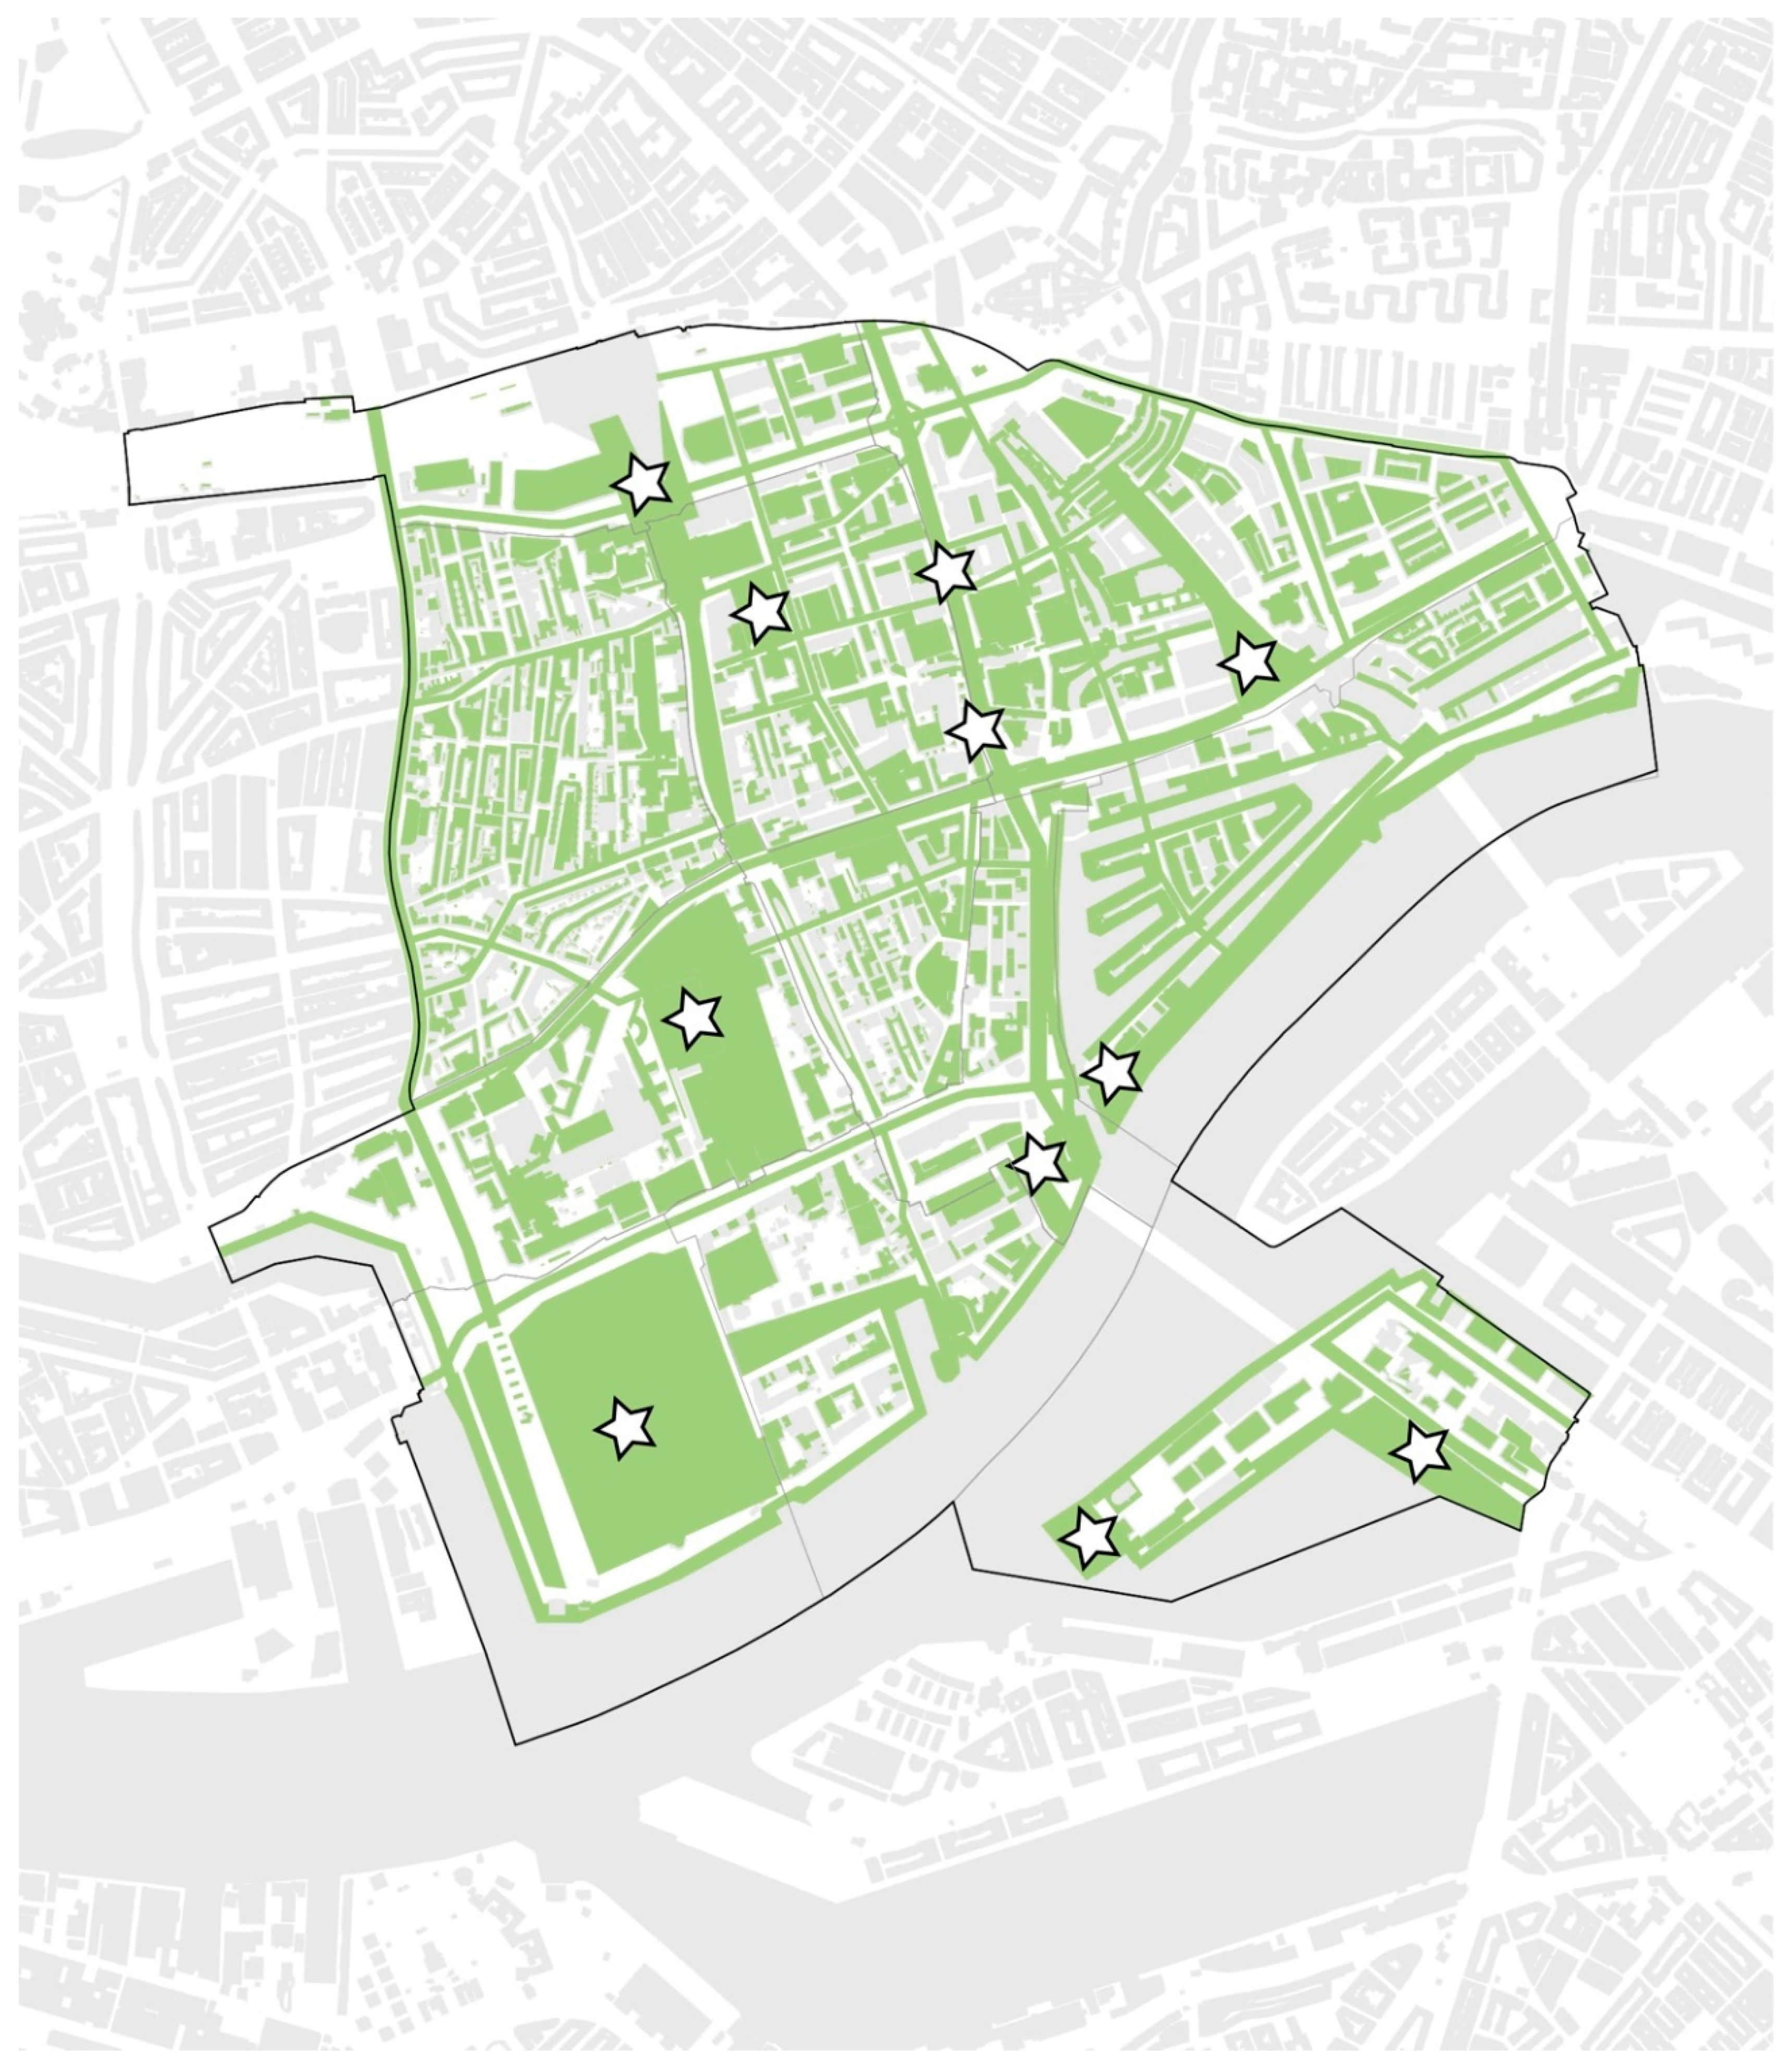
Concerning parks, the inner city has no more room for a large metropolitan park at ground level, but many small parks can also green the inner city. The park strategy aims to have a park within walking distance (250 m) of every home. The parks will differ from each other in form and use. Existing qualities in parks should be maintained and reinforced as much as possible. The west side of the city has a continuous network of good parks, which can contribute to the perception of green in the entire inner city, provided they are well connected. Some of these parks are improved or redesigned such as the Museumpark (Figure 11).
In a densifying city, parks and greenways on rooftops are not only an option but probably a necessity.

3.3.5. Playgrounds

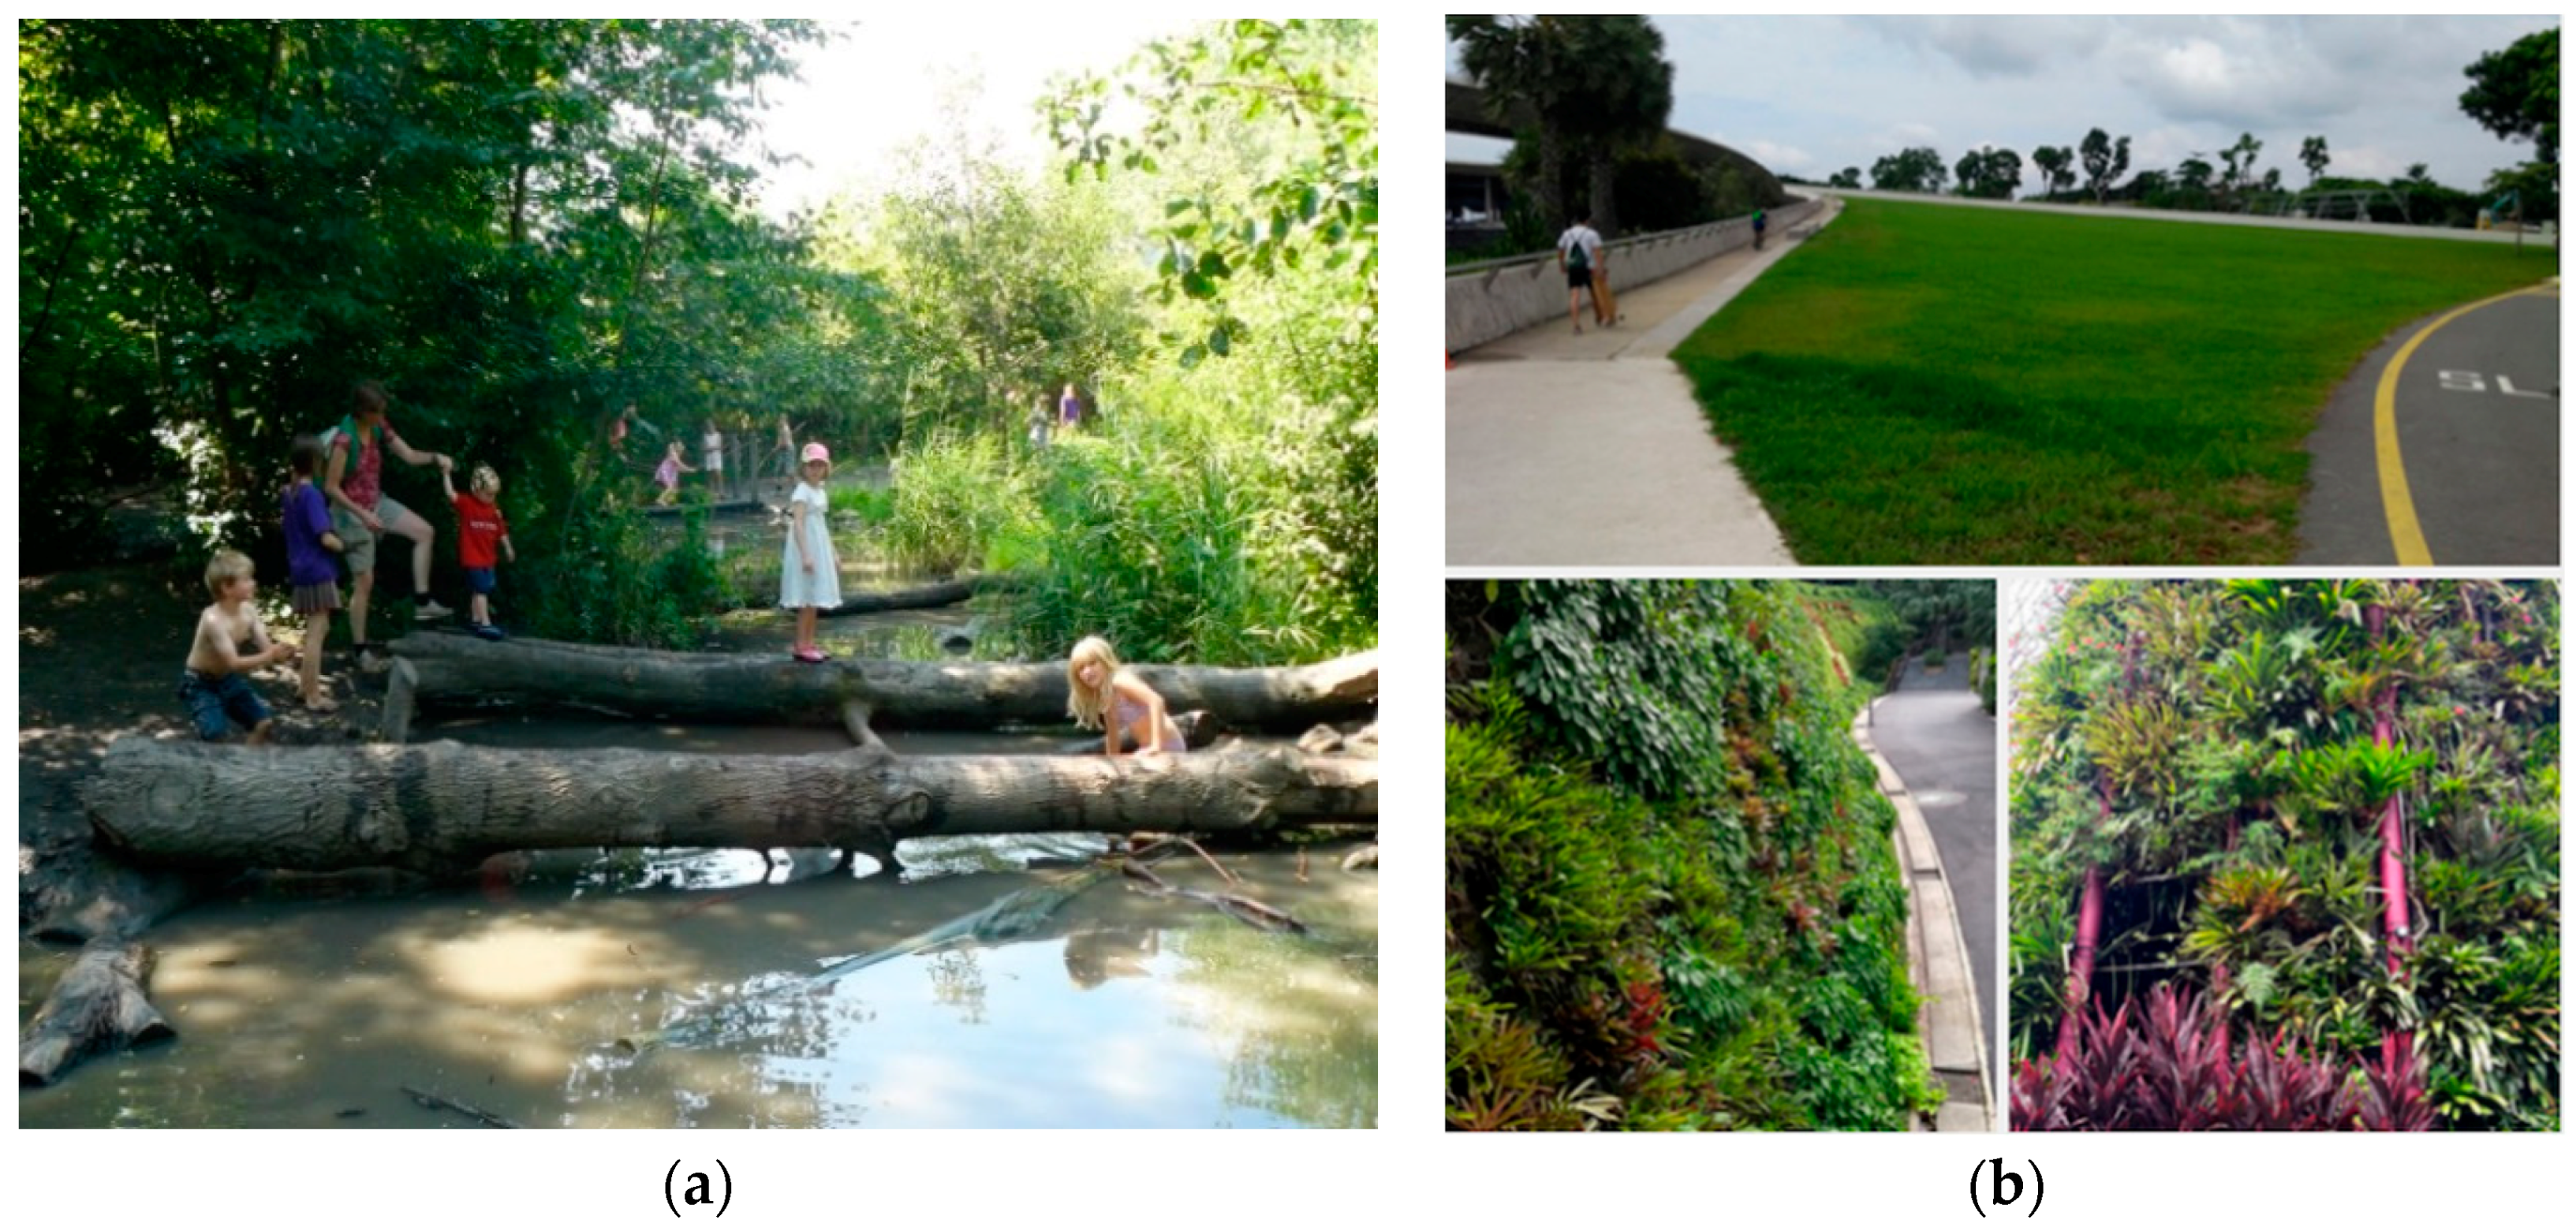
The Municipality of Rotterdam intends to create lively oases for children: squares, parks, and gardens that encourage children to play with sufficient places to sit. The Speeldernis or ‘play wilderness’ is a great example of playing and discovering nature (Figure 12). Child-friendliness entails more than just creating a few playgrounds; it encompasses the entire design of the public realm. Broad sidewalks, slow-traffic routes, and speed-bump zones play an important role. Broad sidewalks provide informal space for games. Speed-bump zones create transitional areas between the private domain and public space, where children can play in a safe, protected environment. In North American town planning, the Dutch ‘Woonerf’ is making a revival.

3.3.6. Green Roofs and Facades

Green roofs and facades provide extra ecological quality, capture fine particles, and can provide green scenery and green recreational (sitting and playing) environments (Figure 12). Moreover, they have a positive effect on the densified inner-city climate and function as water buffers, thus contributing to urban water management. Green roofs and facades also provide excellent locations for realising urban agriculture. Combinations of building functions (e.g., restaurants and schools) and agricultural activities on roofs and facades also have social and economic value.
Furthermore, this can all be combined with installing solar panels. In the MUSIC project, the online Rotterdam energy atlas was produced for inhabitants to see the potential for solar energy on their roof.

3.3.7. Glamourous Green

Glamourous Green or outdoor space of excellent quality is needed for the busiest and most characteristic places in town. The design of this public realm is decisive for the atmosphere, tempting people to dwell longer and, finally, to feel more connected with the city.
In Figure 13, a mapped overview is given of all the greening strategies discussed.

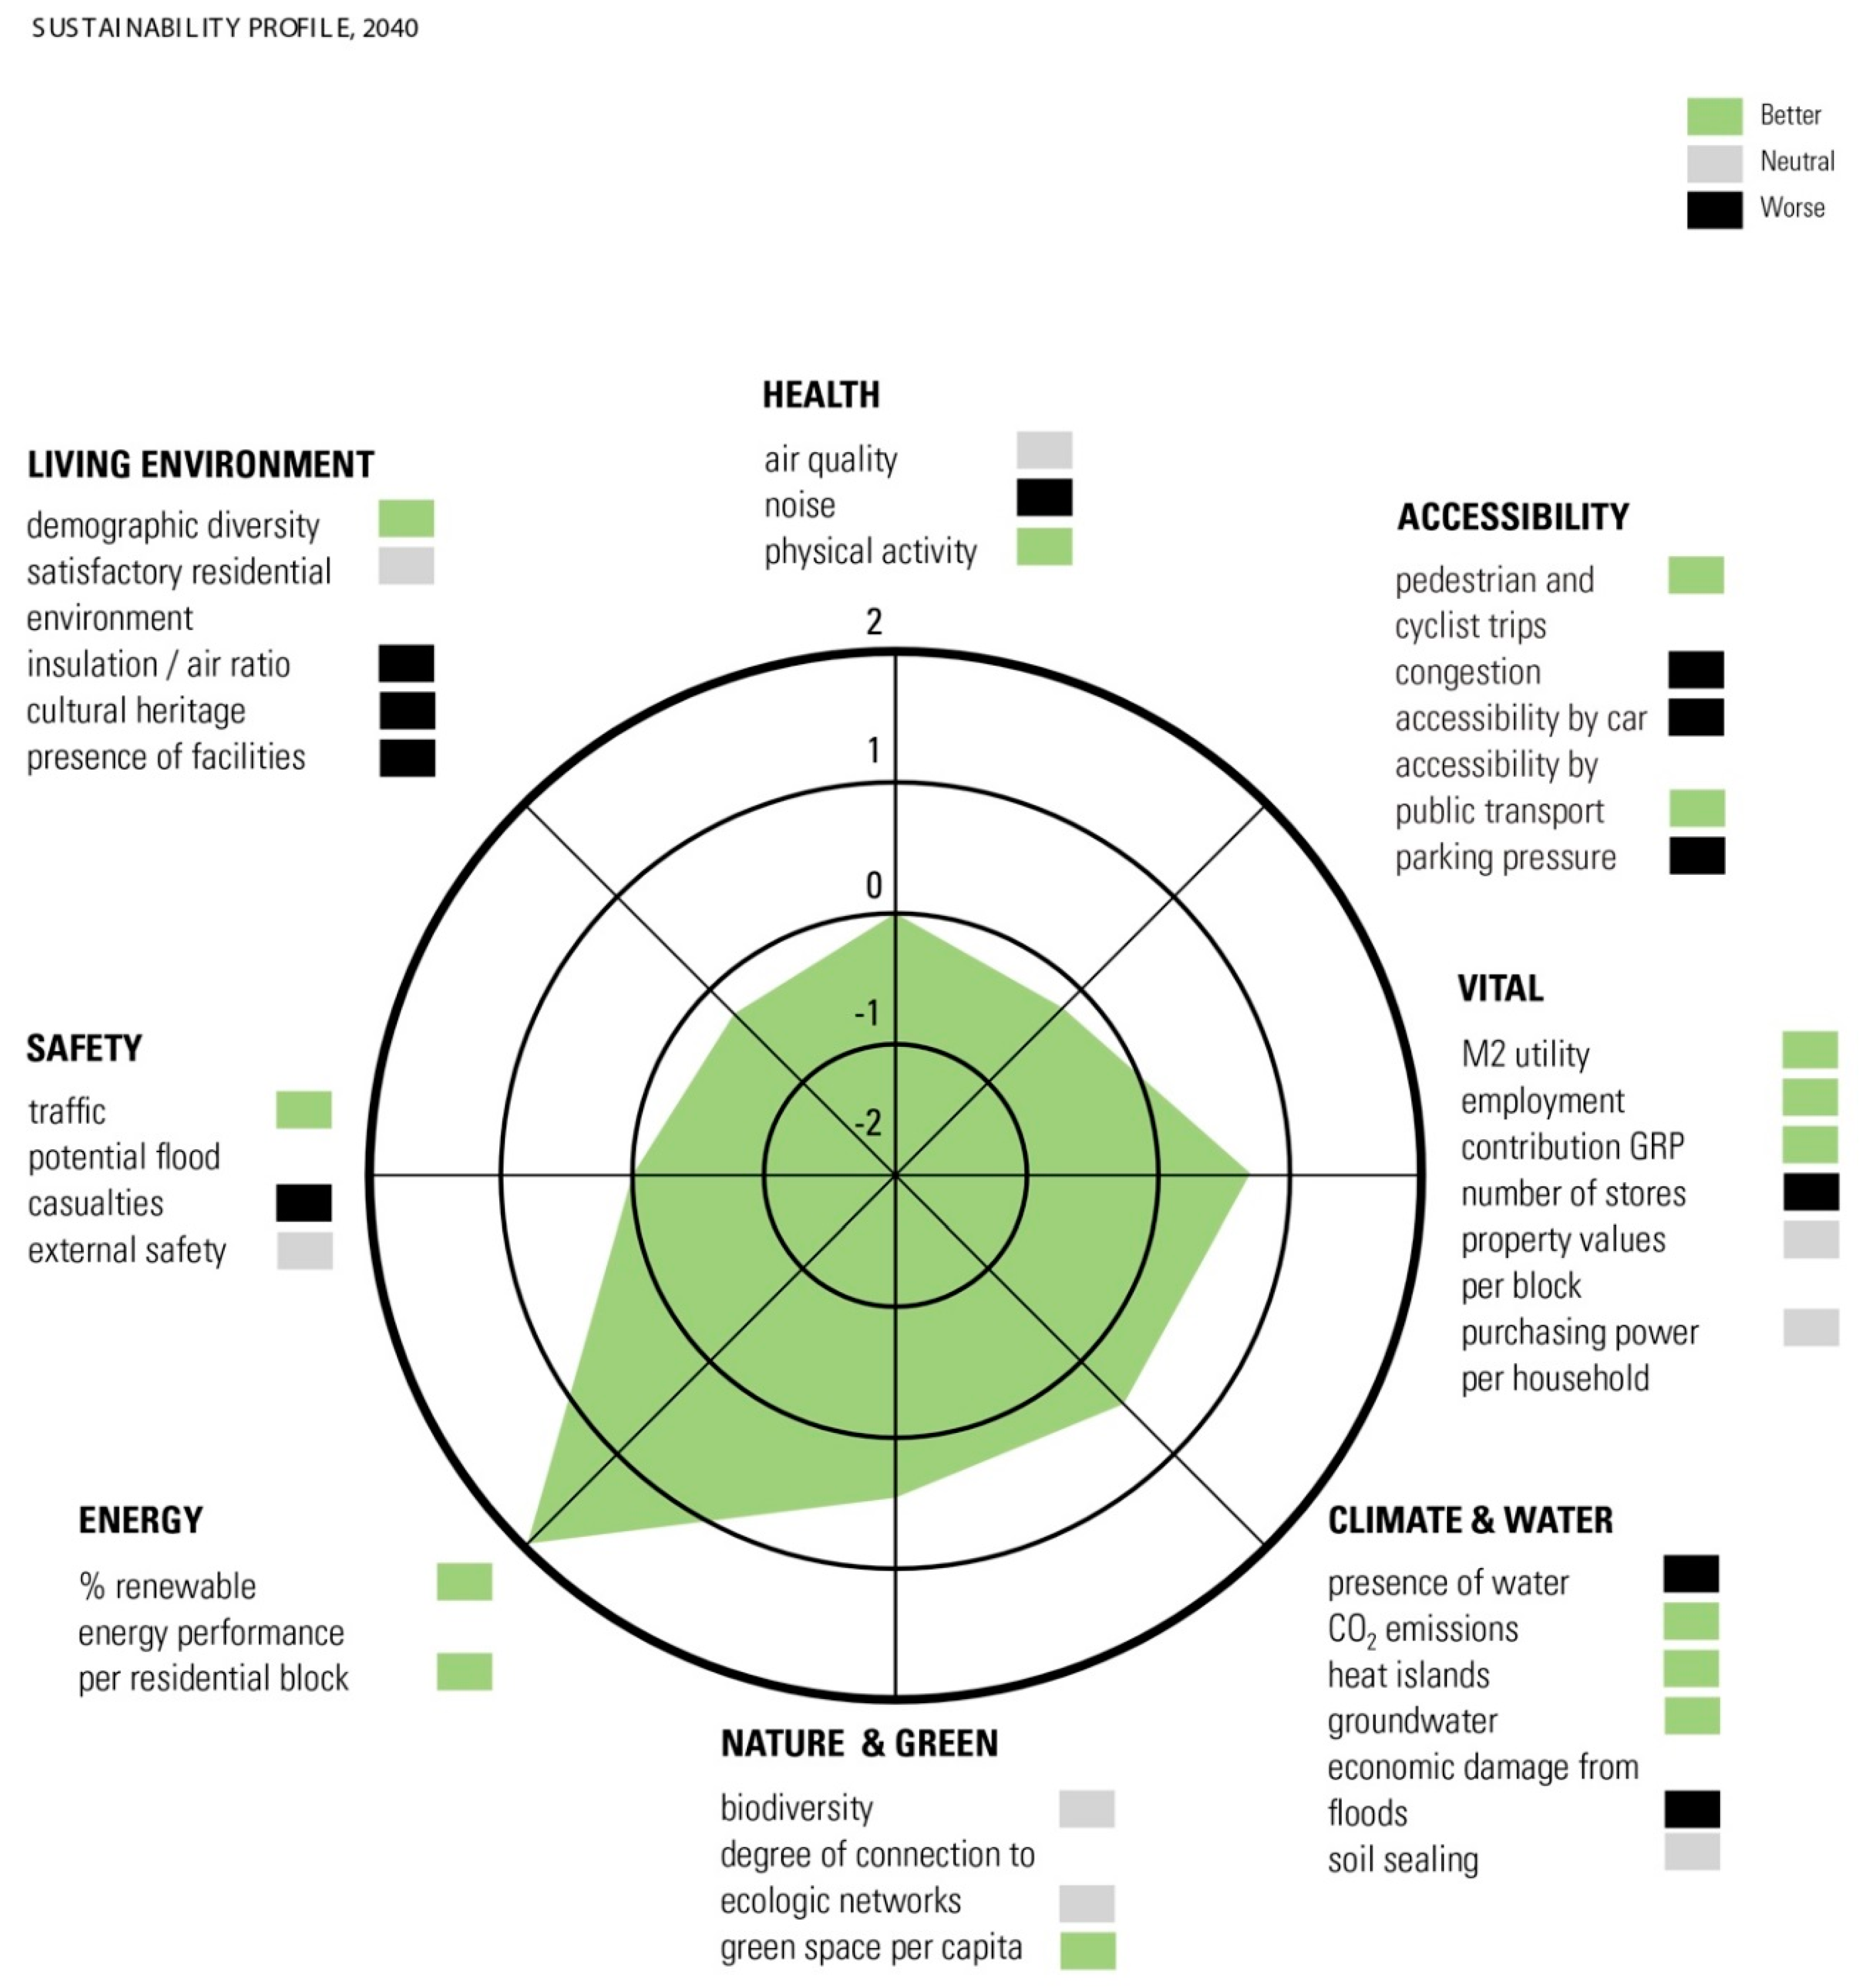
3.4. Validation Results

The densification and greening proposal resulted in quantifiable outcomes such as number of houses and trees. This was direct input in the scenario models, which then resulted in, for example, energy use. When this was not possible, a consensus of expert opinions and views were used, combined with sources of geographical data. The results were analysed with geographical information systems (GIS). For each of the eight themes in Figure 11, the outcomes of one or more indicators are explained below.

3.4.1. Energy

Energy use: Doubling the number of dwellings will strongly help to decrease the average energy consumption per dwelling of the inner city area.
Average use of energy per dwelling will decrease because new housing will have to meet stricter standards of energy efficiency. New buildings will have to be energy neutral after 2020. However, substantial efforts will be needed to upgrade the energy efficiency of the existing housing stock. Ideally, upgrading could be carried out while densification strategies are being realised. Densification has the added benefit of contributing to a more compact urban form; more clustering within the urban morphology leads to more energy efficiency as well. Furthermore, existing district energy networks will become more efficient and profitable because they will supply energy to a greater number of buildings; also, heat exchange between buildings will become possible [29]. Lastly, a compact urban form also has a favourable effect on energy consumption by urban transport such as public transport, walking, and cycling that are all forms of low carbon transport.
Renewables: The growth of renewable energy production within the city can be expected. Solar photovoltaic units can be installed on many flat roofs, either alone or combined with green roofs. In urban transport, the combination of less car use and more frequent use of public transport, walking, and cycling, in combination with more energy-efficient vehicles, will largely compensate for the additional use of energy.

3.4.2. Climate and Water

CO2 emissions—low carbon: Since all the new houses will comply with new energy regulations, 44 tonnes of CO2 emissions will be avoided on a yearly basis, compared to a business as usual scenario, i.e., 18% of the current residential CO2 emission of houses in Rotterdam. Of course, as long as new buildings are not energy neutral, adding new buildings will increase carbon emissions of the built environment. New buildings will have to comply with stricter norms on energy performance as from 2020. This means that all new buildings will be nearly carbon neutral. Apart from decreasing energy consumption for buildings and transport, the energy mix for the inner city should change to make it carbon neutral. Heating and cooling should either shift from natural gas to zero carbon electric or district heating and cooling systems, and the electricity should come from renewables off grid or form a zero-carbon grid. Scenario studies in GRIP (Greenhouse Gas Regional Inventory Project) [30] for Rotterdam have shown that this is possible. CO2 emissions avoided in new buildings has been defined in comparison with business as usual. However, for future studies, it would be interesting to know more about avoided CO2 emissions when comparing living in a densified neighbourhood to an alternative, for instance living in a suburban neighbourhood. Similarly, for the GAP indicator (green area preserved) [31], it would be interesting to compare not building outside, but inside the city.
Heat stress: The increase in urban heat island effects by adding building mass to the inner city is compensated by adding urban green and shadow cast of high building blocks.
The densification strategies as described in Section 3.2 are accompanied by ambitious urban greening strategies. Higher buildings lead to more prominent heat island effects. However, higher buildings also create more shade, which compensates for increased urban heat island effects. Also, development of more urban green mitigates these heat island effects even further. As a result, heat stress does not increase significantly compared to the existing situation. Several parts of the city that warm up during summer were mapped; the greener the area, the smaller the chance that during a warm period the critical radiation heat will exceed 55 °C. Note that radiative heat is not the same as air temperature; radiative heat is usually much higher than air temperature.
Soil sealing, flooding, and economic risk: Soil sealing and flooding risks remain at the same level. Economic risks increase as a result of potential flooding, not because flooding occurs more frequently, but because the total economic value of real estate is higher as the inner city grows.

3.4.3. Health

Physical activity factor. In this example, higher density stimulates walking and cycling. With more inhabitants living in densely built-up areas, walking and cycling can be promoted, particularly so because car use becomes less attractive as a result of a limited supply of parking spaces and an urban design attuned to cycling and walking. Ambitious urban green development induces physically active behaviour. More playgrounds will be created through strategies for urban greening and existing playgrounds can be used more intensively. A high-quality flowscape for pedestrians and cyclists depends on the quality of the urban design of the densification strategies. Examples of relevant elements in a successful urban design may include lanes with separate walkways and cycle paths, the establishment of attractive green areas, and the reduction of barriers by providing extra connections such as bridges for slow traffic or simply zones where pedestrians and cyclists have right of way. On the other hand, new blocks of buildings could limit the possibilities for physical activity around the city. Improvement of physical activities occurs when new green areas and infrastructure is developed, while decline takes place when blocks of buildings are added. It is clear that the new city structure includes some blocks for which it is less inviting to venture out on the streets, because there is little urban green or barriers to walking and cycling are present. Additional analyses of the combined effect of physical activity, air pollution, and traffic safety show that extending the possibilities for physical activity leads to extra years of healthy living.
Noise pollution will increase slightly due to more automobile traffic on a few thoroughfare roads. Effects of busier traffic are countered by buildings that act as acoustic screens. However, more than half of the new inhabitants will experience noise levels above the strict future norms. After the realisation of the densification strategies, about 18,000 of the new inhabitants will experience noise levels greater than 48 dB at the outer walls of their dwellings. This is primarily due to an increase in the number of cars. The policy limit of 48 dB anticipates new, stricter policy norms in the future; 55 dB is the current norm. Very few houses are expected to experience noise levels above the current norm of 55 dB. Noise levels above 50 dB are mainly confined to roads; noise levels at the facades of homes are mostly below 50 dB.
As for congestion, few changes occur between the old and new situation. There are few places where an increase of more than 5 dB will take place. In contrast, many places show a decrease of noise hindrance due to the assumed higher importance of public transport, walking, and cycling as means of transport. Although densification will not as such substantially aggravate noise levels in the inner city as compared to current standards, action (e.g., reduction of car traffic) must be taken to comply with future norms.
Air quality: It is expected that air quality will improve. By 2016, heavy polluting vehicles were not allowed to enter the inner-city anymore, with air quality improvement as a result. As a consequence of densification, more people will be exposed to the existing levels of air pollution. At the same time, adults and children will have more possibilities for physical activity, which in combination with relatively less car use can lead to two more years of healthy living according to the models.

3.4.4. Vital City

Employment: Densification leads to a significant increase in employment in service activities.
A denser inner city leads to a higher demand for services, such as shops, restaurants, hairdressers, and the financial and administrative services that in turn support these companies. Employment and added value per square meter will increase as a result of urban densification and the resulting increase in inner city inhabitants.
Market value of new houses: Although the average current market value of houses per city block is known, it is difficult to accurately predict the future value of houses since there are too many variables that influence their future price. We can nevertheless give a first indication of price developments based on observed correlations between the number of new homes and the development of housing prices, assuming that all other factors stay the same. These correlations show that if up to ten houses are added to a residential area, house prices will rise only slightly. This is because a small investment indicates a small scale of improvement of an urban area that has been already developed. If more than just a few houses are added, the data show that prices will drop. This can be explained by the simple mechanism of supply and demand: the more apartments or family homes in a certain building block, the less new owners are likely to pay more for them. Indication of the relative change in house prices in Rotterdam per city block were studied, as well as the current average values per block before and after densification. However, a strong reservation should be made about the outcome, since it is only based on the number of homes; other factors determining house prices such as location, house type, and number of rooms have not been researched. Differences can be seen between the north-western and north-eastern parts of the inner city. Unfortunately, data is missing for some city blocks.

3.4.5. Nature and Green

Biodiversity: The current initiatives to improve biodiversity will compensate for a more intensive use of the inner city area. The amount of urban green is expected to increase significantly. Also, there is more diversity of green such as green roofs, sloping roofs linking street level to a roof network, and green walls. Nevertheless, it will be used by more people, so the area of urban green per inhabitant slightly decreases.
Ecological networks and green space per capital: The availability of urban green improves, but it will be used more intensively. An expansion of urban green will be realised, although the increase in number of inhabitants is relatively larger than the volume of urban green added. In this analysis, urban green available for daily activities (within a range of 250 m of the dwelling), such as recreational walking and cycling, was distinguished from urban green available for weekend activities (within a range of 500 m of the dwelling). It appears that the total amount of urban green per inhabitant decreases somewhat in spite of ambitious strategies for urban greening. However, the good news is that for many inhabitants, their proximity to urban green is significantly closer, especially for those who live in existing buildings. Less urban green per inhabitant will lead to more intensive use of the urban green in place. This can result in “cosy crowdedness” and “more eyes on the street” (Jane Jacobs). The presence of people attracts other people. The quality and characteristics of urban green is important as these influence how green areas are used, because there are more factors such as access and linkage, safety, sociability, and activities [25,28,32]. Although the quantity of urban green decreases per inhabitant after densification, from 37 to 34 m2 per inhabitant, green space of high quality can partly compensate for this and thus contribute to creating a satisfying living environment.

3.4.6. Living Environment

Facilities: In the search for new housing locations, the number of leisure facilities and services available often play a minor role. Nevertheless, in order to maintain an adequate service level, places need to be identified where leisure facilities and services should be added or expanded. All stakeholders should be aware of the needs of entrepreneurs and organisations at an early stage. Diversity and flexibility of space for leisure facilities and services should allow for easy adaptation to actual needs in future. The location of bars, restaurants, hotels, theatres, galleries, museums, and other cultural points of interest per city block were mapped. Also, the anticipated increase in the number of new facilities needed in relation to the location of new dwellings and new inhabitants after densification were studied. Especially, the areas around the railway station and the Kop van Zuid district need a boost in leisure facilities.
Demographic diversity: More demographic diversity due to the settlement of families contributes to greater satisfaction with the living environment. Measures to design child-friendly neighbourhoods, such as routes and continuing pavement, have a positive effect on safety and well-being, not just for children but also for elderly people.

3.4.7. Accessibility

Accessibility in the inner city appears to be largely dominated by the voluminous traffic flows of commuters and visitors rather than the doubling of the number of its inhabitants, so the effect of densification is relatively small. Besides, for the inner city, the limited supply of parking places (0.48 parking place per dwelling 2012, and shrinking) and increasing numbers of other means of transport, such as public transport, walking, and cycling, will lead to reduced use of cars. Although the Urban Strategy model predicted for congestion to get worse on a few thoroughfare roads as a result of higher traffic intensities outside the area studied.
However, when interviewing the traffic department in Rotterdam, it turns out that congestion in the inner city overall has not increased in the past four years. In fact, some roads show a decline in car use and car traffic.

3.4.8. Safety

In terms of safety, the results show that traffic safety improves due to relatively less car use. In the past years there is a downward trend for car use in the city. Also, design solutions for a child friendly city improve traffic safety.
Safety from flooding remains the same; the risks do not increase, although the number of potential casualties is higher.

3.5. Results Outside the City Itself

3.5.1. Densification

Real life projects are not the results of the last few years only. During the third stakeholder meeting, the trend-setters were already demonstrating how they were already practising various initiatives. Sometimes the Municipality of Rotterdam was the initiator, as in the case of some DIY houses. Surveys among inhabitants and potential dwellers/buyers clearly indicate that this initiative is very much appreciated by enterprising inhabitants because they have an opportunity to satisfy their individual wishes and needs. Entrepreneurship is key to such developments, as demonstrated by Joost Kühne, spokesman for a group of initiators who develop small new housing projects as urban infill, financed in advance by market parties, which demonstrate how small interventions can have great impact on a neighbourhood. Another built example comes from ERA Contour, with ‘block city’, or the housing corporation Woonstad by selling houses, destined to be DIY houses in the district of Het Oude Westen. The DIY ideas were awarded with a European prize and are now applied in many other cities. Also, the recent renovation of the Bijlmermeer in Amsterdam was very successful using a similar approach.
Transformation of vacant office buildings and municipal real estate is also an issue high on everyone’s agenda. This is why the Municipality started inviting creative entrepreneurs to come forward with plans to exploit the opportunities provided by vacant (municipal) real estate.
Also in 2017, new areas came to life regarding facilities such as bars and restaurants. Places that were not developed well a few years ago are now hot, such as the area near the central station, the former office of Nationale Nederlanden (sandwich bars and coffee), Kop van Zuid, and ‘Onder de Bogen’. This area developed very fast as a result of the ‘Luchtsingel’, a crowdfunding initiative from the Rotterdam office of ZUS (Zones Urbaines Sensibles) linking different parts of the city by building a wooden bridge over the railway. This was also one of the IABR2012 projects.
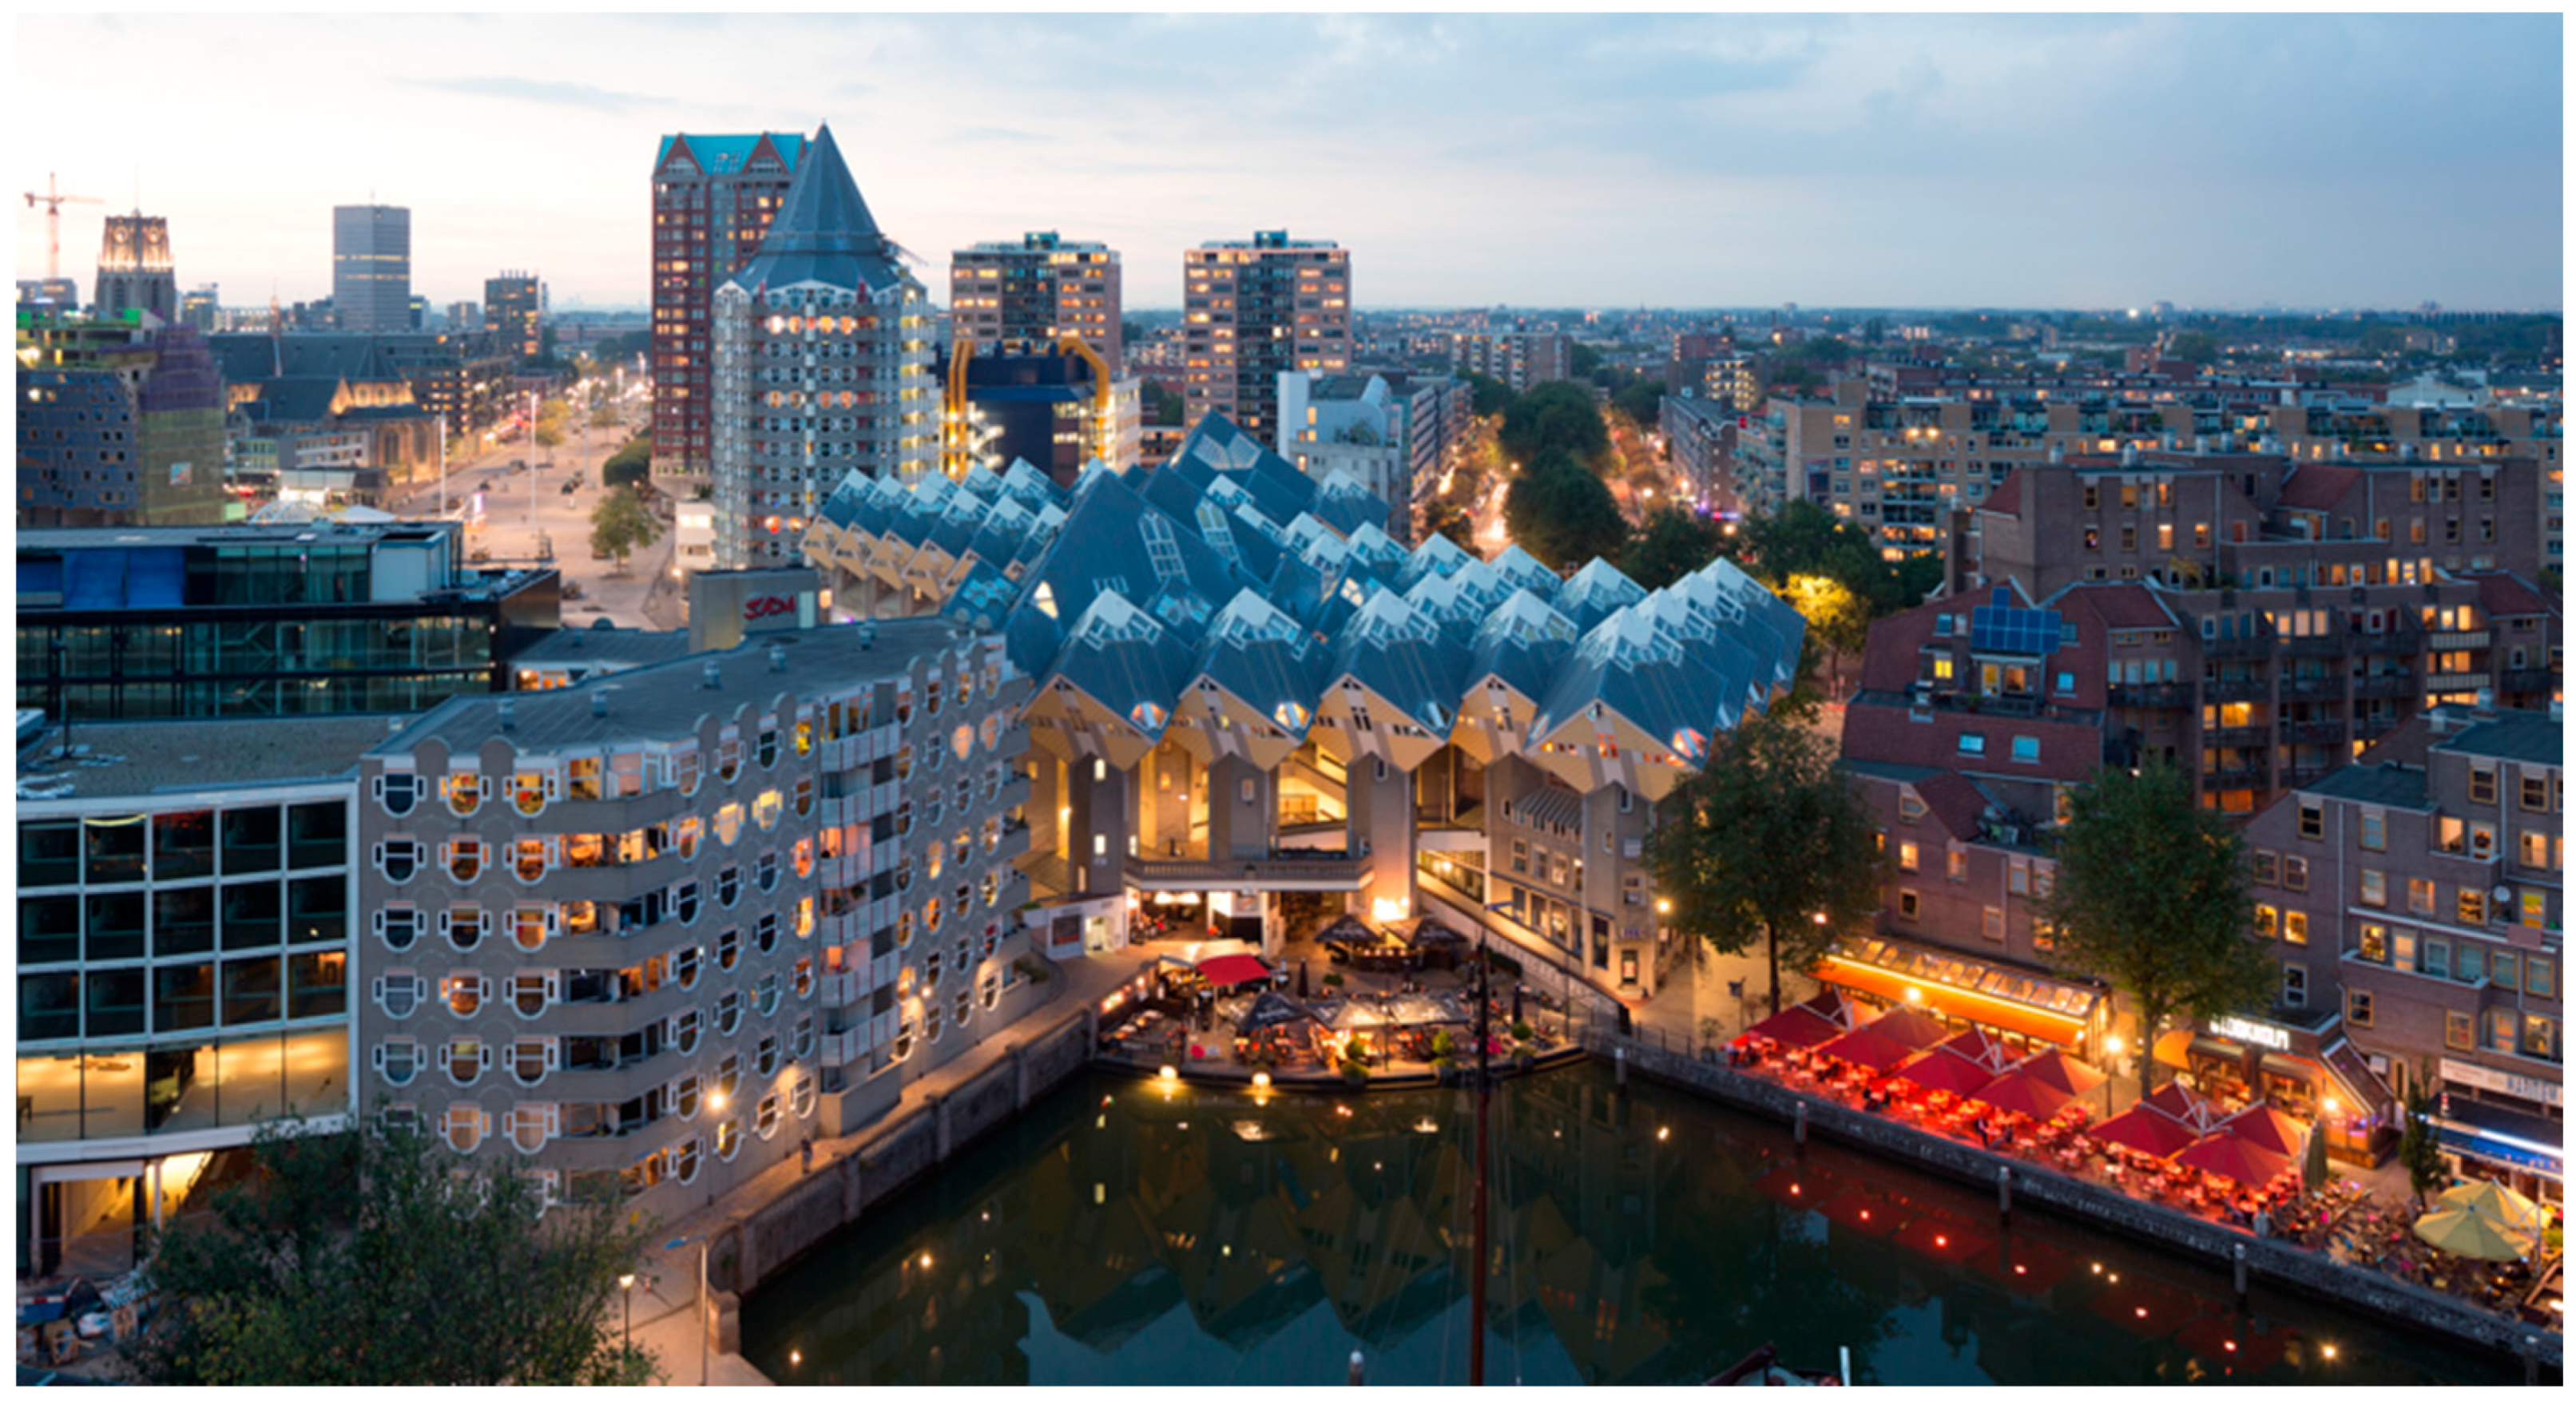
The year 2014 proved to be a turning point for the popularity of the inner-city with new developments such as the new Market hall, Central Station, and the multifunctional Rotterdam Building near the Erasmus bridge.

3.5.2. Greening

The greening strategies in Figure 10 show that a significant expansion of urban green space is possible under densification. Green roofs and Quays form the biggest part of this. A number of plans have already been built, such as the green quays at Leuvehoofd. This was designed by Piet Oudolf. New developments go further and in some areas tidal parks are built at the river. As such, the whole riverfront can be seen as a (potential) metropolitan park.
With the greening strategies it is important that, in addition to the municipality’s involvement, private parties and developers can also contribute. For example, private initiatives such as the urban agriculture garden on the Müllerpier or former garden in Delfshaven near the roof park have already contributed to the green space. Existing green roofs, facade gardens, and other urban agriculture initiatives are also contributing to the city’s green. The number of initiatives has grown. Extrapolation of the effect of densification and greening strategies indicates that there is sufficient space to extend these approaches on a larger scale and increase the involvement of inhabitants, and as such reinforce the vitality of the city.
In terms of transition management and stakeholder follow ups, over the years, stakeholders got more involved in different processes. Over the past four years, the so-called city conference or ‘stadscongres’ was organised. This is basically a yearly conference of one week, where the city officials present their new plans and ideas for input and where city plans as well as local initiatives link up with each other and other organisations. There are hands-on work sessions to prepare short-term actions in a long-term vision. As such, it is a kind of big dating event where people and organisations who like to improve the city get together.
A newer initiative is the ‘wijkraden’ or neighbourhood boards. Each neighbourhood has a group of active inhabitants or organisations that are involved in making a better city. As such, the transition arena group of the IABR2012 can be seen as an early neighbourhood board.
Another but older initiative that ran for four years is the city competition. Politicians agreed that for four years, inhabitants of the city could vote each year for the best initiative they wanted to be built in the city. The winner would be granted a few million euros for the project to be built. Actually, the ‘Luchtsingel’ described earlier as the wooden bridge was one of these projects. One of the positive side effects was that many people got involved in many initiatives. Even if their plan did not win, it created a lot of positive energy and ideas that were often realised later on.

4. Discussion

4.1. Synergies

In Section 3.2 and Section 3.3 many synergies were listed with the densification and greening strategies. The strategies are implemented in such a way that synergies occur. The synergies comply with other urban agendas in many cities, such as climate adaptiveness, child friendliness, good quality biking, and so on. By planning for synergies, the densification and greening agenda in cities relates directly to local broader social, environmental, and quality of life issues. In a follow-up study, this could be compared and linked to, for instance, ISO37120 standard on city services and quality of life and the United Nation’s Sustainable Development Goals.

4.2. GIS and City Data Information

An important component to adapt the stakeholder sessions and transition arenas to local context and needs was the use of GIS maps and city data in the transition arenas to give direct feedback to (wrong or right) assumptions. Using a third party (TNO) to test alternatives and future plans was crucial as they are an independent party in the process; a city testing and valuing its own plans would be less credible.
The outcomes showed that linking GIS mapping and city data to the stakeholder process and transition management proved extremely valuable.
The outcomes of the process also showed positive results for the densification and greening hypothesis in order to improve the sustainability of the city. It also showed that it is a very delicate process were stakeholder involvement is crucial to get things right. ‘People make the inner city’ was a phrase coined in this context.
Using the Sustainability Profile was very helpful, although at a practical level the themes and indicators did not match existing indicators at neighbourhood and city level. Follow up research should take this into account.

5. Conclusions

Densification and greening of the inner city of Rotterdam can lead to a more sustainable city with a higher quality of life. In this study, ambitious concepts and strategies for providing low-carbon urban transport are a side effect (walking, biking, and public transport). Electric cars and sustainable distribution of goods are strategies that have not been explored in this study. The hypothesis stated earlier is, therefore, only partly verified; low-carbon transport strategies are missing and still need to be articulated better. For specific conclusions on the different themes in Figure 11, Section 3.4 and Section 3.5 describe the outcomes of this research.
The outcomes of the transition management process from problem delineation to agenda setting were successfully presented. In this case, the focus groups as well as the use of GIS mapping and a data specialist were new.
Although the Sustainability Profile served as a good baseline to measure improvements, it was difficult to (re)use for the employees of the city administration as they used slightly different indicators. In the follow-up process, the indicators were adapted to the ones used by the city administration (the Sustainability Profile was renamed into Smart City Planner).
These data were used in transition management and can be used in any a stakeholder environment to explore potential synergies and vision making.
The overall conclusion to be made is that the densification and greening strategies can contribute to a higher level of urban sustainability.
The research results also made clear that densification and increase of urban green need to go hand in hand with good parking solutions and an ambitious mobility strategy. The inner city has evolved into a pilot project for finding out which measures will succeed in turning the entire city of Rotterdam into a sustainable, vital one. This approach can also be copied to other cities.

Author Contributions

N.T. wrote the paper and was the initiator of this project and was responsible for the project and research outline. He also worked on different aspects from data, to greening and densification as well as stakeholder sessions where the different strategies and agenda were formed. He was first author of the project publication and was with M.A. also responsible for arranging the financial resources for this project. J.B.-v.B. was responsible for studying the impact of the proposed strategies and developed with TNO the sustainability profile. D.D. was responsible for the upscaling of the densification and greening studies in the city. He also provided maps and designs. M.A. was co-initiator of the project and was responsible for contacts with the city councillor and was crucial in developing the project strategy. He organised and guided many stakeholder sessions. During the process, all work was discussed on a weekly basis so all authors added to each aspect in this study. Also, all authors wrote or contributed to preprints of this paper.

Acknowledgments

This research was funded by the European INTERREG IV B Project MUSIC and the City of Rotterdam. The authors grateful for making this research financially possible.

Conflicts of Interest

The authors declare no conflict of interest. The founding sponsors had no role in the design of the study; in the collection, analyses, or interpretation of data; in the writing of the manuscript, and in the decision to publish the results.

References

  1. Davies, J.S. The governance of urban regeneration: A critique of the ‘governing Without Government’ Thesis. Public Adm. 2002, 80, 301–322. [Google Scholar] [CrossRef]
  2. Newman, P.; Jennings, I. Cities as Sustainable Ecosystems: Principles and Practices; Island Press: London, UK, 2008. [Google Scholar]
  3. Loorbach, D. Transition management for sustainable development: a prescriptive, complexity-based governance framework. Governance 2010, 23, 161–183. [Google Scholar] [CrossRef]
  4. MUSIC. Mitigation in Urban Areas: Solutions for Innovative Cities (MUSIC), Project Proposal, Final Approved Version; MUSIC: Rotterdam, The Netherlands, 2010. [Google Scholar]
  5. Centraal Planbureau (CPB); Planbureau Voor de Leefomgeving (PBL). Nederland in 2030–2050: Twee Referentiescenario’s—Toekomstverkenning Welvaart en Leefomgeving (WLO); CPB & PBL: Den Haag, The Netherlands, 2015; Available online: www.wlo2015.nl (accessed on 20 November 2017).
  6. Tillie, N.; Dudok, I.; Pol, P.M.J.; Boot, L.; van der Heijden, R. Quality of life in Remaking Rotterdam. In Remaking Post Industrial Cities; Routledge: Abingdon-on-Thames, UK, 2016. [Google Scholar]
  7. Hajer, M.; Huitzing, H. De Energieke Stad; Planbureau Voor de Leefomgeving: Den Haag, The Netherlands, 2012. [Google Scholar]
  8. Verhofstadt, G. Available online: https://digitaleeditie.nrc.nl/losseverkoop/NH/2012/1/20120204___/1_01/ (assessed on 7 February 2012).
  9. Marlet, G. De Aantrekkelijke Stad; VOC Uitgevers: Nijmegen, The Netherlands, 2009. [Google Scholar]
  10. Florida, R. The Great Reset: How New Ways of Living and Working Drive Post-Crash Prosperity; Random House Canada: Toronto, ON, Canada, 2010. [Google Scholar]
  11. Glaeser, E. Triumph of the City: How Our Greatest Invention Makes Us Richer, Smarter, Greener, Healthier and Happier; Penguin Press: New York, NY, USA, 2011. [Google Scholar]
  12. Bettencourt, C.; Lobo, J.; Strumsky, D.; West, G. Urban scaling and its deviations: revealing the structure of wealth, innovation and crime across cities. PLoS ONE 2010, 5, e13541. [Google Scholar] [CrossRef] [PubMed]
  13. West, G. Scale: The Universal Laws of Growth, Innovation, Sustainability, and the Pace of Life in Organisms, Cities, Economies, and Companies; Penguin Press: New York, NY, USA, 2017. [Google Scholar]
  14. Brugmans, G.; Petersen, J.W. Making City 5th, IABR 2012; Catalogus Internationale Architectuur Biennale: Rotterdam, The Netherlands, 2012. [Google Scholar]
  15. Borsboom-van Beurden, J.; de Bruijn, T.; Bugge, K.E.; Kijpers Linde, M.; Rietveld, E. Een Eerste Digitale Kansenkaart voor de A1-Zone; TNO: Delft, The Netherlands, 2011. [Google Scholar]
  16. Brundtland, G.H. World Commission on Environment and Development. Our Common Future: Report of the World Commission on Environment and Development; Oxford University: Oxford, UK, 1987. [Google Scholar]
  17. Borsboom-van Beurden, J.; Rietveld, E.; Puts, H. Benchmark Centraal Nederland. Een Vergelijking van Groeiregio’s in Midden-Nederland; TNO: Delft, The Netherlands, 2011. [Google Scholar]
  18. TNO. 2012b. Available online: http://www.tno.nl/downloads/iB_Urban_Strategy_ en.pdf (accessed on 3 October 2011).
  19. EMEP Programme. Available online: http://www.ceip.at/ms/ceip_home1/ceip_home/data/ (accessed on 17 October 2011).
  20. Courbis, R. The REGINA model a regional-national model of the French economy. Econ. Plan. 1972, 12, 133–152. Available online: https://doi.org/10.1007/BF00572831 (accessed on 20 October 2011). [CrossRef]
  21. Lindberg, F.; Thorsson, S.; Holmer, B. SOLWEIG 1.0—Modelling spatial variations of 3D radiant fluxes and mean radiant temperature in complex urban settings. Int. J. Biometeorol. 2008, 52, 697–713. [Google Scholar] [CrossRef] [PubMed]
  22. RWS-DWW. Available online: https://www.deltaexpertise.nl/wiki/index.php/HIS (accessed on 27 October 2011).
  23. Roorda, C.; Wittmayer, J. Transition Management in Five European Cities—An Evaluation; DRIFT, Erasmus University Rotterdam: Rotterdam, The Netherlands, 2014. [Google Scholar]
  24. Aarts, M. Lecture First Stakeholder Meeting 17th of May 2011; Gemeente Rotterdam: Rotterdam, The Netherlands, 2011. [Google Scholar]
  25. Gehl, J. Public Space—Public Life; The Danish Architectural Press: Copenhagen, Denmark, 2004. [Google Scholar]
  26. Gemeente Rotterdam. Groenplan Rotterdam; Gemeente Rotterdam: Rotterdam, The Netherlands, 2005. [Google Scholar]
  27. Gemeente Rotterdam. Rotterdamse Stijl, Bomenstructuurvisie; Gemeente Rotterdam: Rotterdam, The Netherlands, 2009. [Google Scholar]
  28. Projects for Public Spaces Inc. How to Turn a Place Around. A Handbook for Creating Successful Public Spaces; Projects for Public Spaces Inc.: New York, NY, USA, 2000. [Google Scholar]
  29. Tillie, N.; van den Dobbelsteen, A.; Doepel, D.; de Jager, W.; Joubert, M.; Mayenburg, D. Towards CO2 Neutral Urban Planning—Introducing the Rotterdam Energy Approach and Planning (REAP). J. Green Build. 2009, 4, 268–289. [Google Scholar] [CrossRef]
  30. Carney, S.; Shackley, S. The greenhouse gas regional inventory project (GRIP): designing and employing a regional greenhouse gas measurement tool for stakeholder use. Energy Policy 2009, 37, 4293–4302. [Google Scholar] [CrossRef]
  31. Van den Dobbelsteen, A.; de Wilde, S. Space use optimisation and sustainability—Environmental assessment of space use concepts. J. Environ. Manag. 2004, 73, 81–89. [Google Scholar] [CrossRef] [PubMed]
  32. Whyte, W.H. The Social Life of Small Urban Spaces; Edwards Brothers, Inc.: Ann Arbor, MI, USA, 1980. [Google Scholar]
Figure 1. Piet Blom’s ‘cubic houses’ in Rotterdam built in the 1980s (photo Ossip van Duivenbode, www.rotterdambrandingtoolkit.nl).
Sustainability 10 01927 g001
Figure 2. Research methodology for building a stakeholder-based urban densification agenda linking quality of life, liveability and sustainability performance. GIS = geographic information system; MUSIC = Mitigation in Urban Areas Solutions for Innovative Cities; CEO = Chief Executive Officer; TNO = toegepast-natuurwetenschappelijk Onderzoek; DRIFT = Dutch Research Institute For Transitions.
Sustainability 10 01927 g002
Figure 3. Sustainability profile outcome of the densification and greening strategy of the Rotterdam inner city (image by Doepel Strijkers Architects, Rotterdam).
Sustainability 10 01927 g003
Figure 4. (a) Reconstruction plan after World War II (courtesy City of Rotterdam). (b) Green densified inner-city plan as the built vision: city as a forest (image by Doepel Strijkers Architects, Rotterdam). This new vision gives a more central role to greening strategies.
Sustainability 10 01927 g004
Figure 5. Overview of the nine neighbourhoods studied for densification and greening (image by Doepel Strijkers Architects, Rotterdam).
Sustainability 10 01927 g005
Figure 6. Calculations per neighbourhood of potential new housing per densification strategy, which totals 20,250 (image by Doepel Strijkers Architects, Rotterdam). A short description is given per strategy.
Sustainability 10 01927 g006
Figure 7. Skyborn densification strategy, Didden Village in Middelland Rotterdam, by MVRDV (photo courtesy of Forgemind ArchiMedia, via https://www.flickr.com/photos/eager/15771369594/sizes/l www.creativecommons.org/licenses/by/2.0/).
Sustainability 10 01927 g007
Figure 8. (a) Mauritsstraat, Cool, infill densification strategy, by Kühne en Co. (Rotterdam, The Netherlands); (b) Boomgaardstraat, Cool, Kühne en Co. (photos by Nico Tillie).
Sustainability 10 01927 g008
Figure 9. Mapped overview of potential new dwellings per neighbourhood (image by Doepel Strijkers Architects, Rotterdam).
Sustainability 10 01927 g009
Figure 10. Calculations per neighbourhood of potential new green per greening strategy that totals 141.7 ha. (image by Doepel Strijkers Architects, Rotterdam). A short description is given per strategy.
Sustainability 10 01927 g010
Figure 11. Greening strategy of strengthening existing qualities, such as the Museumpark Rotterdam. Redesign of the Museumpark by Chris van Duijn OMA (Office for Metropolitan Architecture, Petra Blaisse Inside Outside and Nico Tillie (Delft University of Technology/City of Rotterdam).
Sustainability 10 01927 g011
Figure 12. Greening strategy of playgrounds: (a) Speeldernis or ‘Play Wilderness’ and (b) Green roof and green facades in the urban fabric in Singapore as examples (photos Nico Tillie).
Sustainability 10 01927 g012
Figure 13. Mapped overview of existing and potential green per neighbourhood (image by Doepel Strijkers Architects, Rotterdam).
Sustainability 10 01927 g013
Table 1. Overview of the outcomes of the transition arenas [23].
FromTowards
1. no-connected places (loose beads)1. connected inner city (a necklace of beads)
2. open festival area, gates and cleaning up2. everything is allowed provided its fits within a future proof structure (create your own dream world)
3. various communities going their own way in the city: little interaction or collaboration3.community feeling in which the public realm is the meeting place
4. municipality/companies make the city4. Rotterdam inhabitants make the city
5. alienation from outdoor space5. feeling at home, outdoor space becomes a living room
6.playing hide-and-seek6. making interests, places and existing energy visible

