Article

Green Product Development with Consumer Heterogeneity under Horizontal Competition

1
School of Management, Nanchang University, Nanchang 330031, China
2
School of Business Administration, Nanchang Institute of Technology, Nanchang 330099, China
*
Author to whom correspondence should be addressed.
Sustainability 2018, 10(6), 1902; https://doi.org/10.3390/su10061902
Submission received: 10 May 2018 / Revised: 1 June 2018 / Accepted: 1 June 2018 / Published: 7 June 2018
(This article belongs to the Collection Marketing and Sustainability)

Abstract

:
In this paper, we explore the pricing and greenness issues of two competitive firms without and with consumer heterogeneity. We derive and compare the optimal solutions and profits employed by firms under different scenarios. Then, we identify the effects of consumer heterogeneity under different competition intensities. The analytical results reveal that if market competition is at a relatively low level, we find that: (i) when the greenness sensitivity of consumers with no preference is sufficiently small, more consumers have high environmental awareness, and companies easily achieve their environmental goals as well as economic goals; (ii) when the greenness sensitivity of consumers with no preference is at a medium level, as the fraction of consumers with high environmental awareness increases, and the firm might achieve economic goals at the cost of reducing environmental goals; and (iii) when the greenness sensitivity of consumers with no preference is at a high level, the fraction of consumers with high environmental awareness increases, but firms might have more difficulty achieving their environmental and economic goals. On the other hand, if the market competition is at a relatively high level, the presence of consumer heterogeneity can help improve environmental goals, but make achievement of economic goals difficult.

1. Introduction

Environmental issues have been attracting widespread attention in recent years. Governments have publicized the importance of environmental protection with the goal of sustainable development. As consumers become more environmentally conscious, an increasing number of people are willing to purchase green products [1]. There are several studies focusing on green product purchasing, such as Chen [2], who found that more and more customers are willing to pay a higher price for green products. Bei and Simpson [3] showed that consumers can obtain psychological benefits from purchasing green products. In addition, many firms acknowledge that green innovation benefits their operational performance and social influence [4]. Therefore, many firms have been focusing considerable attention to producing and marketing green products. A variety of green products are currently available in the market, such as electric vehicles, non-phosphate laundry powder, and solar water heaters.
To promote sustainable development, governments are exerting impressive effort to control environmental impact by promulgating related regulations for firms especially in the manufacturing industries. However, firms must invest more in research and development (R&D) to green their products to comply with regulations. For example, the U.S. Congress issued the first tailpipe emission standards in 1970. Since that time, automakers have developed new technologies of emission control equipment to meet stringent emission standards. From 1975 to 1981, several big manufacturers, such as Chrysler Ford and GM, have adopted new technologies, especially in engine technology, such as oxidation catalyst and diesel engines. Therefore, the average retail price of automobiles rose by about $280 in 1975 as a result of emission improvements [5]. With increasingly stringent emission standards and eventually a zero emission requirement, automakers are dedicated to the R&D of new energy vehicles, such as Blade, Hybrid, and Fuel Cell, to meet these standards.
Generally, technological innovation is accompanied by an increase in costs, mainly in R&D. This increase could lead to higher prices for new products. As a result, consumers would be discouraged from buying green products because of high prices. When consumers face products with the same functionality but different greenness, such as electric and fuel cars, they may comprehensively measure the product’s performance, price, and greenness, and choose to buy the product based on utility. Individuals with strong environmental awareness are more inclined to buy green products despite the higher prices. Therefore, we assume that there are two types of consumers in the market, namely the no preference and preference for green products consumers. It is different from the setting of Chen [6], wherein consumers were divided into preference for ordinary products and green products consumers. To our best knowledge, few studies have considered consumer heterogeneity in studies related to green product development.
When consumers have no preference for products, a firm that produces ordinary products does not have strong desire to develop green products. However, when consumers prefer green products, a firm producing ordinary products has to develop green products to expand its market. A high greenness product will inevitably bring greater R&D costs and the firm will increase prices accordingly to make up for the costs. Consequently, high prices will make firms lose their advantages in competition. Thus, firms are faced with how to balance this tradeoff efficiently and the question of what are the optimal product greenness and pricing decisions under competition with consumer heterogeneity. Although these issues are important for firms, research has yet to study such matters. We will attempt to solve these problems in this study.
Motivated by industrial practices and unexplored research questions regarding green product development, we develop an analytical model where one firm produces green products and the other firm chooses whether to produce ordinary or green products. Two market settings are considered, which are (i) only consumers without a product preference and (ii) two types of consumers in the market: no preference for products and preference for green products consumers. Consumers without a product preference decide whether to purchase a green product or an ordinary product on the basis of utility. Consumers who prefer green products will select green products despite high prices and shopping costs. We derive and compare the firms’ green product development strategies and pricing decisions under competition with or without consumer heterogeneity. In addition, we identify the conditions under which the firm can benefit from the development of green products. To the best of our knowledge, this paper is the first to study the pricing and greenness issues of two competitive firms with such consumer heterogeneity.
The paper is organized as follows. We summarize the related literature in Section 2. We introduce the basic models to formulate consumer behavior under different scenarios in Section 3. Section 4 analyzes the optimal product greenness and pricing decisions without and with consumer heterogeneity. Section 5 examines the effects of consumer heterogeneity by numerical analysis. We conclude the paper in Section 6. All proofs are showed in the Appendix.

2. Literature Review

This paper investigates greenness efforts and pricing under horizontal competition with consumer heterogeneity. Therefore, this study is mainly related to two streams of research, namely green product development and green supply chain management.
Green product development has received substantial attention from governments and industries as a result of reducing the impact on the environment through product design and technology innovation [7]. To comply with government regulations, firms have adopted many strategies to deal with changes in reducing pollution. Life cycle assessment is an approach used to assess environmental impact and identify an environmental “hot spots” cycle during a product’s whole life cycle [8]. Taxonomy of eco-design is an effective way to integrate environmental requirements during the product design stage [9]. Other studied tools include Design for Environment, Quality Function Deployment, and Life Cycle Costing [10,11,12].
Researchers have attempted to define green products [13,14]. The terminology has changed from green or eco to sustainable, which shows a broadening of the scope, but these terms are always used interchangeably [14]. In this paper, we adopt the definition of green product consistent with Albino et al. [14], i.e., a “green product” is referred to as a product designed to minimize its environmental impact during its whole life cycle. Different from those papers describing only the concepts of green products, the following scholars classify the nature of green products from the perspective of cost [15,16,17]. As summarized in Qian [17], products are divided into three classifications: development-intensive products (DIPs) with a variable fixed cost, marginal cost-intensive products (MIPs) with a variable unit cost, and marginal and development-intensive products (MDIPs) with variable fixed and unit costs. In this study, we focus on development-intensive green products (DIGPs). For DIGPs, the product’s greenness depends mainly on R&D efforts and equipment upgrade, but is less relevant to the variable unit cost, such as labor hours. Therefore, this study assumes that the cost function is a quadratic of greenness on the basis of Krishnan and Zhu [18].
Green supply chain management has attracted widespread attention over the last decade. Simpson and Power [19] defined a green supply chain as a firm and its suppliers working together to reduce the impact on the environment by greening products and production processes. Green supply chain management integrates environmental issues into supply chain management processes by evaluating the environmental performance of suppliers with the goal of waste minimization [20]. Most studies investigated the issue by utilizing a case study or survey research [21]. Several studies investigated the issue by utilizing an analytical model in recent years [22,23,24,25,26,27,28,29,30]. Ghosh and Shah [22] developed an analytical model and studied the effect of channel structures on greening efforts and prices. They showed that cooperation among players results in higher greening levels, while greening leads to a higher retail price. Swami and Shah [23] investigated the greening efforts of each channel member in a vertical supply chain and reported that efforts and profits are higher in an integrated scenario as compared to a decentralized scenario. Consequently, a two-part tariff contract was proposed to coordinate the supply chain. Wang et al. [24] considered pricing and inventory strategies in a supply chain with demand leakage and a return-policy contract, and proved that a buyback contract can improve the supply chain’s profit when facing high demand uncertainty. Guo et al. [25] considered a supply chain with a supplier and a manufacturer and explored the effects of different government subsidy policies on supply chain members’ greenness efforts and social welfare. He et al. [26] focused on a dual-channel, closed-loop supply chain with a manufacturer and two retailers (a traditional retailer and an online retailer) and studied the influences of carbon emissions on all channel members’ decisions and social welfare. This research showed that governments may give a subsidy to the online retailer with the goal of maximizing the social welfare. Ji et al. [27] considered a manufacturer–retailer setting and explored the effects of cap-and-trade regulation and a consumer low-carbon preference on supply chain members’ emission reduction behaviors. The findings indicated that when consumers have a strong low-carbon preference, this regulation can be accepted by supply chain members. Li et al. [28] investigated the effects of different cooperation programs on a manufacturer’s optimal carbon emission level and retailers’ optimal low-carbon promotion efforts. Liu et al. [29] considered a “single manufacturer and single retailer” supply chain and explored the influences of carbon tax regulation and fairness concerns on supply chain members’ sustainability efforts. They showed that carbon tax regulation can positively influence the manufacturer’s product sustainability level, while fairness concerns reduce the product sustainability level. Zhu and He [30] studied green product design issues under three different supply chain structures and explored the influences of competition on supply chain members’ pricing and greenness efforts. The results indicated that price competition may positively affect optimal greenness, while greenness competition decreases optimal greenness.
None of the above studies considered market segmentation. To the best of our knowledge, only a few papers related to green supply chain management studied market segmentation by identifying consumer heterogeneity [6,31,32]. Chen [6] considered two market segments, namely ordinary and green segments, which are based on consumer preference. Similarly, Raza et al. [31] divided the market into regular and green segments, which is yielded by adopting price discrimination. Zhao et al. [32] studied a remanufacturing market and assumed that the consumer preference for the environment is continuous. Unlike the above studies, two types of consumers are considered in the current paper: one is consumers who prefer green products, i.e., they prefer green products over ordinary products, and the other is consumers who have no preference for a product, i.e., those consumers consider both price and greenness factors.

3. Model Development

3.1. Firms

We consider two competing firms in a market situated at the endpoints of a united consumption interval or linear city, namely x = 0 and x = 1 . One of the firms produces green products and the other chooses to produce ordinary or green products. The functions of ordinary and green products are the same. Ordinary and green products have market competitiveness and are conducive to profitability goals. The difference is that green products meet the requirements of environmental protection throughout their entire life cycle and are harmless or minimally harmful to the environment.
This paper focuses on development-intensive green products (DIGPs) with a constant unit cost and a non-constant fixed cost as mentioned in the above literature [17,18]. The firms invested substantially in R&D expenditures to improve product greenness θ . Other costs, such as tooling and labor, are constant and normalized to zero in our model for simplicity. This simplification does not affect the management results of the model and is used commonly in related literature [30,33]. As a result, the non-constant fixed cost of green products is k θ 2 on the basis of Krishnan and Zhu [18], where k denotes the cost coefficient. Additionally, the constant unit cost of both ordinary and green products is c .
The timing of the game in the basic model is as follows. Firms first determine greenness and then choose prices. Given that both firms have equal power, they make decisions at each stage simultaneously.

3.2. Consumers

First, to model a consumer’s shopping cost, including transportation and time costs, we assume that consumers are distributed uniformly in a unit line segment, i.e., x ~ U [ 0 , 1 ] . A consumer who is at x incurs a cost t x or t ( 1 x ) when shopping from firm 1 or 2, respectively. Obviously, a consumer who travel to stores closer to him/her have a lower transportation cost.
Second, to examine consumer behaviors toward different products, consumer heterogeneity is taken into consideration. In the real world, consumers have personal preferences, and the difference in preferences is the heterogeneity of consumers. In this paper, we assume consumers to be heterogeneous in a product environmental attribute. The market is divided into two segments. First, consumers with strong awareness of environmental protection will always think highly of the environmental attribute of products. Therefore, these consumers will definitely select green products when green and ordinary products are available. Second, the remaining consumers with low environmental awareness have no preference for these products. Hence, these consumers may measure the product’s performance, price, and greenness comprehensively, and ultimately choose the product based on utility. We assume that the fraction of consumers preferring green products is α and the remaining with no preference is 1 α .

3.3. Notation and Consumer Utility

We summarize the notations in Table 1.
In this study, we compare product greenness and pricing decisions of two competing firms under two marketing structures. We consider the scenarios without consumer heterogeneity and then with consumer heterogeneity. More specifically, in both scenarios, we consider two separate sub-scenarios in each scenario. First, firm 1 produces green products and firm 2 produces ordinary products at the same time. Second, firms 1 and 2 produce green products. Therefore, four different scenarios are examined in the current paper. We derive optimal greenness and pricing decisions and analyze the effects of competition and consumer heterogeneity on green product development and profits in the next two sections. The optimal solutions refer to solutions that maximize the profit of a firm. Thus, optimal greenness means the greening level of the product designed to achieve profit maximization.
Using the notations shown in Table 1, we can formulate the utility of a consumer who purchases from each firm in different scenarios. When purchasing a green or ordinary product from firm 1 or 2 under the scenario without consumer heterogeneity (scenario 1), he or she located at x can obtain anticipated utilities, which are as follows:
u 1 1 = v p 1 1 + γ θ 1 1 t x ,
and
u 2 1 = v p 2 1 t ( 1 x ) .
Note that in scenario 1, firms 1 and 2 produce green and ordinary products, respectively. We distinguish the two products using greenness. Given that all consumers in the market have no preference for the products, they compare utility u 1 1 and utility u 2 1 , and then choose to purchase green products from firm 1 if u 1 1 > u 2 1 , and purchase ordinary products from firm 2 otherwise.
In scenario 2, firms 1 and 2 elect to produce green products, and the utility functions of consumers who purchase from firms 1 and 2 are as follows:
u 1 2 = v p 1 2 + γ θ 1 2 t x ,
and
u 2 2 = v p 2 2 + γ θ 2 2 t ( 1 x ) .
We consider consumer heterogeneity in the next two scenarios in which two market segments are formed. In one market, consumers prefer green products and in the other market, consumers have no preference (denoted by segments g and n , respectively). The sizes of the two segments are α and 1 α , respectively. Consumers in segment g value the green product with greenness θ at δ θ , while consumers in segment n value the green product at γ θ , and we have δ > γ . The relation is reasonable because a consumer with higher environmental awareness can obtain additional psychological benefits from purchasing green products, which has been supported by an empirical study of Bei and Simpson [3]. On the other hand, a consumer who has no preference is likely to buy ordinary products because of the low price, especially when the price of green products is high. Therefore, consumers in segment g will purchase green products, and consumers in segment n will choose from two products.
In scenario 3, firm 1 produces green products and firm 2 produces ordinary products. A consumer in segments g and n purchasing a green product from firm 1 can respectively obtain expected utilities of
u 1 3 g = v p 1 3 + δ θ 1 3 t x ,
and
u 1 3 n = v p 1 3 + γ θ 1 3 t x .
In addition, a consumer located at x purchasing an ordinary product from firm 2 can obtain a utility of
u 2 3 n = v p 2 3 t ( 1 x ) .
Next, in scenario 4, firms 1 and 2 produce green products. A consumer in segment g purchasing from firms 1 and 2 can obtain expected utilities, which are expressed as follows:
u 1 4 g = v p 1 4 + δ θ 1 4 t x ,
u 2 4 g = v p 2 4 + δ θ 2 4 t ( 1 x ) .
A consumer in segment n purchasing from firms 1 and 2 can obtain expected utilities of
u 1 4 n = v p 1 4 + γ θ 1 4 t x ,
u 2 4 n = v p 2 4 + γ θ 2 4 t ( 1 x ) .

4. Analysis

We begin our analysis by considering the benchmark scenario without consumer heterogeneity and then proceed to the scenario with consumer heterogeneity. Note that in all scenarios, we derive optimal solutions under the condition that the market is fully covered, i.e., the consumer located at x is indifferent between the two firms and the utility is to be zero.
As the analyses of several solutions are complex, we illustrate the relationships between the optimal solutions and parameters in figures. In all figures, we allow parameter γ to change in reasonable ranges. The specific assignments of all parameters are given in Appendix A. Additionally, the proof processes for obtaining optimal solutions are also summarized in Appendix A.

4.1. Benchmark: Product Development without Consumer Heterogeneity

A situation in the real world is that all consumers in a particular market have weak environmental awareness and are less sensitive to green products. We first consider such a market and regard the situation as a benchmark scenario. Two product development strategies are investigated in the benchmark. All proofs can be found in Appendix A.

4.1.1. Scenario 1

Two firms are in the market developing products simultaneously. Firm 1 produces green products with greenness θ , which incurs an R&D investment k θ 2 , i.e., the main fixed cost, and the unit variable cost is a positive constant denoted by c . Firm 2 produces ordinary products. The fixed cost is assumed to be zero for simplicity, and the unit variable cost is c . Then, the expected profits of firms 1 and 2 are given by
π 1 1 = ( p 1 1 c ) x k ( θ 1 1 ) 2 ,
π 2 1 = ( p 2 1 c ) ( 1 x ) .
Firm 1 first decides product greenness and then the price to maximize its expected profit. Firm 2 decides product price to pursue profit maximization. The optimal solutions of these decision variables and profits are presented in Table 2.
We can obtain the following propositions by comparing the optimal solutions in Table 2.
Proposition 1.
(i) If γ 2 < 18 k t , then firm 1 produces green products, else firm 1 does not produce; (ii) If γ 2 < 9 k t , then firm 2 produces ordinary products, else firm 2 does not produce; (iii) Comparing the equilibrium prices of two products, we have p 1 1 > p 2 1 ; (iv) Comparing two firms’ profits, we have π 1 1 > π 2 1 if γ 2 < 13.5 k t .
Proposition 1 reveals that firm 1 will not develop green products when consumers’ greenness sensitivity reaches a threshold. The intuition for this result can be explained as having two aspects. The first is the positive effect that a high green sensitivity of consumers induces firms to produce products with high greenness, which can be seen from θ / γ > 0 . This strategy will evidently attract more potential consumers to buy the products. However, high product greenness requires the firm to invest substantial costs, especially in R&D ( k θ 2 ), thereby resulting in a second effect that high risk makes firms end up developing green products. For firm 2, only when consumers’ greenness sensitivity is relatively low will the firm produce ordinary products. Only green products can capture the market if individual environmental awareness is strong. When condition 9 k t < γ 2 < 18 k t holds, only green products are in the market for the reason that firm 2 has no incentive to produce ordinary products.
With regard to product prices, firm 1 can set a higher price for its green products, because the environment attributes of the product will benefit consumers. Firm 2 can only set a low price to attract consumers, because ordinary products are not competitive in terms of environmental protection. As can be seen from p 1 1 / γ > 0 , p 2 1 / γ < 0 , p 1 1 / θ > 0 , and p 2 1 / θ < 0 , with the increase in consumers’ greenness sensitivity and product greenness, the prices of green and ordinary products change in the opposite direction. Consequently, the price of green products is always higher than that of ordinary products in this scenario.
Finally, Proposition 1 reveals that when the greenness sensitivity of consumers is not extremely high, the profit of firm 1 must be higher than that of firm 2. We illustrate the intuition as follows. Firm 1 can attract the most number of consumers ( x = 0.5 + γ θ / 6 t ) because its products are environmentally friendly. Additionally, firm 1 can set a higher price, which allows the firm to obtain relatively larger benefits and make up for costs. The conditions are opposite for firm 2.

4.1.2. Scenario 2

We now consider the scenario of two competing firms, where both firms produce green products and simultaneously decide on the greenness and then price. The expected profits of firms 1 and 2, respectively, are given by
π 1 2 = ( p 1 2 c ) x k ( θ 1 2 ) 2 ,
π 2 2 = ( p 2 2 c ) ( 1 x ) k ( θ 2 2 ) 2 .
The optimal solutions are presented in Table 3.
We can obtain the following propositions by comparing the optimal solutions in Table 3.
Proposition 2.
(i) If γ 2 < 18 k t , the two firms will produce green products; (ii) Comparing the solutions of two firms, we have θ 1 2 = θ 2 2 , p 1 2 = p 2 2 , and π 1 2 = π 2 2 , and the prices of two products are constant; (iii) The sensitivity analyses of the greenness sensitivity of consumers are θ j 2 / γ > 0 , p j 2 / γ = 0 , and π j 2 / γ < 0 .
Proposition 2 indicates that two competing firms producing the same type of products will adopt the same product development strategies, i.e., the same greenness and price. The same strategies result in the highest competition intensity between the two firms. With the same greenness policy, neither firm has incentive to increase or decrease the price. The two firms keep prices equal and unchanged to maintain equilibrium. Only the purchasing cost determined by the location of a consumer affects his or her purchasing behavior in this case. As a result, the two firms will share the market equally, which is evident from x = 1 / 2 .
We also find that in contrast to scenario 1, the prices of green products depend on the difference in the greenness of the two products. The prices are constant because the two firms develop products with the same greenness. Under a competitive environment, improving the heterogeneity of products is a significant factor to seize consumers. While products with the same greenness bring the same environmental benefits for consumers, the degree of greenness will obviously not matter in consumer choices.
Finally, the firms’ profits will decrease with the increase in consumers’ greenness sensitivity. The main reason is that a high greenness sensitivity results in high products’ greenness leading to huge R&D costs, and while the prices remain unchanged, profits will decline. As the two firms are independent, no one would dare take the lead in raising prices without considering conspiracy. Otherwise, the firm might lose the price advantage and completely fail.

4.1.3. Comparative Analysis between Two Scenarios

We can obtain the following proposition by comparing the optimal solutions of two scenarios.
Proposition 3.
Comparing the optimal solutions of two scenarios, we have θ 1 1 > θ 1 2 , p 1 1 > p 1 2 , and p 2 1 < p 2 2 .
Proposition 3 reveals that the greenness of products in scenario 2 where the two firms manufacture identical products is lower than that in scenario 1 where the two firms manufacture heterogeneous products. Two main factors are at play when the firm decides on greenness in scenario 2. One is the market size constraint. Each firm owns half of the market, and thus the firms cannot expand the market by improving the greenness of their products. Cost is the other constraint. The production of green products requires significant costs in R&D. Firms cannot develop products with higher greenness with the goal of profit maximization. In scenario 1, only one firm is producing green products. Thus, the firm is more likely to develop products with high greenness to attract more consumers.
As might be expected, the price of green products in scenario 2 is lower than that in scenario 1. The main reason is that only firm 1 produces green products in scenario 1, and has incentive to charge a relatively high price for its product’s environmental attribute. In scenario 2, two firms manufacture green products simultaneously. If one of the firms sets a higher price, that firm might lose the price advantage and consequently lose potential consumers.
The price of ordinary products is lower than that of green products. From the perspective of the firm, the production of green products brings high R&D costs, which will set a high price correspondingly. Consumers are more willing to pay higher prices because green products can reduce their environmental impact.
Given that expressions of profits are complex, we illustrate the equilibrium in Figure 1. The figure shows the relationships between consumers’ greenness sensitivity and firms’ profits under the two scenarios.
Figure 1 indicates that the profit of firm 1 increases first and then decreases as the greenness sensitivity of consumers increases, which was already explained above. We focus on the profits of the two firms in scenarios 1 and 2, respectively. First, firm 1’s profit in scenario 1 is absolutely larger than that in scenario 2 when the greenness sensitivity of consumers is not sufficiently high. The intuition of this result might be that competition intensity is highest in scenario 2 and lowest in scenario 1. Second, for firm 2, the profit in scenario 2 is always larger than that in scenario 1. Therefore, a better choice for firm 2 is to produce green products that can be beneficial to the environment while achieving economic goals.

4.2. Product Development with Consumer Heterogeneity

We now turn to the scenario with two market segments by examining consumer heterogeneity. Note that in one market, consumers prefer green products (denoted by segment g ), and in the other market, consumers have no preference (denoted by segment n ). The sizes of the two segments are α and 1 α , respectively. Two sub-scenarios similar to the one above are considered next.

4.2.1. Scenario 3

Similar to that in scenario 1, firm 1 produces green products and firm 2 produces ordinary products. Given that consumers in segment g have higher environmental awareness, all consumers will choose green products. The remaining consumers without a preference will purchase based on the utility of the products. Thus, the market demand of firm 1 is at least α , i.e., the size of segment g . The expected profits of firms 1 and 2 are, respectively, as follows:
π 1 3 = ( p 1 3 c ) ( α + ( 1 α ) x ) k ( θ 1 3 ) 2 ,
π 2 3 = ( p 2 3 c ) ( 1 α ) ( 1 x ) .
The optimal decisions and profits are shown in Table 4.
Proposition 4 can be obtained by comparing the optimal greenness and prices under two scenarios.
Proposition 4.
(i) If γ 2 < 18 k t / ( 1 α ) , then firm 1 produces green products, else firm 1 does not produce; (ii) If γ 2 < ( 9 3 α ) k t / ( 1 α ) , then firm 2 produces ordinary products, else firm 2 does not produce; (iii) Comparing the equilibrium prices of two products, we have p 1 3 > p 2 3 ; (iv) Both products’ prices are increasing in α (i.e., p j 3 / α > 0 ); (v) If α 0.6 , there must be some consumers in segment n purchasing green products; if α > 0.6 , when γ θ > t ( 5 α 3 ) / ( 1 α ) , then there are some consumers in segment n purchasing green products, else no one in segment n will purchase green products.
Consistent with scenario 1, the price of ordinary products is lower than that of green products. This result is similar to that in scenario 1, and thus will not be repeated in this section. Given that consumers in segment g choose green products, as the size of this segment increases, the firm producing green products will improve the price to increase profit. However, an increase in price may hurt its market size. Consumers in the market with no preference are more likely to end up footing the bill for the higher price of green products. Moreover, consumers with a low transportation cost will purchase the ordinary product. For the firm that produces ordinary products, more consumers in segment n will buy ordinary products as the size of segment g increases, which can be seen from x = 0.5 + γ θ / 6 t α / 3 ( 1 α ) . Therefore, the firm would have a strong desire to increase the price to pursue higher profit as α increases.
For consumers with no preference, some will definitely purchase green products if α 0.6 . In this case, the price of green products is low and consumers with low transportation cost in segment n are probably buying green products. If α > 0.6 , which means the price of green products is high, consumers will choose green products only when the value of green products is sufficiently large (i.e., γ θ > t ( 5 α 3 ) / ( 1 α ) ), otherwise they will not make a purchase.
Table 4 indicates that the greenness of products and expected profit are affected by α , i.e., the fraction of consumers who prefer green products. To analyze the impact of α further, we have Proposition 5.
Proposition 5.
(i) If γ 2 < 4.5 k t , greenness and expected profit are both increasing in α (i.e., θ / α > 0 and π 1 / α > 0 ); (ii) If 4.5 k t < γ 2 < 11.25 k t , the optimal greenness is decreasing in α , while the expected profit is increasing in α (i.e., θ / α < 0 and π 1 / α > 0 ); (iii) If 11.25 k t < γ 2 < 18 k t , the greenness and expected profit are both decreasing in α (i.e., θ / α < 0 and π 1 / α < 0 ).
It is interesting to note that the relationship between greenness (or expected profit) and the fraction of consumers who prefer green products is not absolute. Proposition 5(i) can be understood as follows. When the greenness sensitivity of consumers in segment n is at a low level, attracting customers by increasing the greenness would be difficult. Thus, a firm will focus on consumers in segment g . As the size of segment g increases, the firm will increase greenness. As a result, the firm can charge a higher price to obtain higher profit. In this situation, more consumers in segment n would purchase green products, which is evident from x = 0.5 + γ θ / 6 t α / 3 ( 1 α ) . The outcome of Proposition 5(iii) is the opposite. When the greenness sensitivity of consumers in segment n is at a high level, seizing consumers in segment n would be easy by producing products with high greenness. In this case, the greenness is at a high level and R&D expenditure is costly. Therefore, the firm may increase greenness to attract consumers in segment n to achieve market expansion only when the fraction of segment g is small. Additionally, given that optimal greenness and profits have different thresholds as α increases, Proposition 5(ii) is presented. When the greenness sensitivity of consumers in segment n is at a medium level, the greenness decreases while the profit increases in α .
In summary, we reach important and insightful conclusions. First, when the greenness sensitivity of consumers with no preference is sufficiently small, and more consumers have high environmental awareness, companies could easily achieve their environmental goals (reflected by greenness) and economic goals (reflected by profit). However, greenness and profit are at low levels in this situation. The government must strengthen efforts to promote awareness of environmental protection. Improvement in public awareness of environmental protection is the driving force behind the production of green products.
Second, when the greenness sensitivity of consumers with no preference is at a medium level, the firm might achieve economic goals at the cost of reducing environmental goals as the fraction of consumers with high environmental awareness increases. In this case, government should subsidize R&D efforts to stimulate the production of products with high greenness.
Finally, greenness and profit are at high levels when the greenness sensitivity of consumers with no preference is at a high level. In this situation, firms would have difficulty in achieving their environmental goals (reflected by greenness) and economic goals (reflected by profit) as the fraction of consumers with high environmental awareness increases. Therefore, in a society where consumer awareness of environmental protection is generally high, the government should focus on supporting the development of firms’ green products rather than publicizing environmental awareness.

4.2.2. Scenario 4

In this scenario, firms 1 and 2 produce green products simultaneously. Consumers in the two market segments choose which product to buy based on utility. The expected profits of the two firms are
π 1 4 = ( p 1 4 c ) ( α x 1 + ( 1 α ) x 2 ) k ( θ 1 4 ) 2 ,
π 2 4 = ( p 2 4 c ) ( α ( 1 x 1 ) + ( 1 α ) ( 1 x 2 ) ) k ( θ 2 4 ) 2 .
The optimal solutions are presented in Table 5.
We obtain the following propositions by comparing the optimal solutions in Table 5.
Proposition 6.
(i) If ( α δ + ( 1 α ) γ ) 2 < 18 k t , the two firms will produce green products; (ii) Comparing the solutions and profits of two firms, we have θ 1 4 = θ 2 4 , p 1 4 = p 2 4 , and π 1 4 = π 2 4 , and the prices of the two products are constant; (iii) The sensitivity analyses are: θ j 4 / ζ > 0 , p j 4 / ζ = 0 , and π j 4 / ζ < 0 , where the expression α δ + ( 1 α ) γ denoted by ζ is termed the “average greenness sensitivity”.
Consistent with scenario 2, when two competing firms with the same power manufacture the same products, they will adopt the same development strategies. As a result, they will share the market equally ( x 1 = x 2 = 0.5 ) and obtain the same profits.
For convenience of analysis, we define a new term denoted by ζ , which is the average greenness sensitivity. As can be seen from the expression α δ + ( 1 α ) γ , an increase in any one of the parameters (i.e., α , δ , and γ ) will lead to an improvement in the average greenness sensitivity. Therefore, we only analyze the effect of ζ on firms’ optimal decisions and profits.
As the average greenness sensitivity increases, both firms will improve the greenness of their products. However, the prices are not affected by this factor. The prices maintain equilibrium because the products produced by the two firms are homogeneous in greenness. Neither one of the firms will break this equilibrium. Surprisingly, high consumer greenness sensitivity can hurt the firms. The firms’ profit will inevitably decline because of the increase in R&D costs and the price remaining at the same level.

4.2.3. Comparative Analysis between Two Scenarios

We can obtain the following proposition by comparing the optimal solutions of the two scenarios. Given that the expressions of several solutions are complex, we illustrate the equilibrium in Figure 2, Figure 3, Figure 4, Figure 5 and Figure 6.
Proposition 7.
Comparing the optimal solutions of the two scenarios, we have p 1 3 > p 1 4 .
As can be expected, the price of green products in scenario 3 is higher than that in scenario 4. The implication of this result is that green products are competitive in scenario 3 and the firm can set a higher price to capture consumer surplus value. From this perspective, improving competition intensity will benefit consumers.
However, it is interesting to note that the prices of the ordinary and green products produced by firm 2 are not absolute. In different situations, the price of the two products might be the opposite outcome. In particular, when the greenness sensitivity of consumers without a preference is low, the price of ordinary products is larger than that of green products. On the contrary, when greenness sensitivity is high, the price of ordinary products is lower than that of green products. This relationship is seen clearly in Figure 2 and is consistent with Figure 4. When greenness sensitivity is low (high), the profit brought about by ordinary products is larger (lower) than the profit of green products. The implication of this finding is that it identifies the condition under which the firm should develop green or ordinary products. When faced with a market where consumers’ environmental awareness is generally high, producing green products would be better, otherwise producing ordinary products would be preferred.
For firm 1, which produces only green products, when the intensity of competition is sufficiently small, the profit increases as greenness sensitivity increases. Hence, when the intensity of competition is sufficiently large, the profit decreases as greenness sensitivity increases. The profit in a condition with low competition intensity is always larger than that with high competition intensity. This relationship highlights that when competition intensity is low, i.e., product heterogeneity is high, the firm that produces green products could then achieve economic goals.
Another significant point is illustrated by Figure 3. The greenness of products is increasing when the greenness sensitivity of consumers increases, which has been proved analytically. On the one hand, when the greenness sensitivity is low, the firm will produce products with high greenness when faced with high competition intensity but will produce products with low greenness when faced with low competition intensity. Thus, when competition intensity is low, the firm cannot achieve high environmental goals. At this point, competition can inspire firms to develop products with higher greenness. On the other hand, the situation is just the opposite when greenness sensitivity is high. Therefore, the firm can achieve high environmental goals when the competition intensity is low.
Finally, from Figure 5 and Figure 6, in scenario 3, where firm 1 produces green products and firm 2 produces ordinary products, we find that (1) under certain conditions γ 2 < 4.5 k t , as the fraction of consumers preferring green products α increases, firm 1’s profit will go up. In particular, when α is sufficiently large, the firm will obtain a huge rise in profit; (2) as for firm 2, the relationship between expected profit and the fraction of consumers preferring green products is not absolute. In particular, when α is at a low level, the profit is increasing in α . On the contrary, when α is at a high level, the profit is decreasing in α . Hence, from a management standpoint, when the fraction of consumers preferring green products is not sufficiently large, the two firms would gain more profit by producing green or ordinary products.
In Figure 6, scenario 4 shows that when the two firms produce green products, the expected profits are decreasing with the fraction of consumers preferring green products. This relationship also shows that it is difficult for firms to achieve economic goals when the competition intensity is very high.

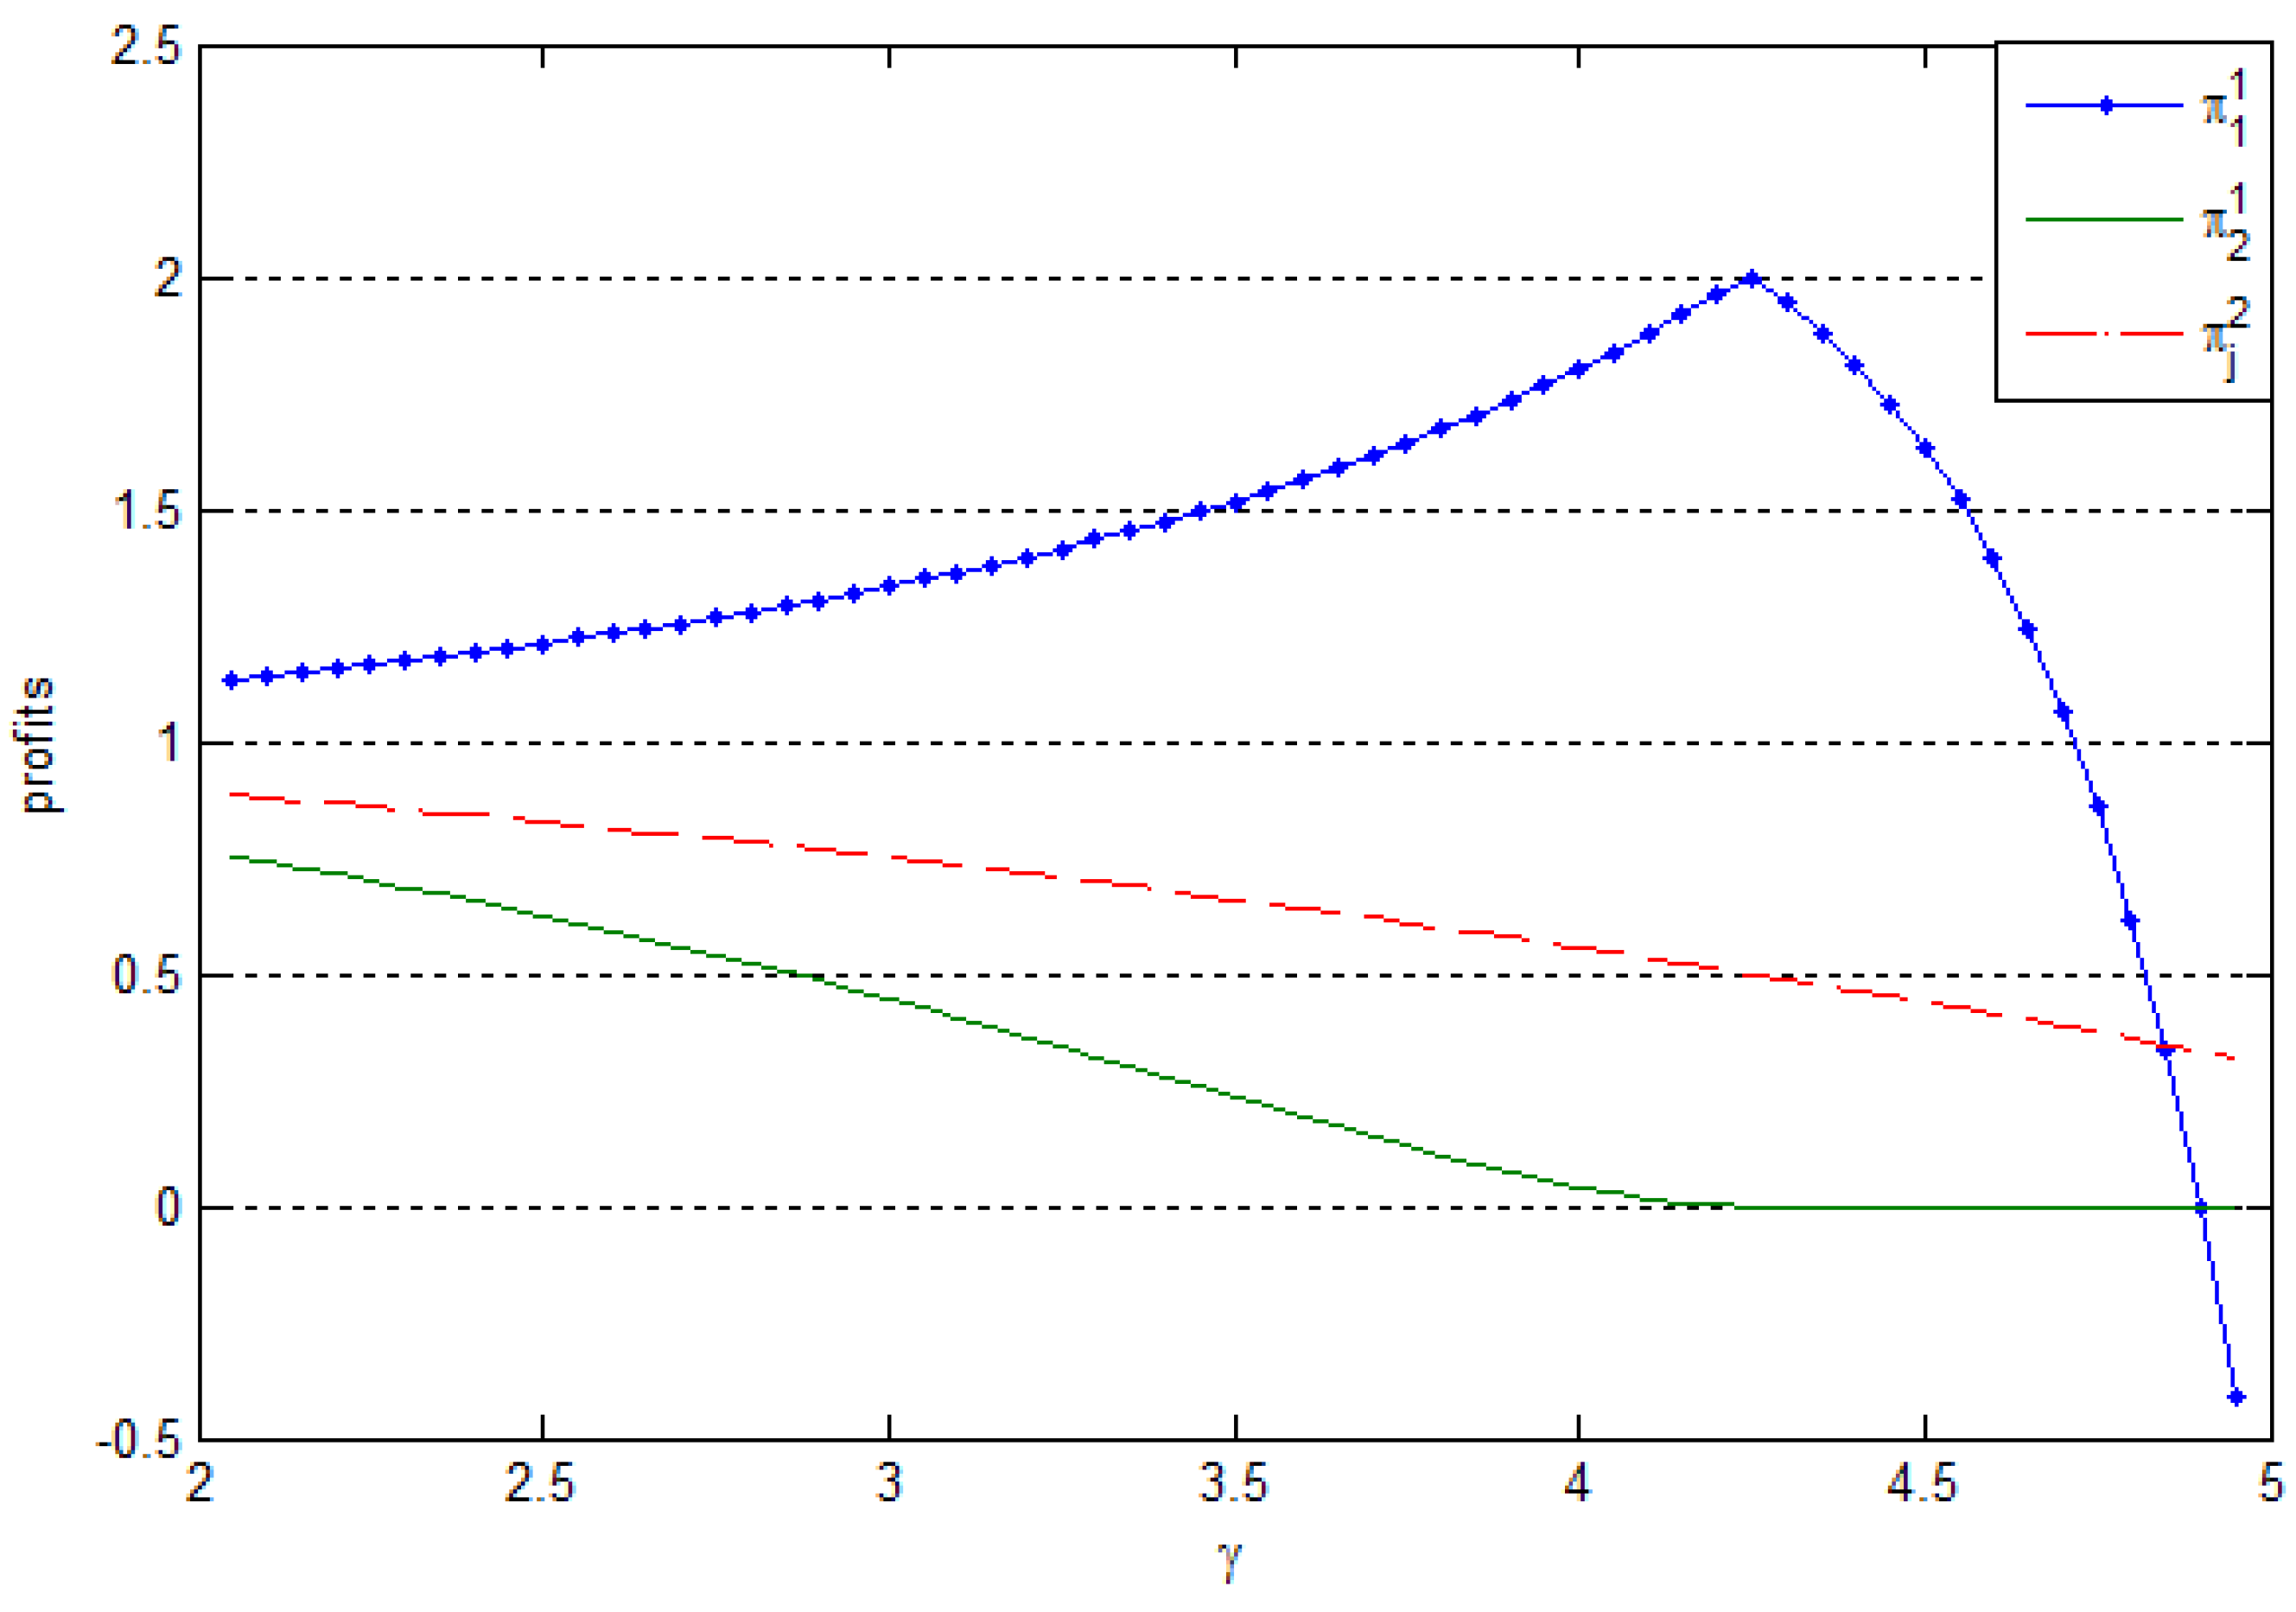
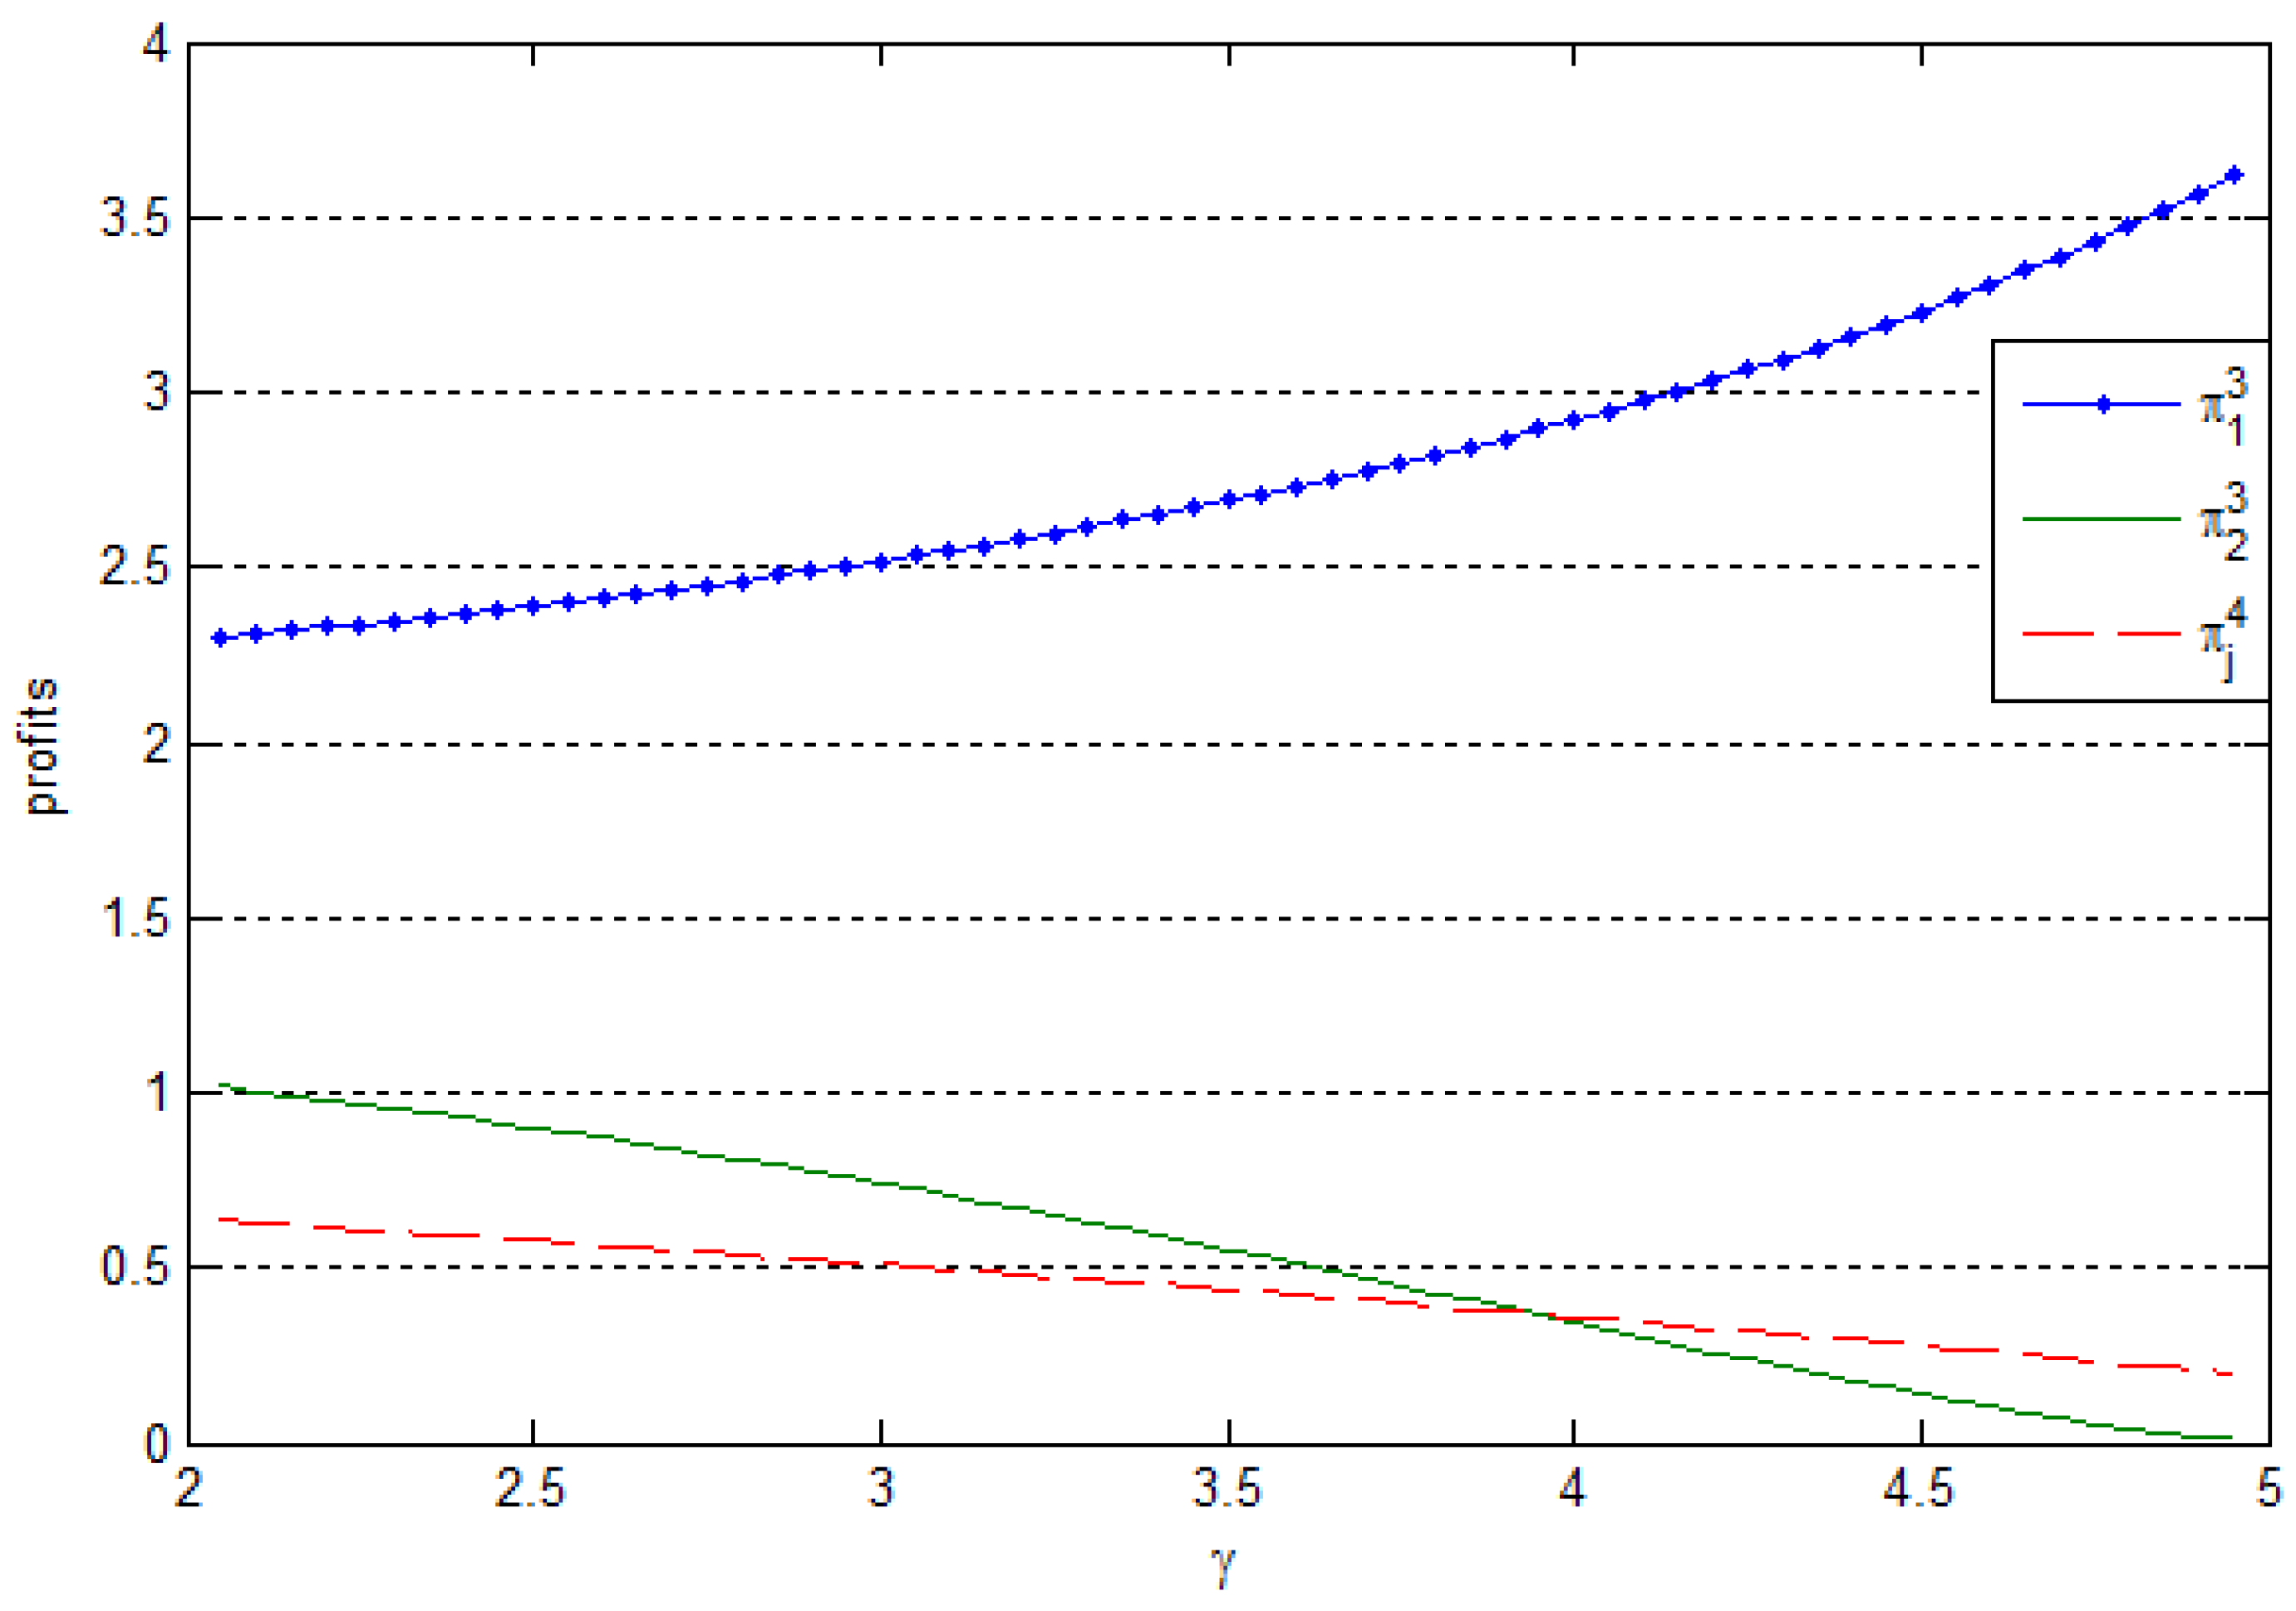
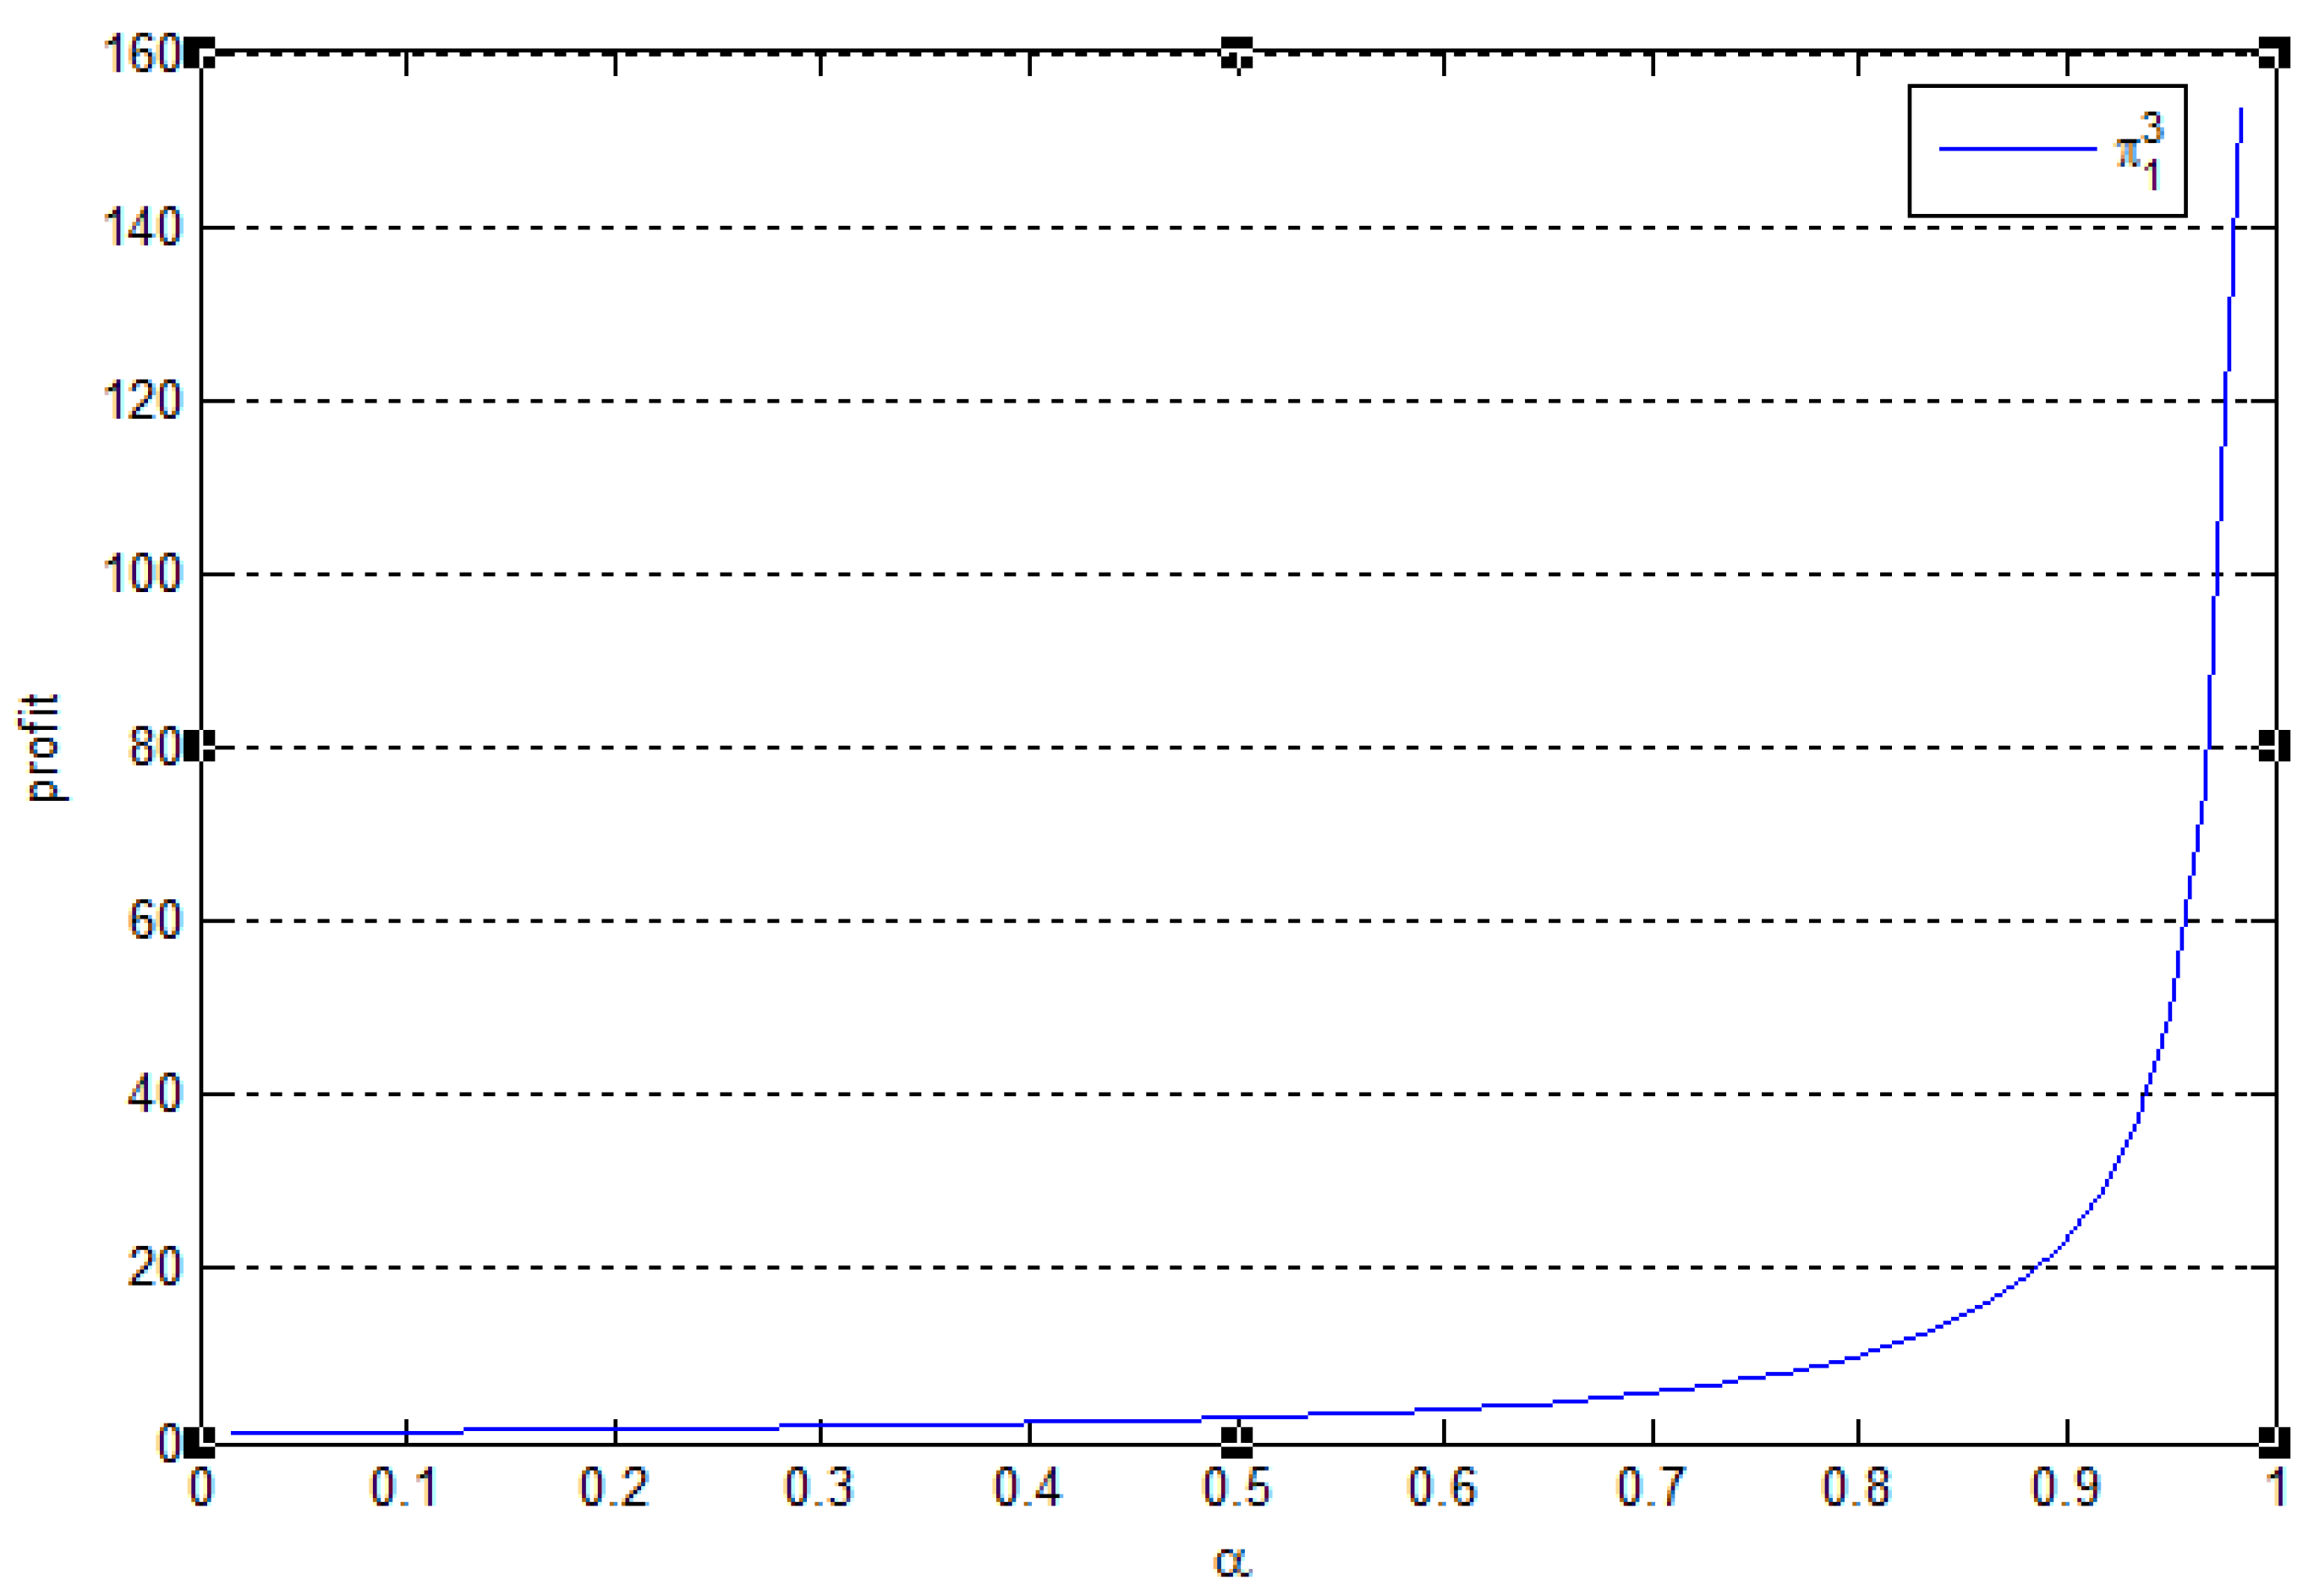
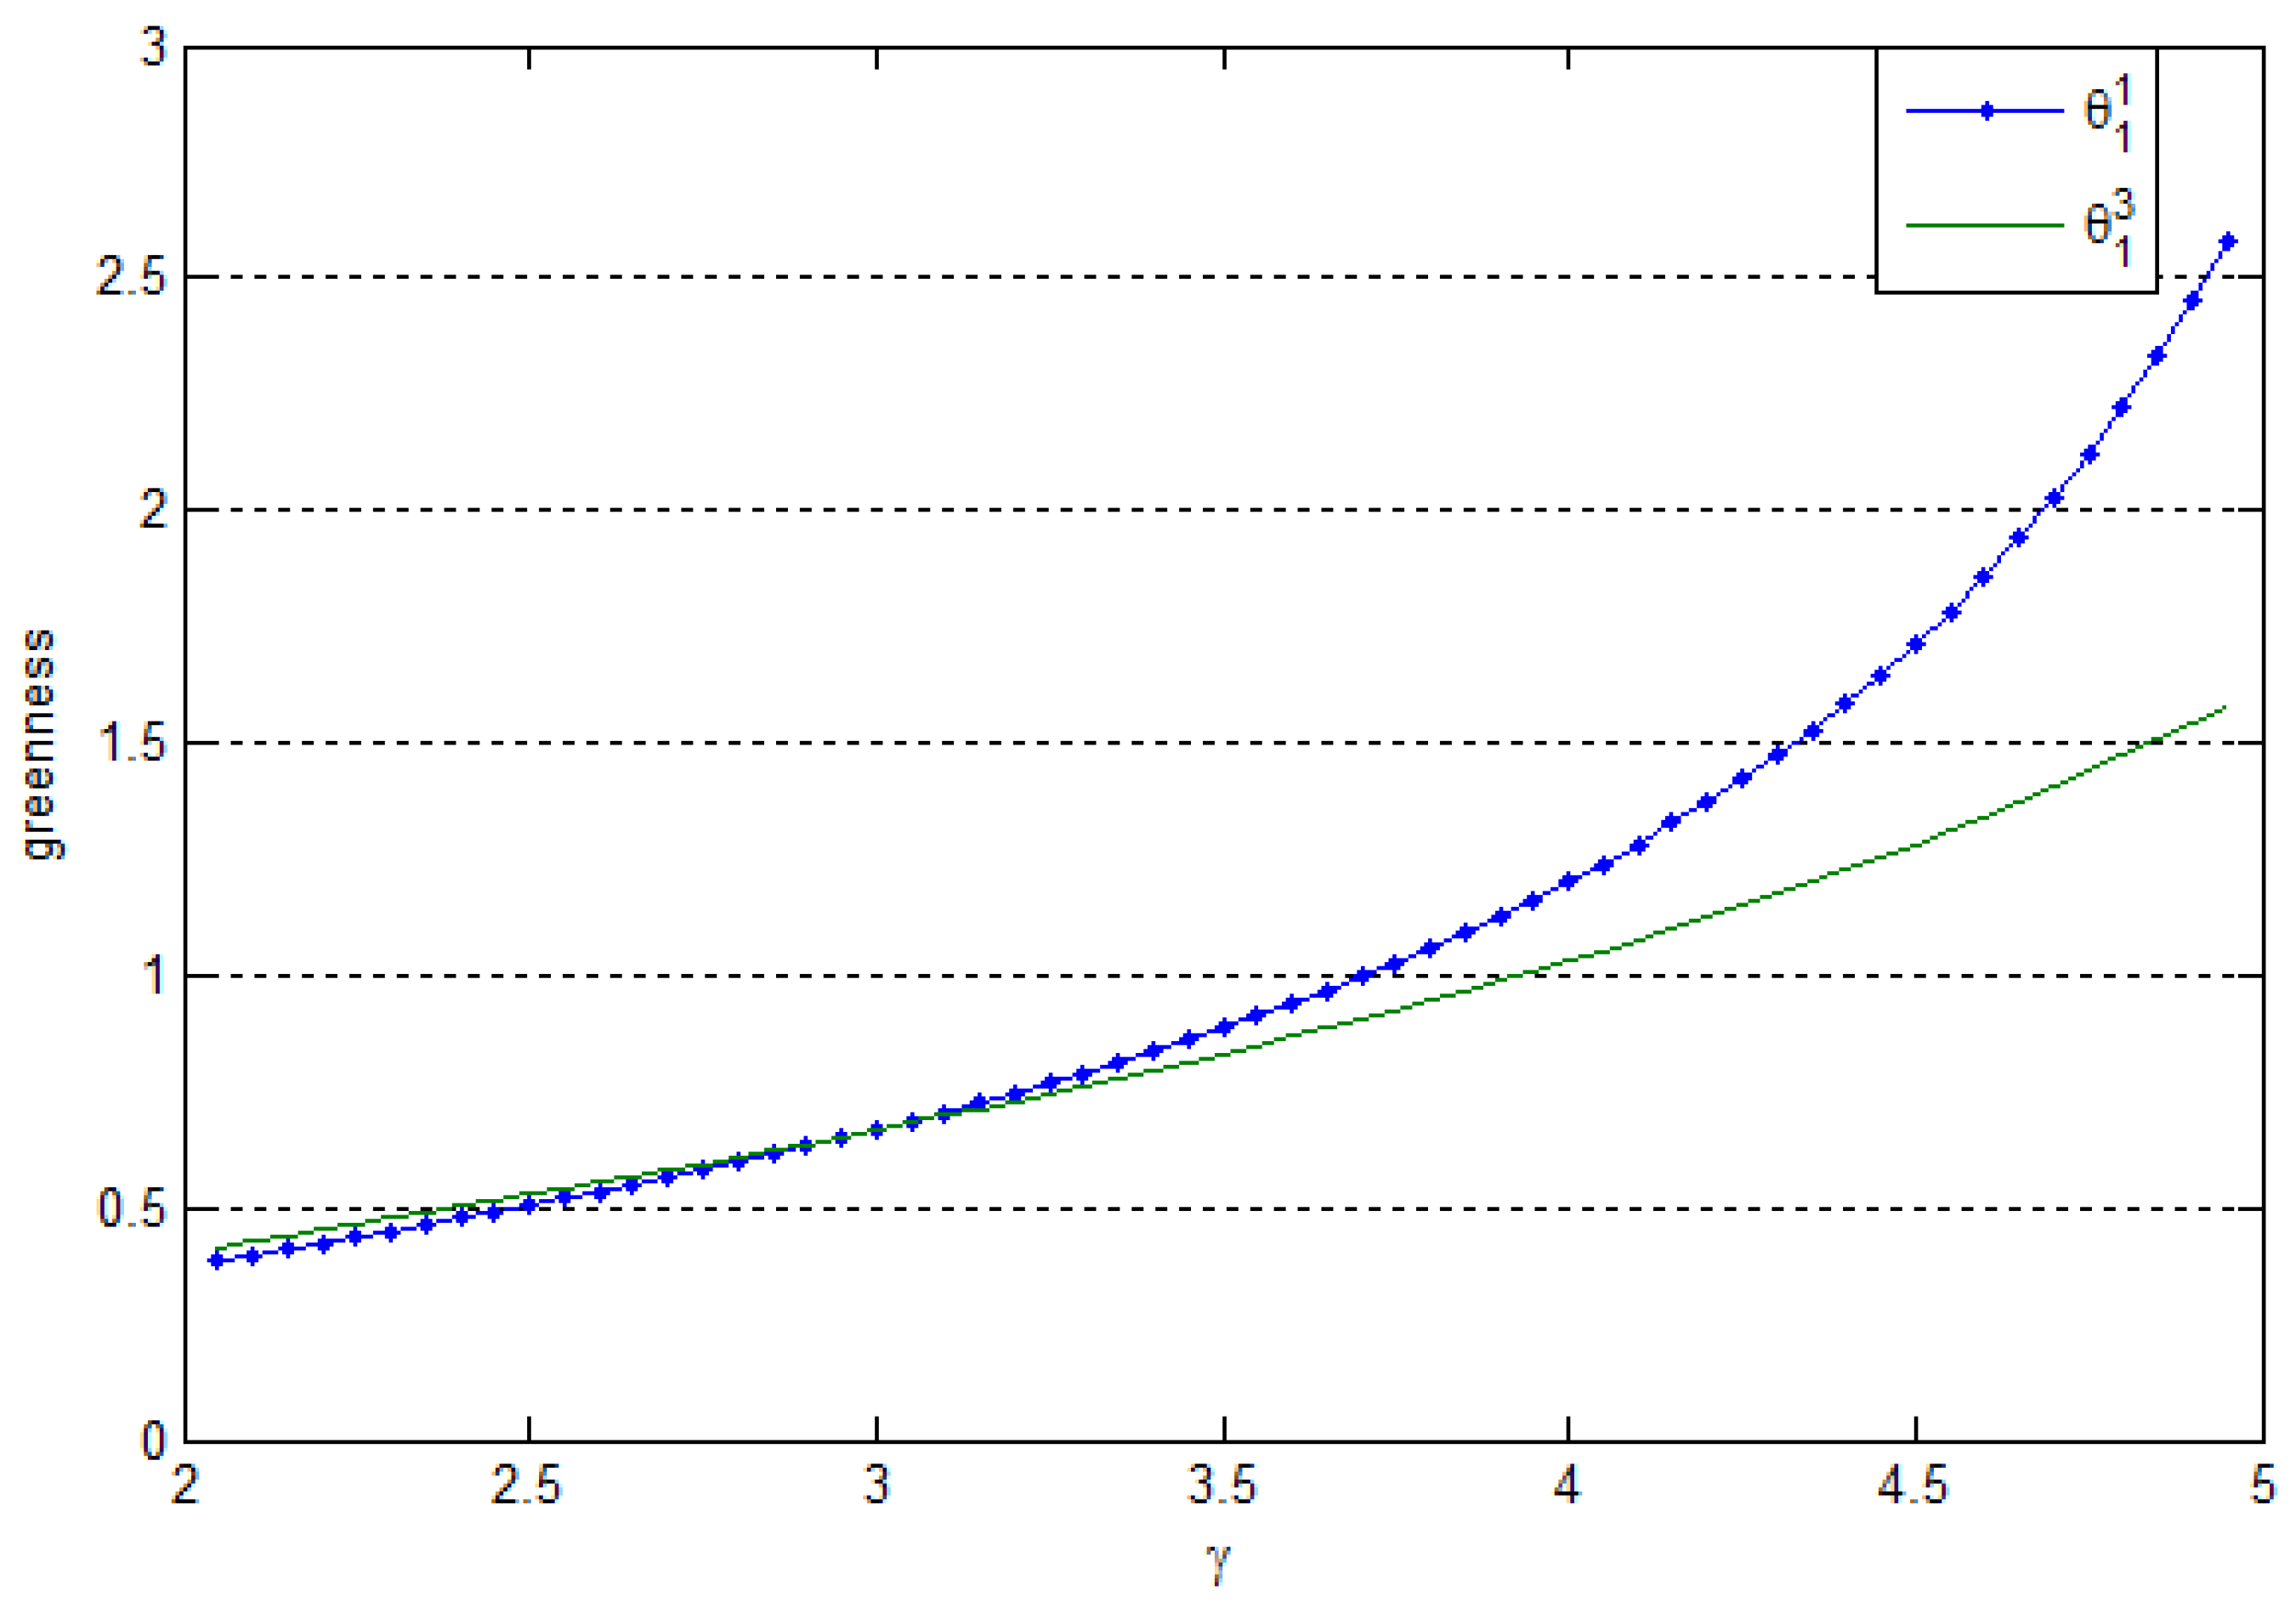
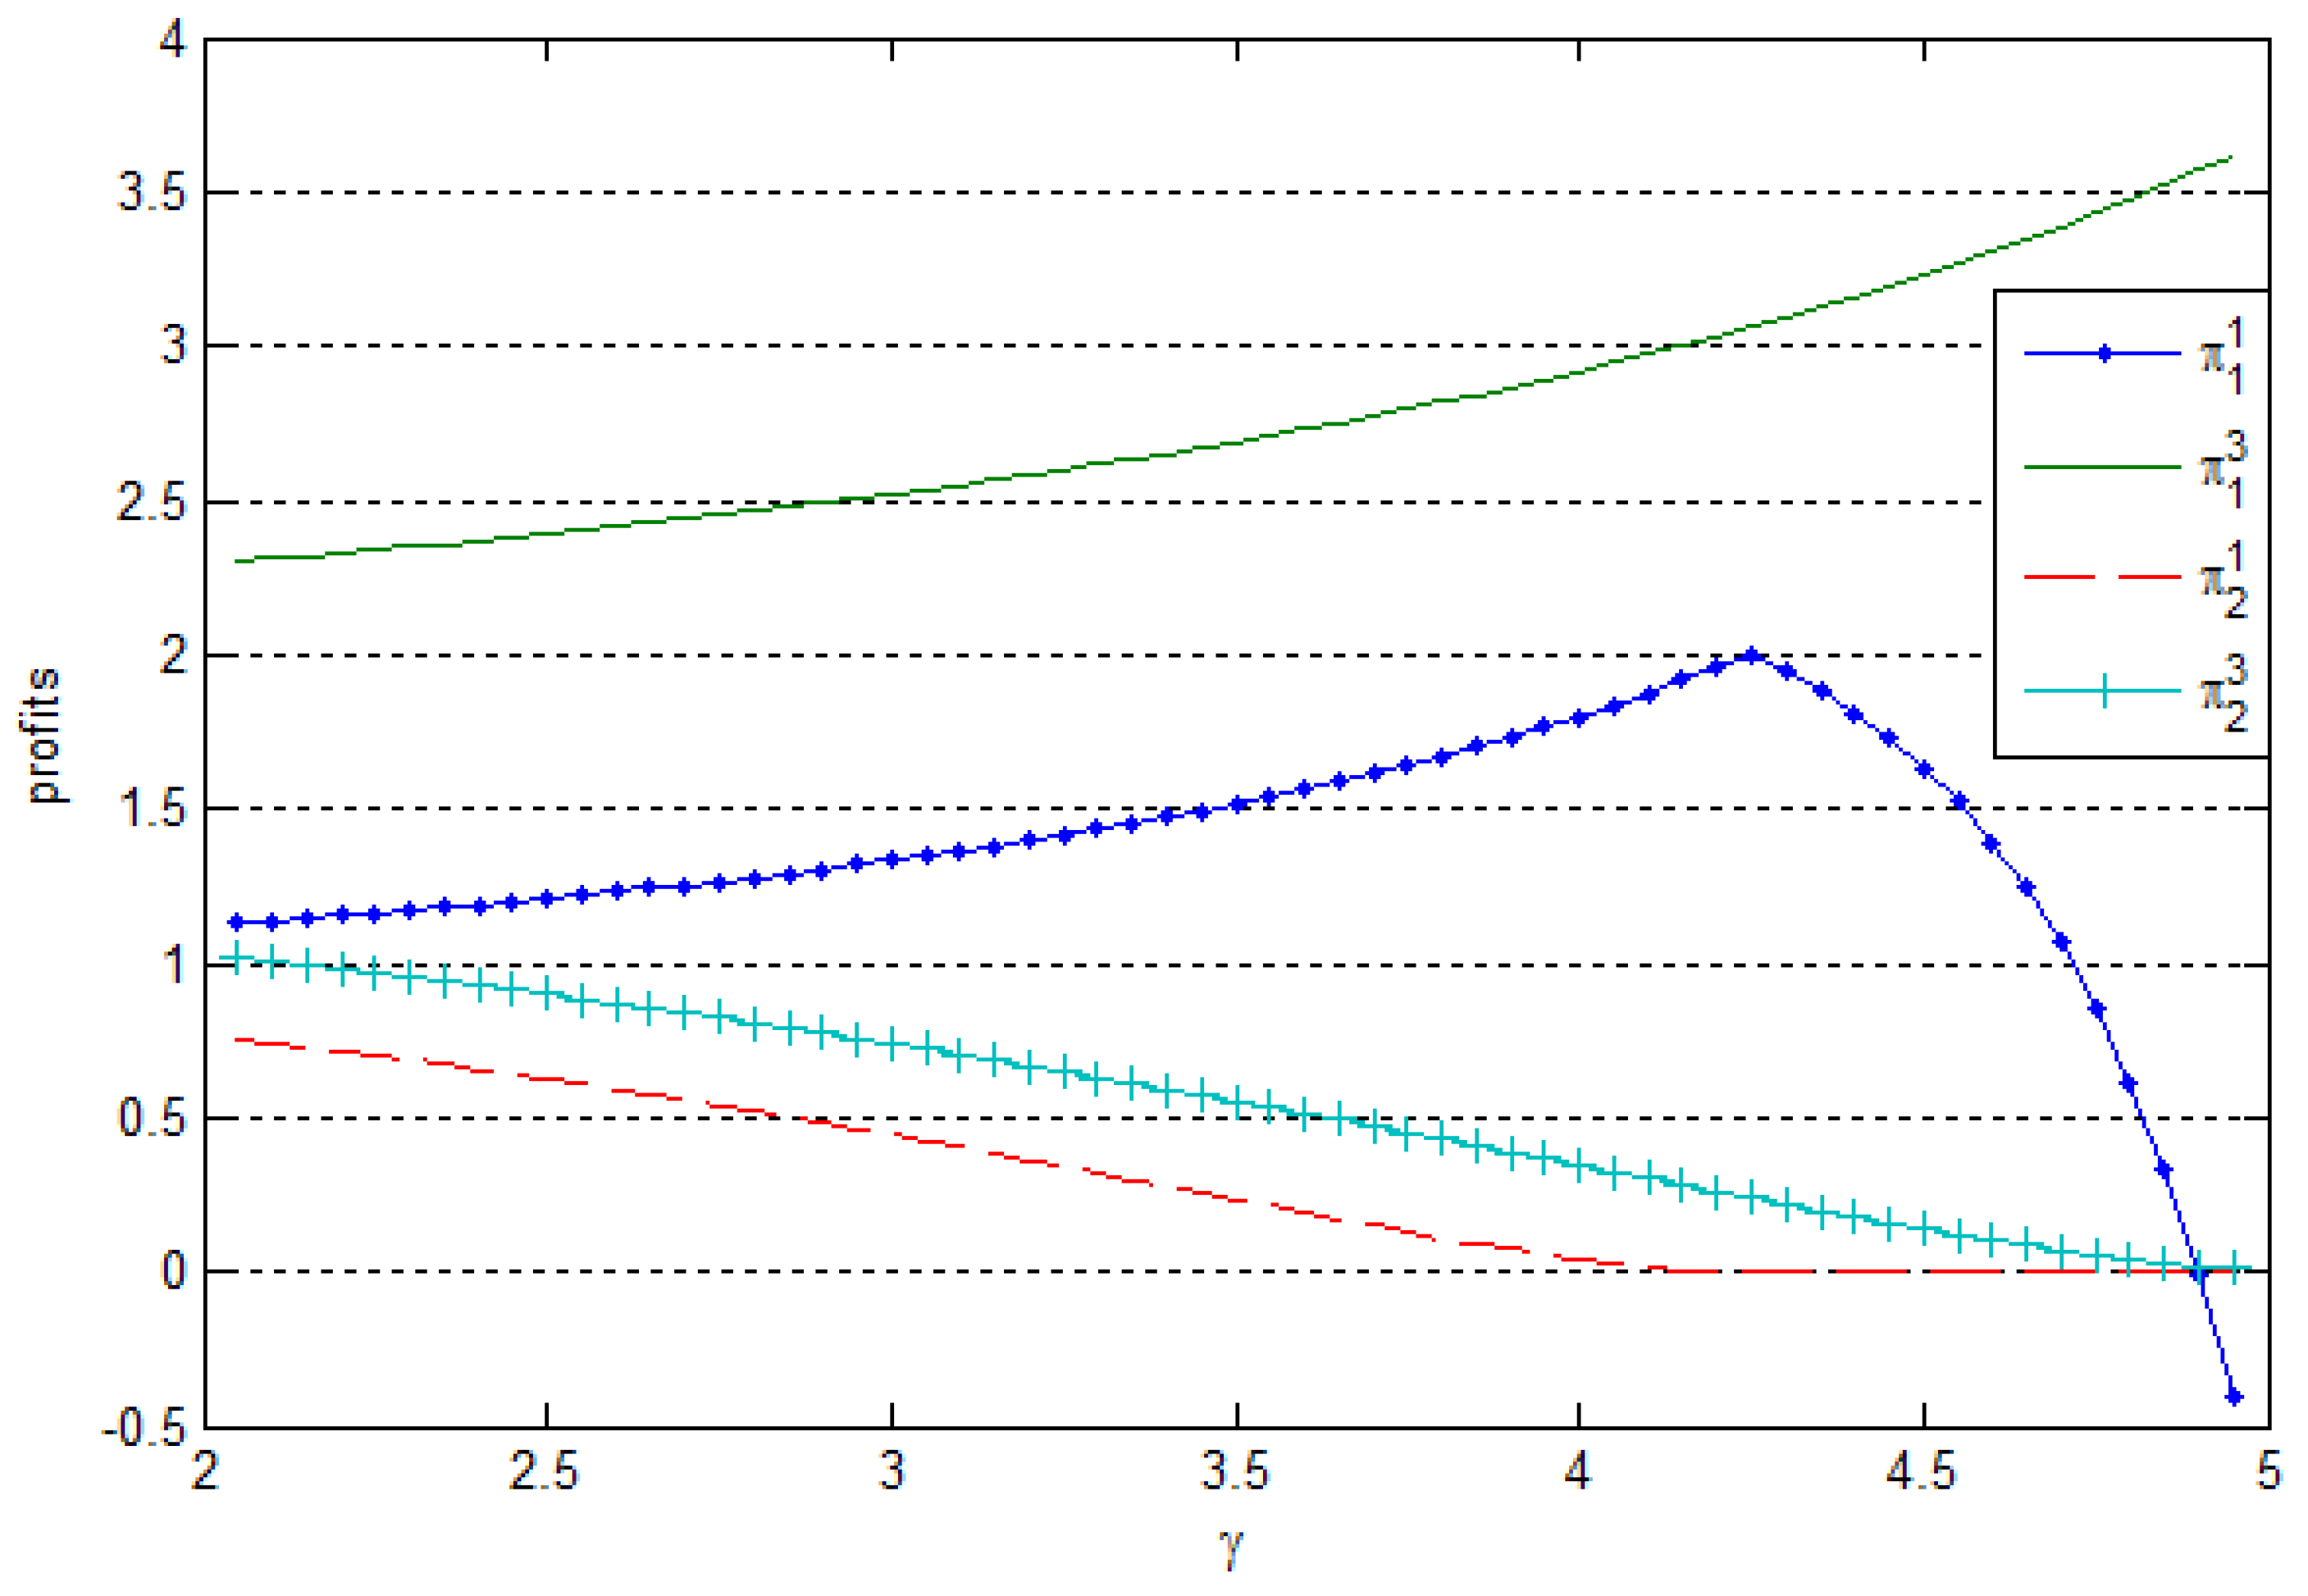
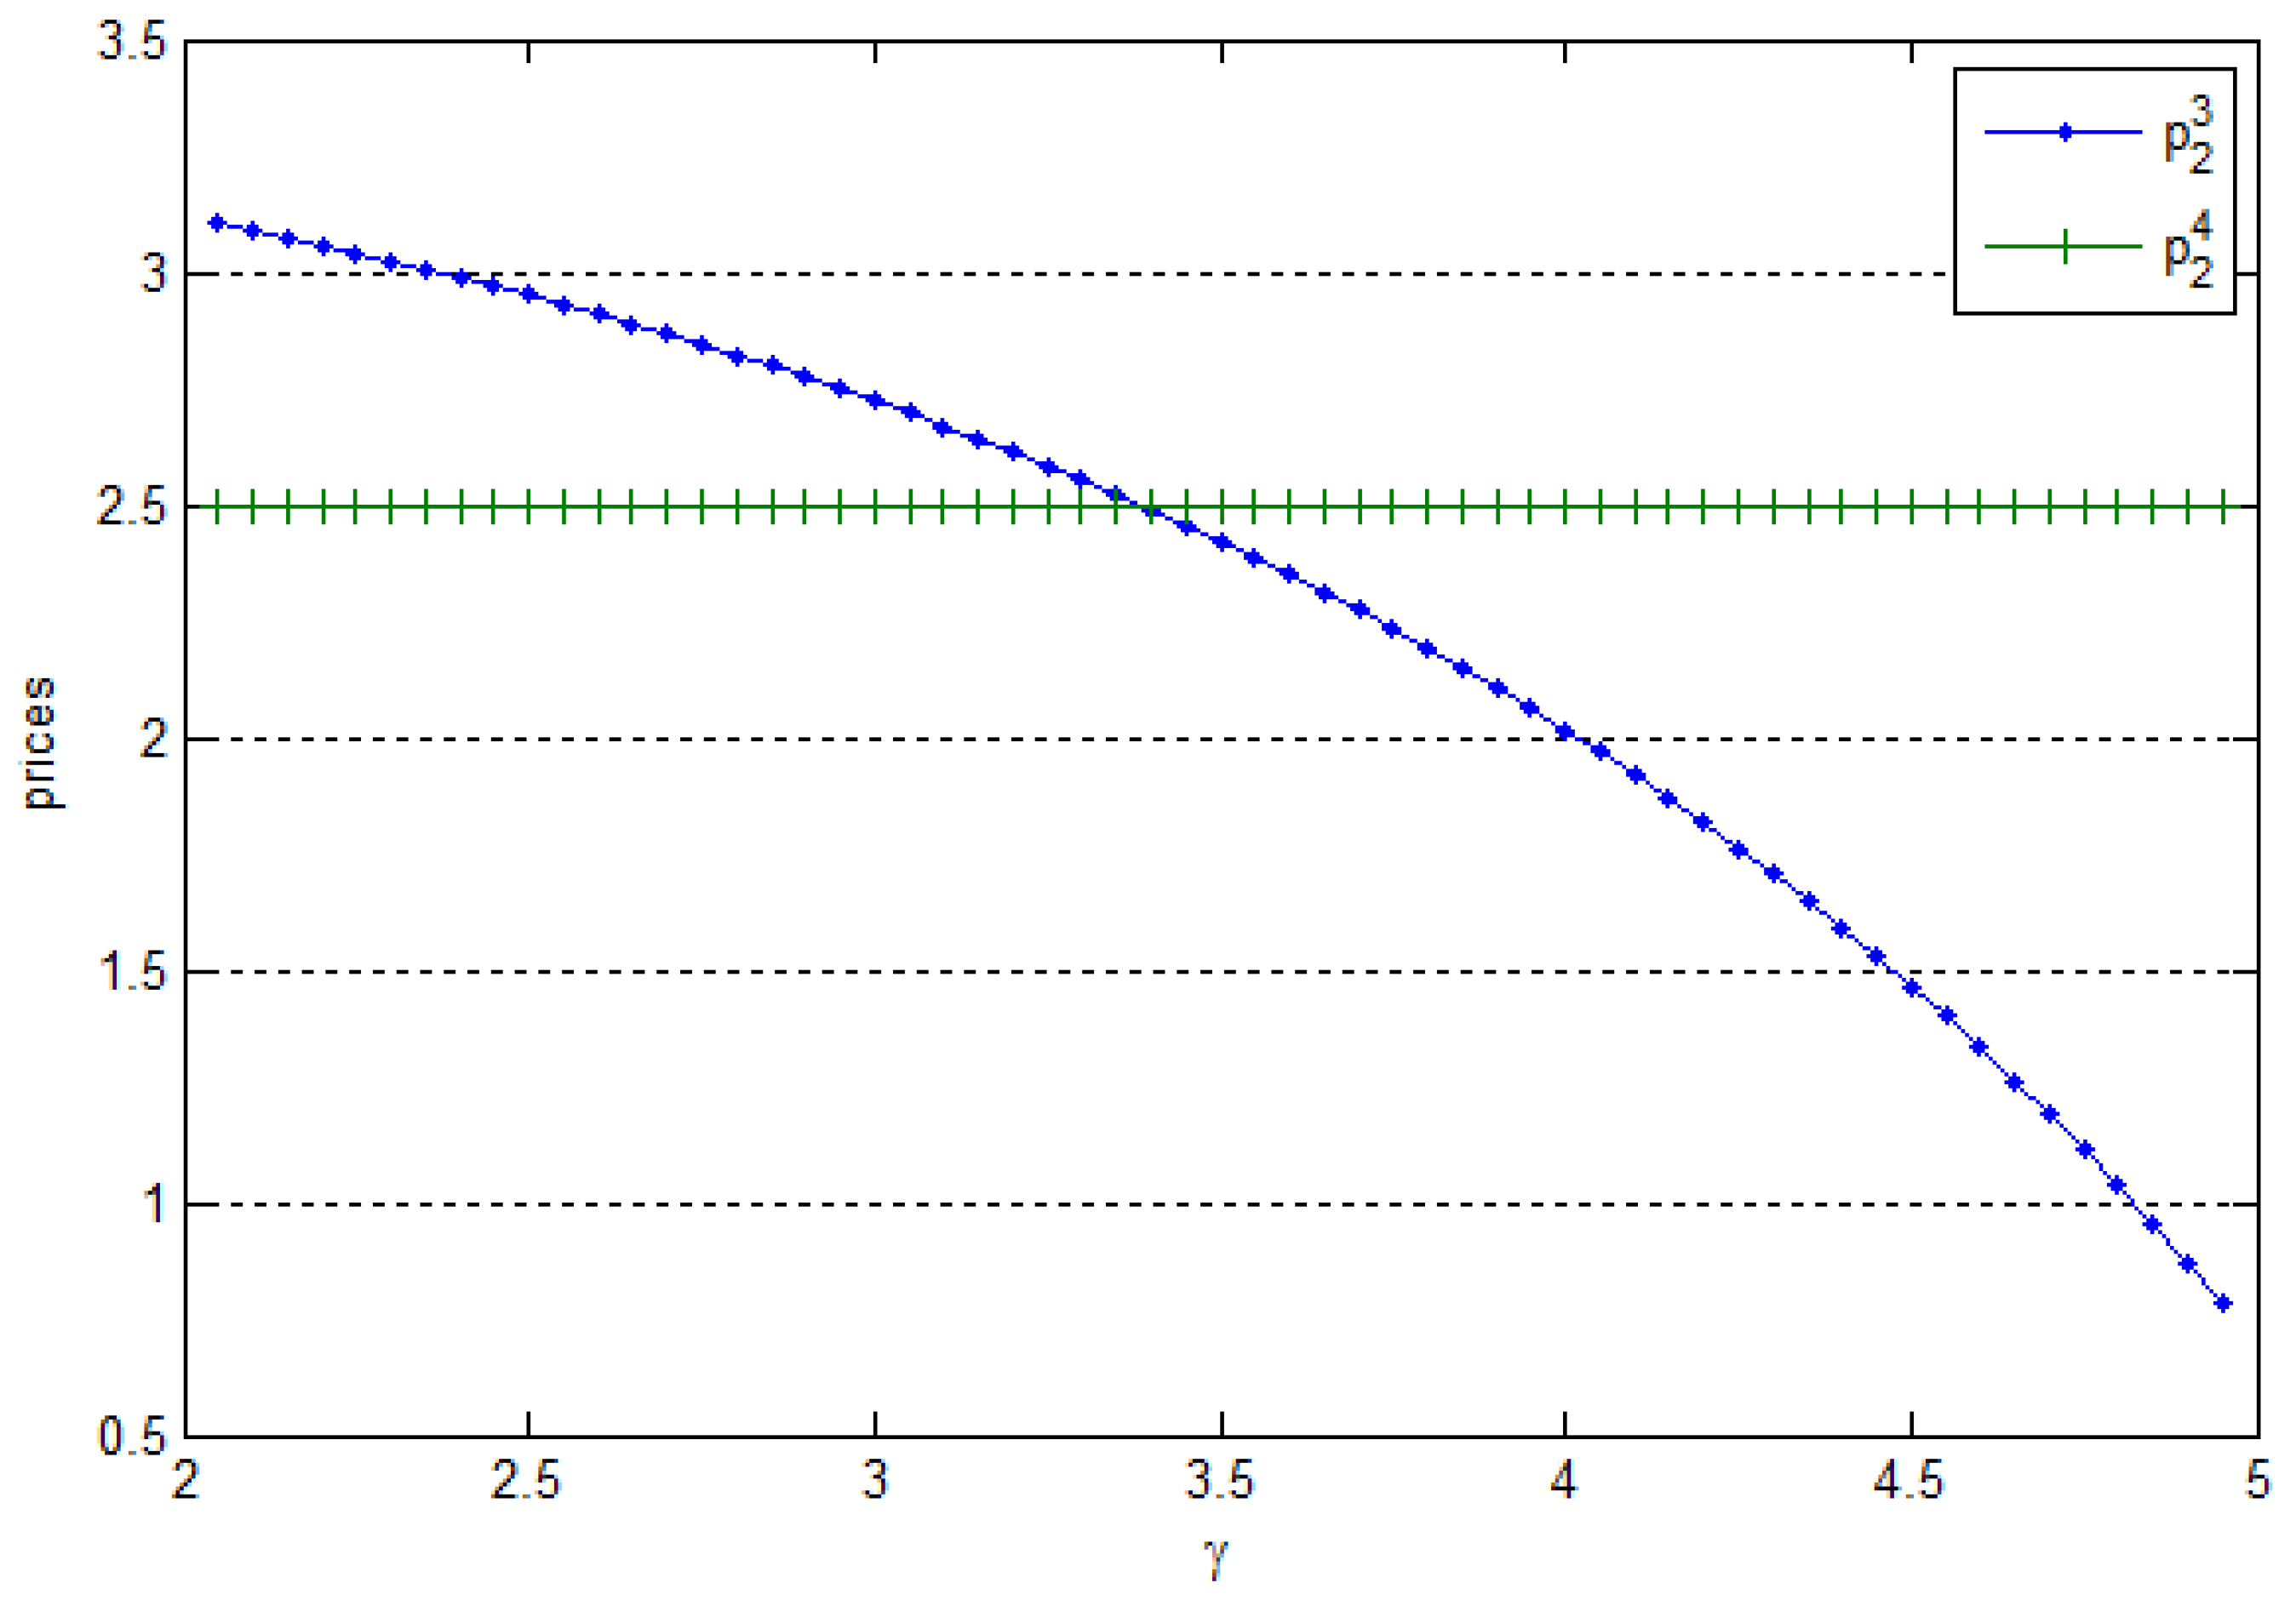
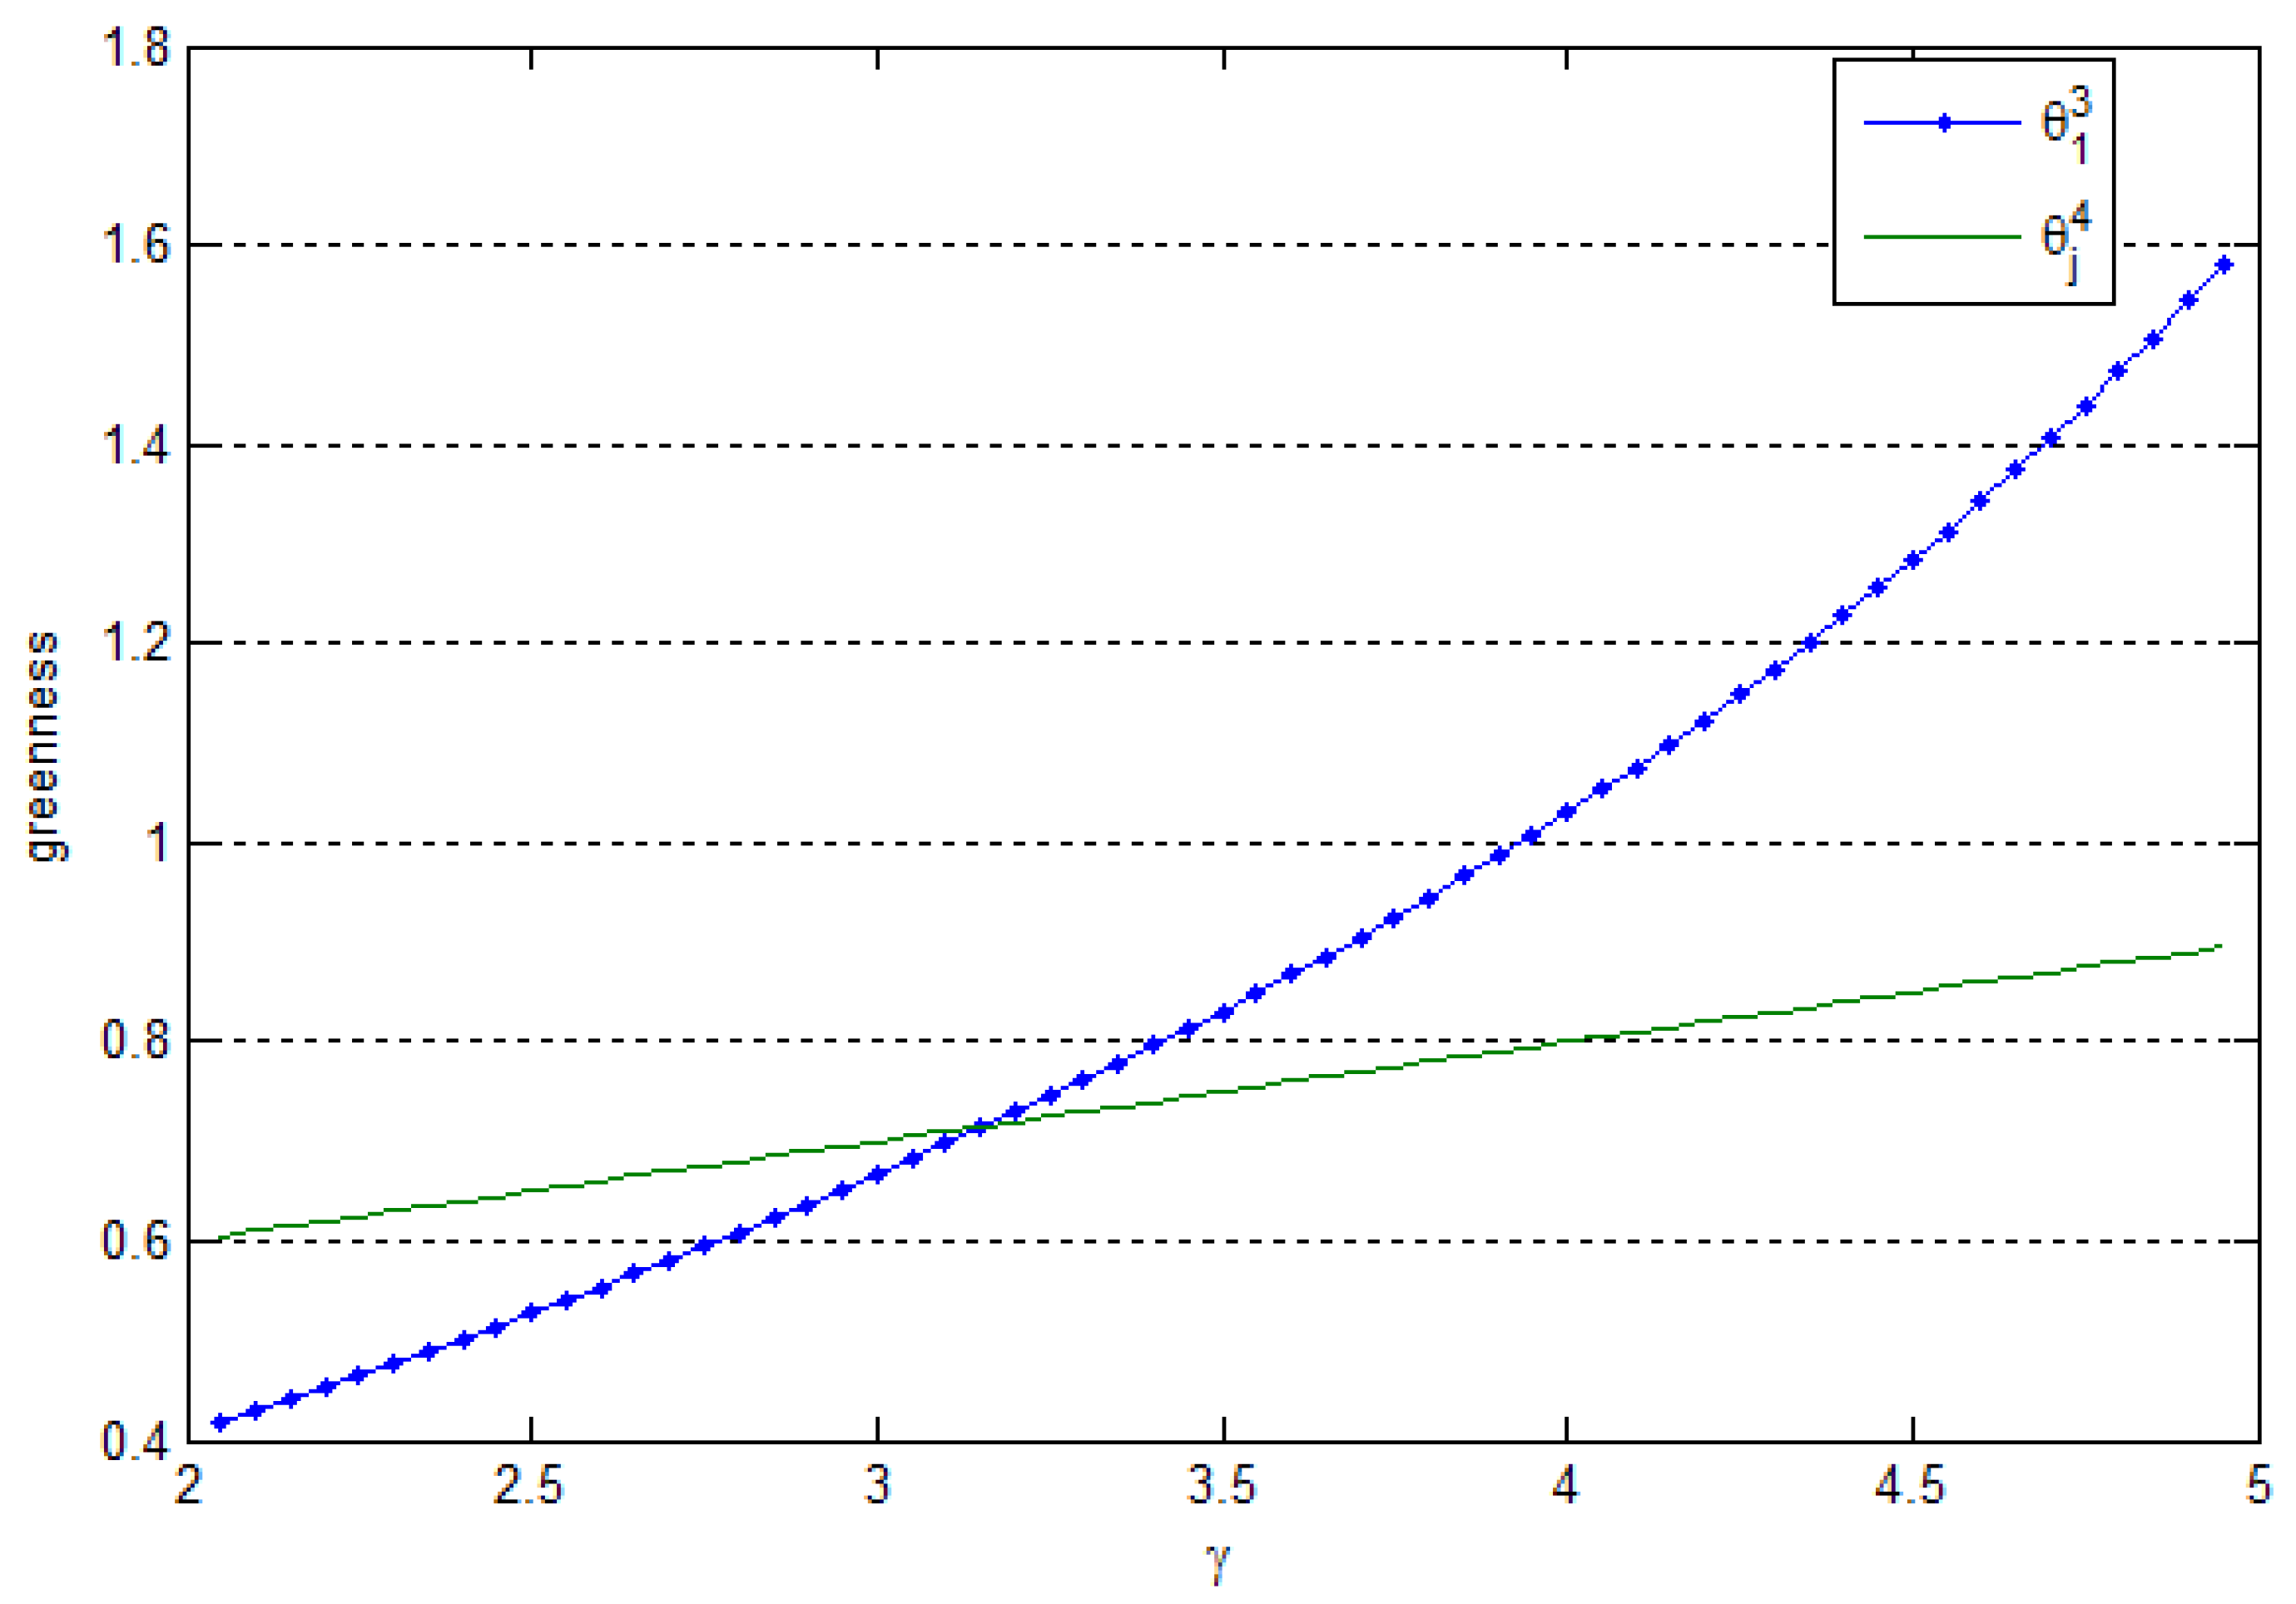
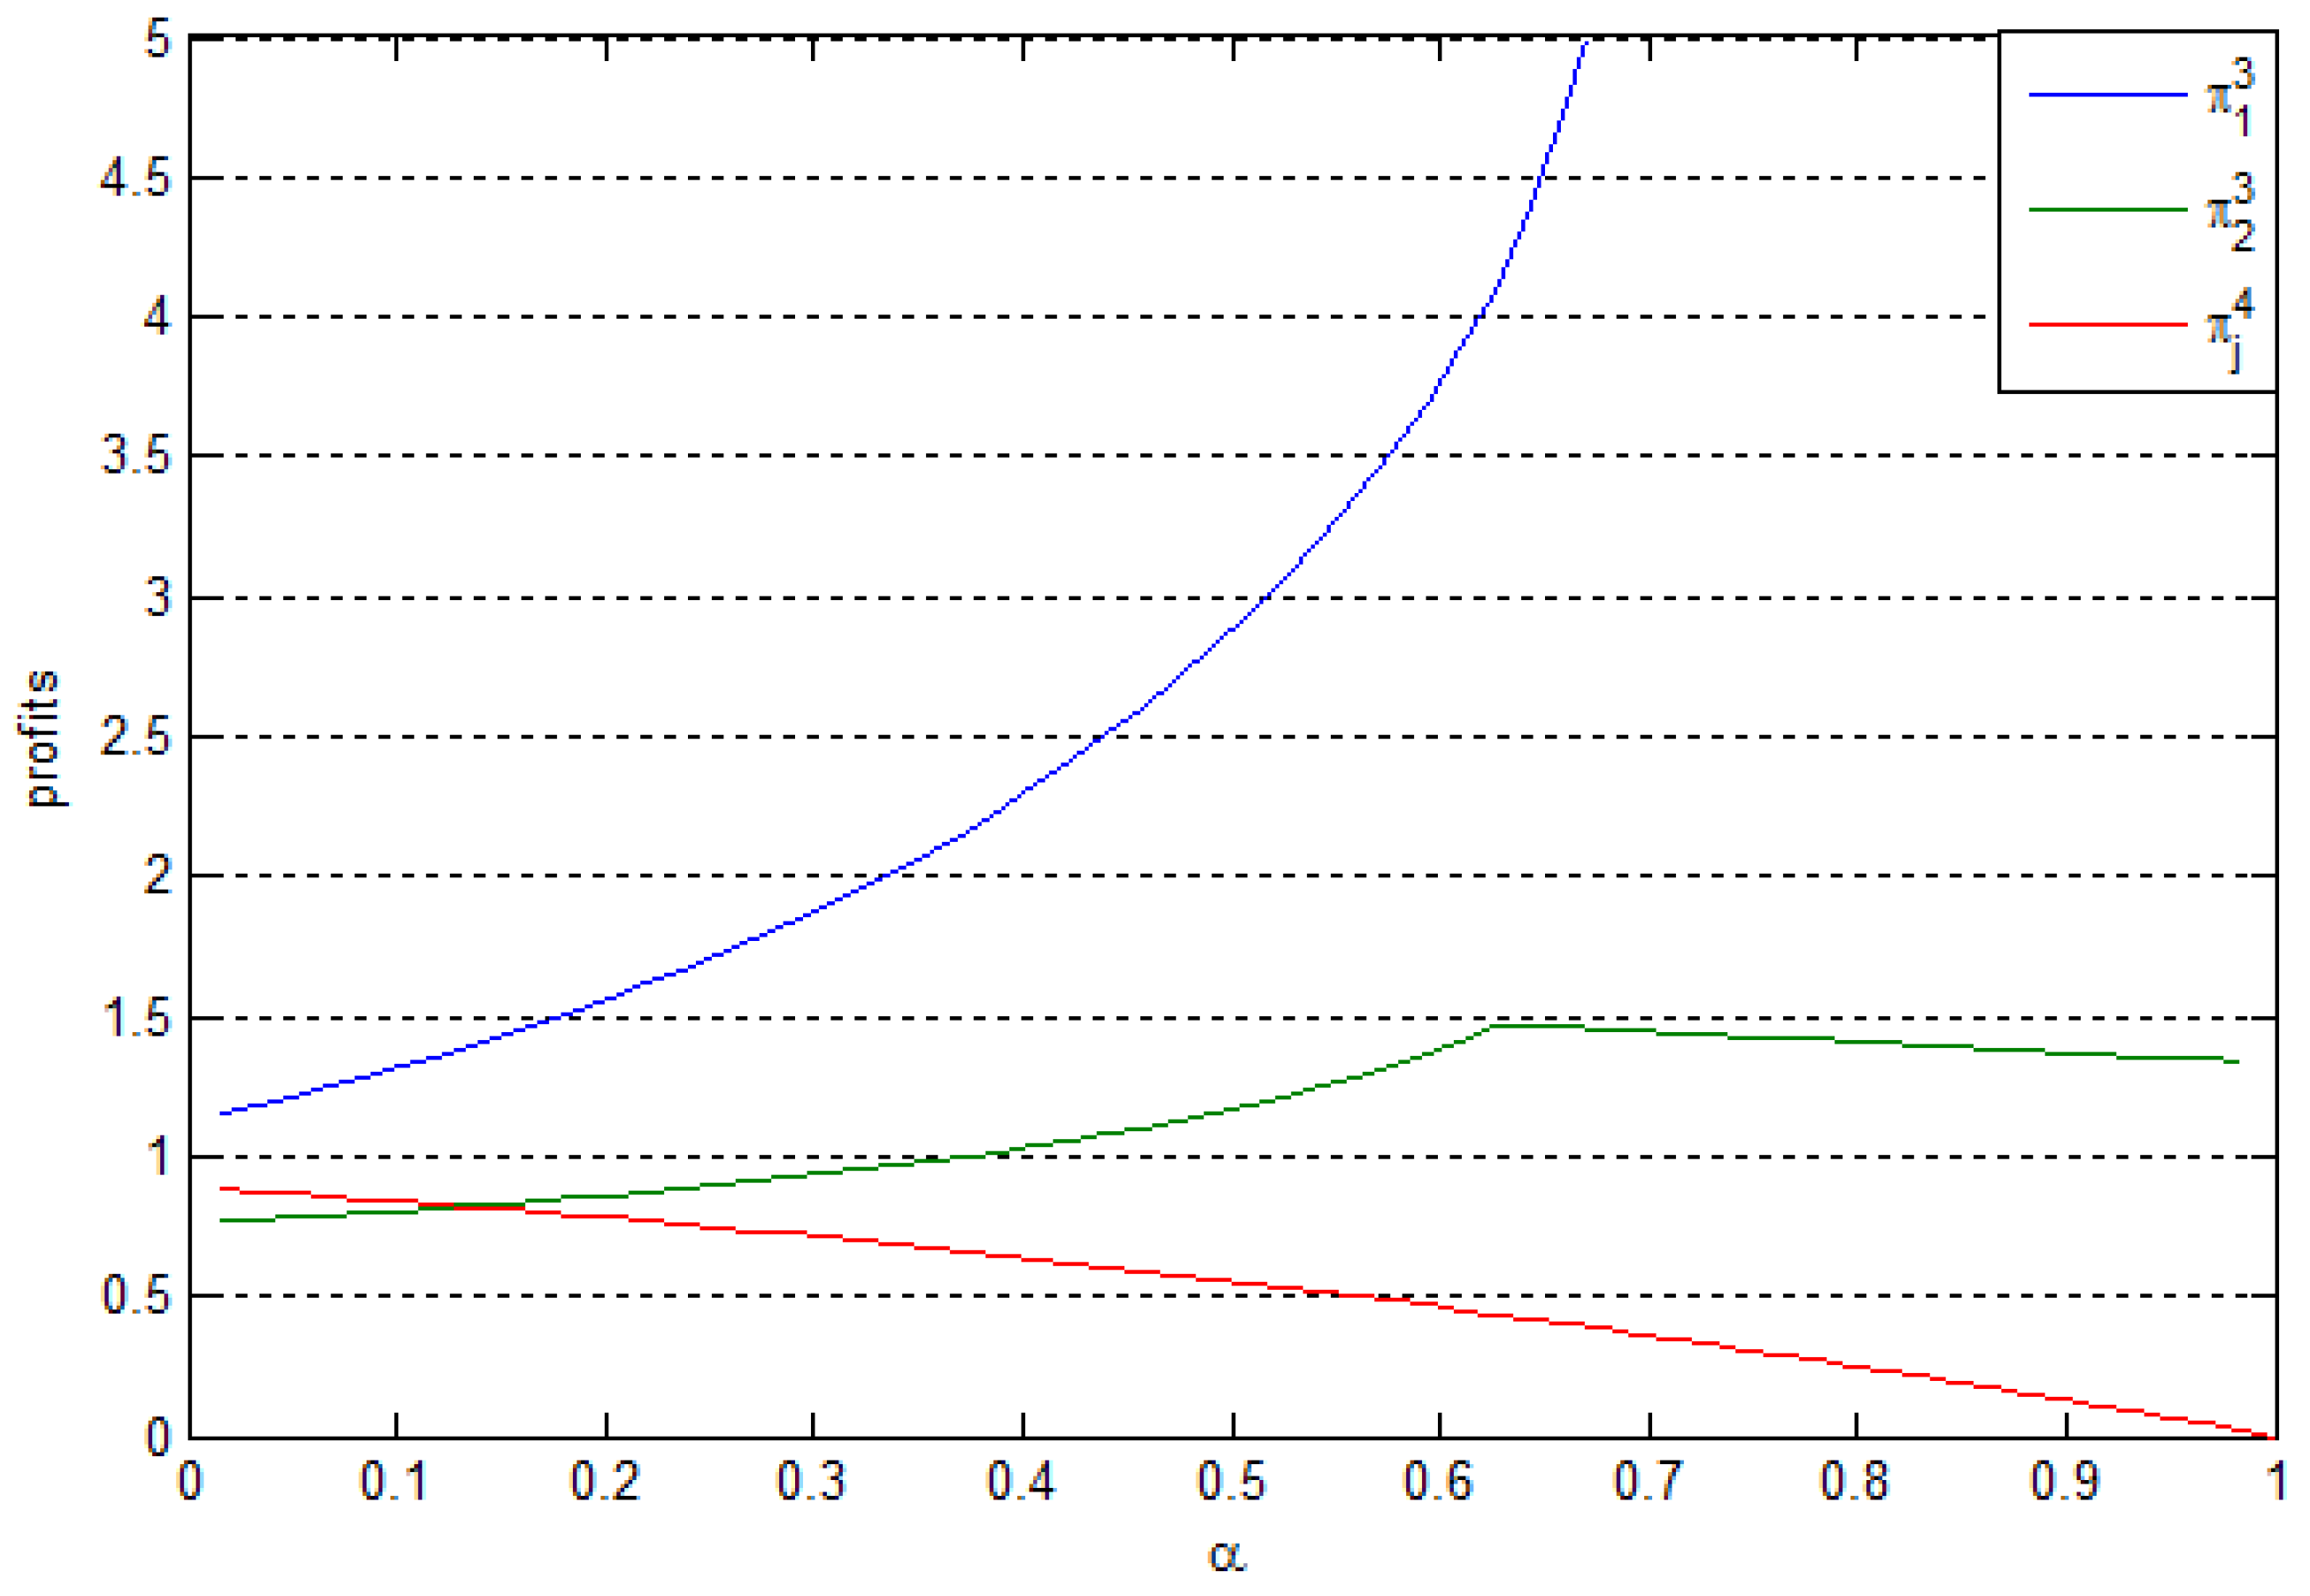
5. Effects of Consumer Heterogeneity

In this section, we compare the optimal greenness, prices, market sizes, and profits under conditions without and with consumer heterogeneity. Through the following comparisons, we can identify the influences of consumer heterogeneity on firms’ environmental protection and economic goals. With simple arithmetic, we obtain p j 3 > p j 1 , p j 2 = p j 4 , θ j 2 < θ j 4 , and π j 2 > π j 4 . Given that the expressions of some solutions are complex, we illustrate the equilibrium in Figure 7 and Figure 8.
Figure 7 shows that when the greenness sensitivity of consumers is at a low level, firm 1 produces products with low greenness in scenarios 1 and 3. When the greenness sensitivity of consumers is at a high level, the greenness of products in scenario 1 is larger than that in scenario 3. Figure 8 shows that the profits of the firms in scenario 1 are always smaller than the profits in scenario 3. We obtain the following proposition through the above analysis.
Proposition 8.
(i) When firm 1 produces green products while firm 2 produces ordinary products, the two firms will obtain higher profits in the scenario with consumer heterogeneity than those in the scenario without consumer heterogeneity; (ii) When the two firms produce green products, they will produce products with higher greenness in the scenario with consumer heterogeneity than that in the scenario without consumer heterogeneity, but the profit obtained is just the opposite.
Proposition 8 reveals that firm performances are related closely to market competition and consumer distribution. When a firm develops green products and the other develops ordinary products, that is, the market competition is small, the two firms will tend to develop products in a market that contains some highly environmentally conscious consumers. We explain this notion as follows. Those consumers with high environmental awareness will purchase from a firm that produces green products. The remaining consumers will then purchase a product based on overall utility. Therefore, firm 1, which produces green products, can develop products with low greenness and a high price, which results in higher profit. Firm 2, which produces ordinary products, can then set a high price. Given these conditions, the two firms can obtain higher profits than they could in a market with only low environmental awareness consumers. However, the greenness of products is reduced.
Meanwhile, when the two firms develop green products, that is, the market competition is intense, they will prefer to develop products in a market with low environmentally conscious consumers. The implication of this result is that two firms can obtain higher profits by developing products with low greenness in this market. If the market has a fraction of highly environmentally conscious consumers, the firms must produce products with high greenness that can attract these consumers. However, the firms cannot charge a higher price because of the absence of a competition advantage.
To summarize, in different market competition conditions, the influences of consumer heterogeneity on the environmental and economic performance of firms are not absolute. When market competition is at a low level, consumer heterogeneity can be used to improve firm profit. In addition, when market competition is at a high level, consumer heterogeneity can improve the greenness of products. However, firms cannot improve environmental performance while pursuing profit maximization.

6. Conclusions

In this paper, we develop an analytical model where one firm produces green products and the other firm selects whether to produce ordinary or green products. Two market settings are considered, namely (i) consumers without a product preference and (ii) two types of consumers that have no preference for products and that have a preference for green products. We derive and compare firms’ optimal solutions and profits under different scenarios. From the analytical results, we identify the effects of consumer heterogeneity under different competition intensities. The main findings and insights are highlighted below.
Effects of consumer heterogeneity under different market competition conditions: On the one hand, if market competition is at a low level, we find that (i) when the greenness sensitivity of consumers with no preference is sufficiently small, but more consumers have high environmental awareness, companies can easily achieve their environmental goals (reflected by greenness) as well as economic goals (reflected by profit); (ii) when the greenness sensitivity of consumers with no preference is at a medium level and the fraction of consumers with high environmental awareness increases, the firm might achieve economic goals at the cost of reducing environmental goals; and (iii) when the greenness sensitivity of consumers with no preference is at a high level and the fraction of consumers with high environmental awareness increases, firms would find it difficult to achieve their environmental and economic goals. On the other hand, if the market competition is at a high level, the presence of consumer heterogeneity can improve the greenness of products while making the achievement of high profit difficult.
The main contributions of this study are as follows. First, our study enriches current research related to green product development by considering development-intensive green products (DIGPs) with a variable fixed cost. Second, our study considers consumer heterogeneity and the level of competition among firms. The results show that the effect of consumer heterogeneity varies considerably under different market competition conditions. This difference will have a significant influence on firm decisions. Third, this study adopts the willing-to-pay (WTP) model rarely used in related research, from which the product’s demand is determined through consumer utility.
Our findings provide insights for the government to formulate policies on the development of green products. Based on our modeling results, encouraging greenness competition is effective in improving the greenness of products as long as it is understood that such a strategy may not be sustainable because of low economic performance.
We investigate DIGPs with a variable fixed cost in this paper. For future research, one may consider marginal cost-intensive products (MIPs) with a variable unit cost. In that case, the form of the cost function would change. Exploring similarities and differences between different product developments would also be noteworthy.

Author Contributions

Methodology, B.X.; Software, Q.X. and Q.H.; Formal Analysis, B.X.; Writing-Original Draft Preparation, B.X. and Q.X.; Writing-Review & Editing, Q.B.

Acknowledgments

This work was supported by the National Natural Science Foundation of China (Grant Numbers 71502076 and 71561018), the Natural Science Foundation of Jiangxi Province, China (Grant Number 20171BAA218002), and the Technology Project of Education Department of Jiangxi Province, China (Grant Number GJJ160209).

Conflicts of Interest

The authors declare no conflict of interest.

Appendix A

The proof of optimal solutions and profits in scenario 1 is as follows:
In scenario 1, all consumers have weak environmental awareness. Each consumer measures the product’s performance, price, and greenness comprehensively and ultimately chooses which product to buy based on utility. Consumers compare utility u 1 1 with u 2 1 (see Equations (1) and (2)). We can obtain the demand of each firm by finding the consumer located at x , which is indifferent between the two firms. Let u 1 1 = u 2 1 , then we obtain the indifferent location:
x 1 = p 2 1 p 1 1 + t + γ θ 1 1 2 t .
Rearranging Equation (A1) in Equation (12), the profit function of firm 1 is
π 1 1 = p 2 1 p 1 1 + t + γ θ 1 1 2 t ( p 1 1 c ) k ( θ 1 1 ) 2 .
By substituting 1 x 1 in Equation (13), we can obtain the profit function of firm 2:
π 2 1 = p 1 1 p 2 1 + t γ θ 1 1 2 t ( p 2 1 c ) .
Taking first-order conditions with respect to prices (holding greenness constant), we obtain second-order conditions that are both 1 / t , and thus, the profit function of firm j is concave in p j 1 . Next, solving the first-order conditions simultaneously, we obtain
p 1 1 = t + c + γ θ / 3 ,
p 2 1 = t + c γ θ / 3 .
Substituting Equations (A4) and (A5) into Equation (A2) and differentiating with respect to the greenness of products, we obtain second-order conditions. We find that only the condition γ 2 < 18 k t holds, and the strict concavity of the profit functions can be guaranteed. Next, we obtain the optimal greenness:
θ 1 1 = 3 γ t 18 k t γ 2 .
Substituting the expressions of optimal greenness and prices into Equations (12) and (13), we can obtain the optimal profit of firms 1 and 2:
π 1 1 = 9 k t 2 18 k t γ 2 ,
π 2 1 = 2 t ( 9 k t γ 2 ) 2 ( 18 k t γ 2 ) 2 .
The other solutions observe a similar process.
Considering the complexity of the solutions, we illustrate the relationships between optimal solutions and parameters in figures. For Figure 1, Figure 2, Figure 3, Figure 4 and Figure 7 and Figure 8, the following parameters are fixed with the following values: t = 2 , c = 0.5 , k = 1 , α = 0.4 , and δ = 6 . We make the x-axis the greenness sensitivity of consumers with no preference γ , which is changed from 2 to 5. For Figure 5 and Figure 6, the following parameters are fixed with the following values: t = 2 , c = 0.5 , k = 1 , γ = 2 , and δ = 6 . We make the x-axis the fraction of consumers preferring green products α , which is changed from 0 to 1.

References

  1. Chen, Y.S. The drivers of green brand equity: Green brand image, green satisfaction, and green trust. J. Bus. Ethics 2010, 93, 307–319. [Google Scholar] [CrossRef]
  2. Chen, Y.S. The driver of green innovation and green image–green core competence. J. Bus. Ethics 2008, 81, 531–543. [Google Scholar] [CrossRef]
  3. Bei, L.T.; Simpson, E.M. The determinants of consumers’ purchase decisions for recycled products: An application of acquisition-transaction utility theory. ACR N. Am. Adv. 1995, 22, 257–261. [Google Scholar]
  4. Du, B.; Liu, Q.; Li, G. Coordinating Leader-Follower Supply Chain with Sustainable Green Technology Innovation on Their Fairness Concerns. Int. J. Environ. Res. Public Health 2017, 14, 1357. [Google Scholar] [CrossRef] [PubMed]
  5. Chen, B.; Abeles, E.; Burke, A.; Sperling, D. Effect of Emissions Regulation on Vehicle Attributes, Cost, and Price. Contract 2004, 2, 310. [Google Scholar]
  6. Chen, C. Design for the environment: A quality-based model for green product development. Manag. Sci. 2001, 47, 250–263. [Google Scholar] [CrossRef]
  7. De Bakker, F.G.; Fisscher, O.A.; Brack, A.J. Organizing product-oriented environmental management from a firm’s perspective. J. Clean. Prod. 2002, 10, 455–464. [Google Scholar] [CrossRef]
  8. Nielsen, P.H.; Wenzel, H. Integration of environmental aspects in product development: A stepwise procedure based on quantitative life cycle assessment. J. Clean. Prod. 2002, 10, 247–257. [Google Scholar] [CrossRef]
  9. Bovea, M.; Pérez-Belis, V. A taxonomy of ecodesign tools for integrating environmental requirements into the product design process. J. Clean. Prod. 2012, 20, 61–71. [Google Scholar] [CrossRef]
  10. Lindahl, M. Engineering designers’ experience of design for environment methods and tools–Requirement definitions from an interview study. J. Clean. Prod. 2006, 14, 487–496. [Google Scholar] [CrossRef]
  11. Zhou, X.; Schoenung, J.M. An integrated impact assessment and weighting methodology: Evaluation of the environmental consequences of computer display technology substitution. J. Environ. Manag. 2007, 83, 1–24. [Google Scholar] [CrossRef] [PubMed]
  12. Gluch, P.; Baumann, H. The life cycle costing (LCC) approach: A conceptual discussion of its usefulness for environmental decision-making. Build. Environ. 2004, 39, 571–580. [Google Scholar] [CrossRef]
  13. Elkington, J.; Hailes, J. The Green Consumer Guide; Victor Gollancz: London, UK, 1988. [Google Scholar]
  14. Albino, V.; Balice, A.; Dangelico, R.M. Environmental strategies and green product development: An overview on sustainability-driven companies. Bus. Strategy Environ. 2009, 18, 83–96. [Google Scholar] [CrossRef]
  15. Earl, P.E.; Wakeley, T. Economic perspectives on the development of complex products for increasingly demanding customers. Res. Policy 2010, 39, 1122–1132. [Google Scholar] [CrossRef]
  16. Lacourbe, P.; Loch, C.H.; Kavadias, S. Product Positioning in a Two-Dimensional Market Space. Prod. Oper. Manag. 2009, 18, 315–332. [Google Scholar] [CrossRef]
  17. Qian, L. Product price and performance level in one market or two separated markets under various cost structures and functions. Int. J. Prod. Econ. 2011, 131, 505–518. [Google Scholar] [CrossRef]
  18. Krishnan, V.; Zhu, W. Designing a family of development-intensive products. Manag. Sci. 2006, 52, 813–825. [Google Scholar] [CrossRef]
  19. Simpson, D.F.; Power, D.J. Use the supply relationship to develop lean and green suppliers. Supply Chain Manag. Int. J. 2005, 10, 60–68. [Google Scholar] [CrossRef]
  20. Handfield, R.; Sroufe, R.; Walton, S. Integrating environmental management and supply chain strategies. Bus. Strategy Environ. 2005, 14, 1–19. [Google Scholar] [CrossRef]
  21. Ashby, A.; Leat, M.; Hudson-Smith, M. Making connections: A review of supply chain management and sustainability literature. Supply Chain Manag. Int. J. 2012, 17, 497–516. [Google Scholar] [CrossRef]
  22. Ghosh, D.; Shah, J. A comparative analysis of greening policies across supply chain structures. Int. J. Prod. Econ. 2012, 135, 568–583. [Google Scholar] [CrossRef]
  23. Swami, S.; Shah, J. Channel coordination in green supply chain management. J. Oper. Res. Soc. 2013, 64, 336–351. [Google Scholar] [CrossRef]
  24. Wang, K.H.; Huang, Y.C.; Tung, C.T.; Lee, Y.J. Inventory management and pricing decisions for a supply chain with demand leakage and a return-policy contract. Int. J. Inf. Manag. Sci. 2015, 26, 51–65. [Google Scholar]
  25. Guo, D.; He, Y.; Wu, Y.; Xu, Q. Analysis of supply chain under different subsidy policies of the government. Sustainability 2016, 8, 1290. [Google Scholar] [CrossRef]
  26. He, R.; Xiong, Y.; Lin, Z. Carbon emissions in a dual channel closed loop supply chain: The impact of consumer free riding behavior. J. Clean. Prod. 2016, 134, 384–394. [Google Scholar] [CrossRef]
  27. Ji, J.; Zhang, Z.; Yang, L. Carbon emission reduction decisions in the retail-/dual-channel supply chain with consumers’ preference. J. Clean. Prod. 2017, 141, 852–867. [Google Scholar] [CrossRef]
  28. Li, H.; Wang, C.; Shang, M.; Ou, W. Pricing, carbon emission reduction, low-carbon promotion and returning decision in a closed-loop supply chain under vertical and horizontal cooperation. Int. J. Environ. Res. Public Health 2017, 14, 1332. [Google Scholar] [CrossRef] [PubMed]
  29. Liu, Z.; Zheng, X.X.; Gong, B.G.; Gui, Y.M. Joint Decision-Making and the Coordination of a Sustainable Supply Chain in the Context of Carbon Tax Regulation and Fairness Concerns. Int. J. Environ. Res. Public Health 2017, 14, 1464. [Google Scholar] [CrossRef] [PubMed]
  30. Zhu, W.; He, Y. Green product design in supply chains under competition. Eur. J. Oper. Res. 2017, 258, 165–180. [Google Scholar] [CrossRef]
  31. Raza, S.A.; Rathinam, S.; Turiac, M.; Kerbache, L. An integrated revenue management framework for a firm’s greening, pricing and inventory decisions. Int. J. Prod. Econ. 2018, 195, 373–390. [Google Scholar] [CrossRef]
  32. Zhao, S.; Zhu, Q.; Cui, L. A decision-making model for remanufacturers: Considering both consumers’ environmental preference and the government subsidy policy. Resour. Conserv. Recycl. 2018, 128, 176–186. [Google Scholar] [CrossRef]
  33. He, Y.; Xu, Q.; Xu, B.; Wu, P. Supply chain coordination in quality improvement with reference effects. J. Oper. Res. Soc. 2016, 67, 1158–1168. [Google Scholar] [CrossRef]
Figure 1. Profits as a function of consumers’ greenness sensitivity under two scenarios.
Sustainability 10 01902 g001
Figure 2. Prices as a function of consumer greenness sensitivity under two scenarios.
Sustainability 10 01902 g002
Figure 3. Greenness as a function of consumer greenness sensitivity under two scenarios.
Sustainability 10 01902 g003
Figure 4. Profits as a function of consumer greenness sensitivity under two scenarios.
Sustainability 10 01902 g004
Figure 5. Profit as a function of the fraction of consumers preferring green products in scenario 3.
Sustainability 10 01902 g005
Figure 6. Profits as a function of the fraction of consumers preferring green products under two scenarios.
Sustainability 10 01902 g006
Figure 7. Greenness as a function of consumer greenness sensitivity under two scenarios.
Sustainability 10 01902 g007
Figure 8. Profits as a function of consumer greenness sensitivity under two scenarios.
Sustainability 10 01902 g008
Table 1. Summary of Notations.
NotationDefinition
firms
θ j i Products’ greenness for firm j in scenario i
p j i Price for firm j in scenario i
π j i Profit for firm j in scenario i
c Unit variable cost
consumers
v Consumer valuation on products
k Fixed cost coefficient
γ Greenness sensitivity of consumers with no preference
δ Greenness sensitivity of consumers preferring green product
t x for x [ 0 , 1 ] Transportation cost for consumers with no preference at location x
α Fraction of consumers preferring green product
1 α Fraction of consumers with no preference
u j i Utility for consumers purchasing from firm j in scenario i
Table 2. Optimal Solutions for Scenario 1.
Firm 1Firm 2
Greenness θ 1 1 = 3 γ t 18 k t γ 2 _
Price p 1 1 = t + c + γ θ / 3 p 2 1 = t + c γ θ / 3
Profit π 1 1 = 9 k t 2 18 k t γ 2 π 2 1 = 2 t ( 9 k t γ 2 ) 2 ( 18 k t γ 2 ) 2
Table 3. Optimal Solutions for Scenario 2.
Firm 1Firm 2
Greenness θ 1 2 = γ 6 k θ 2 2 = γ 6 k
Price p 1 2 = t + c + γ ( θ 1 2 θ 2 2 ) / 3 p 2 2 = t + c + γ ( θ 2 2 θ 1 2 ) / 3
Profit π 1 2 = 18 k t γ 2 36 k π 2 2 = 18 k t γ 2 36 k
Table 4. Optimal Solutions for Scenario 3.
Firm 1Firm 2
Greenness θ 1 3 = ( 3 + α ) γ t 18 k t ( 1 α ) γ 2 _
Price p 1 3 = c + ( 3 + α ) t 3 ( 1 α ) + γ θ 3 p 2 3 = c + ( 3 α ) t 3 ( 1 α ) γ θ 3
Profit π 1 3 = ( α + 3 ) 2 k t 2 ( 1 α ) [ 18 k t ( 1 α ) γ 2 ] π 2 3 = 2 t [ ( 9 3 α ) k t ( 1 α ) γ 2 ] 2 ( 1 α ) [ 18 k t ( 1 α ) γ 2 ] 2
Table 5. Optimal Solutions for Scenario 4.
Firm 1Firm 2
Greenness θ 1 4 = α δ + ( 1 α ) γ 6 k θ 2 4 = α δ + ( 1 α ) γ 6 k
Price p 1 4 = t + c + ( θ 1 4 θ 2 4 ) ( α δ + ( 1 α ) γ ) 3 p 2 4 = t + c + ( θ 2 4 θ 1 4 ) ( α δ + ( 1 α ) γ ) 3
Profit π 1 4 = 18 k t ( α δ + ( 1 α ) γ ) 2 36 k π 2 4 = 18 k t ( α δ + ( 1 α ) γ ) 2 36 k

