Article

Effects of Forest Restoration on Soil Carbon, Nitrogen, Phosphorus, and Their Stoichiometry in Hunan, Southern China

1
Faculty of Life Science and Technology, Central South University of Forestry and Technology, Changsha 410004, China
2
Huitong National Station for Scientific Observation and Research of Chinese Fir Plantation Ecosystems in Hunan Province, Huitong 438107, China
3
Chinese Research Academy of Environmental Science, Beijing 100012, China
*
Author to whom correspondence should be addressed.
Sustainability 2018, 10(6), 1874; https://doi.org/10.3390/su10061874
Submission received: 28 April 2018 / Revised: 1 June 2018 / Accepted: 3 June 2018 / Published: 4 June 2018

Abstract

:
Forest restoration affects nutrient cycling in terrestrial ecosystems. However, the dynamics of carbon (C), nitrogen (N), and phosphorous (P), and their stoichiometry (C:N:P ratio) in the soil during forest restoration are poorly understood in subtropical areas. In the current study, we collected soil samples at three depths (0–10, 10–20, and 20–30 cm) at three restoration stages (early, intermediate, and late) in subtropical forests. Soil organic carbon (SOC), total nitrogen (N), and total phosphorous (P) concentrations were determined. Forest restoration significantly affected soil nutrient concentrations and stock (p < 0.05). SOC concentrations increased from 12.6 to 18.6 g/kg and N concentrations increased from 1.2 to 1.6 g/kg, while P decreased from 0.3 to 0.2 g/kg. A similar pattern of change was found for the nutrient stock as restoration proceeded. C:P and N:P ratios increased to a greater extent than that of C:N ratios during forest restoration, implying that subtropical forests might be characterized by P limitation over time. The slopes and intercepts for the linear regression relationships between SOC, N, and P concentrations were significantly different across the forest restoration stages (p < 0.05). This indicated that forest restoration significantly affects the coupled relationships among C-N, C-P, and N-P in subtropical forest soil. Our results add to the current body of knowledge about soil nutrient characteristics and have useful implications for sustainable forest management in subtropical areas.

1. Introduction

Forest restoration leads to changes in tree species composition with different traits. These shifts result in different amounts and quality of litter (leaves and fine roots) input, nutrient uptake by trees, and microclimates for litter decomposition, which, in turn, influence soil organic carbon (SOC), total nitrogen (N), and total phosphorous (P) dynamics and their stoichiometry (carbon (C):N:P ratio), ultimately affecting nutrient recycling [1,2]. SOC, N, and P reflect soil fertility and terrestrial productivity [2,3,4,5,6]. Understanding how forest restoration affects SOC, N, P, and their stoichiometry (C:N:P ratio) is critical for predicting C pools, soil nutrient balance, and achieving sustainable forest management [4,5,6].
Previous studies have suggested that forest restoration could improve the concentrations of C and N in the soil due to accumulative organic matter input from aboveground litterfall and root turnover [2,7,8]. However, to date, the variation in soil P with forest restoration remains unknown. Following forest restoration, soil P has been shown to increase [9], decrease [10], or remain constant [11]. These inconsistent results are attributable to the complex abiotic and biotic processes of the soil P [12]. Soil P is primarily derived from parent minerals during weathering and litter decomposition [12]. Subtropical soils are usually strongly weathered and have a low total P content and availability [12,13]. Furthermore, more efficient P resorption has been found in fresh leaves compared to a significant decline in the P content from plant litter across forest restoration stages, which implies that less P is returned to soil through litter decomposition in forests [14]. The rest of the P is tied up with plant growth following forest restoration, leading to a depletion-driven limitation [12]. N:P ratios have been shown to become significantly higher in both fresh leaves and litterfall from early- to late-restoration species, and late-restoration species are more likely to recycle P than N. This implies that the nutrient limitation shifts from N at the early restoration stage (young stands) to P at the late restoration stage (old stands) [14,15,16,17].
Previous studies have shown that forest type, climatic characteristics, and soil depth influence the soil stoichiometry in forest ecosystems [18,19,20,21,22]. For instance, the N:P ratios and C:P ratios in soils have both been shown to decrease, while no significant difference has been shown for the C:N ratio of monsoon evergreen broad-leaved forests across three restoration stages (15 years old, 30 years old, and primary forest) in Yunnan, Southwest China [23]. Jiao et al. [24] pointed out a tendency for the N:P ratio to increase across forest restoration stages in the Loess Plateau, China. Previous studies have also shown that C, N, and P are closely-coupled (related) in forest soil [1,25]. A well-constrained (consistent) C:N:P ratio at a depth of 0–10 cm on the global scale was found through a literature review [26]. In China, a constrained C:N:P ratio was also found on a national scale [22]. However, less attention has been paid on understanding the change in nutrient stoichiometry and their coupled relationships in soil with forest restoration.
In recent years, variations in soil nutrients and stoichiometry across forest restoration stages or successions were reported in the northwest Loess Plateau [8,27,28] and the southwestern karst area [29] in China. However, in Southern China, while variations in stoichiometry in plant tissues have been examined in subtropical forests [14,30], soil stoichiometry dynamics across forest restoration stages have been poorly investigated [17,30,31]. Sub-tropical forests in South China are composed of diverse species and are restored quickly. Therefore, the influence of forest restoration on SOC, N, and P dynamics and their stoichiometry may differ from those in other areas.
The current study was carried out in diverse tree species forests in the subtropical area of China, where evergreen broad-leaved forests are the climax vegetation [14]. Most of these forests have been changed into secondary forests at different restoration stages over previous decades due to human activities, such as firewood collection and tree felling. In this study, three forest types (coniferous and evergreen broad-leaf mixed forest dominated by Pinus massoniana and Lithocarpus glabe (PM-LG), deciduous forest dominated by Choerospondias axillaris (CA), and evergreen broad-leaves forest dominated by Cyclobalanopsis glauca and Lithocarpus glaber (CG-LG), representing secondary forests at three restoration stages (early, intermediate, and late) in the subtropical area, were selected to investigate the dynamics of SOC, N, and P concentrations, as well as their stoichiometries at depths of 0–10, 10–20, and 20–30 cm. Specifically we hypothesized that (1) concentrations and stocks of SOC and N would increase while those of P would decrease as forest restoration stages proceeded; and (2) C:P and N:P ratios would increase to a greater extent than the C:N ratio, with P becoming the limitation along forest restoration stages.

2. Materials and Methods

2.1. Description of Study Site

The study site was located in the Dashanchong Forest Park (latitude 28°24′58′′ N; longitude 113°19′08′′ E; elevation 55–260 m a.s.l.), Changsha County, Hunan, China (Figure 1). The annual average air temperature in this area is 17.3 °C and the annual mean rainfall is 1420 mm, occurring mostly during the growing season [32,33]. The soil is identified as Alliti–Udic Ferrosols, which matches the Acrisol type in the World Reference Base for Soil Resource [34].
Evergreen broad-leaved forests are the climax vegetation in this region. The secondary forests are in different phases of restoration (early, mid, and late) following anthropogenic disturbances. The three secondary forests originated from secondary restoration in regions where firewood collection has been outlawed since the late 1950s. We selected three forest stands along different stages of restoration based on species composition under different disturbance levels. The three forest types and their component tree species, according to percentage of basal area at breast height (1.3 m), were (1) high-level disturbances: a coniferous mixed forest (PM-LG) composed of 60% coniferous species (P. massoniana), 25% evergreen broadleaved species (L. glaber), and 15% other tree species; (2) middle-level disturbances: a deciduous mixed forest (CA) composed of 65% deciduous species (C. axillaris), 6% Loropetalum chinensis, 6% Symplocos setchuensis, and 23% other tree species; and (3) lower-level disturbances: an evergreen broadleaved forest (LG-CG) composed of 53% evergreen broadleaved species (37% L. glaber and 16% C. glauca), 16% P. massoniana, and 31% other tree species.
In 2009, three 1-ha permanent study plots were established for the three forests at different restoration stages. Each 1-ha study plot was divided into 100 subplots of 10 m × 10 m to map the locations of individual trees and to record the diameters of tree species at breast height (1.3 m), height, and crown width. Detailed descriptions of the three forests characteristics are described in Table 1.

2.2. Field Soil Sampling and Laboratory Analysis

We collected soil samples between 25 May and 16 June in 2014. Within each 10 m × 10 m subplot of each study plot, a quadrat with an area of 50 cm × 50 cm was set up for soil sampling. After removing the litter layer carefully by hand from the topsoil, four samples were collected from each depth (0–10, 10–20, 20–30 cm). The four samples were then mixed by hand to form one composite sample for each layer at the subplot. The soil samples were stored at 4 °C until they were analysed. In addition, three soil cores from each depth were collected using a steel soil corer (a diameter of 5.0 cm and length of 5.0 cm) and sealed in air-tight containers for measurement of bulk density.
Before the physicochemical analyses, all soil samples were air-dried and then sieved through a 2 mm sieve to remove the stones, litter, and plant roots. The soil bulk density was determined by dividing the oven-dried mass of soil samples by their core volumes [35]. The SOC concentrations were determined using the potassium oxidation method (K2Cr2O7/H2SO4) [36], which involves oxidizing an aliquot of soil (0.5 g) with a solution of K2Cr2O7 and H2SO4 at 170 °C. The excess dichromate was titrated with 0.25 mol L−1 FeSO4. An oxidation factor of 1.1 was used, based on the supposition that 91% of organic C was oxidized in the procedure. The N concentrations were measured with the Semimicro–Kjeldahl method [37], involving the digestion of soil (1.0 g) with a catalyst (H2SO4–K2SO4–CuSO4–Se mixture) at 380 °C. Then, the sample was distilled by adding 30 mL NaOH. Released ammonium was captured in 10 mL of H3BO3. The titer of the ammonium borate formed was measured by addition of 0.05 N H2SO4, using a methyl red and bromocresol green indicator. The P concentrations were measured by the Mo–Sb colorimetric method [38] after HClO4–H2SO4 digestion.

2.3. Data Analyses

The soil’s organic C stock (Cs), N stock (Ns), and P stock (Ps) (all in Mg/ha) for each soil profile were calculated according to the following equations [39]:
C s = i n [ D i × S O C i × B D i × ( 1 G i ) ] / 10 ,
N s = i n [ D i × TN i × B D i × ( 1 G i ) ] / 10 ,
P s = i n [ D i × TP i × B D i × ( 1 G i ) ] / 10 ,
where n represents the number of soil layers; i represents the ith depth; SOCi, Ni, and Pi are the concentrations of SOC, N, and P (g/kg) at the corresponding ith depth; Di, BDi, and Gi are the thickness (cm) in the corresponding ith soil depth, soil bulk density (g/cm3), and the percent (%) of coarse (>2 mm) fragments, respectively.
The normality of the data was determined using the Kolmogorov-Smirnov test. All data were log transformed when necessary to meet the assumption of normality. Differences in SOC, N, P concentrations, stock, and their ratios between the three soil layers at the same restoration stage or between the three restoration stages at the same soil depth were evaluated using one-way analysis of variance (ANOVA), followed by the least significant difference (LSD) test.
We used standardized major axis (SMA) regressions [40] to quantify the relationships between the concentrations of SOC, N, and P across the three restoration stages. We also tested the differences in the slopes and the intercepts of the regressions between the three restoration stages using the R package, Smatr 3.4-1 [40]. If significant differences were found, this indicated that forest restoration had significantly affected the coupled relationships among C-N, C-P, and N-P. All of these analyses were performed with R version 3.4.1 [41].

3. Results

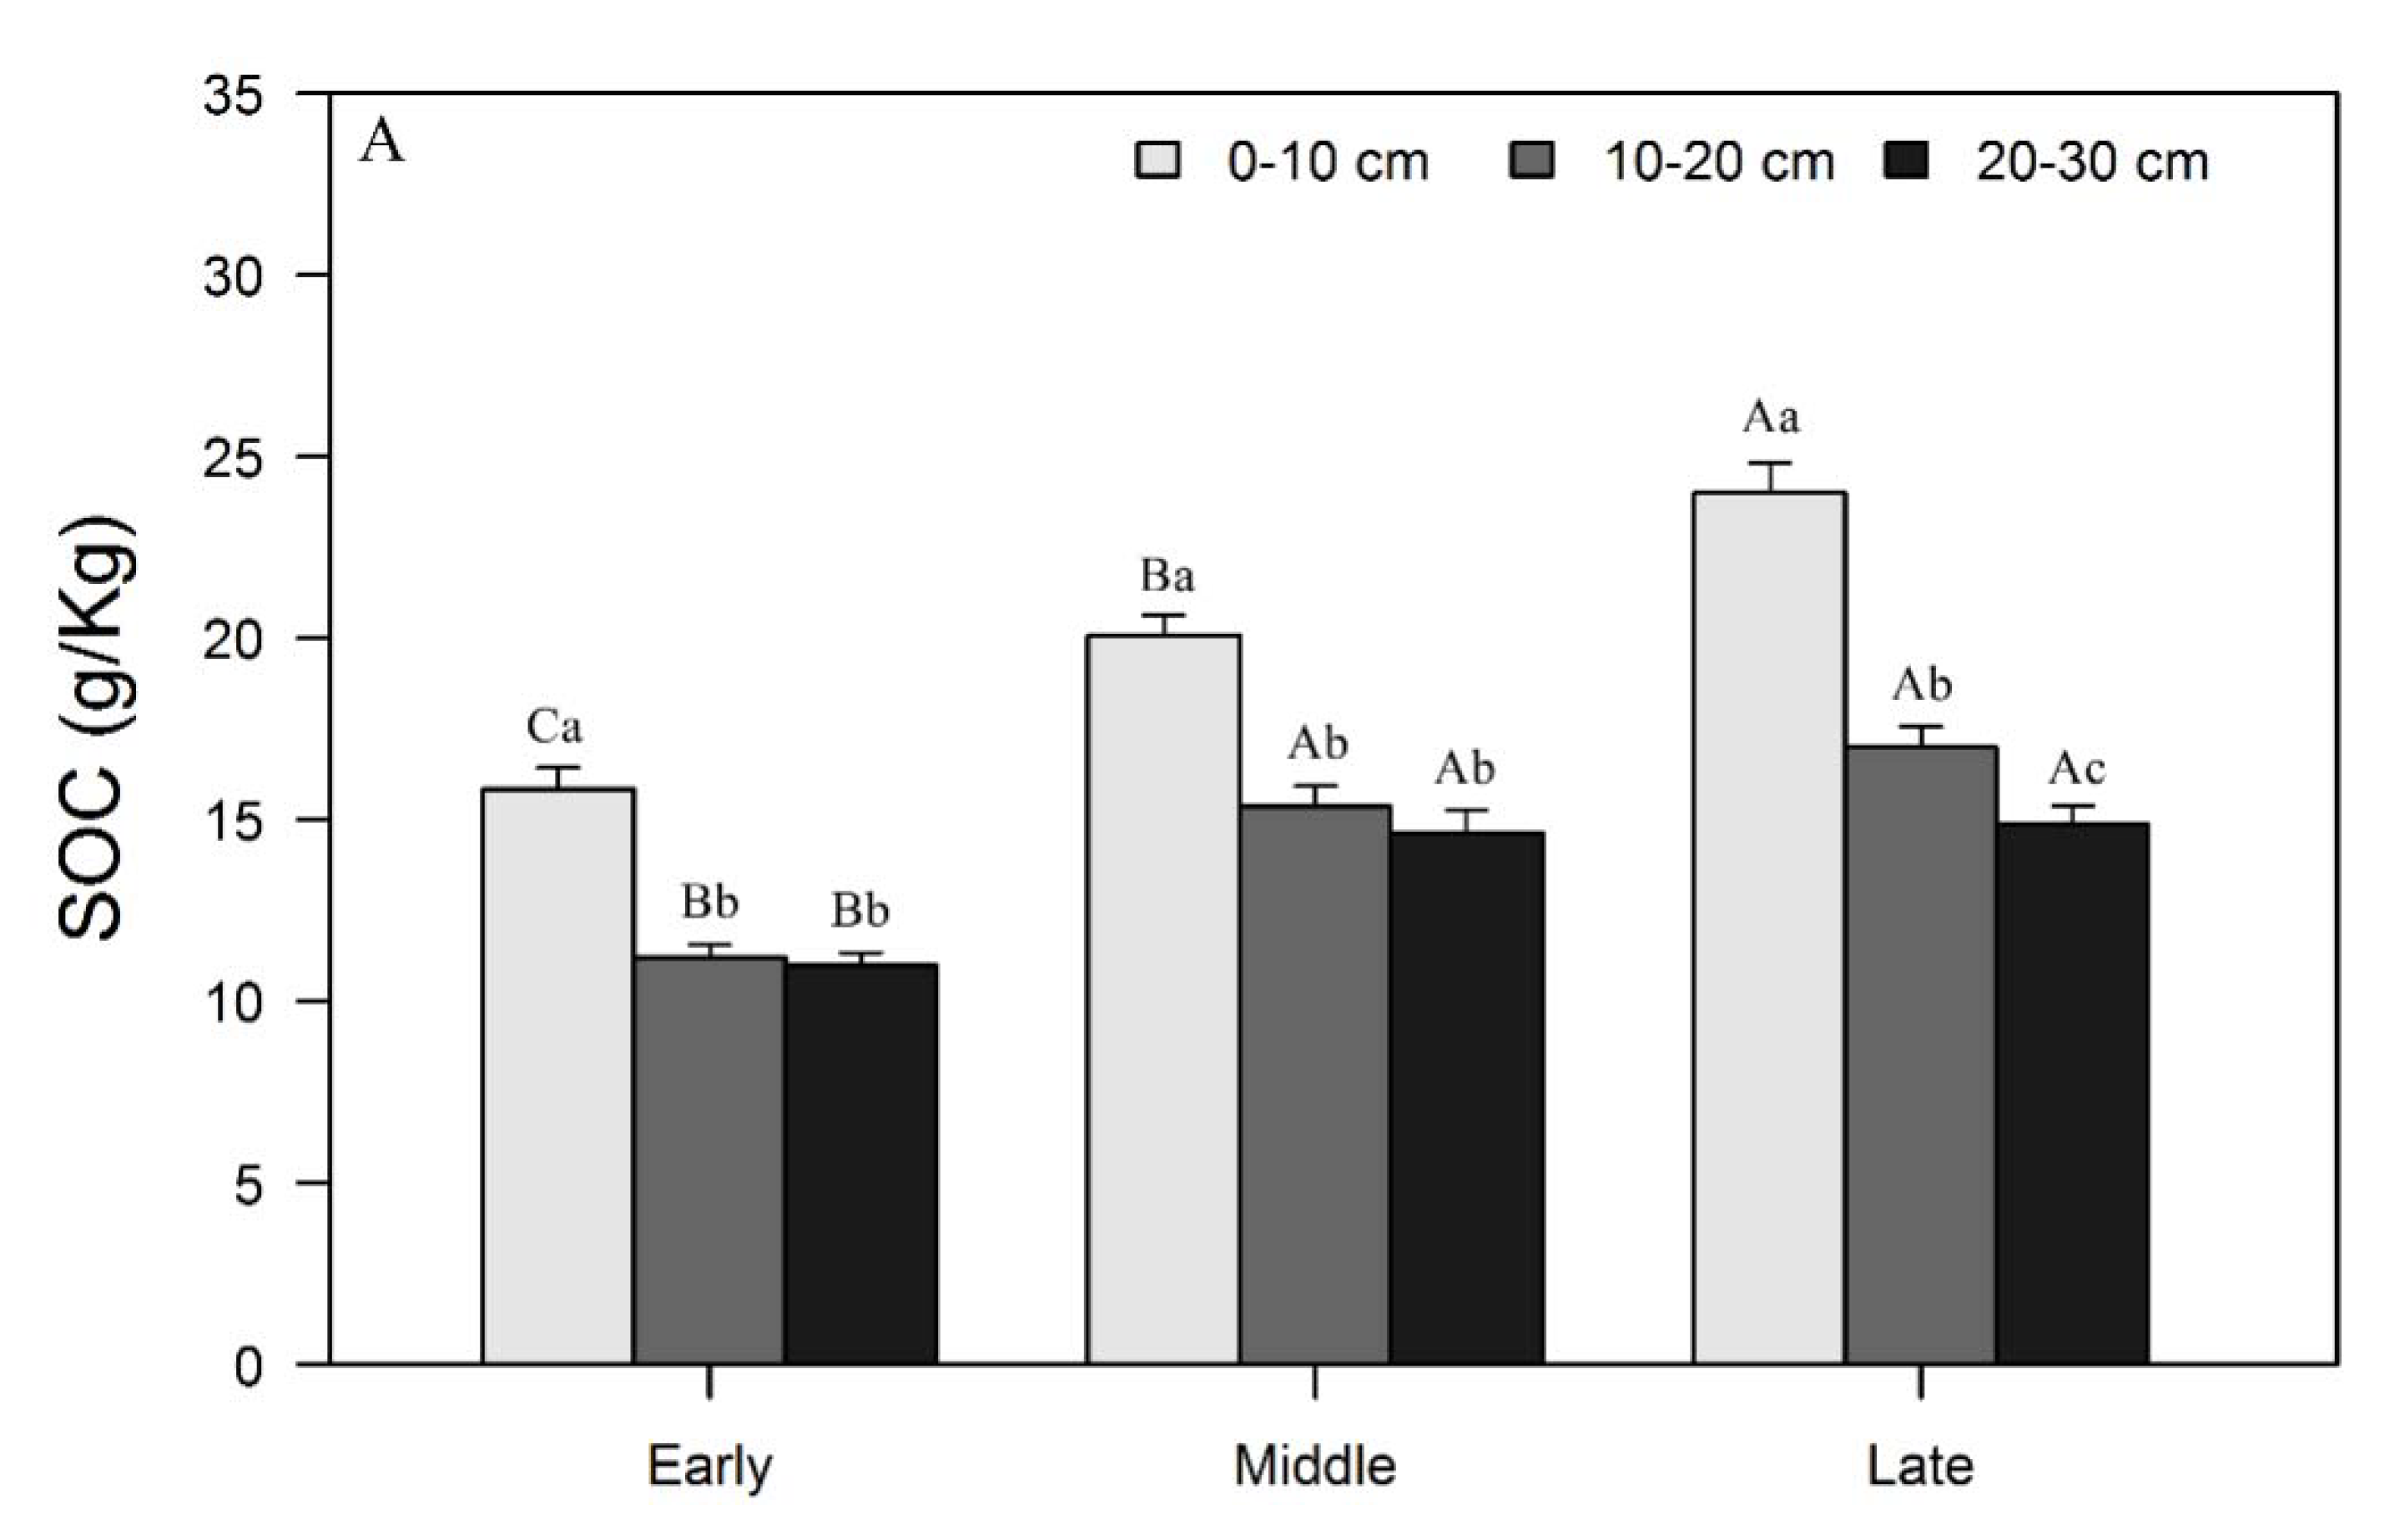
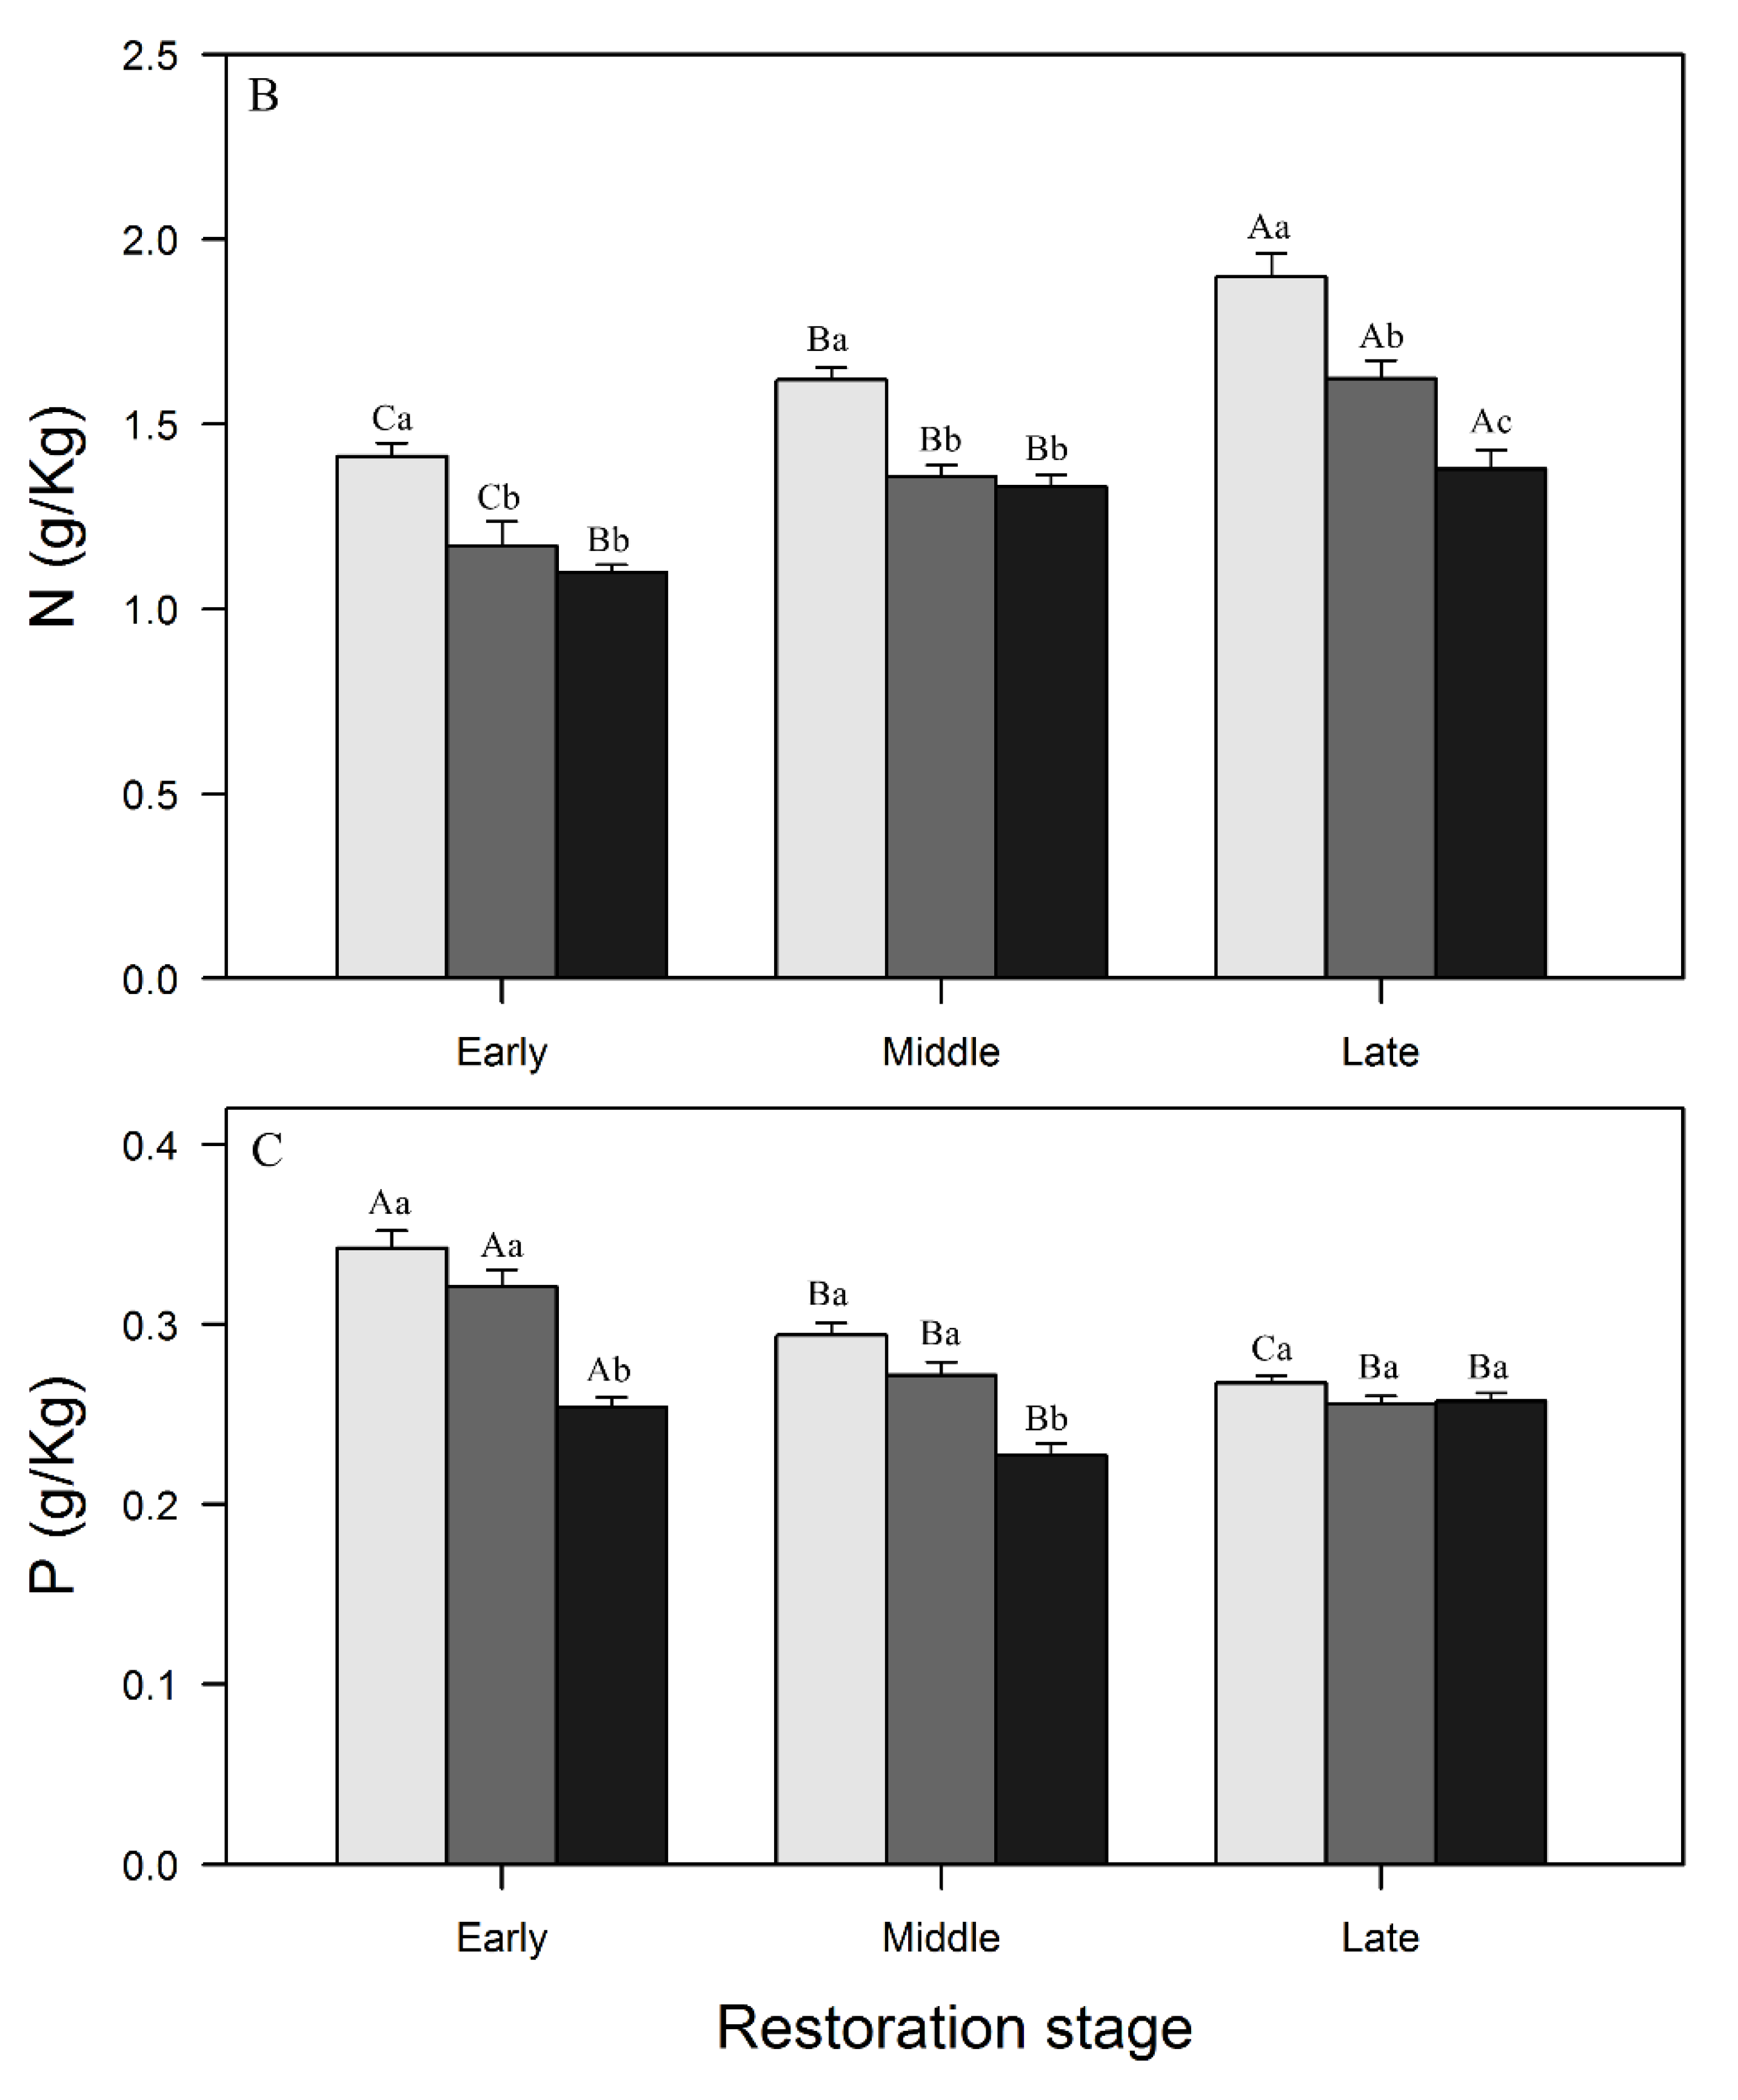
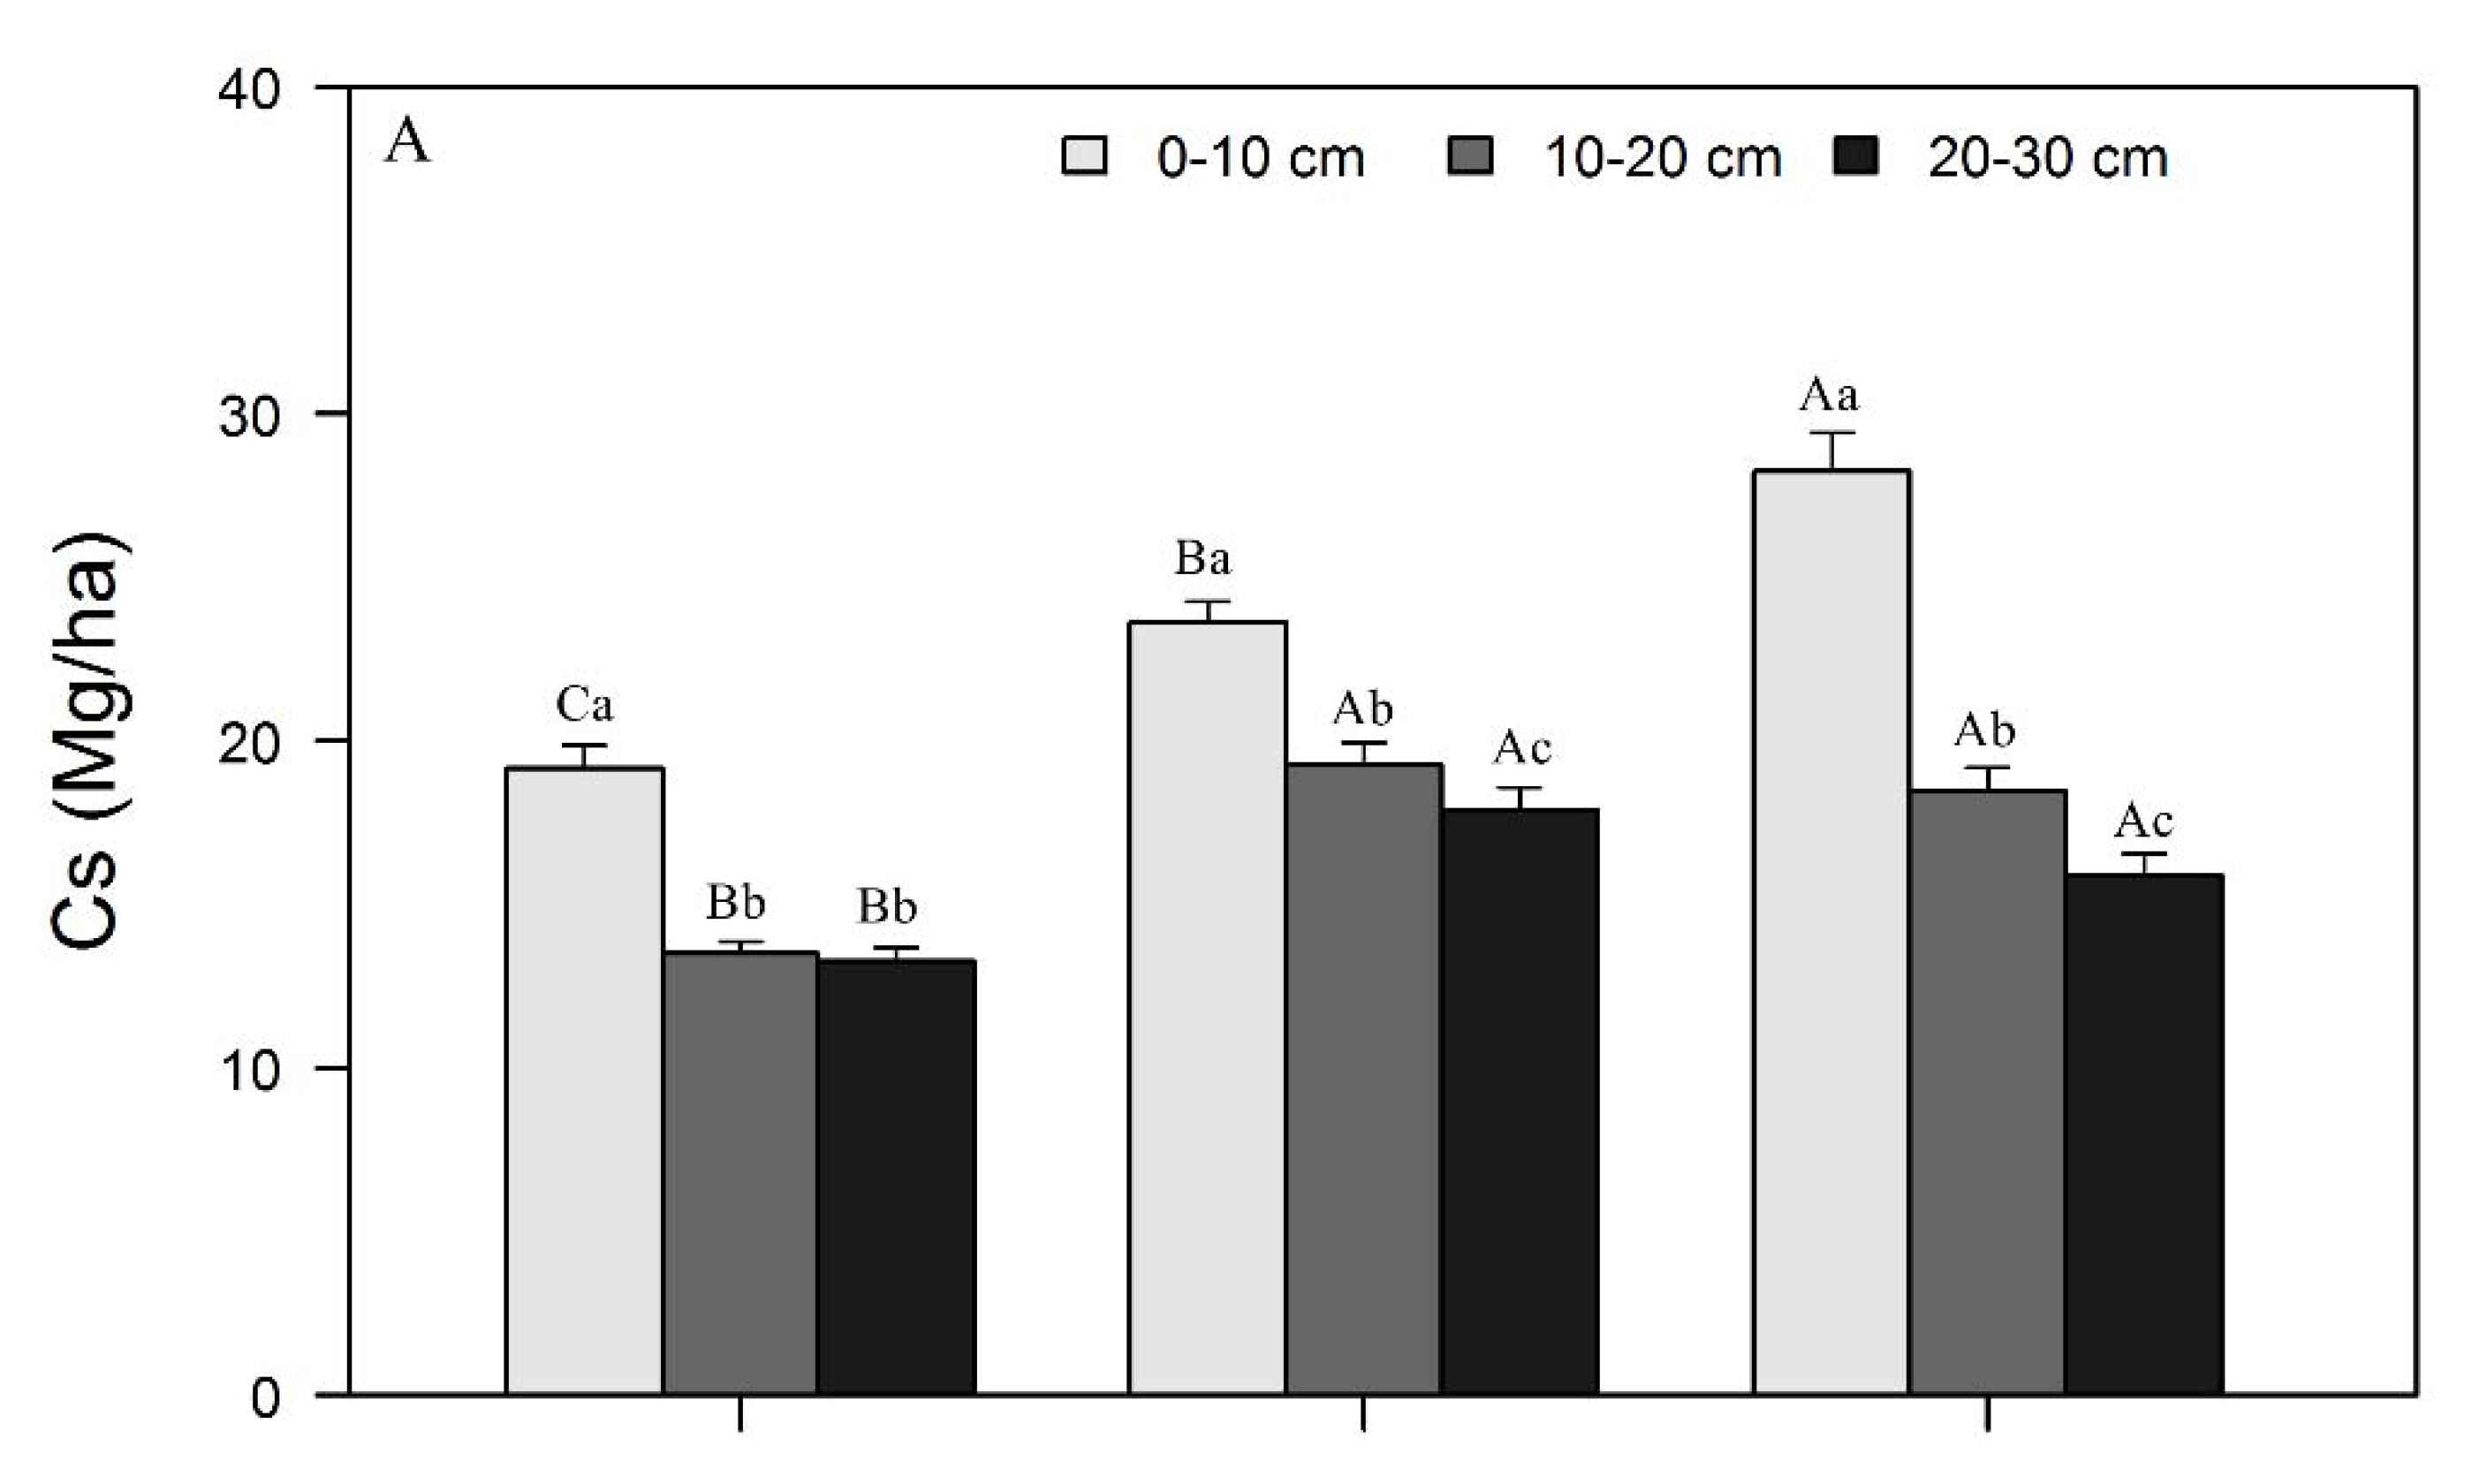
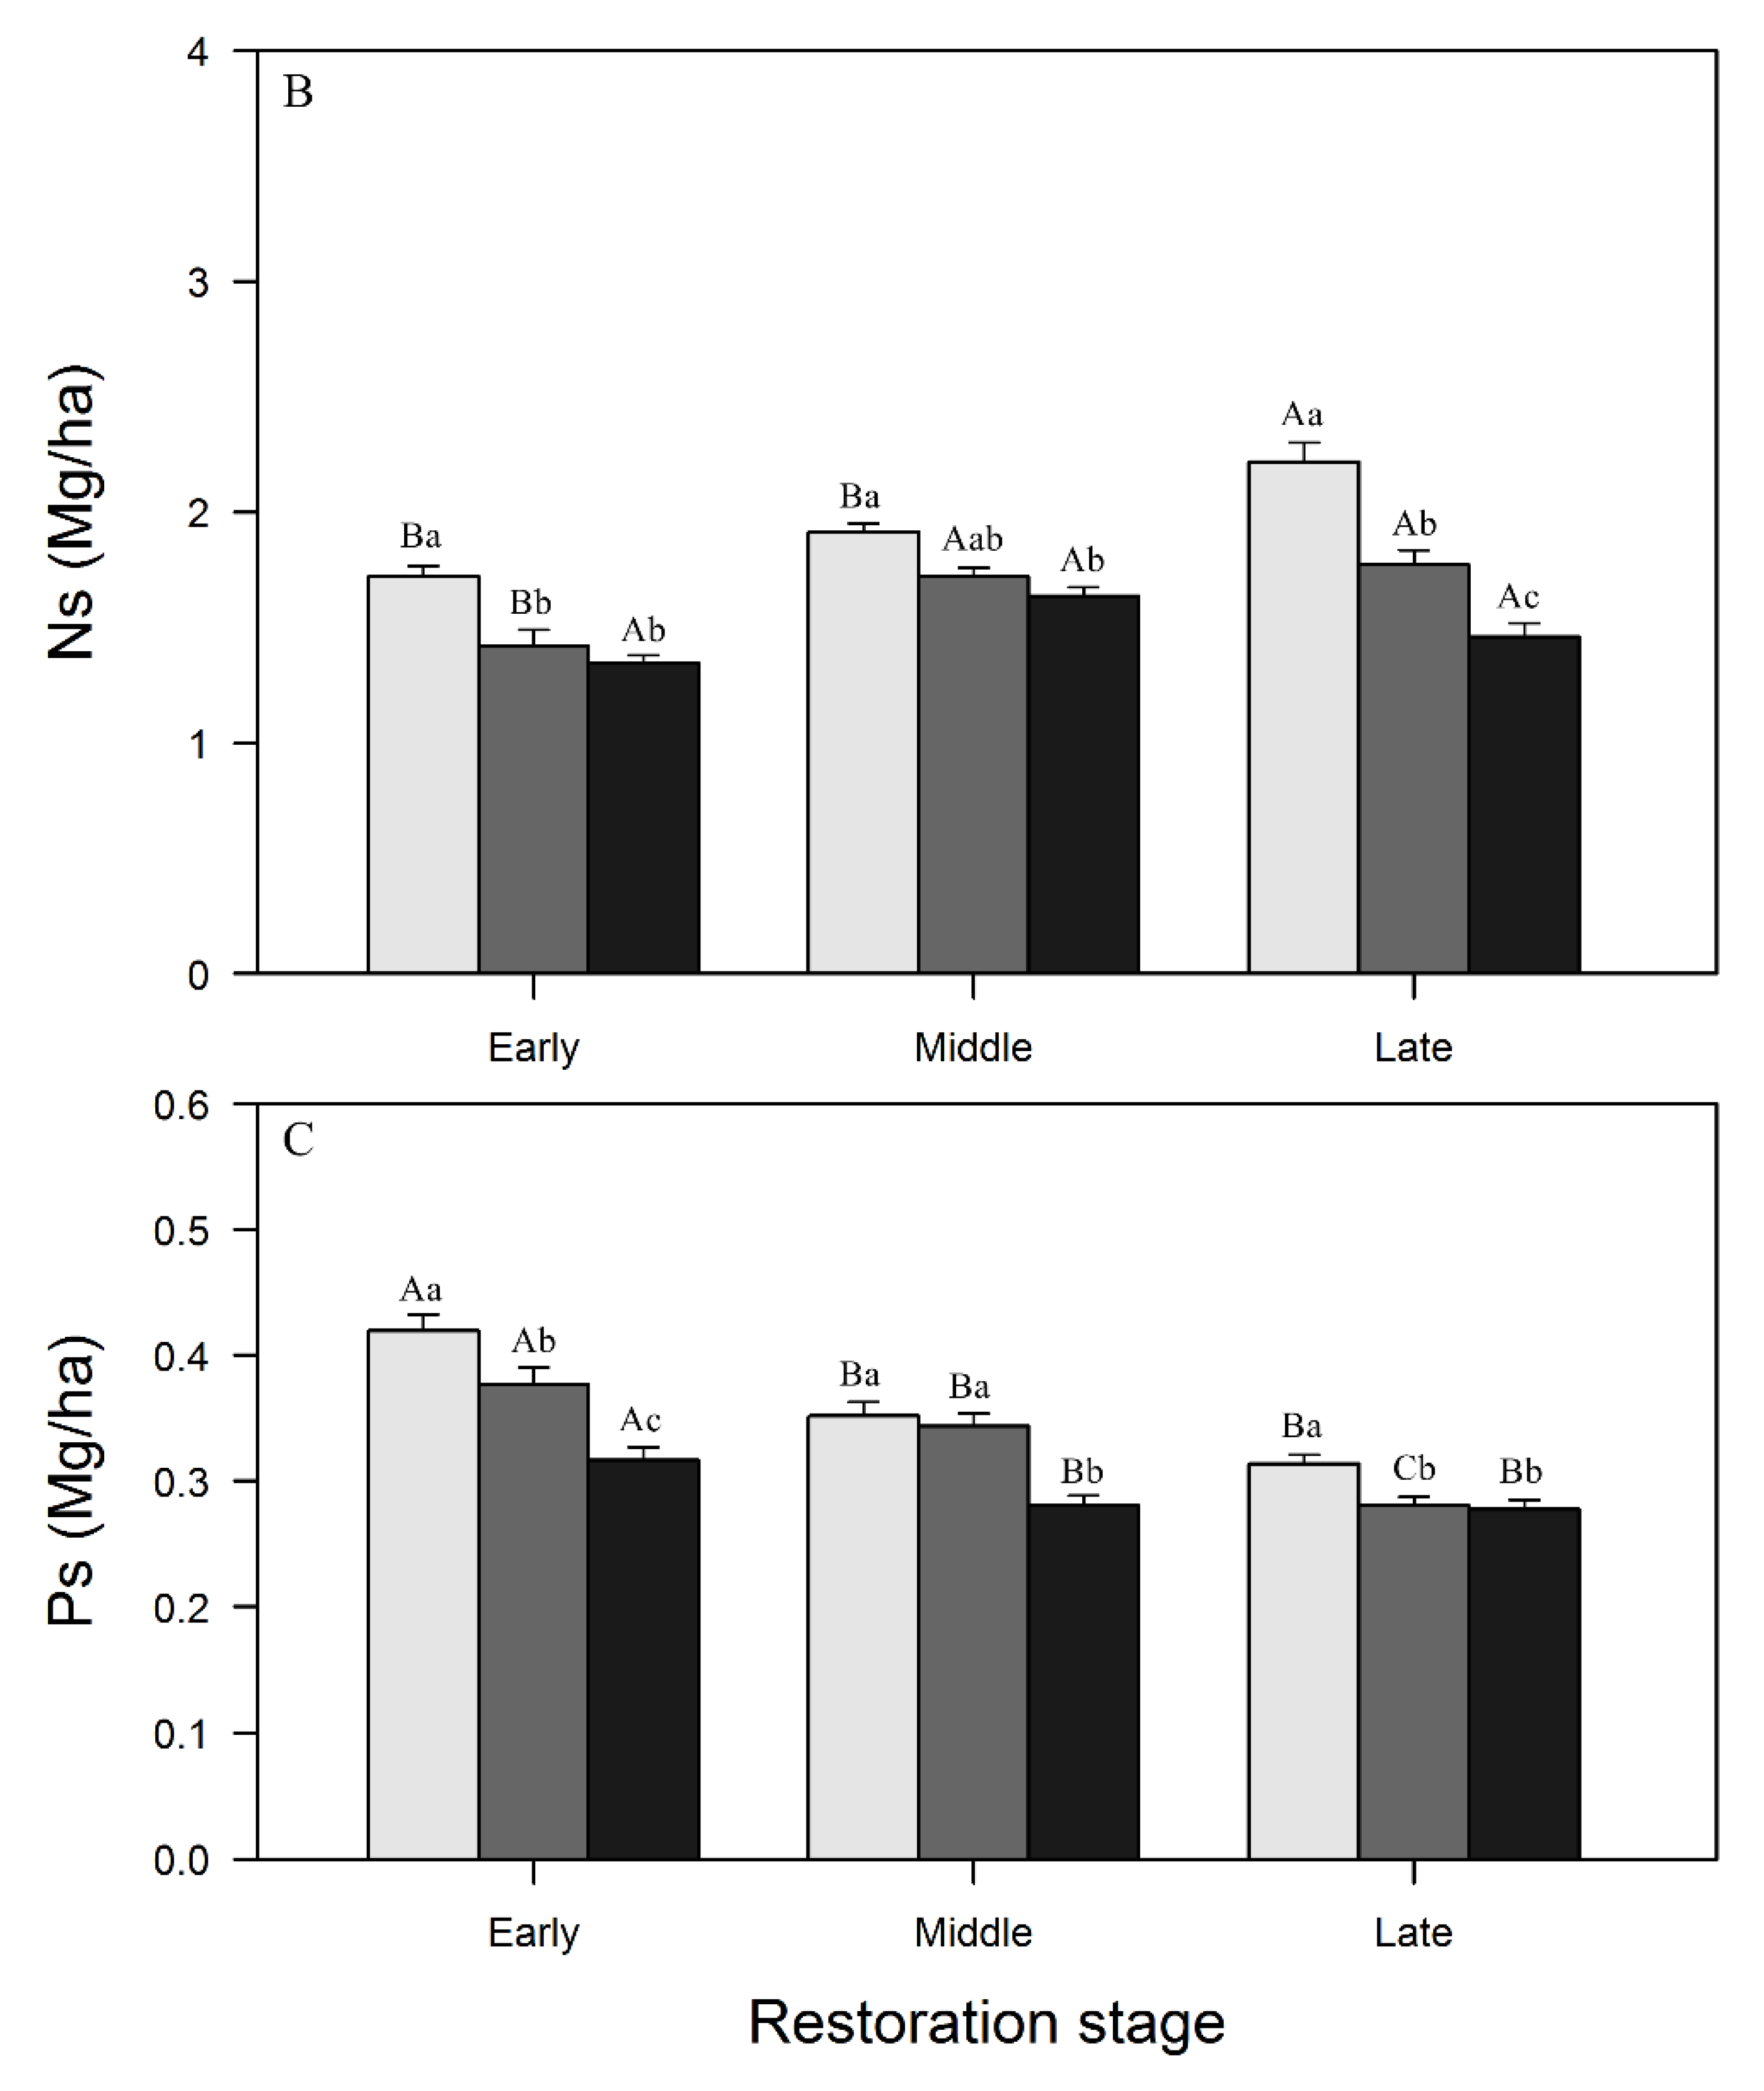
3.1. Variations in SOC, N, and P Concentrations and Stocks across Restoration Stages and Soil Depth

The SOC and N concentrations and stocks increased across the forest restoration stages for all soil layers (Figure 2A,B and Figure 3A,B).
The mean 0–30 cm SOC concentration increased from the early stage (12.6 ± 0.3 g/kg) to the late stage (18.6 ± 0.6 g/kg), as did the average soil N concentration (1.2 ± 0.03 g/kg to 1.6 ± 0.05 g/kg). Similarly, there were increases from the early to the late stage in total CS (0–30 cm) (46.0 ± 1.2 Mg/ha to 62.5 ± 2.2 Mg/ha) and total NS (4.5 ± 0.1 Mg/ha 5.4 ± 0.2 Mg/ha). At any given restoration stage, the SOC and N concentrations and stocks decreased with soil depth, while soil P concentrations and stock were lower at all three depths across the forest restoration stages (Figure 2C and Figure 3C).
The average P concentration decreased from the early stage (0.3 ± 0.006 g/kg) to the late stage (0.2 ± 0.004 g/kg) at 0–30 cm as did the total PS at 0–30 cm (1.1 ± 0.02 Mg/ha to 0.9 ± 0.01 Mg/ha). There were no significant differences in the P concentration or stock between the middle stage and the late stage (p > 0.05). A pronounced decrease was found in the P concentration and stock at 0–10 cm across the forest restoration stages (p < 0.05) (Figure 2C and Figure 3C).

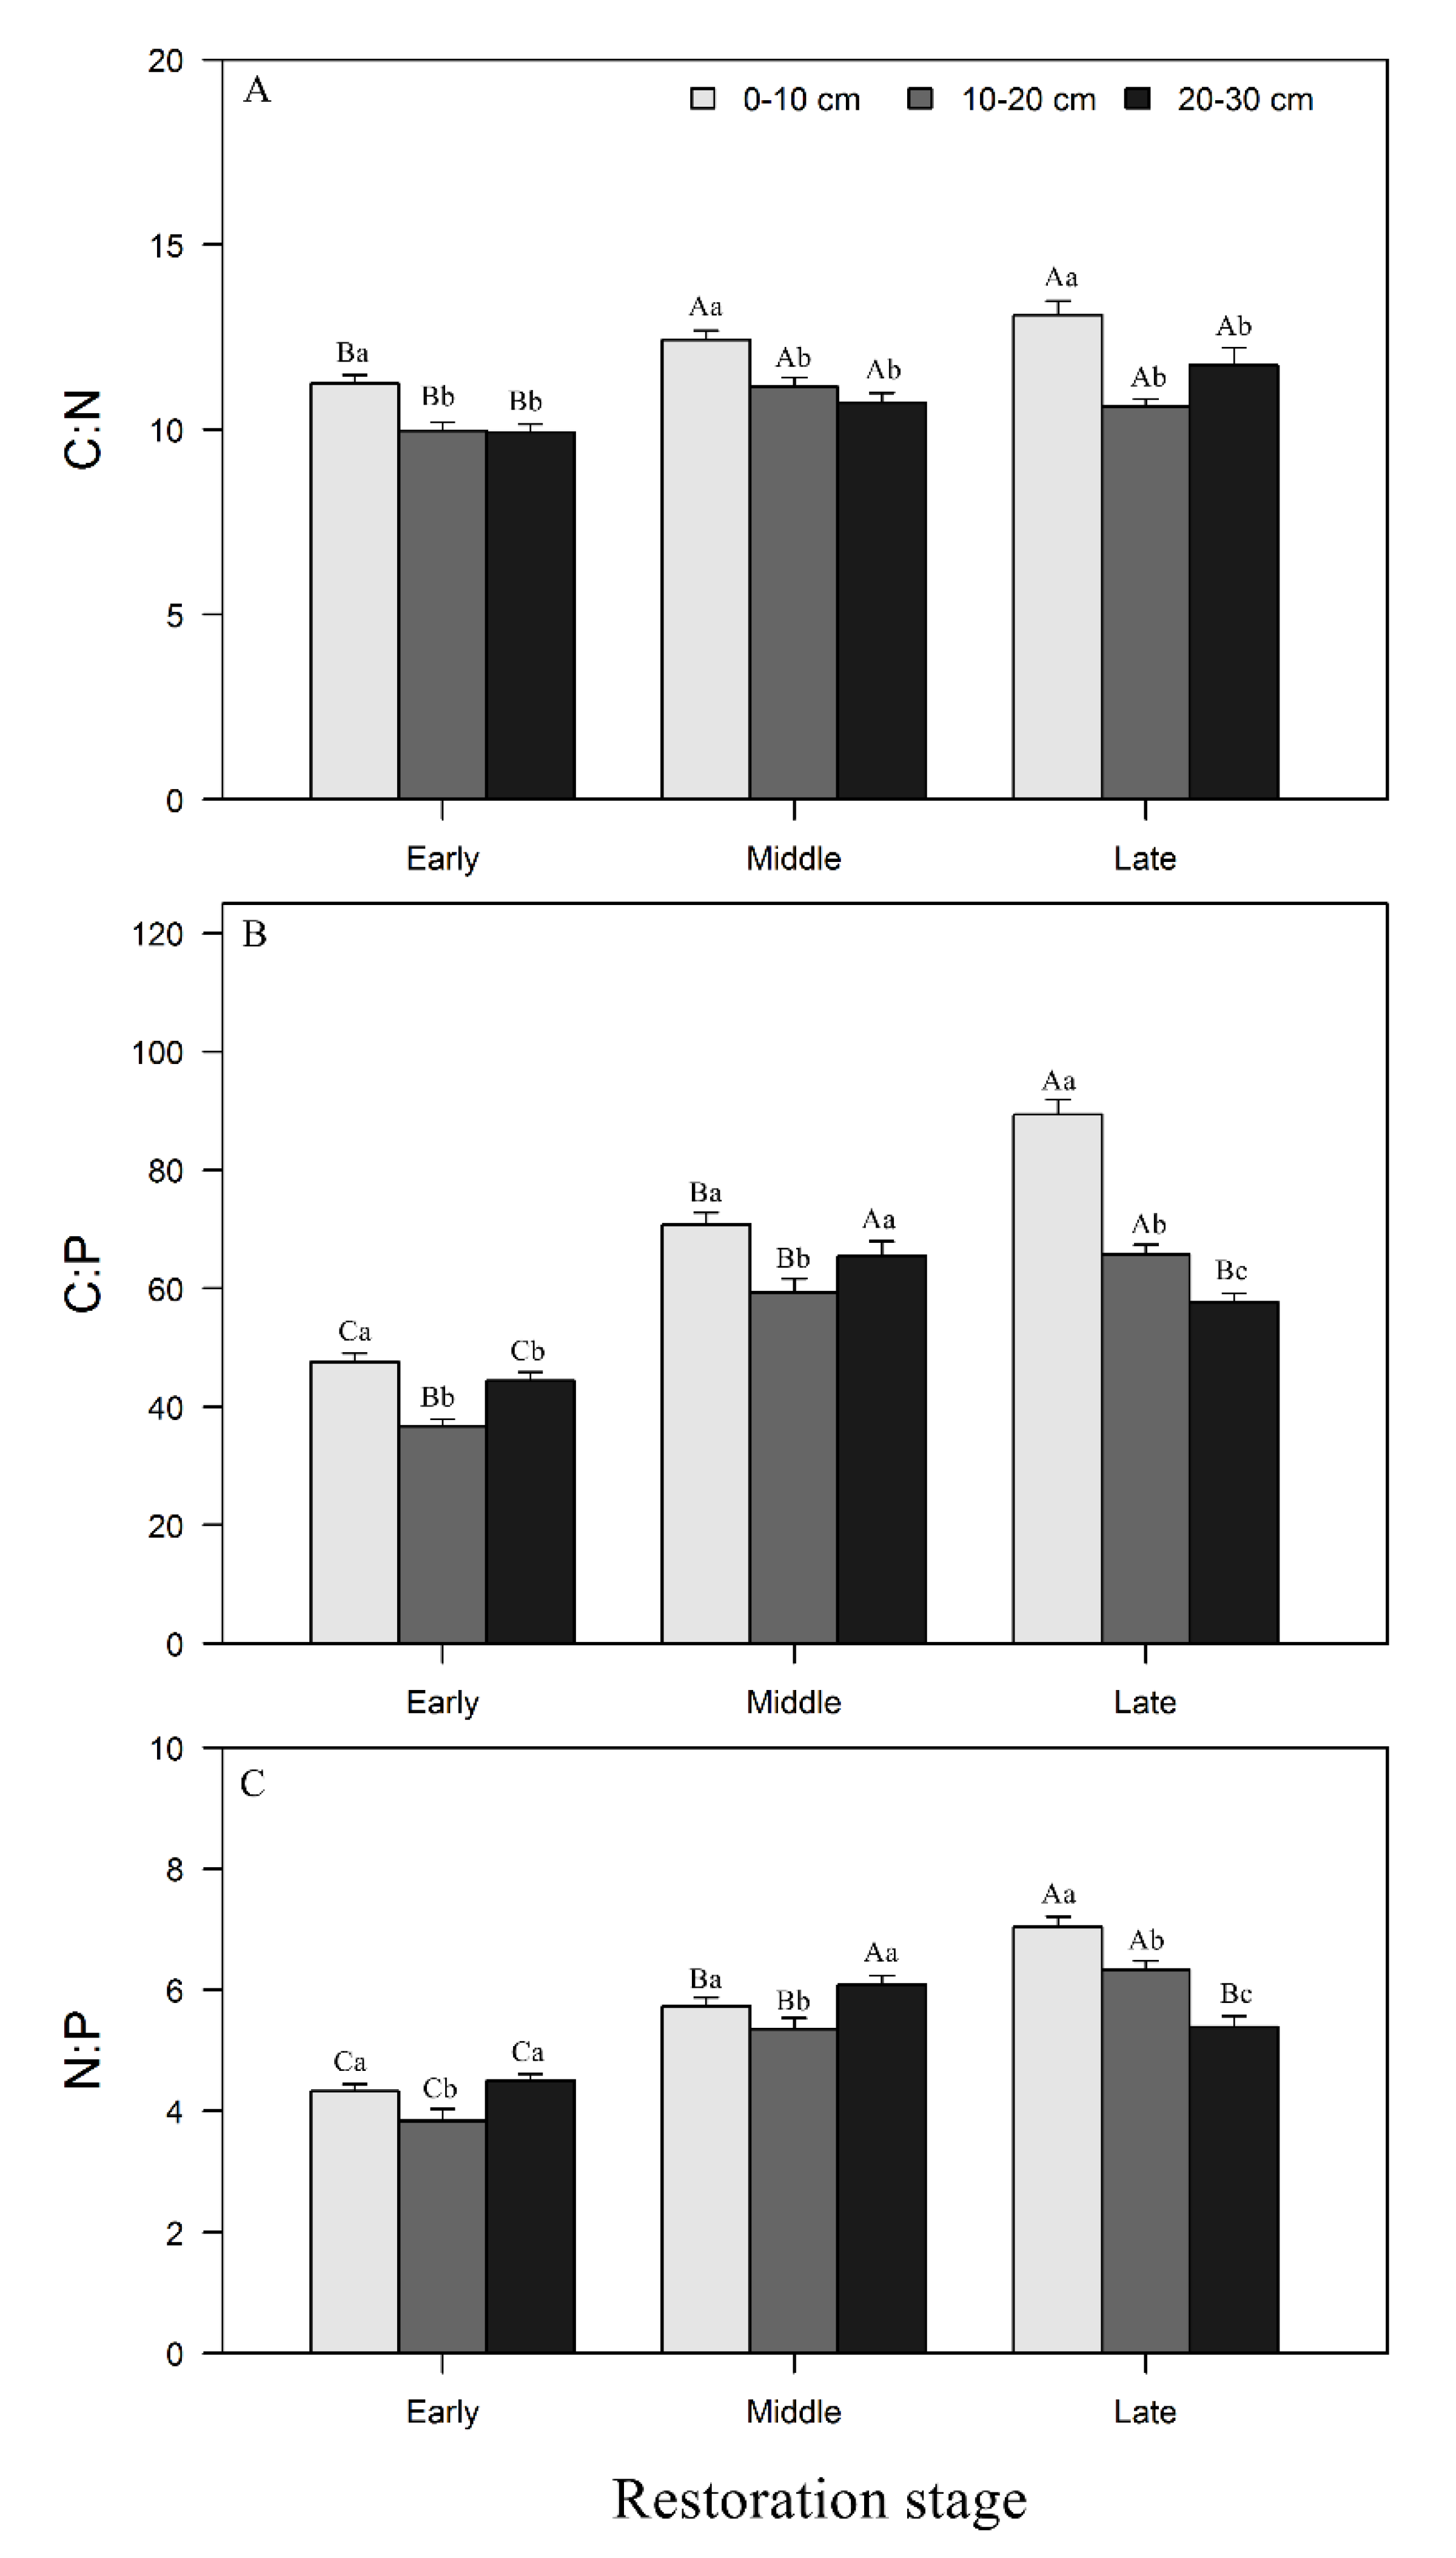
3.2. Changes in Soil Stoichiometry across Forest Restoration Stages and Soil Depth

The C:N ratios at the early stage were significantly lower (p < 0.05) than those at the middle and late stages at all soil depths (Figure 4A). No significant differences were found in the C:N ratio between the middle stage and the late stage at all soil layers (p > 0.05). The C:N ratio at a depth of 0–10 cm was significantly larger (p < 0.05) than at the 10–20 and 20–30 cm depths for all restoration stages (Figure 4A).
The N:P and C:P ratios increased across forest restoration stages, and these ratios differed significantly between restoration stages (Figure 4B,C).
The C:P and N:P ratios were larger at the late stage than at the middle and early stages at depths of 0–10 and 10–20 cm. However, the two ratios were significantly (p < 0.05) larger at the middle stage than the early and late stages at a depth of 20–30 cm (Figure 4B,C). The C:P ratio was significantly (p < 0.05) higher at 0–10 cm than at 0–10 and 20–30 cm for all restoration stages. There were no differences (p > 0.05) in the N:P ratio between the early stage and middle stage at depths of 0–10 and 20–30 cm. However, significant differences were found among the three soil layers at the late stage (Figure 4C).
Significantly positive linear correlations were found for the concentrations of SOC, N, and P between the three restoration stages (p < 0.01) (Figure 5).
Furthermore, all the slopes and intercepts of the regression lines of the SOC, N, and P concentrations significantly differed across the three restoration stages (p < 0.01, SMA test, Table 2).

4. Discussion

4.1. Changes in SOC, N, and P Concentrations and Stocks with Restoration and Soil Depth

Forest restoration is found to be a critical factor in determining changes in soil concentrations of C, N, and P. The mechanism of soil organic matter decomposition and the ecosystem nutrient cycling pattern at each restoration stage can be different owing to different plant species present in each restoration stage [42,43,44]. In the present study, as forest restoration proceeded, the SOC and N concentrations and stocks significantly increased. This result supports our first hypothesis and is in agreement with the previous reports [8,26,45]. This is likely due to more SOC and nutrients being released from microbial decomposition and accumulated in the soil from the input of litter and roots with vegetation recovery [8,46]. Some researchers have reported that at the later restoration stage, forests have more fine roots than at earlier restoration stages [26,46]. Fine roots are easy to turnover, which could result in higher SOC and N concentration inputs into the soil [28]. In the same forests investigated in this study, it has been shown that there was more SOC and N released from litter in the late stage of reforestation due to a higher litter decomposition rate than at the early stage [47]. The total standing fine root biomass and their turnover (dead roots) also increases with forest restoration [28,48], which in turn leads to higher SOC and N concentrations.
In contrast, P is derived primarily from rock weathering [12], and the decline in soil P during forest restoration could have resulted from increased demands by plants due to biomass accumulation [12,25]. In the red soil region in Southern China, P has also been proven to be a primary limiting factor due to the serious erosional losses that have taken place [20]. In our previous study, more efficient P resorption and a decline in P content in plant litter from early to late restoration species was found [14], which implies that less P is returned to soils through litter decomposition.
The concentrations of SOC, N, and P at a depth of 0–10 cm were higher than those at the 10–20 and 20–30 soil depths for all stages. This result is in line with some previous studies that reported that more active SOC and soil nutrients are sequestered in the topsoil due to most natural biological processes occurring at the soil surface in forest ecosystems [22,49,50,51].

4.2. Variation of Soil Stoichiometry with Forest Restoration and Soil Depth

Globally, a well-balanced C:N:P mass ratio is 186:13:1 for surface soil, i.e., 0–10 cm [26]. A general C:N:P mass ratio is 134:9:1 for 0–10 cm organic-rich soil and 60:5:1 for the entire soil depth (0–250 cm) in China [22]. In this study, the mean C:N:P mass ratio was 59.7:5.4:1 for the 0–30 cm depth, and the highest C:N:P (69.2:5.7:1) was found at the 0–10 cm depth. These ratios were far below the average C:N:P for China and globally. For the 0–10 cm depth soils, the C:N, C:P, and N:P ratios were 12.3, 69.3, and 5.7, respectively—lower than the average Chinese values reported in Tian et al. [22], which were 14.4, 136, and 9.3, respectively. These differences might be due to soil samples containing humified litter in the Cleveland and Liptzin [26] and Tian et al. [22] studies, resulting in relatively higher C:N, C:P, and N:P ratios than in our results.
The C:N ratios in our study were approximately 10 across three restoration stage (Figure 4A), and had relatively little change. This result is in line with a previous report stating that C:N ratios show little variation among different developmental stages and soil depths in China’s soil [22]. The relatively constant C:N ratios may be attributed to the close C and N coupling in the litter during forest development [1]. However, high variations were found in N:P and C:P ratios with soil depth and restoration stages, which is in line with the results reported by Tian et al. [22] on a national scale in China, and by Cleveland and Liptzin on a global scale [26].
A low C:N ratio (<25) implies that soil organic matter is accumulating more slowly than it is decomposing [21] and that there is net mineralization of N in the soil [52]. A C:N ratio lower than 10 indicates that less organic matter is being merged into the soil [53,54]. Similar to Li et al. [39], we found that P changed only slightly between forest succession types and soil depth. The late restoration stage and middle restoration stage had higher SOC and N concentrations than the early restoration stage, resulting in higher C:P and N:P ratios, which is in agreement with the global soil nutrient ratios reported by Cleveland and Liptzin [26]. In addition, the topsoil layer (0–10 cm) had greater soil C:N, C:P, and N:P ratios than those of the subsoil or deeper soil because the litter layer releases more nutrients into the topsoil [39]. In this study, the soil C:P ratios ranged from 42.9 to 80.0 for the 0–30 cm soil depth, which implied a net mineralization of soil nutrients (<200) [55]. The significant increase in N:P ratios in the late restoration stage (evergreen broadleaved forest) support the idea that the strongest P limitation tends to occur at the late stage of forest restoration [16]. Huang et al. [17] also reported that plant N:P ratios were greater in the late restoration stage (evergreen broad-leaved forest) compared to the early restoration stage (conifer forest) in subtropical China. Our results showed that there were significant increases in the N:P ratio in subtropical forest soils during forest restoration, and our previous results showed that the N:P ratio becomes significantly higher in both fresh leaves and litterfall with forest restoration [14], which again indicates that the P limitation occurs at late restoration stages of subtropical forests.
Our study supports the hypothesis that C:N:P Redfield-like ratios are common in forest soil [26]. The SOC, N, and P concentrations were significantly correlated (Figure 5), regardless of the restoration stage, and the relatively high correlation coefficients of 0.78–0.89 for C and N concentrations indicated that the C:N ratio was highly constrained. Relatively constrained C:P and N:P ratios were also observed based on the correlation coefficients of 0.33–0.70 for the C and P concentrations, and 0.35–0.76 for the N and P concentrations. Together, this implies a relatively constrained C:N:P ratio in subtropical forest soil, which is similar to that reported in Cleveland and Liptzin [26] and Tian et al. [22]. Previous studies showed that restoration stages significantly influence soil stoichiometry [2,56]. In the current study, there were significant positive linear relationships among the concentrations of SOC-N, SOC-P, and N-P, but the slopes and intercepts of regressions differed significantly across the three restoration stages (p < 0.05) (Figure 5), indicating that forest restoration significantly affected the coupled relationships between C-N, C-P, and N-P in the subtropical forest soil (Table 2). This finding is in line with previous results [22,23].

5. Conclusions

Our study showed that forest restoration significantly increased the SOC and N concentrations and stock, but those of P decreased. A constrained C:N:P ratio was found, and the C:P and N:P ratios increased to a greater extent than the C:N ratio during forest restoration in subtropical forest soil, indicating that forests in subtropical China could be experiencing a limitation in P. SOC and soil nutrients play key roles in carbon cycling and soil fertility, hence, our results provide new insights into C budgets and soil quality in subtropical forest soils and can be used to support decisions in sustainable forest management.

Author Contributions

All the authors contributed to this manuscript. S.O. and W.X. conceived and designed the experiments; C.X., M.G., and L.C. performed the experiments; C.X., P.L., and X.F. analysed the data; X.D. contributed technical advice; and C.X., S.O., and W.X. wrote the paper.

Acknowledgments

This work was funded by the National Key Research and Development Program of China (2016YFD0600202), the National Natural Science Foundation of China (31700636 and 31570447), and the China Postdoctoral Science Foundation (2017M612605).

Conflicts of Interest

The authors declare no conflict of interest.

References

  1. Yang, Y.H.; Luo, Y.Q. Carbon: Nitrogen stoichiometry in forest ecosystems during stand development. Glob. Ecol. Biogeogr. 2011, 20, 354–361. [Google Scholar] [CrossRef]
  2. Hume, A.; Chen, H.Y.; Taylor, A.R.; Kayahara, G.J.; Man, R. Soil C:N:P dynamics during secondary succession following fire in the boreal forest of central Canada. For. Ecol. Manag. 2016, 369, 1–9. [Google Scholar] [CrossRef]
  3. Andrews, S.; Karlen, D.L.; Cambardella, C.A. The soil management assessment framework: A quantitative soil quality evaluation method. Soil Sci. Soc. Am. J. 2004, 68, 1945–1196. [Google Scholar] [CrossRef]
  4. Zechmeister-Boltenstern, S.; Keiblinger, K.M.; Mooshammer, M.; Penuelas, J.; Richter, A.; Sardans, J.; Wanek, W. The application of ecological stoichiometry to plant-microbial-soil organic matter transformations. Ecol. Monogr. 2015, 85, 133–155. [Google Scholar] [CrossRef]
  5. Wang, S.; Wang, Q.; Adhikari, K.; Jia, S.; Jin, X.; Liu, H. Spatial-temporal changes of soil organic carbon content in Wafangdian, China. Sustainability 2016, 8, 1154. [Google Scholar] [CrossRef]
  6. Li, Y.; Chen, Y.; Wang, X.; Niu, Y.; Lian, J. Improvements in soil carbon and nitrogen capacities after shrub planting to stabilize sand dunes in China’s horqin sandy land. Sustainability 2017, 9, 662. [Google Scholar] [CrossRef]
  7. Chang, R.Y.; Fu, B.J.; Liu, G.H.; Liu, S.G. Soil carbon sequestration potential for “Grain for Green” project in Loess Plateau, China. Environ. Manag. 2011, 48, 1158–1172. [Google Scholar] [CrossRef] [PubMed]
  8. Deng, L.; Wang, K.B.; Chen, M.L.; Shangguan, Z.P.; Sweeney, S. Soil organic carbon storage capacity positively related to forest succession on the Loess Plateau, China. Catena 2013, 110, 1–7. [Google Scholar] [CrossRef]
  9. Wang, B.; Liu, G.B.; Xue, S.; Zhu, B.B. Changes in soil physic-chemical and microbiological properties during natural succession on abandoned farmland in the Loess Plateau. Environ. Earth Sci. 2011, 62, 91–925. [Google Scholar] [CrossRef]
  10. Chen, C.R.; Condron, L.M.; Davis, M.R.; Sherlock, R.R. Effects of afforestation on phosphorus dynamics and biological properties in a New Zealand grassland soil. Plant Soil 2000, 220, 151–163. [Google Scholar] [CrossRef]
  11. Wen, Z.M.; Jiao, F.; Liu, B.Y.; Bu, Y.J.; Jiao, J.Y. Natural vegetation succession and soil nutrient dynamics of abandoned farmlands in forest-steppe zone on Loess Plateau, China. J. Appl. Ecol. 2005, 16, 2025–2029. [Google Scholar]
  12. Vitousek, P.M.; Porder, S.; Houlton, B.Z.; Chadwick, O.A. Terrestrial phosphorus limitation: Mechanisms, implications, and nitrogen-phosphorus interactions. Ecol. Appl. 2010, 20, 5–15. [Google Scholar] [CrossRef] [PubMed]
  13. Zhang, C.; Tian, H.; Liu, J.; Wang, S.; Liu, M.; Pan, S.; Shi, X. Pools and distributions of soil phosphorus in China. Glob. Biogeochem. Cycles 2005, 19, GB1020. [Google Scholar] [CrossRef]
  14. Zeng, Y.L.; Fang, X.; Xiang, W.H.; Deng, X.W.; Peng, C.H. Stoichiometric and nutrient resorption characteristics of dominant tree species in subtropical Chinese forests. Ecol. Evol. 2017, 7, 11033–11043. [Google Scholar] [CrossRef] [PubMed] [Green Version]
  15. Vitousek, P.M.; Farrington, H. Nutrient limitation and soil development: Experimental test of a biogeochemical theory. Biogeochemistry 1997, 37, 63–75. [Google Scholar] [CrossRef]
  16. Wardle, D.A.; Walker, L.R.; Bardgett, R.D. Ecosystem properties and forest decline in contrasting long–term chronosequences. Science 2004, 305, 509–513. [Google Scholar] [CrossRef] [PubMed]
  17. Huang, W.; Liu, J.; Wang, Y.; Zhou, G.; Han, T.; Li, Y. Increasing phosphorus limitation along three successional forests in southern China. Plant Soil 2013, 364, 181–191. [Google Scholar] [CrossRef]
  18. Aponte, C.; Marañón, T.; García, L. Microbial, C, N and P in soils of Mediterranean oak forests: Influence of season, canopy cover and soil depth. Biogeochemistry 2010, 101, 77–92. [Google Scholar] [CrossRef] [Green Version]
  19. Li, Y.; Wu, J.; Liu, S.; Shen, J.; Huang, D.; Su, Y.; Syers, J.K. Is the C:N:P stoichiometry in soil and soil microbial biomass related to the landscape and land use in southern subtropical China? Glob. Biogeochem. Cycles 2012, 26. [Google Scholar] [CrossRef] [Green Version]
  20. Gao, Y.; He, N.P.; Yu, G.R.; Chen, W.L.; Wang, Q.F. Long-term effects of different land use types on C, N, and P stoichiometry and storage in subtropical ecosystems: A case study in China. Ecol. Eng. 2014, 67, 171–181. [Google Scholar] [CrossRef]
  21. Zhao, F.; Sun, J.; Ren, C.; Kang, D.; Deng, J.; Han, X.; Ren, G. Land use change influences soil C, N, and P stoichiometry under ‘Grain-to-Green Program’ in China. Sci. Rep. 2015, 5, 10195. [Google Scholar]
  22. Tian, H.; Chen, G.; Zhang, C.; Melillo, J.M.; Hall, C.A.S. Land use change influences soil C, N, and P stoichiometry under ‘Grain-to-Green Program’ in China. Biogeochemistry 2010, 98, 139–151. [Google Scholar] [CrossRef]
  23. Liu, W.; Su, J.; Li, S.; Zhang, Z.; Li, Z. Stoichiometry study of C, N and P in plant and soil at different successional stages of monsoon evergreen broad-leaved forest in Pu’er, Yunnan Province. Acta Ecol. Sin. 2010, 30, 6581–6590. (In Chinese) [Google Scholar]
  24. Jiao, F.; Wen, Z.M.; An, S.S.; Yuan, Z. Successional changes in soil stoichiometry after land abandonment in Loess Plateau, China. Ecol. Eng. 2013, 58, 249–254. [Google Scholar] [CrossRef]
  25. Yu, Z.; Wang, M.; Huang, Z.; Lin, T.C.; Vadeboncoeur, M.A.; Searle, E.B.; Chen, H.Y. Temporal changes in soil C-N-P stoichiometry over the past 60 years across subtropical China. Glob. Chang. Biol. 2017, 13939, 1–13. [Google Scholar] [CrossRef] [PubMed]
  26. Cleveland, C.C.; Liptzin, D. C:N:P stoichiometry in soil: Is there a “Redfield ratio” for the microbial biomass? Biogeochemistry 2007, 85, 235–252. [Google Scholar] [CrossRef]
  27. Jia, X.X.; Wei, X.R.; Shao, M.A.; Li, X.Z. Distribution of soil carbon and nitrogen along a revegetational succession on the Loess Plateau of China. Catena 2012, 95, 160–168. [Google Scholar] [CrossRef]
  28. Deng, L.; Wang, K.B.; Shangguan, Z.P. Long-term natural succession improves nitrogen storage capacity of soil on the Loess Plateau, China. Soil Res. 2014, 52, 262–270. [Google Scholar] [CrossRef]
  29. Liu, S.J.; Zhang, W.; Wang, K.L.; Pan, F.J.; Yang, S.; Shu, S.Y. Factors controlling accumulation of soil organic carbon along vegetation succession in a typical karst region in Southwest China. Sci. Total. Environ. 2015, 521, 52–58. [Google Scholar] [CrossRef] [PubMed]
  30. Yan, E.R.; Wang, X.H.; Guo, M.; Zhong, Q.; Zhou, W. C:N:P stoichiometry across evergreen broad-leaved forests, evergreen coniferous forests and deciduous broad-leaved forests in the Tiantong region, Zhejiang Province, eastern China. J. Plant Ecol. 2010, 34, 48–57. (In Chinese) [Google Scholar]
  31. Jiang, F.; Wu, X.; Xiang, W.H.; Fang, X.; Zeng, Y.L.; Ouyang, S.; Lei, P.F.; Deng, X.W.; Peng, C.H. Spatial variations in soil organic carbon, nitrogen and phosphorus concentrations related to stand characteristics in subtropical areas. Plant Soil 2017, 413, 289–301. [Google Scholar] [CrossRef]
  32. Ouyang, S.; Xiang, W.H.; Wang, X.P.; Zeng, Y.L.; Lei, P.F.; Deng, X.W.; Peng, C.H. Significant effects of biodiversity on forest biomass during the succession of subtropical forest in south China. For. Ecol. Manag. 2016, 372, 291–302. [Google Scholar] [CrossRef]
  33. Zhu, W.J.; Xiang, W.H.; Pan, Q.; Zeng, Y.L.; Ouyang, S.; Lei, P.F.; Deng, X.W.; Fang, X.; Peng, C.H. Spatial and seasonal variations of leaf area index (LAI) in subtropical secondary forests related to floristic composition and stand characters. Biogeosciences 2016, 13, 3819–3831. [Google Scholar] [CrossRef]
  34. IUSS Working Group. World Reference Base for Soil Resources 2006. In World Soil Resources Reports; No. 103; FAO: Rome, Italy, 2006; ISBN 92951055114. [Google Scholar]
  35. Jia, G.M.; Cao, J.; Wang, C.Y.; Wang, G. Microbial biomass and nutrients in soil at the different stages of secondary forest succession in Ziwulin, Northwest China. For. Ecol. Manag. 2005, 217, 117–125. [Google Scholar] [CrossRef]
  36. Nelson, D.W.; Sommers, L.E. Total Carbon, Organic Carbon, and Organic Matter. In Methods of Soil Analysis. Part 3. Chemical Methods; Sparks, D.L., Ed.; Association of Canadian Search, Employment & Staffing Services: Madison, WI, USA, 1996. [Google Scholar]
  37. Jackson, M.L. Soil Chemical Analysis; Prentice-Hall Inc.: Englewood Cliffs, NJ, USA, 1958. [Google Scholar]
  38. Institute of Soil Science, Chinese Academy of Sciences. Analytical Methods of Soil Physics and Chemistry; Shanghai Scientific and Technical Publishers: Shanghai, China, 1978. [Google Scholar]
  39. Li, C.; Zhao, L.; Sun, P.; Zhao, F.; Kang, D.; Yang, G.; Han, X.; Feng, Y.; Ren, G. Deep Soil C, N, and P storage and stoichiometry in response to land use patterns in the Loess Hilly Region of China. PLoS ONE 2016, 11, e015907. [Google Scholar]
  40. Warton, D.I.; Duursma, R.A.; Falster, D.S.; Taskinen, S. SMART 3-an R package for estimation and inference about allometric lines. Methods Ecol. Evol. 2012, 3, 257–259. [Google Scholar] [CrossRef]
  41. R Development Core Team. R: A Language and Environment for Statistical Computing; R Foundation for Statistical Computing: Vienna, Austria, 2016. [Google Scholar]
  42. Davis, M.; Nordmeyer, A.; Henley, D.; Watt, M. Ecosystem carbon accretion 10 years after afforestation of depleted subhumid grassland planted with three densities of Pinus nigra. Glob. Chang. Biol. 2007, 13, 1414–1422. [Google Scholar] [CrossRef]
  43. Hooper, D.U.; Vitousek, P.M. The effects of plant composition and diversity on ecosystem processes. Science 1997, 277, 1302–1305. [Google Scholar] [CrossRef]
  44. Wardle, D.A.; Bonner, K.I.; Nicholson, K.S. Biodiversity and plant litter: Exper imental evidxence which does not support the view that enhanced species richness improves ecosystem function. Oikos 1997, 79, 247–258. [Google Scholar] [CrossRef]
  45. Van der Heijden, M.G.; Klironomos, J.N.; Ursic, M.; Moutoglis, P.; Streitwolf-Engel, R.; Boller, T.; Sanders, I.R. Mycorrhizal fungal diversity determines plant biodiversity, ecosystem variability and productivity. Nature 1998, 396, 69. [Google Scholar] [CrossRef]
  46. Yang, L.Y.; Wu, S.T.; Zhang, L.B. Fine root biomass dynamics and carbon storage along a successional gradient in Changbai Mountains, China. Forestry 2010, 83, 379–387. [Google Scholar] [CrossRef] [Green Version]
  47. Guo, J.; Yu, L.H.; Fang, X.; Xiang, W.H.; Deng, X.W.; Lu, X. Litter production and turnover in four types of subtropical forests in China. Acta Ecol. Sin. 2015, 35, 4668–4677. (In Chinese) [Google Scholar]
  48. Liu, C.; Xiang, W.H.; Lei, P.F.; Deng, X.W.; Tian, D.L.; Fang, X.; Peng, C.H. Standing fine root mass and production in four Chinese subtropical forests along a succession and species diversity gradient. Plant Soil 2014, 376, 445–459. [Google Scholar] [CrossRef]
  49. Wu, J.G. The mineralization of soil organic carbon under different land uses in the Liupan mountain forest zone. J. Plant Ecol. 2004, 28, 530–538. (In Chinese) [Google Scholar]
  50. Justine, M.F.; Yang, W.; Wu, F.; Tan, B.; Naeem Khan, M.; Li, Z. Dissolved organic matter in soils varies across a chronosequence of Pinus massoniana plantations. Ecosphere 2017, 8, 1–11. [Google Scholar] [CrossRef]
  51. Hooper, D.U.; Bignell, D.E.; Brown, V.K. Interactions between aboveground and belowground biodiversity in terrestrial ecosystems: Patterns, mechanisms and feedbacks. BioScience 2000, 50, 1049–1061. [Google Scholar] [CrossRef]
  52. Wei, X.; Shao, M.; Fu, X.; Horton, R.; Li, Y.; Zhang, X. Distribution of soil organic C, N and P in three adjacent land use patterns in the northern Loess Plateau, China. Biogeochemistry 2009, 96, 149–162. [Google Scholar] [CrossRef]
  53. Saikh, H.; Varadachari, C.; Ghosh, K. Changes in carbon, nitrogen and phosphorus levels due to deforestation and cultivation: A case study in Simlipal National Park, India. Plant Soil 1998, 198, 137–145. [Google Scholar] [CrossRef]
  54. Yimer, F.; Ledin, S.; Abdelkadir, A. Changes in soil organic carbon and total nitrogen contents in three adjacent land use types in the Bale Mountains, south-eastern highlands of Ethiopia. For. Ecol. Manag. 2007, 242, 337–342. [Google Scholar] [CrossRef]
  55. Paul, E.A. Soil Microbiology, Ecology, and Biochemistry, 3rd ed.; Academic Press: Amsterdam, The Netherlands, 2007. [Google Scholar]
  56. Fan, H.; Wu, J.; Liu, W.; Yuan, Y.; Hu, L.; Cai, Q. Linkages of plant and soil C: N: P stoichiometry and their relationships to forest growth in subtropical plantations. Plant Soil 2015, 392, 127–138. [Google Scholar] [CrossRef]
Figure 1. Location of the Dashanchong Forest Park in Changsha, Hunan, Southern China.
Sustainability 10 01874 g001
Figure 2. Soil organic carbon (SOC) (A); nitrogen (N) (B); and phosphorus (P) (C) concentrations at three restoration stages. The bars indicate the standard error of the mean. Different capital letters indicate statistically significant differences (p < 0.05) at the same soil depth across the three restoration stages. Different lowercase letters indicate statistically significant differences (p < 0.05) at the same restoration stage among the three soil depths.
Sustainability 10 01874 g002aSustainability 10 01874 g002b
Figure 3. Soil organic carbon (SOC) (A); N (B); and P (C) stocks at the three restoration stages. The bars indicate the standard error of the mean. Different capital letters indicate statistically significant differences (p < 0.05) at the same soil depth across the three restoration stages (p < 0. 05). Different lowercase letters indicate statistically significant differences (p < 0.05) at the same restoration stage among the three soil depths.
Sustainability 10 01874 g003aSustainability 10 01874 g003b
Figure 4. Mass ratios of carbon (C):N (A); C:P (B); and N:P (C) at the three restoration stages. The bars indicate the standard error of the mean. Different capital letters indicate statistically significant differences (p < 0.05) at the same soil depth across the three restoration stages. Different lowercase letters indicate statistically significant differences (p < 0.05) at the same restoration stage among the three soil depths.
Sustainability 10 01874 g004
Figure 5. Relationships between soil organic carbon (SOC), N, and P concentrations at a depth of 0–30 cm across the three restoration stages.
Sustainability 10 01874 g005
Table 1. Site and community characteristics of the three forest types at early, middle, and late stages of restoration.
Forest TypeAltitude (m)AspectSlope (o)Stand Density (Tree ha−1)Total BA (m−2 ha−1)Dominant Species
Early (PM-LG)220–262SW15249233.66Pinus massoniana
Lithocarpus glaber
Diospyros glaucifolia
Middle (CA)245–321W35169618.79Choerospondiasaxillaris
Loropetalum chinensis
Symplocos setchuensis
Late (LG-CG)225–254NW22134023.10Lithocarpus glaber
Cyclobalanopsis glauca
Sassafras tzumu
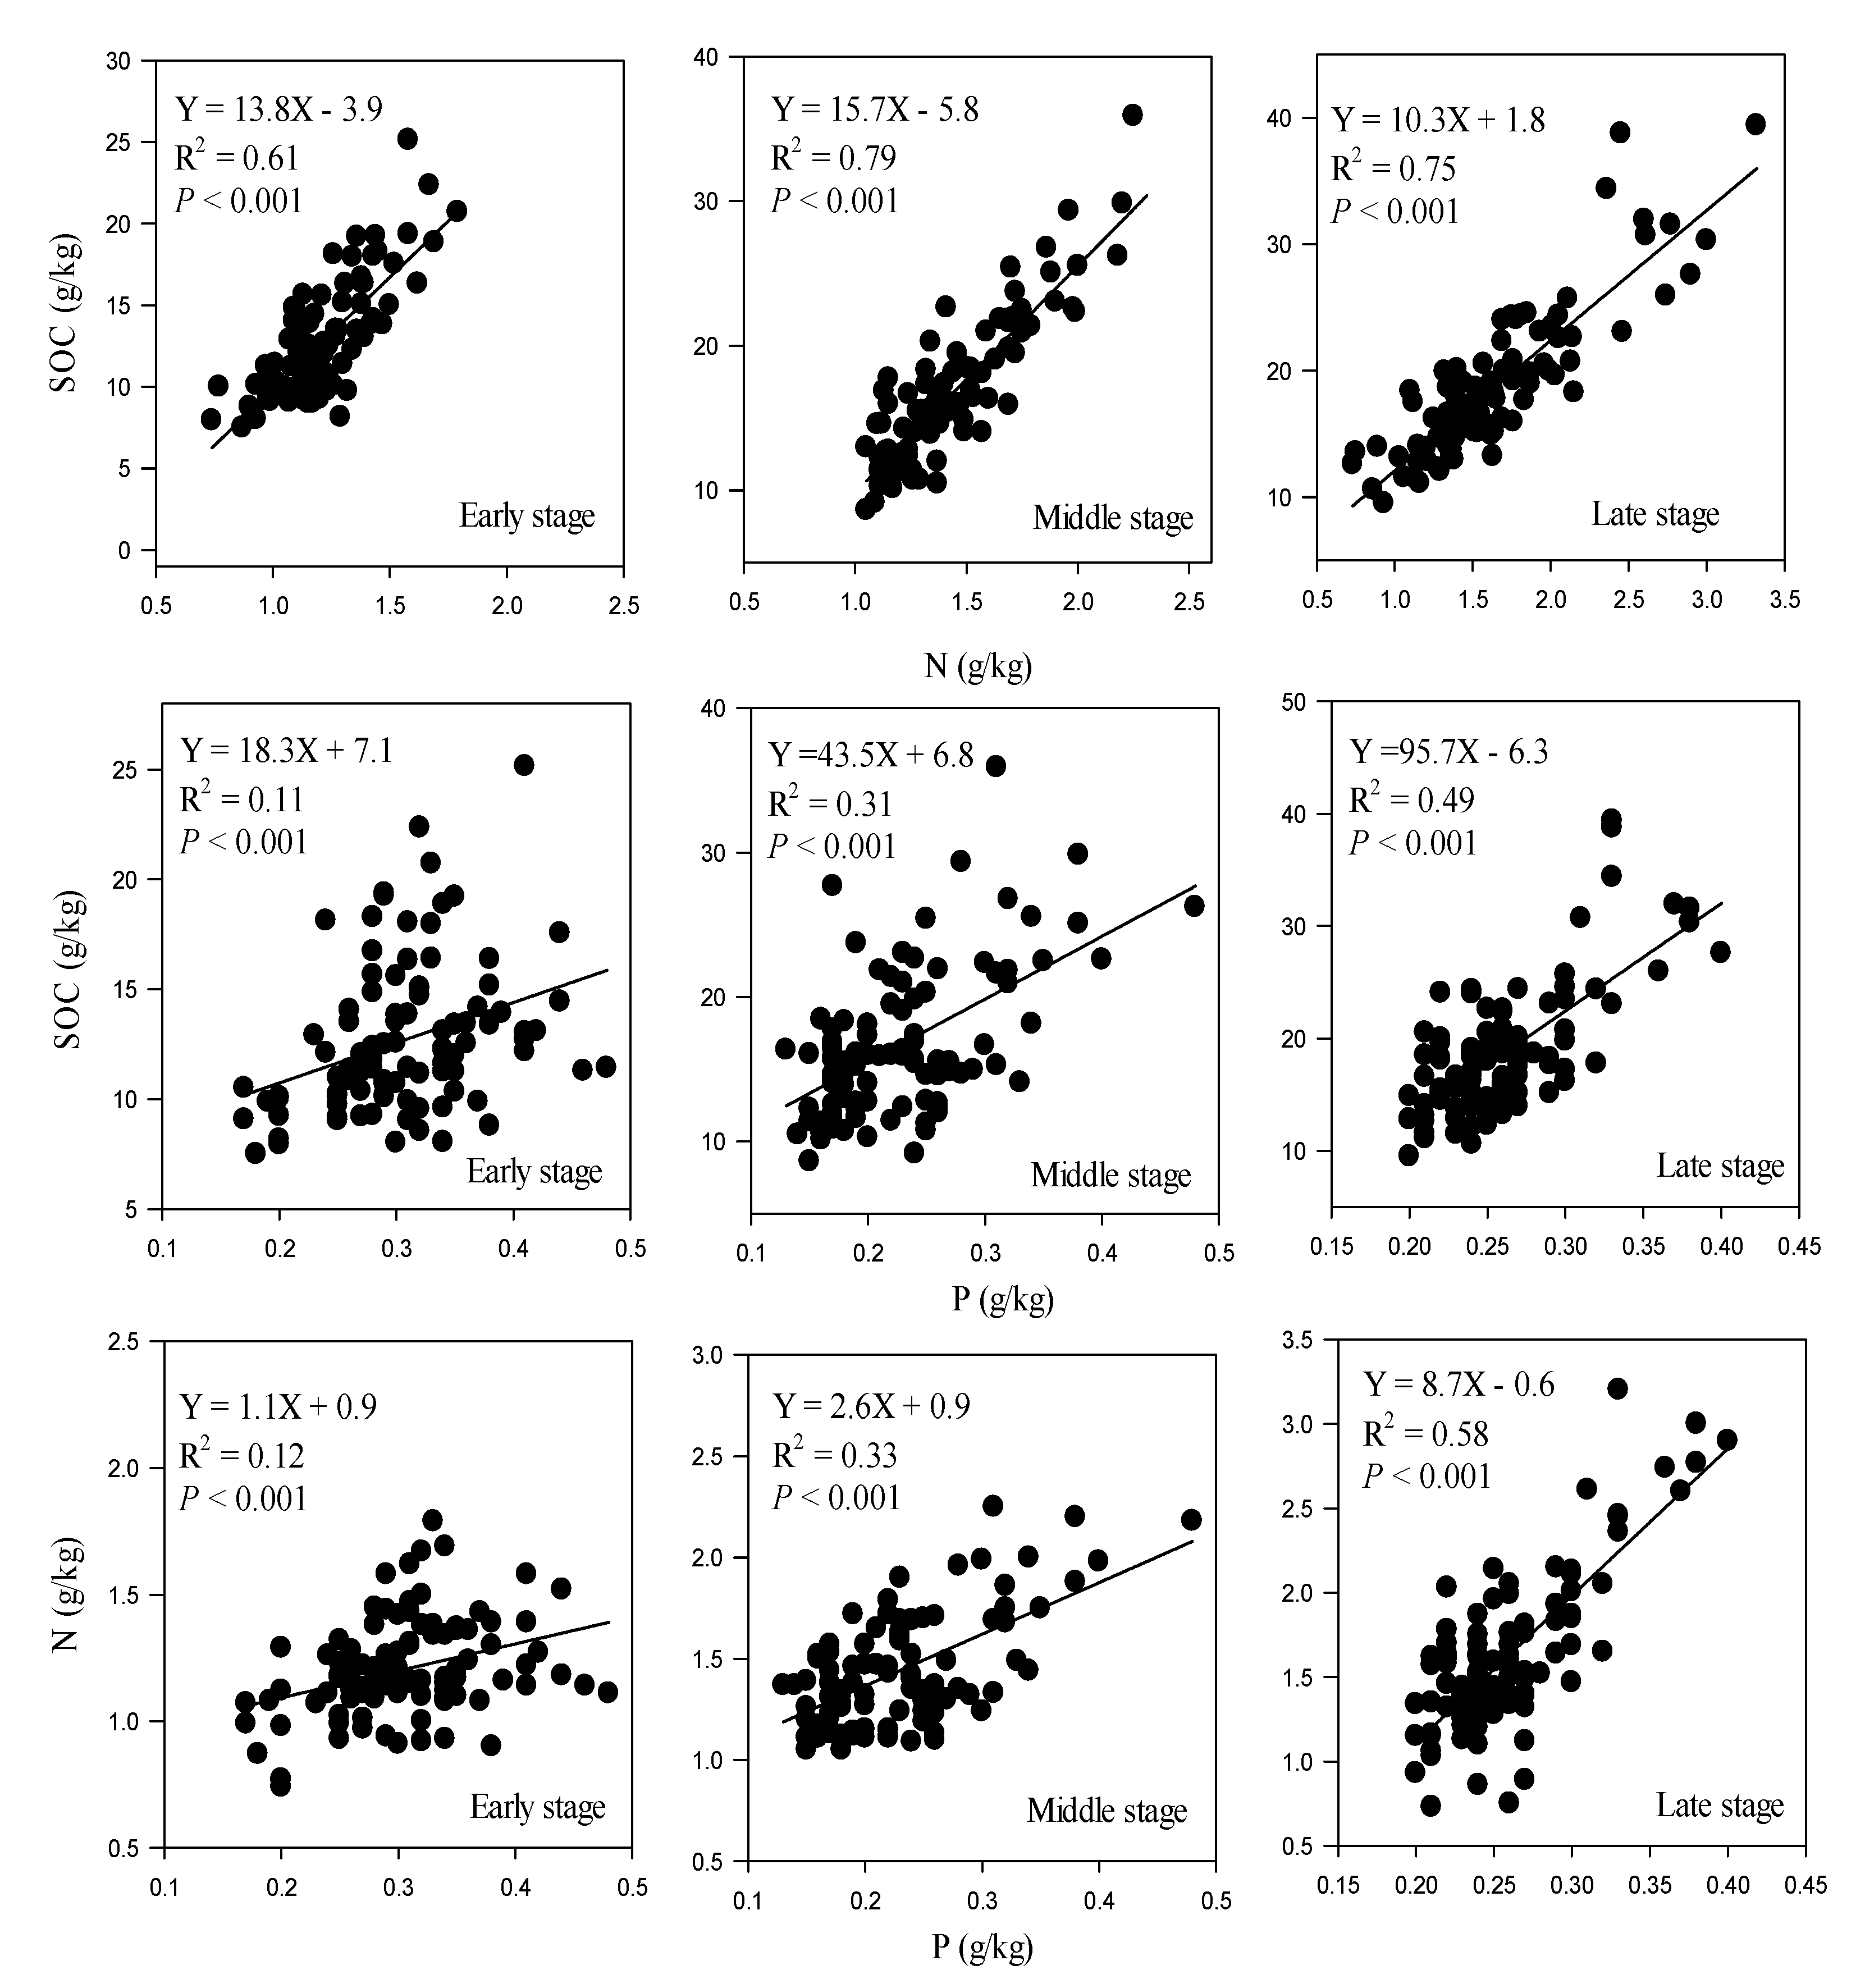
Note: PM-LG, Pinus massoniana-Lithocarpus glaber forest; CA, Choerospondias axillaris forest; LG-CG, Lithocarpus glaber-Cyclobalanopsis glauca forest. BA is the basal area; SW, W, and NW are the southwest, west, and northwest aspects of each forest.
Table 2. Test for differences in slopes and intercepts of the regression lines of soil stoichiometry (C:N:P ratio) relationships among the three restoration stages.
Soil StoichiometryRestoration StagenSlope [95% CI]pIntercept [95% CI]p
C:NEarly10013.8 b [11.5, 16.0]<0.01−3.9 a,b [−6.6, −1.2]0.03
Middle10015.7 a [14.3, 17.7] −5.8 b [−8.7, −3.8]
Late10010.3 c [9.1, 11.5] 1.8 a [−0.2, 3.8]
C:PEarly10018.3 c [8.1, 28.4]<0.017.1 a [3.9, 10.2]<0.01
Middle10043.5 b [30.3, 56.6] 6.8 b [3.7, 9.9]
Late10095.7 a [76.4, 114.9] −6.3 c [−11.3, −1.2]
N:PEarly1001.1 c [0.48, 1.6]<0.010.9 a [0.7, 1.1]<0.01
Middle1002.6 b [2.0, 3.34] 0.9 a [0.6, 1.0]
Late1008.7 a [7.3, 10.2] −0.6 b [−1.0, −0.2]
Note: n stands for the number of the subplot at each restoration stage. p stands for statistical significance level of 0.05. Different lowercase letters indicate statistically significant differences (p < 0.05) between the three forests at the three restoration stages. CI, C:N, C:P, and N:P denote the confidence interval, C:N mass ratio, C:P mass ratio, and N:P mass ratio, respectively.

