1. Introduction
Drying and destruction of Urmia Lake (UL) is one of the most important environmental issues in Iran, which has been considered by national, regional and international communities. UL and its catchments are of the important ecosystems of Iran, and have international and global importance. This lake and its small and large wetlands, having a variety of species of wildlife and plant species, serve as a natural balance in the climate of the region and its recreational value, tourism, social and medical value (mud therapy) has made it as a wetland of international importance registered in the Ramsar Convention on Wetlands and a UNESCO Biosphere Reserve [
1]. Approximately 550 plant species have been identified in the ecological zone of this lake. UL and its satellite wetlands have been the habitat for massive communities of green algae, which is one of the main pillars of the food chain. 27 mammal species, 212 bird species, 41 reptile species, 7 amphibian species and 26 fish species were recorded in the ecological zone of the lake. More than seven million people are living in two neighboring provinces around the lake, and agriculture, horticulture, animal husbandry, handicraft making, apiculture, mining, business, and industry play a major role in the region [
2].
The catchment area of UL has fertile agricultural lands, and the existence of UL has been one of the reasons for its favorable weather and for the prosperity of agriculture. The climate of the basin is characterized with cold winters and relatively temperate summers. The average precipitation of the basin is estimated at about 350 mm, the majority of which occurs during fall through mid-spring seasons. Precipitation in summer months is comparatively very little. The mean annual temperature varies between 6.5 °C in higher altitudes to 13.5 °C in lower altitudes. July and August are the warmest and December and January are the coldest months of the year [
3]. UL provided suitable weather for tourism activities, and its beach attracted many visitors throughout the seasons, especially in spring and summer.
The altitude of the lake water is 1276 m on average and the range of water level fluctuation in dry and wet years has been about 3 m (from 1275 to 1278). The water in the lake is hyper saline (>200 dS/m) and is varying according to the time and location. Freshwater flows from rivers and particularly flood flows enhance the Lake’s water quality greatly [
4]. The area of UL has been about 5000 square kilometers (4000 to 6000 square kilometers) and its depth has been around 6 to 16 m, with an average depth of 10 m [
5].
Historically, the volume of water in the lake was estimated to be 19,000 million m
3, with an area of about 5700 km
2. Hypersaline UL is the most important water body in northwestern Iran and plays a significant role in the environment and economy of the region. During recent years, the lake has experienced a substantial reduction in water level (~6 m from June 1995 to May 2009) and it has resulted in the shrinking of the lake’s surface area dramatically, so that large areas of the lake bed have dried out, and salinity has increased to over 300 g L
−1 [
6]. The current state of the lake makes it imperative and the main processes responsible for fluctuating water levels is better understood so that local agencies can adopt suitable management plans to avoid further environmental degradation. Examining the fluctuations in the surface of UL depicts that the lake’s water surface has decreased dramatically in the last two decades and an extensive area is witnessing progressive erosion. According to Moghaddasi et al. (2017) [
7], the UL Basin is an excellent example of increasing the severity of drought worldwide. Moreover, due to recent environmental efforts to restore wetlands, the lake has been shrinking for the last two decades and the growth of agricultural water demand has led to frequent drought. In addition, the water level of the lake in the last 15 years has always been lower than the minimum ecological level. The water level of lake has dropped lower than its ecological level of 1274.1 m [
8] with concomitant deterioration of the environmental balance in the region (the lake is supposed to be the most convenient place for many rare aquatic species and is the main habitat for the endemic Iranian brine shrimp Artemia urmiana and is a protected aquatic environment [
9,
10]). Therefore, it is not clear how long the UL and its ecological functions will exist. The rapid reduction of water levels of lake will have serious effects on the population of various species of animals. In addition, it endangers the region’s agriculture and leads to a salt storm [
11]. The water of UL began to decrease gradually since 1997 and it reached its lowest level in 2014 and 2015; this decrease in water level resulted in increased salt concentration and loss of life in the lake. Now, the salt concentration in the lake has risen to 340 g/L and the lake water has become oversaturated [
11].
Hamzehpour et al. (2014) [
12] analyzed five spatial variations of top soil salinity using ground water SAR and sampling data on a grid of 500 m in an area of 5000 ha close to Urmia Lake during the autumn of 2009 and spring of 2010. Their results indicated inverse correlation between top soil salinity and distance from the lake. Sima and Tajrishy (2014) [
13] used spatial interpolation methods to analyze the spatial heterogeneity and temporal changes of the physiochemical parameters of UL between October 2009 and July 2010. Their results indicated seasonal changes of the water quality.
Moreover, the road (Shahid Kalantari Bridge) constructed in the lake with a distance of only 1500 m, divided it into two parts, north and south [
7], causing further destruction of UL.
Figure 1 indicates the changes in the average water level of UL in the last 50 years.
1.1. Background and Research Questions
To make it clear, the concepts of (Hazard) and (Risk) and their relationship with vulnerability are discussed here. Hazard and risk are often used alternately, while these two terms are very distinct in terms of risk assessment. Hazard is any chemical, mechanical, physical or biological agent that causes injury or damage to humans or the environment if the volume and exposure is sufficient [
14]. The risk is defined as “the probability that exposure to a hazard would lead to a negative result” [
15]. It is argued that risk or disaster is a combined function of natural hazards and a large number of people with different degrees of vulnerability to a particular risk including the space and time of exposure. Risk can be equated with a simple equation, although it is not quantitative. Mathematically, it can be written as Equation (1):
where,
R is Risk,
H is Hazard and
V is Vulnerability.
The concept of vulnerability has changed over the last few decades, and its meaning has evolved. In the 1970s and 1980s, “exposure” was used instead of vulnerability. In the 1980s and 1990s, it was important to consider the “dose” and the “volume” of risk. But since the late 20s, the social dimension of the vulnerability has been considered. In the social dimension of vulnerability, the combination of “sensitivity” and “exposure” means vulnerability. Sensitivity is the degree to which a system is affected by or responds to a weather stimulus. In other words, it can be said that sensitivity is the degree of dependence on resources and vulnerable services to the effects of climate changes [
16]. According to the definition of Intergovernmental Panel on Climate Change “IPCC”, vulnerability is a function of potential impacts and adaptive capacity. Potential impacts include the exposure of vulnerable groups and their sensitivity (dependence on vulnerable resources and understanding the resource conditions), which is in accordance with Equation (2).
where,
V is Vulnerability,
E is Exposure,
S is Sensitivity and
AC is Adaptive Capacity.
The above indicators have been used to assess vulnerability in different studies such as: Koh (2010) [
17] in assessing local vulnerability to climate change and its implications in Gyeonggi-Do of South Korea, Madu (2012) [
18] for spatial vulnerability assessments of rural households to climate change in Nigeria, Nazrul Islam et al. (2013) [
19] in quantifying vulnerability to climate change, adaptation strategies and layers of resilience in Bangladesh, Monterroso et al. (2014) [
20] to assess vulnerability to climate change in the Mexican agricultural sector, Murthy et al. (2015) [
21] in geospatial analysis of agricultural drought vulnerability, Inostroza et al. (2016) [
22] for building a heat vulnerability index in Santiago de Chile and Senapati and Gupta (2017) [
23] in expressing socio-economic vulnerability due to climate change: deriving indicators for fishing communities in Mumbai, India. The review of similar studies in Iran shows that the present study is the first study to measure and assess vulnerability with exposure, sensitivity and adaptive capacity indicators.
Always after the occurrence of hazards, some people are more successful in coping and they face fewer losses [
24]. Early preparation and proper response are of great importance in dealing with hazards and in this regard, recognizing the current situation including identification of hazards, assessing hazards and determining the degree of vulnerability are necessary to reduce the damages to communities. Otherwise, damage caused by a hazard will increase rapidly in the short term. Then, understanding the nature of the vulnerability has an important role in the reduction of the effects of hazards [
25]. Therefore, this research aimed to measure the vulnerability of rural households in Shabestar. In this way, the current research tries to answer the following questions:
To what extent the rural households in Shabestar region are exposed to the effects of drying of the UL?
How much sensitive are rural households in Shabestar towards the drying of UL?
How much is the adaptive capacity of households in Shabestar with the effects of UL drying?
1.2. Site Description
Experts noted that if the lake dries, the climate will turn into tropical weather with salt winds and this would change the environment of the area. The reduction of the area of UL and ultimately its destruction does not simply mean the destruction of wildlife habitats and the drying of UL will destroy the entire biological resources in its area. Villages, crops, gardens and cities will not be safe. UL plays a moderator role and if the lake disappears the temperature of the area will increase [
26].
Some of the consequences of the environmental crisis of the region due to the drying of UL are as follows [
27]:
- (A)
Climate change: drying of the lake leads to a hot and dry climate in which temperature fluctuations increase over nights and days or in winter and summer. The average annual temperature increases; the annual precipitation decreases, and hot winds with the dust replace the moderate and cool winds of the region.
- (B)
Salt Winds: The disappearance of UL leads to more than 8 billion tons of salt and salt winds have been abundantly observed in neighboring towns due to wind erosion. It is anticipated that with increasing lake dryness and increased salt volume, salt storms would be observed in some seasons due to intense winds in the area.
- (C)
Water pollution: In addition to the reduction of groundwater levels in the area, salt’s influence on groundwater, salinity and pollution of these waters are seen in the area. Some of these minerals cause pollution and lead to the poisoning of groundwater, which is seriously dangerous for all organisms including plants, animals and even human.
- (D)
Air pollution: Salt particles and dust can pollute the air and cause people to become infected with respiratory diseases such as asthma, bronchitis, heart and dermatological diseases.
- (E)
Soil contamination: Soil salinization and pollution is one of the natural effects of the reduction of groundwater levels in the area. Salinity of soil is one of the problems of the agricultural sector, which by increasing its rate plants will not be able to grow.
- (F)
The destruction of agriculture: With the water, soil, and plants pollution, there will be many problems in gardens and agricultural fields. Gradually, the production efficiency decreases and leads to losses in agriculture and its economic value. This leads to the abandonment of gardens and farms and makes the region useless in terms of agriculture and farming.
- (G)
Immigration and resilience of villagers: In addition to the disappearance of agriculture, other industries such as tourism, which has been one of the sources of livelihood of the villagers in the region, has been challenged due to the drying of the beautiful and unique UL. The reduction or loss of the livelihood resources of villagers will definitely lead to the forced migration of villagers to cities and their particular problems.
More than 1.5 million villagers live in more than 415,000 households in the catchment area of UL that are exposed to the environmental crisis of the drying of UL. This population is dependent on vulnerable resources such as water, air, soil and plants to live. They have a limited adaptive capacity to the crisis for some reasons like poverty, lack of awareness and lack of infrastructure. They are the most vulnerable section of the society and this problem threatens them more than the others. Therefore, the vulnerability of rural households in the region is of particular importance.
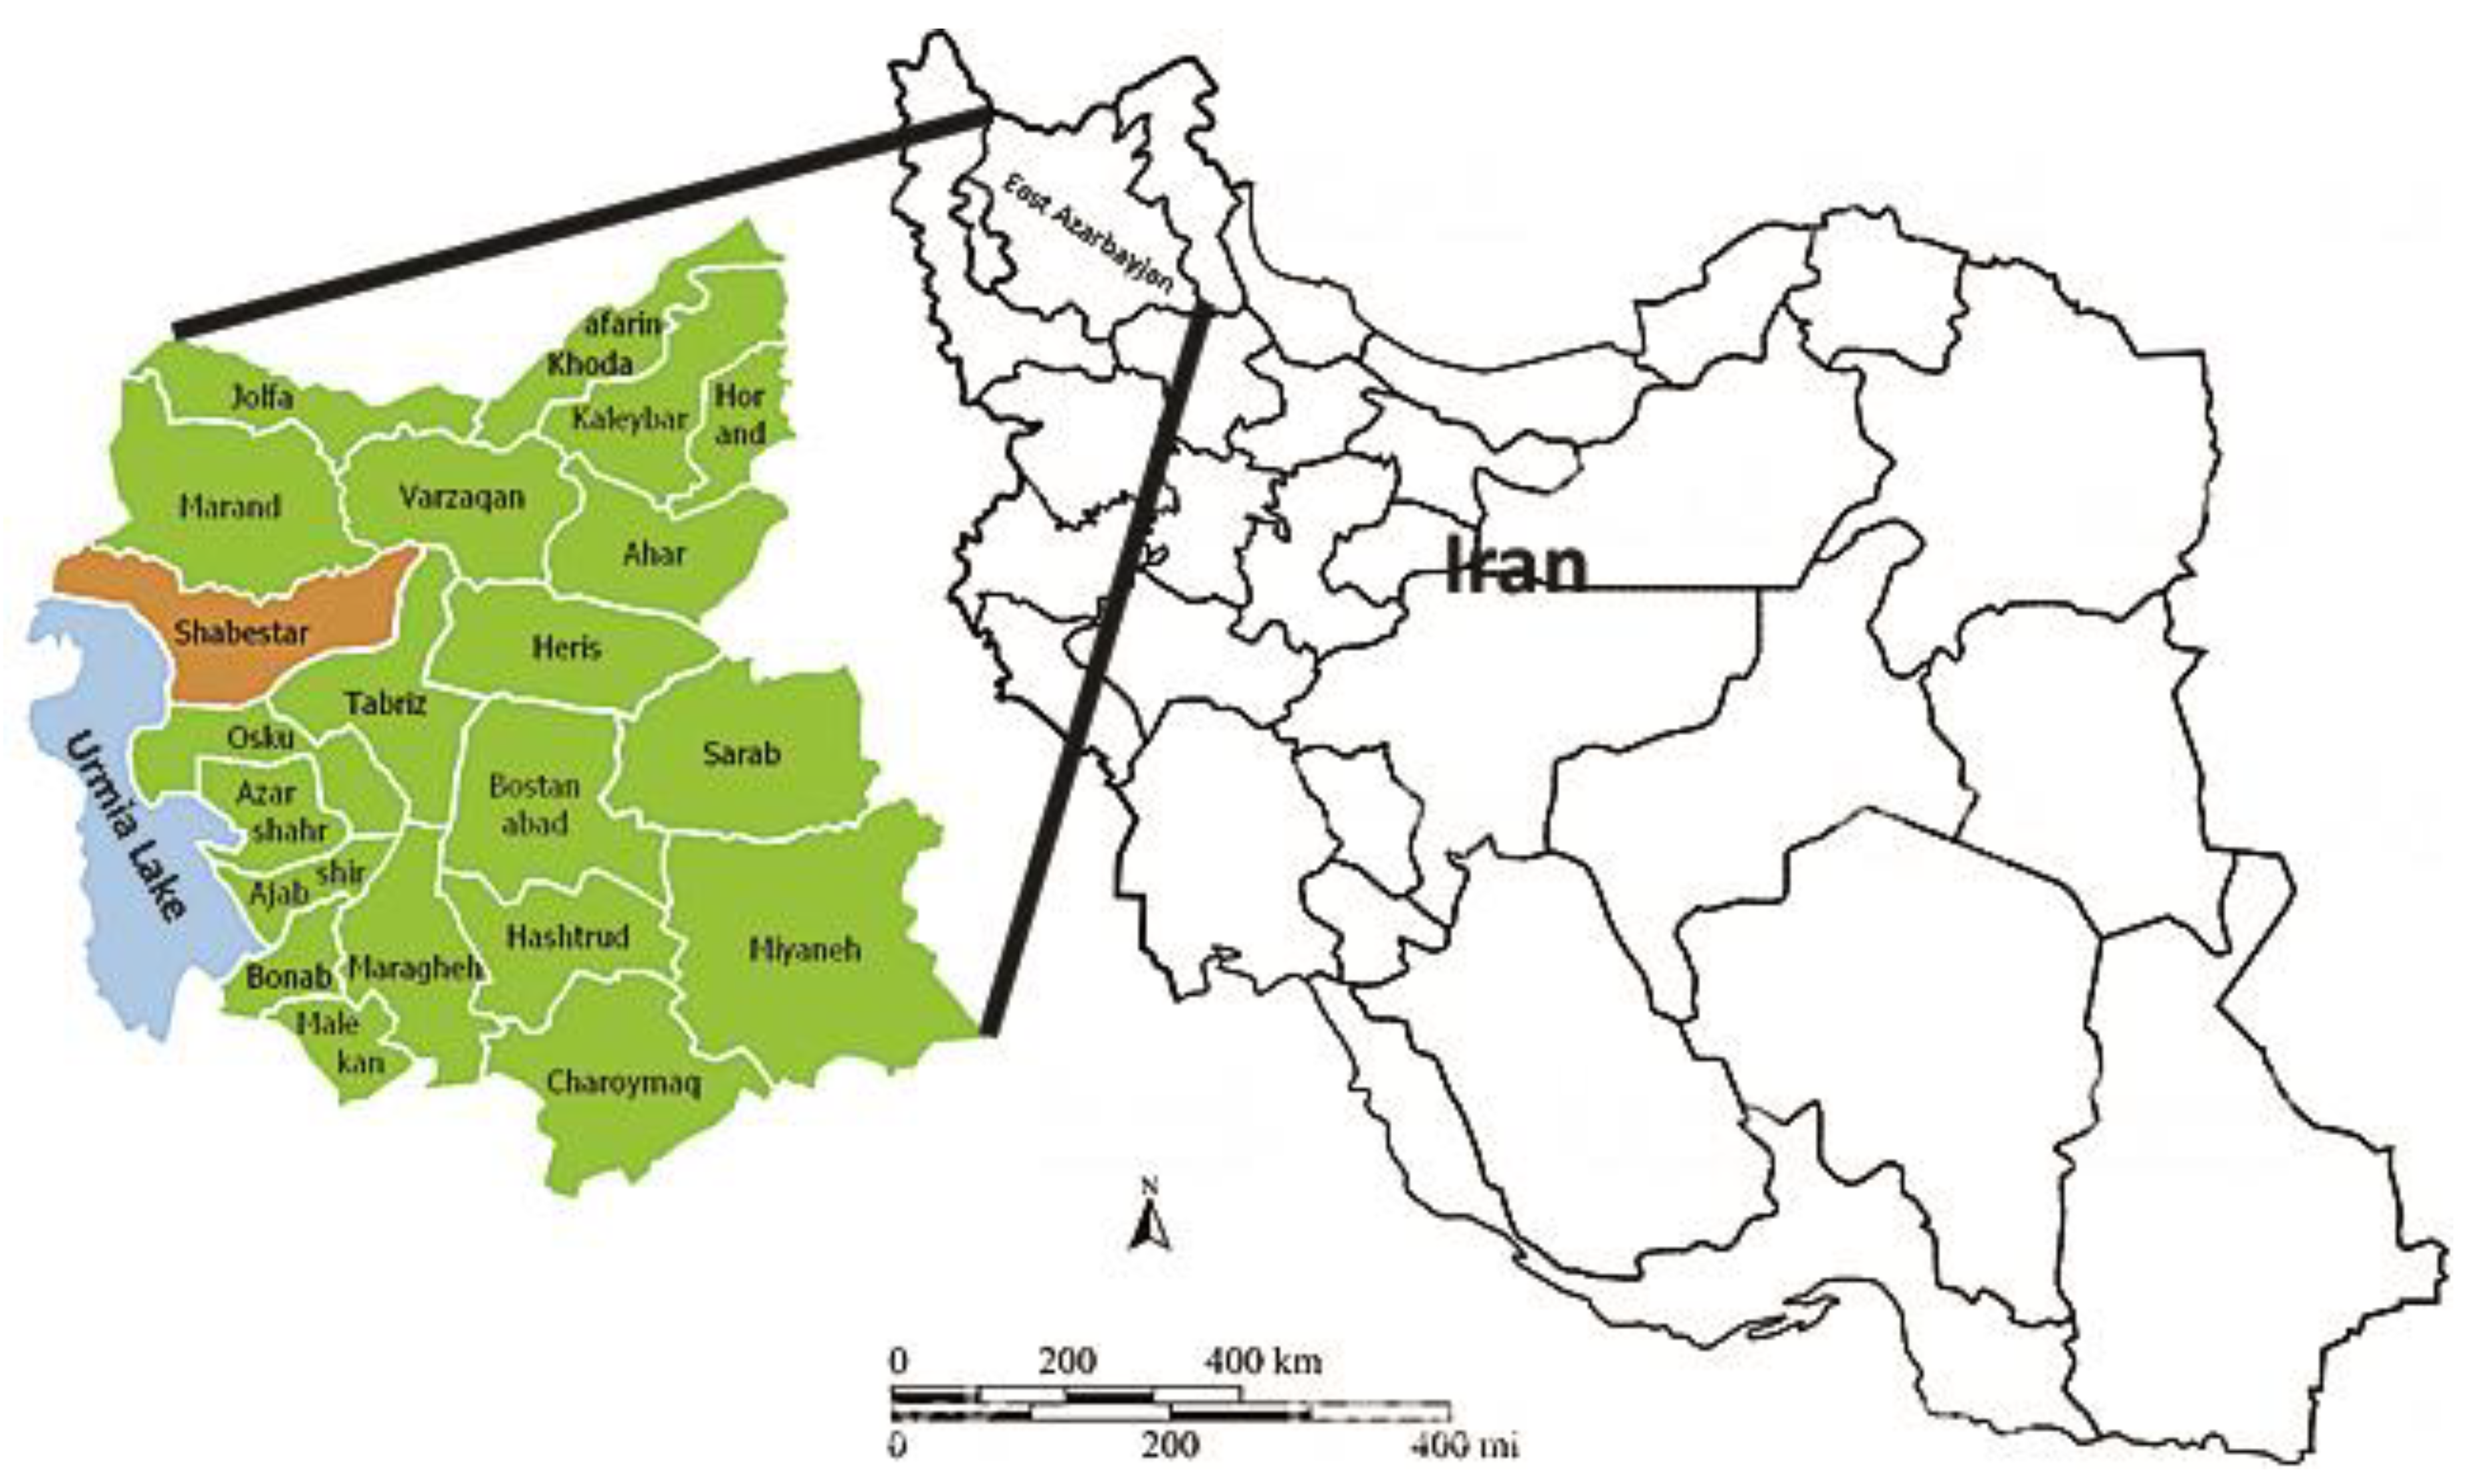
The eastern shores of UL are more susceptible to salt and dust of UL because of winds from the west and northwest. Shabestar, Osku, Azarshahr, Ajabshir and Bonab are located on the east side of the lake (
Figure 1). Meanwhile, Shabestar as one of the most important agricultural areas in the province of East Azarbayjan is considered as a tourism attraction center due to the touristic ports of Sharafkhaneh and Sheikhvali.
Shabestar region with an area of 2630 square kilometers (5.8 percent of the province’s area) is located in the northern east of East Azerbaijan province with longitudes from 45°5′ to 46°9′ E, latitudes from 37°5′ to 38°24′ N, and varying altitudes from 1275 m to 3195 m a.s.l.; it has borders with Marand and Varzeqan in north, Tabriz in east, West Azarbaijan Province and UL in West and Tabriz and Osku in south (
Figure 2). The effect of Mediterranean wet winds after passing the border of Turkey and West Azarbaijan is very clear in this region.
Based on the results of the general census of population and housing in 2011, the population of the Shabestar city is estimated at 124,499 people (3.3% of the province’s population) and the population of the center of this city is estimated to be 15,663 people. Shabestar’s weather is semi-humid that is moderate in the summer and cold in the winter. In addition, the humidity of UL has an impact on Shabestar’s climate. The average annual precipitation in the city of Shabestar is about 350 mm. Shabestar is an agricultural area and fruit gardens and vineyards have surrounded the city. Products of Shabestar are as follows: wheat, barley, legume, oilseeds, forage plants, pears, apples, walnuts, apricots, cherries, sour cherries, sloes, plums and peaches. Animal husbandry is also an important activity in Shabestar. The dominant industrial activities in Shabestar are non-metallic mineral production, food industry and agricultural processing industries [
28].
As mentioned above, in the context of UL drying and the resulting crisis, most of the issues, such as the causes, effects and environmental consequences have been studied. One of the issues that has been studied less in the region is the vulnerability of people caused by the crisis. The significance of this issue is that if the vulnerability of the people is not controlled and managed, the scale of the disaster will be much larger and larger, and in addition to the climate crisis, a humanitarian disaster in future will occur. However, various studies have been done on drought and its effects on the study area, but less attention has been paid to the vulnerability of people in the supposed region. Therefore, the novelty of the research is due to addressing the vulnerability of some people of the region (rural households) to the UL drying.
The vulnerability refers to the inability of a system or unit to cope with hazardous environment effects [
29]. According to Nurollahi et al. (2015) [
30], vulnerability refers to the extent to which the system does not perform its main activities in dangerous situations after an event. Vulnerability means a lack of provision against possible adverse events including social customs, disaster, physical disabilities, and exploitation. These issues contribute to the continuation of poverty. Therefore, poor people will be forced to sell their assets; so they lose their property and this makes poor people poorer and more vulnerable [
31].
3. Research Method
The current study was an applied research in terms of objectives and it was a survey in terms of data collection method. The research area was Shabestar region in East Azarbaijan Province, which is one of the important agricultural centers of the province. The city has three districts, as follows: central (including the rural districts of Sis, Central and East Guney), Sufian (including Chellehkhaneh, South Misho and Rudqat) and Tasuj (including the rural districts of the Chehregan and West Guney). The population of the study was rural households of this region (19,249 households based on the general census data of population and housing in 2011). Multi-stage cluster sampling was used in this study. In the first stage, two districts closer to UL were selected out of the three. In the second stage one rural district adjacent to UL was selected from each district and in the third stage, 10 villages were selected out of 15 villages of these rural districts, with regards to time and financial limitations. According to Kerjcie and Morgan’s (1970) [
37] sampling table and Patton’s (2002) [
38] study, it can be deduced that for 15 villages as a population, about two thirds can be selected for the sample. Accordingly, 10 villages were selected as research samples randomly. Finally, 347 rural households were selected as samples (out of 3542 rural households) based on the Krejci & Morgan table that was split by appropriate allocation among the villages.
The data collection tool was a researcher-made questionnaire based on IPCC definition of vulnerability. According to Lawshe (1975) [
39] and Yaghmaei (2003) [
40] content validity is obtained from three sources: literature, representatives of the relevant populations and experts. Items of “Exposure”, “Sensitivity” and “Adaptability capacity” were extracted by studying the relevant literature and conditions of the city (it was identified through interviews with 10 key informants as representatives of the relevant populations). The content validity of the questionnaire was confirmed by the subject matter experts’ panel (5 rural development experts). The Cronbach’s alpha coefficient was used to determine the reliability of spectral questions and the results are indicated in
Table 1.
The most common method for assessing scale score reliability is Cronbach’s alpha [
41,
42]. A number of software packages (including SPSS) for data analysis provide subroutines for computing alpha with relative ease. There are numerous examples of using the alpha coefficient for assessing the reliability of scale scores. One reason for alpha’s ubiquity is that few alternative methods for assessing reliability and vulnerability in cross-sectional studies are available. Despite the fact that alpha has been criticized in the literature due to rather strong assumptions, it is considered as an indicator of reliability [
43,
44,
45,
46].
This paper proposes an approach, referred to as the generalized simplex method, to estimate scale score reliability for panel data (Exposure, Sensitivity and Adaptability capacity) under more general assumptions. This provides the analyst with a number of reasons to report the reliability of spectral questions.
“Awareness of household vulnerability to UL drying and its effects” measures a household’s knowledge of susceptibility to UL drying and its ability to cope with, recover from, or adapt to those hazards.
“Access to and use of knowledge related to coping with UL drying and its effects” measures household access to different sources of information related to climate change, climate variability, and its impacts, and how this information is used.
“The ability to reorganize activities to cope with UL drying and its effects” refers to the degree to which it is able to collectively learn, plan and make necessary changes to cope with climate-related impacts in such a way that the main functions of the community are sustained.
“Governance and leadership to cope with UL drying and its effects” measures the presence of community leaders or government officials to mobilize climate change responses and resources to support adaptation, and their effectiveness or credibility.
Since different scales were used for the variables in this study, the deprivation score (Equation (3)) was used to eliminate the scale bias [
47,
48]. In this method, the highest value of each index is considered equal to 1, and other values are calculated through proportionalization [
47]. This process is based on the UNDP calculation of the combined human development index (HDI) every year. According to [
49] the three basic components of a thematic standardization assessment conclude the sampling design, the response design, estimation and analysis. Thematic standardization assessment campaigns often collect different qualitative and quantitative variables in order to increase accuracy. This relationship reflects the relative and fuzzy relativity of households to each other as well. Equation (4) was also used for variables with negative relationship with vulnerability [
47,
48]. The vulnerability measure was obtained by averaging the three indicator values. In order to get values that facilitate the interpretation, after the aggregation inside each indicator, obtained values have been rescaled between 0 and 1 (0 representing the lowest vulnerability rate or best situation and 1 representing the highest vulnerability rate or worst situation). Moreover, the analytic weighting method [
50] was used to estimate the weights of variables. However, the gained weights (from 0.43 to 0.45) did not show any significant difference among variables. Accordingly, the same weights were considered for all the variables. It is also worth noting that the application of equal weight for variables has been used in other studies e.g., [
22,
51].
which, I
ij is the variable numerical value related to each respondent, MinI
ij is the minimum value of the variable and MaxI
ij is the maximum value of the variable.
After the calculation of the “Exposure”, “Sensitivity” and “Adaptability Capacity” values that are derived from the variables average of each item, Equation (5) has been used to calculate the vulnerability index [
22]. According to this equation, there are 3 numbers with a range of 1–0, and their averages determine the vulnerability of rural households of the region.
where,
VI is Vulnerability Index,
E is Exposure,
S is Sensitivity and
AC is Adaptive Capacity.
It should be noted that in similar studies, using vulnerability index (
VI) is one of the most widely used vulnerability assessment methods [
50,
51,
52,
53].
The proposed theoretical framework of this study could be applied in other similar regions because in this study, the concept of vulnerability is used in accordance with the definition of IPCC and the vulnerability index has been used as a commonly used method.
There were 2 shortcomings of the research:
The Shabestar region is a big city and it was not possible to sample all its areas. Also, using the deprivation score make indicators scale free and calculate the composite index but it creates a shift in origin and thereby loss of information.
A bias: In this research, the weight of the indicators of exposure, sensitivity and adaptive capacity is taken equal, while it may have different weights (it is suggested for future research).
4. Results and Discussion
To examine the vulnerability of rural households in Shabestar, the variables related to “Exposure”, “Sensitivity” and “Adaptive capacity” were extracted by studying the relevant literature, similar scientific articles and by studying the status of this region through the existing statistics, visiting the experts of related organizations and institutions (Agricultural Jihad, Regional Water, Research and Education Center for Agricultural and Natural Resources, Governorate, etc.), and through the researcher experiences obtained from living in the region for many years. Moreover, based on the literature and scientific resources available on structural vulnerability [
3], the relationship between each variable and the vulnerability has been considered as positive or negative. For instance, the age of the head of household has a positive relation with the vulnerability of household, while the education of the head of household has a negative relationship with it. In other words, the older the head of the household is, the more vulnerable the household will be, but in the case of education, the more educated household head would result in the lower vulnerability of the household.
Table 2 presents the variables related with each index and its relation with vulnerability.
After the completion of data collection for research, a total of 342 questionnaires were completed and analyzed. The findings of the research in the descriptive statistics indicated that 89.5% of the studied households had a nuclear structure and 97.1% of the households’ heads were male. 80.4% of the heads were active in agricultural sector and 3.5% of them had special needs (medicine, treatment, etc.). Following the drying of UL, 36% of households had a member or members who had migrated for work or living in the past two decades. 2% of the households were among the minority groups who were not native to the region. They migrated from the villages of Islami Island District of UL to this area about a decade ago because of having some relatives in Kushk and Kafi-ol-Molk villages and good condition of agriculture in Shabestar.
Table 3 presents some results of descriptive statistics related to qualitative variables.
Liu and Menzel (2016) [
54] have identified long-term variations in vegetation and climatic variables and their scale-dependent relationships in Southwest Germany. We have stated Urmia Lake basin situation in the part of a larger research, where there were abrupt and gradual changes in temperature, rainfall, surface and volume of Urmia Lake mentioning some of it as a hazard introduction here (for example
Figure 1). But the main aim of this study is to assess the vulnerability of rural households to Urmia Lake drying, not the reasons for its drying.
In addition, the number of household members in the studied sample was between 2 and 8, with an average of 3.69. The age range of household heads was 27 to 80 years, with an average of 49.22 years. Regarding the head of households’ education, the results showed that the maximum value of this variable was 18 years. Regarding the economic situation, the mean score of 2.05 (range of 1 to 3) and the standard deviation of 0.35, showed that most of households had a moderate economic condition. Furthermore, having access to facilities with an average of 0.72 represented that this factor was relatively fair.
Table 4 represents some of the descriptive statistics results related to quantitative variables.
To analyze the status of “exposure” of the households, 18 variables were used (
Table 5). The results of this analysis indicated that the average was 0.445 with a range of 0.251–0.662 and a standard deviation of 0.080. In other words, regarding the range of this index (0 to 1), rural households in this region were at a moderate exposure. Household structure, household occupation, and household size have increased the risk of households’ vulnerability. In other words, with the nucleation of households in terms of the number of members, potential supports of generations (before and after) are reduced and this increases the vulnerability of households. The occupations of most household heads were agriculture and related jobs, which are very vulnerable to the drying of the lake and its adverse effects on this section. Variables of minority, head of household, special needs of the household head and the number of members with special needs with low average have reduced the vulnerability of households. The study area was a homogeneous community with no linguistic, religious or ethnic minorities. Only in the villages of Kushk and Kafi-ol-Molk, a number of immigrant households reside in the villages of the Islami (Shahi) island, who are involved in labor because of not having access to their own lands and they are considered as vulnerable minorities.
The numbers of households whose head was not a male were also very small. In addition, the numbers and figures showed that less than 5% of households had members with special needs (illness, disability, etc.). Generally, according to
Table 6 it should be noted that biological and physical variables such as location and distance are more or less common for all households, while socioeconomic variables lead to changes in the index of household exposure, which ultimately results in higher or lower vulnerability rate.
Seven variables were used to analyze the “sensitivity” of the households (
Table 6). The results of this analysis indicated that the average is 0.379 (range of 0.443–1.657 and a standard deviation of 0.110). In other words, considering the range of this index (0 to 1), the sensitivity of rural households in this region was low. Among the variables used to measure sensitivity, high values of the variables of “damage to agriculture” and “dependence of household income on agriculture” increase the vulnerability of the households and the low values of “dependence of household consumption and income on tourism” reduce the vulnerability.
To analyze the status of “adaptive capacity” 13 variables were used (
Table 7). The results of this analysis depicted that the average of this index was 0.440 (range of 0.211–0.632 and a standard deviation of 0.51). In other words, regarding the range of this index (0 to 1), the capacity of rural households to adapt to the effects of drying of the UL was low. Among the variables used to measure adaptive capacity, High value of the variable of “share of household income from agriculture”, low value of the variable of “amount of agricultural land”, little “household livelihood diversification”, lack of “alternative livelihood” and the uselessness of “relevant knowledge” provided by knowledge resources for rural households in the region had the greatest impact in the reduction of adaptive capacity as well as the increase of their vulnerability.
Regarding this index, it should be noted that along with economic variables, needed social variables to deal with the effects of drying the lake are of great importance which should not be neglected. The most important economic variables are the share of household income from agriculture, the amount of agricultural lands, the household livelihood diversification and the existence of alternative livelihood and the most important social variables are access to the required knowledge to deal with the effects of drying and being useful of the knowledge, the ability to reorganize activities of community, governance, and the leadership of society.
Construction of water reservoirs with special plastic coatings (polyethylene) or the pistachio gardens that are resistant to salinity and dehydration are among the appropriate actions taken in this area, but unfortunately these activities were in small scales and did not have much impact on increasing the capacity of adaptation and the reduction of the vulnerability index.
The findings showed that the average vulnerability of rural households is 0.47 (range 0 to 1 and a standard deviation of 0.068) which represents the vulnerability of studied households to be modest. Considering that vulnerability is a function that includes exposure, sensitivity and adaptive capacity; moderate vulnerability of rural households of the Shabestar region to UL drying is the result of their moderate exposure, being moderate to low sensitivity and being moderate to low adaptive capacity. The vulnerability range of rural households in Shabestar varies between 0.31 to 0 607 which is more limited compared to the ranges of exposure, sensitivity and adaptive capacity (
Table 8). In other words, each of the indicators can have a moderating role in the reduction of the vulnerability index.
It should be stated that the moderate to low adaptive capacity of the rural households in the region has had the greatest impact in increasing their vulnerability to UL drying.
The mean score and standard deviation were used to classify the studied rural households (
Table 9). Accordingly, the vulnerability rate of 70.5% of households was moderate and these were the largest number of households under the study. 16.7% of households had high vulnerability and 12.8% of households had low vulnerability.
On the other hand, the drying of the UL is regarded as a major environmental hazard in the region and its effects including climate changes, salt winds, water and soil pollution, the destruction of agriculture and migration of villagers are obvious. In addition, the vulnerability of most rural households in Shabestar (more than 87 percent with moderate and high vulnerability) is exacerbating this environmental tragedy. The vulnerability of rural households along with the UL drying, as an environmental hazard, is a great risk to the livelihoods of people in the region that threatens the North West of Iran and needs to manage the risk, reduce, and mitigate its effects. In recent years, farmers have been forced to abandon a part of their agricultural lands and they only rely on the gardens that currently produce the right crop. Deepening the old wells and digging new wells were the first responses of farmers to the drying and reduction of groundwater level, because it is the most important source of agricultural and drinking water. Livelihood problems, especially for farmers have led them to sell some of their assets to survive and to use their savings. Leaving the school in the household due to financial problems and the migration of some members to near cities and Tehran for work or living are other issues of this region.
It should be noted that the drying of UL is regarded as an important environmental issue in the region, and its effects including climate change, salt winds, water and soil pollution, the destruction of agriculture, and the migration of villagers are obvious. In addition, the vulnerability of most of rural households in Shabestar (over 87% with moderate and high levels of vulnerability) is aggravated due to this issue.
Considering that vulnerability is a function that includes exposure, sensitivity and adaptive capacity; it leads to moderate vulnerability of rural households of the Shabestar region. In other words, UL drying is the result of moderate exposure, being moderate to low sensitivity and being moderate to low adaptive capacity. Rural households in this region were at a moderate exposure. Household structure, head of household occupation and household size were the most important variables that have increased the risk of households’ vulnerability. The sensitivity of rural households in this region was moderate to low. Among the variables used to measure sensitivity, high values of the variables of damage to agriculture and dependence of household income on agriculture increase the vulnerability of the households. It should be noted that along with economic variables, social variables also needed to be dealt with the effects of drying the lake.
The most important economic variables conclude in the share of household income from agriculture, the amount of agricultural lands, the household livelihood diversification, and the existence of alternative livelihood. In addition, the most important social variables are needed to deal with the effects of drying and they have the ability to reorganize the activities of community, governance, and the leadership of society (
Table 10).
Our analysis has provided quantified values for the social dimension of vulnerability and presented the combination of “sensitivity” and “exposure” in the selected area. Based on experience gained in semi-arid and arid climates of Iran, we assume that the vulnerability assessment of rural households can stand as a potential driver for migration or human displacement. This finding is in consistent with Menike and Arachchi (2016) [
55] where smallholder farmers have observed the rising trends in climatic variables.
Our findings can be useful when water scarcity exceeds the local thresholds and turns into socioeconomic vulnerability. Additionally, drought threatens agricultural products, reduces work opportunities and income that lead to migration and human displacement. The core concept of Shabestar region’s vulnerability assessment was to provide adequate bases for planning and the implementation of decisions for increasing the capacities of communities and rural households.
Based on IPCC (2014) [
56], it is projected that the geographical region of Iran in long future period of 2090–2099 would experience a significant temperature rise of 2.5 to 5 degrees Celsius and a decline about 10–20 percent in annual precipitation. In this regard, UL is facing with warmer and dryer future which some research including [
57,
58,
59] have implied that.
According to the results, more than 1.5 million villagers live in more than 415,000 households in the catchment area of UL that are exposed to the environmental crisis of the drying of UL. This population is dependent on vulnerable resources such as water, air, soil and plants to live. They have a limited adaptive capacity to the crisis for some reasons like poverty, lack of awareness and lack of infrastructure. They are the most vulnerable section of the society and this problem threatens them more than the others. Therefore, the vulnerability of rural households in the region is of particular importance.
Thus, improving the adaptive capacity of these vulnerable households also reduces their sensitivity and finally decreases their overall vulnerability. This finding can be corroborated by Nkondze et al.’s (2013) study [
59] who reported that 58% of household farmers in their study were moderately vulnerable to climate change. Improving the adaptive capacity also has indirect implications on improving the sensitivity of the community. For example, improving the irrigation facilities (physical assets) in the locality decreases the sensitivity of crops to droughts. Similarly, creating opportunities for non-farm income reduces the extensive dependence of the community on natural resource-based livelihoods, thereby reducing their sensitivity towards climate change and extremes. Among the various components of adaptive capacity, the policy emphasis should be placed to create opportunities for non-farm livelihoods options, which will not only improve the cash income of the community, but also reduce their dependence on natural resources. The results are in line with [
59,
60].
According to the results of the current study, climate adaptation programs land in highly sociopolitical contexts from the national level down to the community/local level. There is a need for programs to reconfigured authority between all levels of government and creating opportunities for facilitating plans. Additionally, there is a genuine need to guide and manage real biophysical and sociopolitical changes in rural households. On the other hand, the one who is authorized to decide what constitutes ‘positive change’ and on what basis, is inextricably bound up in the current political instability.
The main challenging question here is which financial and physical resources should be controlled and why political consensus has been impossible to achieve adaptation strategies in Shabestar region since the first appearance of UL drying. In this sense, adaptation programs at the same are both deeply embedded in the ability of nation-state and development actors to support authority.
Therefore, the current study aimed to improve the availability and access to the corresponding data towards policy making to decrease UL drying pace and rural household’s vulnerabilities.
5. Conclusions and Suggestions
This research has identified the status of variables that affect vulnerability and this can help policymakers to make the appropriate decisions. Some of the suggestions that cover this issue are “Training and introducing alternative livelihood resources” and practical information should be available to local people through media to deal with the adverse effects of UL drying.
In this study, the vulnerability was calculated based on IPCC definition using vulnerability index (VI) which is one of the most widely used vulnerability assessment methods. The findings showed that the average vulnerability of rural households is 0.47 (range 0 to 1 and a standard deviation of 0.068), which represented the vulnerability of studied households to be modest. To be more specific, vulnerability is a function that includes exposure, sensitivity and adaptive capacity which are resulted by and moderate exposure, low sensitivity and low adaptive capacity of households of the region. The vulnerability range of rural households in Shabestar varies between 0.31 to 0 607, which is more limited compared to the ranges of exposure, sensitivity and adaptive capacity. In other words, each of them can have a moderating role in the reduction of the vulnerability index.
The major findings in this paper indicate that the predicted water level decreases due to different hydrological periods in selected scenarios. Therefore, it could increase the capacity of rural households to adapt to the effects of UL drying. Among the variables used to measure adaptive capacity, “share of household income from agriculture”, “amount of agricultural land”, “household livelihood diversification”, “alternative livelihood”, and “relevant knowledge” had the greatest impact in the reduction of adaptive capacity.
In addition, little precipitation, moderate exposure, low sensitivity, low adaptive capacity of households, and decrease in the water development projects implementation in the watershed can threaten the environmental resilience of the region. Therefore, with regards to the resilience, these components should be considered altogether to sustain the lake’s environmental balance. To decrease the UL drying’s pace and to make a decision toward water resources management, it is necessary to do further studies to re-plan the water usage (considering the climate change) and make it harmless to the lake environment.
In recognition of vulnerability assessment as a rational base for climate change adaptation, assessment methodologies appropriate for different level of governance should be developed and refined. The study has scratched the surface of a number of growing dimensions of climate change vulnerability that need further research. Among these are the issues confronting gender in relation to climate change impacts, the case of informal settlements which may well be related to migration in the light of climate change, the continuing need to delve into the risks confronting the agricultural sector, and the relevance of social capital within the climate change discourse. It is recommended that national governments look into these dimensions and provide support for researches that will provide knowledge- and science-based anchor for policies and on-ground interventions toward climate change adaptation.
The following policy recommendations will improve the situation in the region and reduce the vulnerability of rural households:
- -
Quantitative growth of the cultivation of crops in the region should be stopped as soon as possible.
- -
The cultivation of heat and salinity resistant products could be considered as an alternative.
- -
New irrigation methods can be promoted in the region to improve agricultural water consumption efficiency.
- -
Low interest and long-term facilities for the construction of new irrigation systems should be available to farmers, especially farmers who have changed their crops to low water consuming products.
- -
Financial supports to create jobs for young people, in small and early return businesses such as greenhouses, industrial workshops, etc. must be done to prevent them from migrating.
Training and introducing alternative livelihood resources such as handicrafts and livestock breeding could reduce farmers’ dependency on agricultural and horticultural markets that increase adaptation capacity.
- -
Practical information should be available to local people through media to deal with the adverse effects of UL drying.
- -
Based on the present research, the followings are suggested for future studies:
- -
To gain more accurate results, using weighting methods to study the variables is recommended.
- -
We recommend conducting a study to examine the coping strategies of villagers with the effects of UL drying to strengthen the scientific and appropriate strategies.
- -
Considering the variety of vulnerability factors, computer modeling may be used in a research to manage and reduce the vulnerability of rural households.


