1. Introduction
Urbanization, including housing construction, reclamation, and transportation infrastructure construction, causes large areas of natural soil to be replaced by impervious materials, thus reducing groundwater recharge potential [
1]. This potential includes redistribution, supplementary mechanism change, and supplemental rate and water quality [
2]. Studies show that the reduction of groundwater recharge around roads is closely related to an increase in impervious surface area [
3,
4]. Other studies show that the development of highway and railway systems will affect the hydrological and geological patterns in the landscape, changing runoff, and both sediment and water quality [
5,
6]. Also, city water pollution is aggravated by impermeable surfaces, and runoff increase is likely to cause flooding in cities [
7,
8]. Therefore, as the main source of urban impermeable surface growth, transportation infrastructure is an important ecosystem stressor.
City developmental levels are influenced by topographic features, top-planning coordination between local and higher levels of government, and the degree of social and economic development in different regions of an urban agglomeration. Regional transportation infrastructure development helps connect neighboring cities and enhances the exchange of material and energy flows between cities. Currently, there are more miles of highways than of railways throughout the world, but the long-term growth rate of railways is higher than that of highway systems [
9,
10]. In urban agglomeration studies, unlike the studies of single cities, we need to focus on the external connectivity of the transportation system, including development of the railway and arterial road networks between cities. Therefore, the developmental impact of the regional transportation infrastructure, including the railway network, on the urban agglomeration ecosystem must be considered.
Both railway and highway construction technologies and procedures are similar, and they have similar structural features. Theoretically, these two types of transportation infrastructure have similar negative impacts on urban agglomeration ecosystems. But Popp and Boyle [
9] pointed out that there are few studies on the impact of the development of the railway system on ecological systems in past studies of road ecology. Also, ecological studies of railway infrastructures are mostly concerned with the linear isolation effects of the railway on wild animals, or the mortality rates of wild animals crossing tracks. On the other hand, because groundwater penetration has a negative effect on transportation infrastructure, research on the relationship between transportation infrastructure and groundwater stems mostly from experimental results of seepage rate and field sampling of pavement materials conducted by transportation engineers.
Negative effects on urban agglomeration ecosystems under the stress of urbanization, negative-effect risk prediction, and proposals of predictive methods are currently hot issues for study. To examine the ecological risk of urban agglomeration, we must characterize risk components and components of urban agglomeration risk assessment, and define their relationships. Therefore, based on the framework of urban ecological risk assessment proposed by Tang, et al. [
11], we take regional transportation development (RTD) as the stressor, and water regulation, which is an ecosystem service, as the assessment endpoint to identify the characteristics of stress generated by RTD on the urban agglomeration ecosystem.
We selected the Soil Conservation Service Curve Number method (SCS-CN) to analyze the internal relationship between the assessment endpoint indicator and the stressor factors. At the same time, a multi-level risk characterization method proposed by Li, et al. [
12] was used to directly present the spatio-temporal dynamic process of risk, and to provide a scientific basis for the risk management of urban agglomerations.
3. Methods
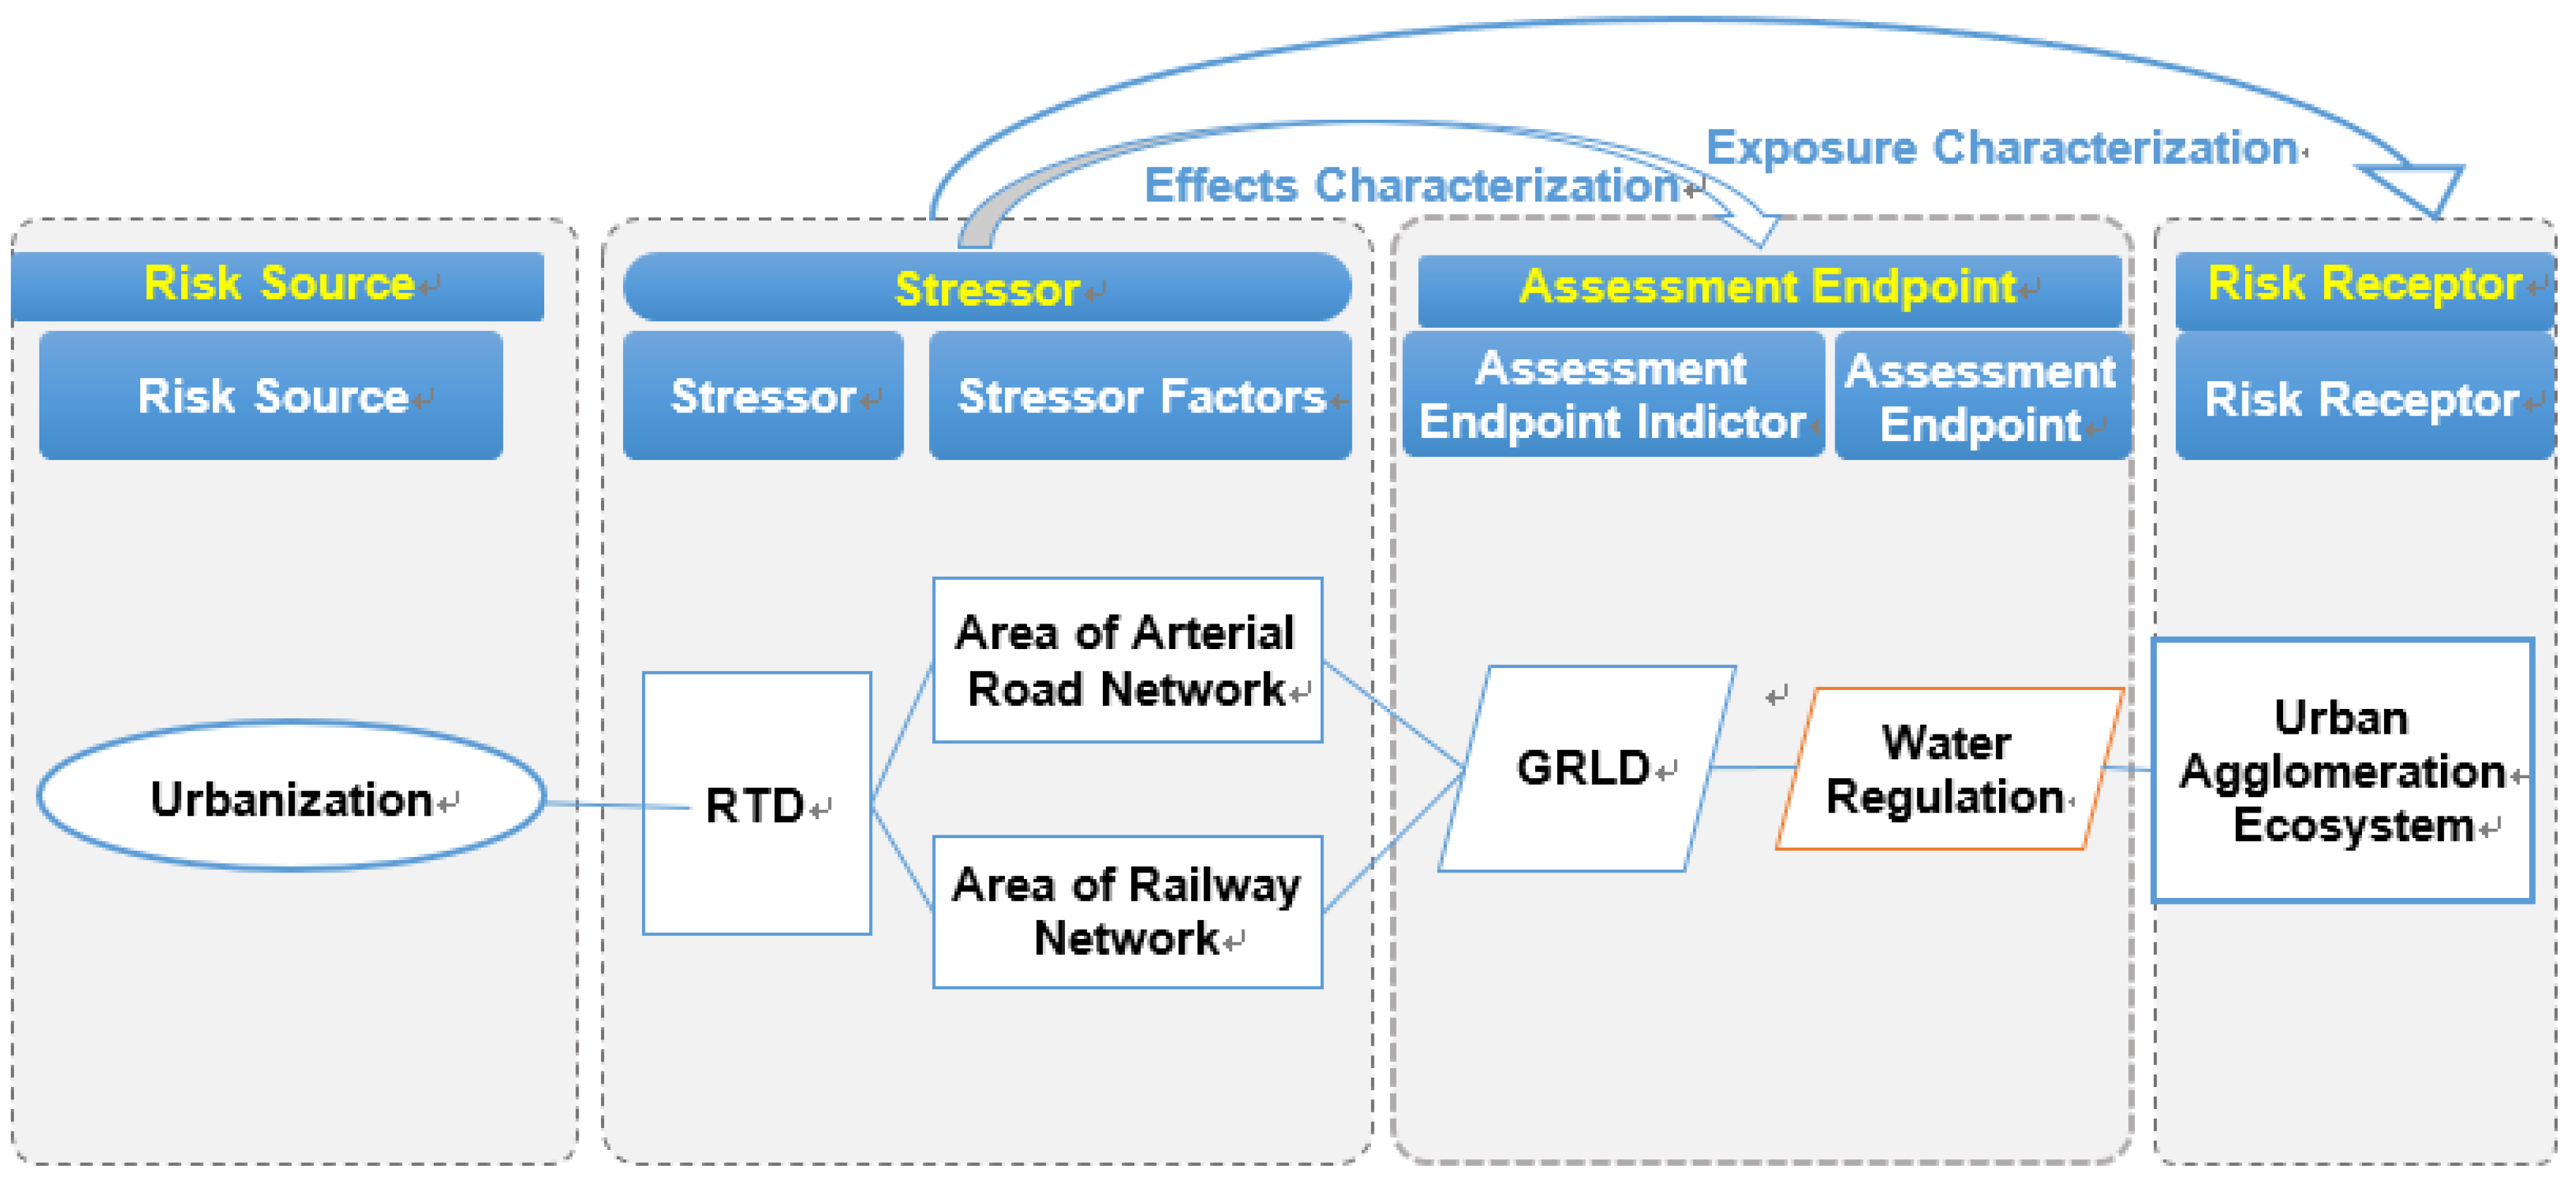
Using a framework of urban ecological risk assessment,
Figure 3 shows risk components and relationships among urban agglomeration ecological risk assessment components. Stressors are defined as causes of negative effects on the urban agglomeration ecosystem, while stressor factors are quantitative descriptions of the stressor. The assessment endpoint is the external expression of the environmental value under stress that needs protection, and the assessment endpoint indicator is a measurable index that describes the state of the assessment endpoint.
3.1. RTD and Stressor Factors
RTD differs from development of the transportation system in a single city. While urbanization and transportation infrastructure develop together, there is no substantial relationship between the development of low-grade roads and urban agglomeration socio-economic development. The main function of local roads is to extend the services provided by arterial roads, while railways and arterial roads aim to facilitate the flow of materials, information, and energy among cities. A rational RTD plan can satisfy high-quality living standards, promote regional economic growth, minimize damage to the natural and human environments, and concur with regional land use planning. According to the definition in the “Transportation Planning Handbook” [
16], regional transportation planning includes the planning of a high-quality transit system, an arterial roads network, and a railway system; it is based on traffic volume predictions and land use planning. Although most urban form and land use patterns come from specific urban planning, urban agglomeration development takes place under a larger economic, social, and political background. The development goal and direction of the long-term transportation system in the study area has been determined by the “Integrated Transportation Planning of Xiamen-Zhangzhou-Quanzhou Metropolitan Area”. This intercity transportation corridor plan is the initial response to regional planning and to the regional planning goal.
Dense local roads may, indeed, have a greater impact than railways, but from the perspective of regional development, it is more appropriate to explore the impact of railways and arterial roads on the urban agglomeration ecosystem. Thus, in this study, the pavement areas of both arterial roads, and of railway tracks, are the stressor factors in the urban agglomeration ecological risk assessment. According to the grade of roads and typical transportation infrastructure design, the single lane width of motor way, trunk roads, primary road and railway are 3.75 m, 3.75 m, 3.5 m and 1.435 m, respectively. These widths are multiplied by the facilities’ lengths within each sample to obtain areas.
3.2. Groundwater Recharge Loss Degree as an Assessment Endpoint Indicator
Groundwater recharge is difficult to quantify in areas lacking measured hydrological data and experimental field data. The United States Geological Survey (USGS) defines five categories of methods to estimate groundwater recharge, namely water budget models, unsaturated zone methods, groundwater methods, streamflow methods and tracer methods. Among those, the chloride-tracer method, ground-water models such as MODFLOW, and the water-table fluctuation method are most widely used because of their simplicity. But the deficiency of available data made these methods unsuitable for this study. The chloride-tracer method requires the measurement of long-term chloride accumulation in precipitation; the water-table fluctuation method can only be applied when the water-level records are available; and, lastly, the accuracy of ground-water models depends on the availability of transmissivity, head, and discharge data. [
17] In the other hand, rainwater loss by evaporation and transpiration during rainfall is relatively small, with the main loss due to interception and infiltration [
18,
19]. So for this study, precipitation ends in one of two processes: surface runoff and groundwater recharge in this study. Therefore, based on rates of surface runoff on natural soil and on impermeable pavement of the transportation infrastructure, groundwater recharge loss degree (GRLD) serves as the assessment endpoint indicator, describing the degree of groundwater recharge loss in the form of surface runoff (Equation (1)).
where
is the groundwater recharge loss degree in sample
i,
(m
3) is the volume of annual surface runoff under the assumed undeveloped condition in sample
i, and
(m
3) is the volume of annual surface runoff under actual conditions in sample
i.
3.3. Exposure-Response Relationship
The exposure-response relationship of surface runoff and RTD in this study is expressed by multiplying surface runoff and the pavement area of the transportation infrastructure (Equation (2)).
where
(m
3) is the volume of annual surface runoff under actual conditions in sample
i,
is the annual surface runoff under actual conditions in sample
i,
(m
2) is the pavement area in sample
i.
The SCS-CN method, proposed by the United States Department of Agriculture in 1989, is an empirical model based on statistical results obtained by processing large experimental data sets. It characterizes the natural law of rainfall-runoff by considering the underlying hydrologic surface. This method considers actual background conditions, including soil, slope, vegetation, and land use in the study area. The SCS-CN method is clearly structured, and can be used for runoff analysis of small surface units. It is also suitable for watersheds lacking measured hydrological and field experimental data [
19,
20,
21]. It is constructed with a water balance equation and an equation representing a proportional equality hypothesis, as well as an empirical equation (Equations (3) and (4)). The initial abstraction is associated with potential maximum retention.
where
F (in) is actual retention (rainfall loss),
S (in) is potential maximum retention,
Q (in) is actual runoff,
P (in) refers to total rainfall, and
(in) is the initial abstraction.
The total rainfall in this study was obtained from annual average precipitation data gathered during 24-h periods, beginning at 20:00 h in Fujian Observatory.
is 0.2 times the potential maximum retention (
), while the potential maximum retention is determined by the curve number (CN), which is based on soil type and surface cover. The CN is a dimensionless spatial parameter that represents the influence and contribution of many environmental factors that can reflect the surface characteristics of the watershed before rainfall. The CN is generally within the range of 30–100, with smaller values indicating a lower possibility of runoff generation and larger values representing a higher possibility of runoff generation. Soil hydrology type and antecedent moisture condition (AMC) are important parameters used to determine the CN, along with three soil moisture conditions: dry, moist, and average soil moisture (AMCII). Because the study area is relatively small, we assumed that the AMC in each sample is consistent, so curve numbers under the AMCII condition were used for further analyses. The soil hydrology types in the SCS-CN method are divided into four categories according to soil permeability. Based on the principle that permeability of sand is highest, and permeability of clay the lowest, the soil of the southern Fujian Golden Triangle was appropriately categorized to fit the calculation process. The CN for each sample is obtained according to different soil groups, cover types, and hydrologic conditions in the curve number table below (
Table 1). Fujian province’s mountainous terrain requires that a ballast track be used to construct the railway track system in the study area. This means that stone slag is used as ballast bed above the subgrade. Also, characteristics of the vertical section structures of the railway and the highways are similar, so we used the “gravel” hydrologic condition in the calculation for railways.
3.4. Risk Prediction
Kaplan [
22] proposed a risk characterization method that can describe method scenarios, likelihood, and consequences, all at the same time. That method considers the uncertainty of the risk stressor and the uncertainty of the assessment endpoint. To improve the adaptability of this method in the assessment and prediction of the ecological risk of urban agglomeration, our study utilized the multi-level characterization method for urban ecological risks proposed by Li et al. [
12]. This method provides a comprehensive description of the negative ecological effects and their uncertainty, the definition of risk. Additionally, scenario predictions can demonstrate the predictive characteristics of risk. The assessment endpoint value and its probability can provide a scientific basis for risk control (Equation (5)).
where
R is the UAER,
S refers to RTD,
φ is future arterial road and railway pavement areas,
Pi (
φ) is the probability of
φ that derives from the uncertainty of the implementation of the development plan,
xi is GRLD,
Pi (
xi) is the probability of
xi derived from the determination of
and the interpolation analysis,
i is the sample number, and
c is the complete set of forecasted risk source scenarios.
The uncertainty of RTD stress mainly comes from the uncertainty of the development plan. Therefore, taking the development plan of the southern Fujian Golden Triangle as the constraint condition, we determined a prediction value for the scenario.
The CN reflects the geographical features of the underlying surface, so the output accuracy of the SCS-CN model relies heavily on the proper selection of the CN, while the
value directly affects that selection. The probability of the
comes from the occurrence probability of the empirical equation, as it associates the initial abstraction with potential maximum retention. Kriging interpolation is a mathematical method for providing an optimal, linear, and unbiased estimation of the studied object. Therefore, in this study, the probability of the assessment endpoint indicator is determined by the above two variables and is expressed in Equation (6).
where
is the probability of GRLD,
is the probability of the determination of
, and
is the probability of interpolation analysis.
The essence of Kriging interpolation is to find a fitting curve to fit distances and semivariances, then according to an arbitrary distance, calculate the corresponding semivariance. Therefore, the residual distribution function of the fitted curve was used to characterize the deviation of rainfall and the probability of each deviation. The probability of the
derives from the credibility of the empirical coefficient of 0.2, so the USDA basic data survey was used [
23].
4. Results
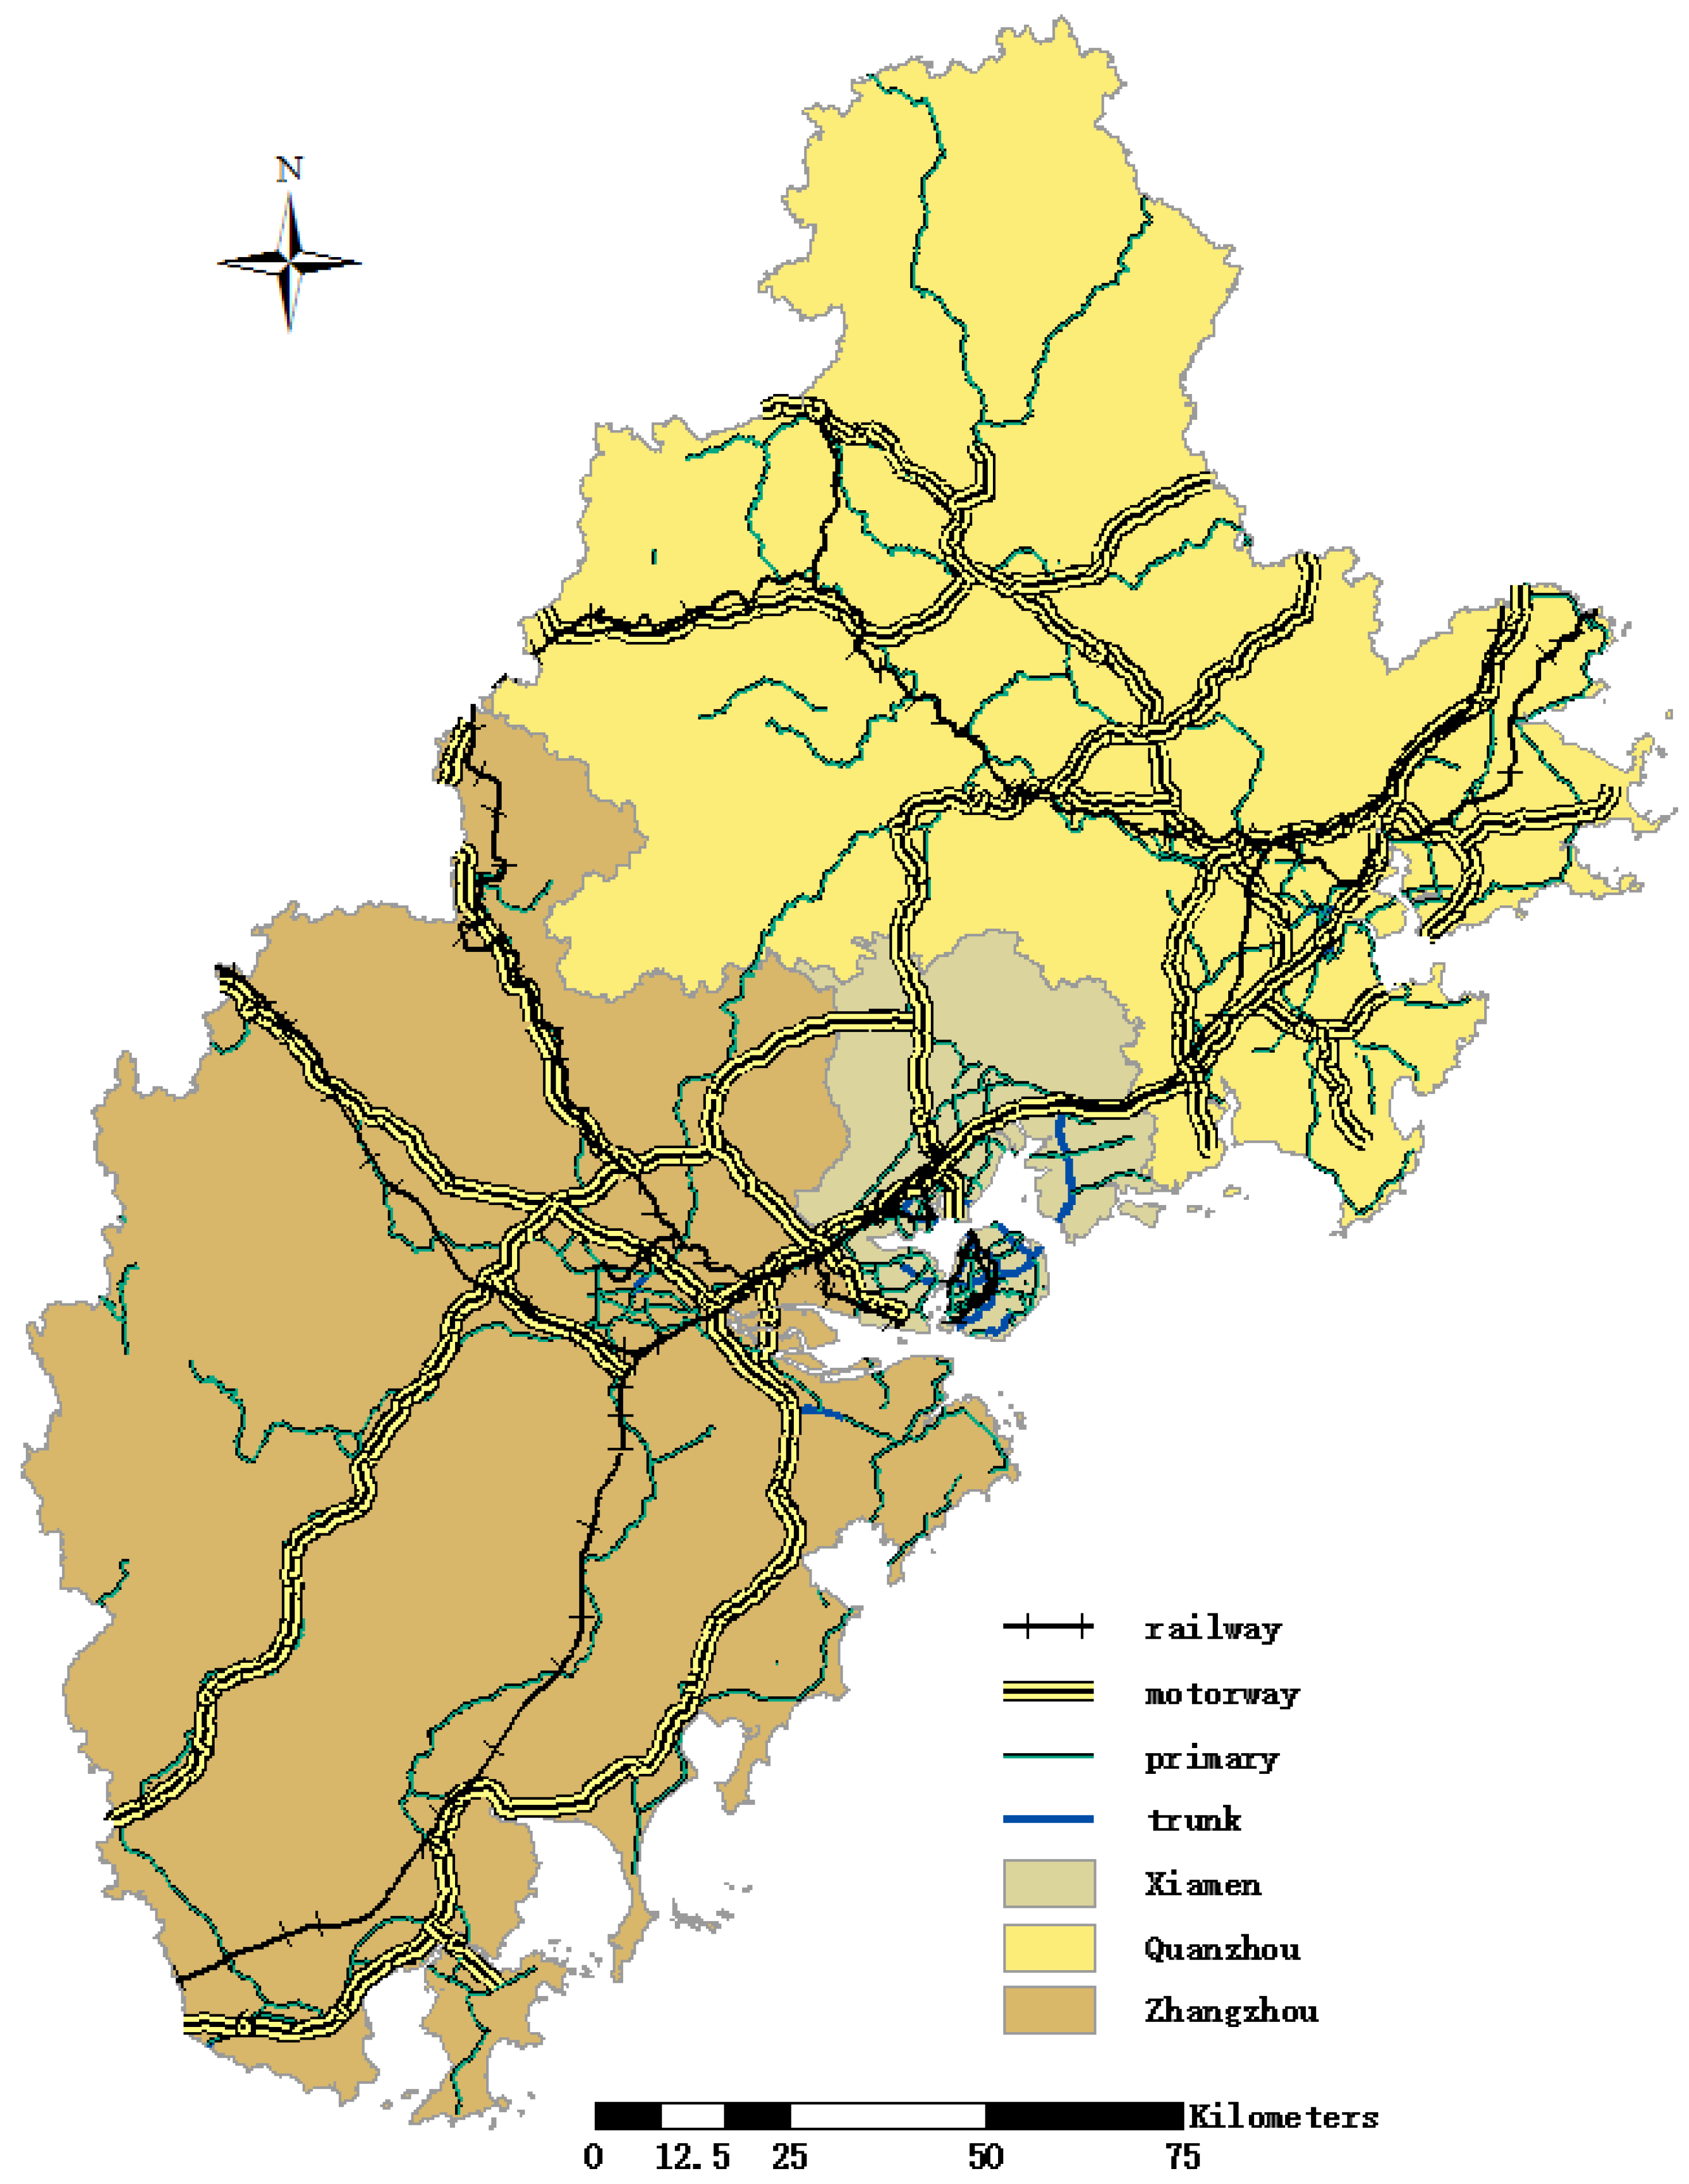
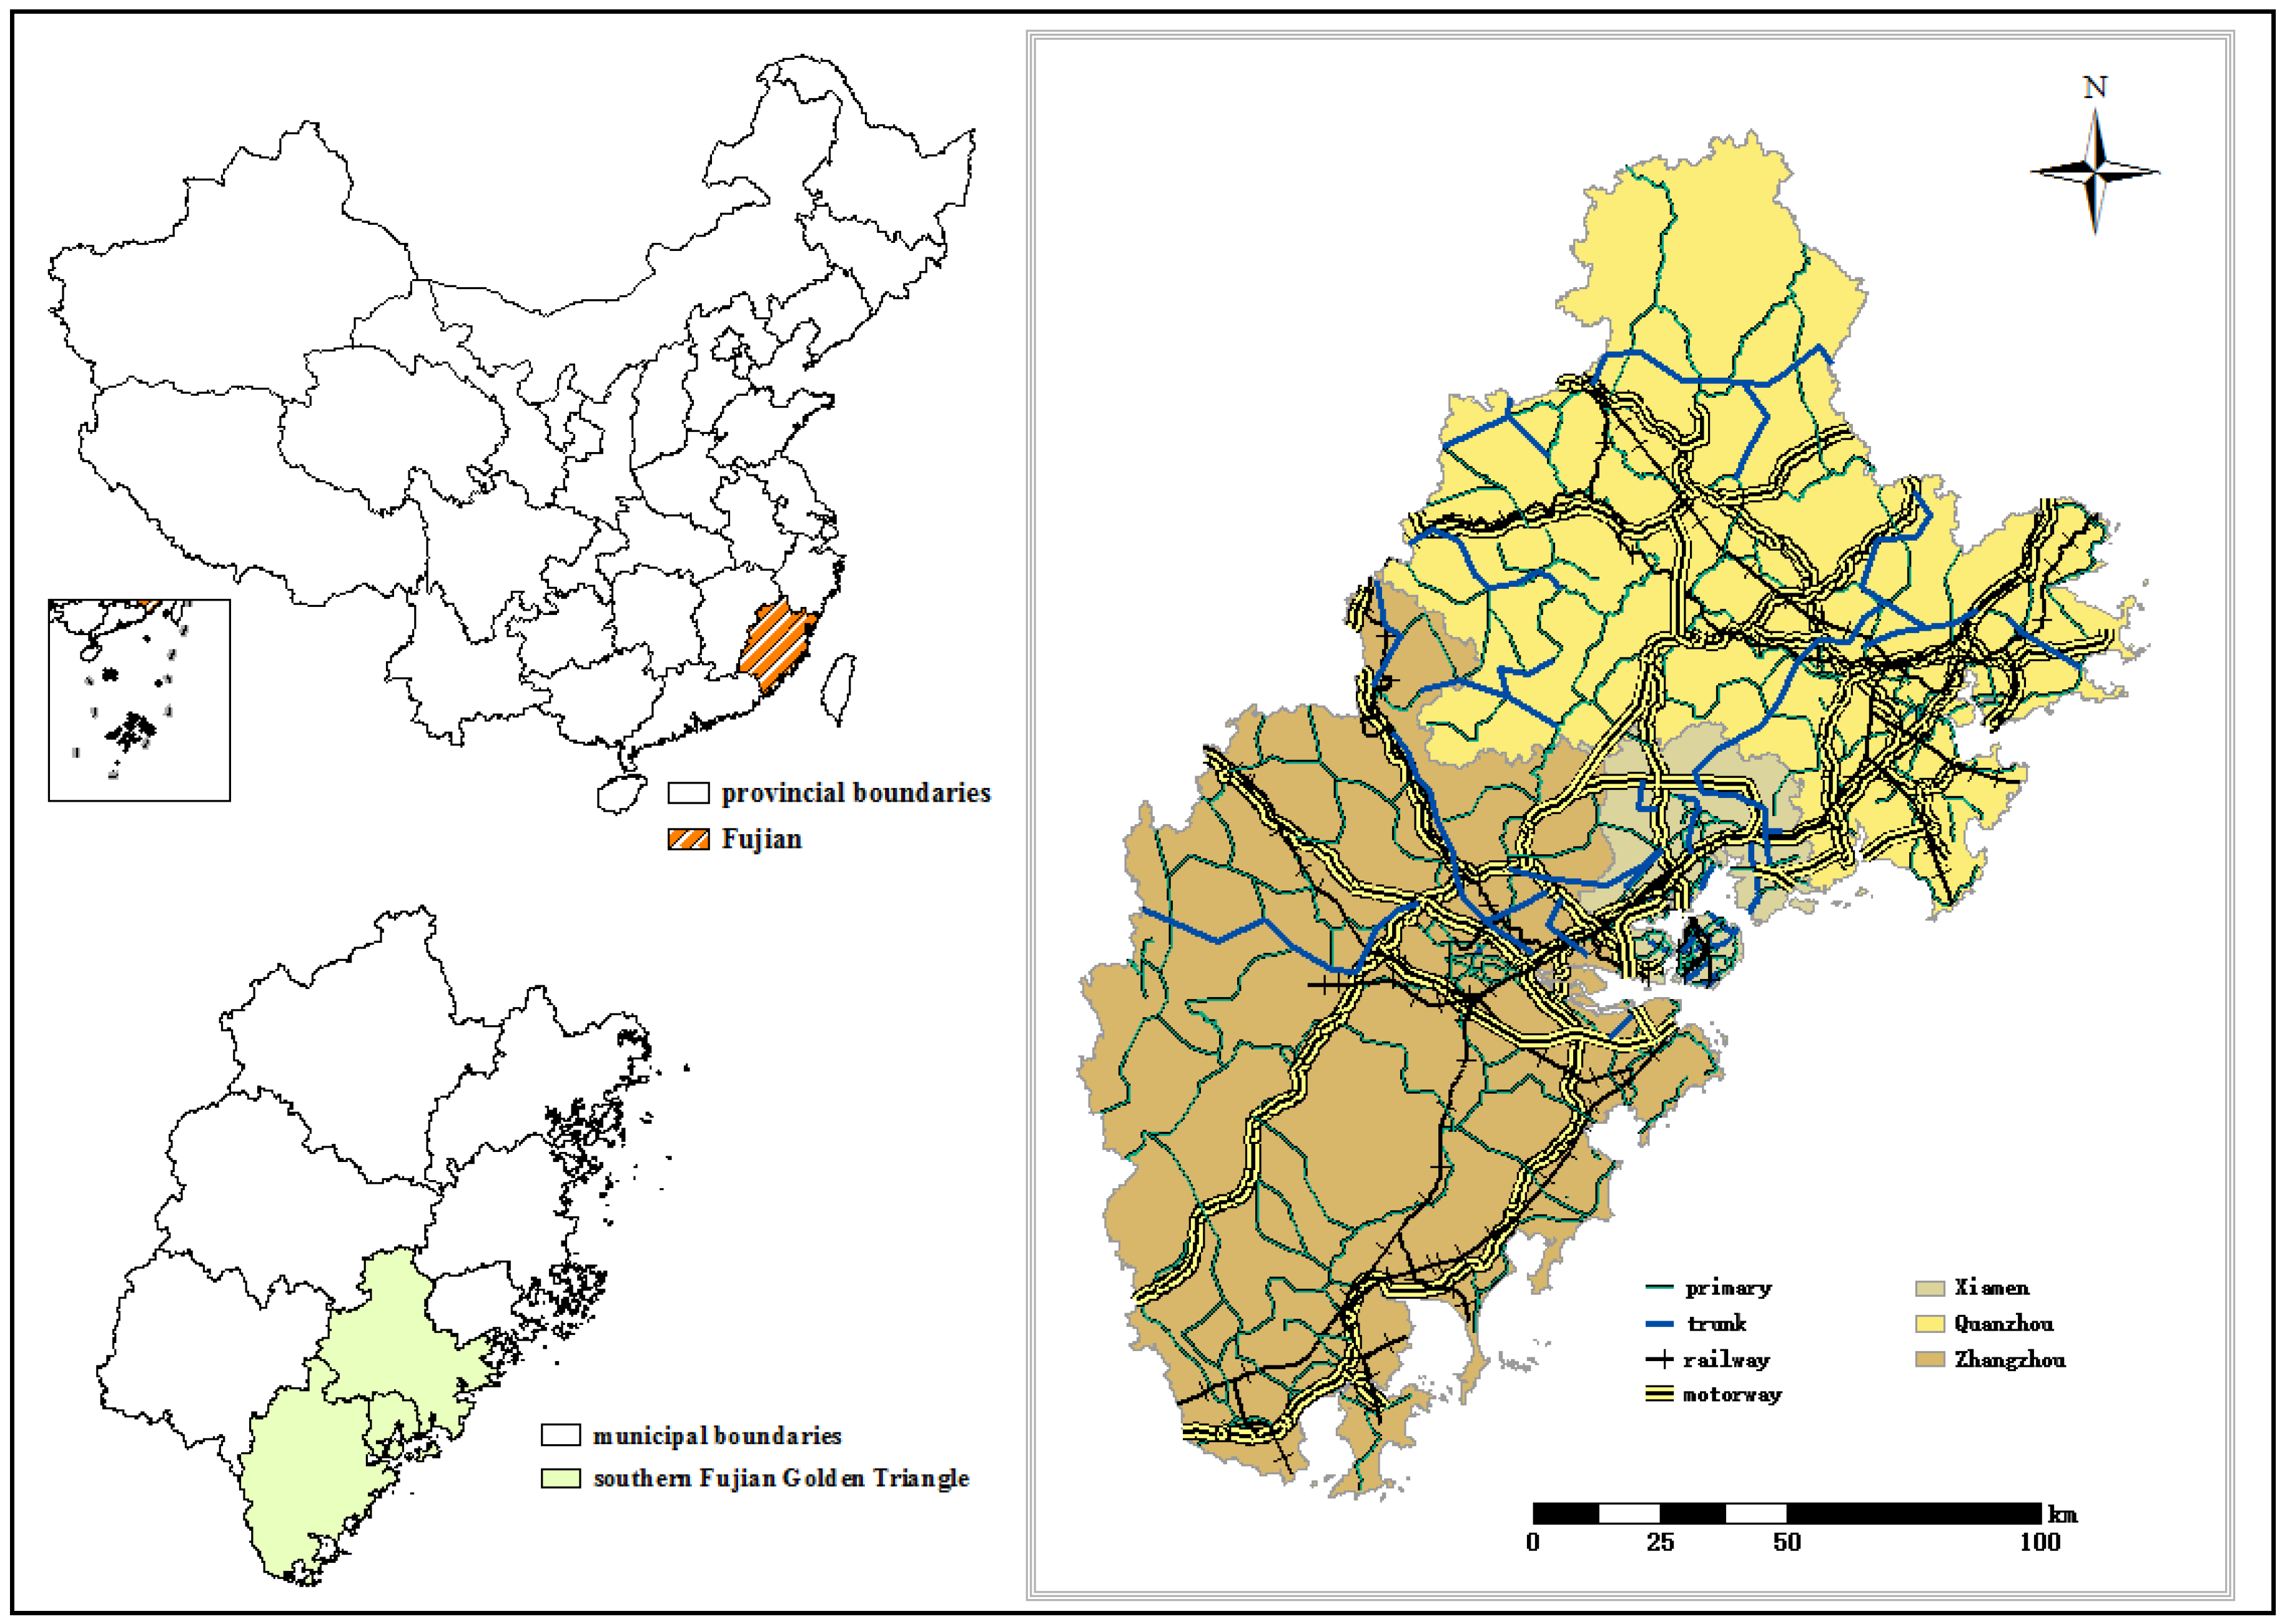
Transportation infrastructure distribution and the volume of annual surface runoff in the southern Fujian Golden Triangle is shown in
Figure 4. For 2030, predictions show that the average volume of annual surface runoff under actual conditions in Xiamen, Zhangzhou, and Quanzhou will be 317.13 m
3, 381.42 m
3, and 282.79 m
3, respectively. Compared to 2015, there is a significant increase in the volume of surface runoff in the samples with increased transportation infrastructure.
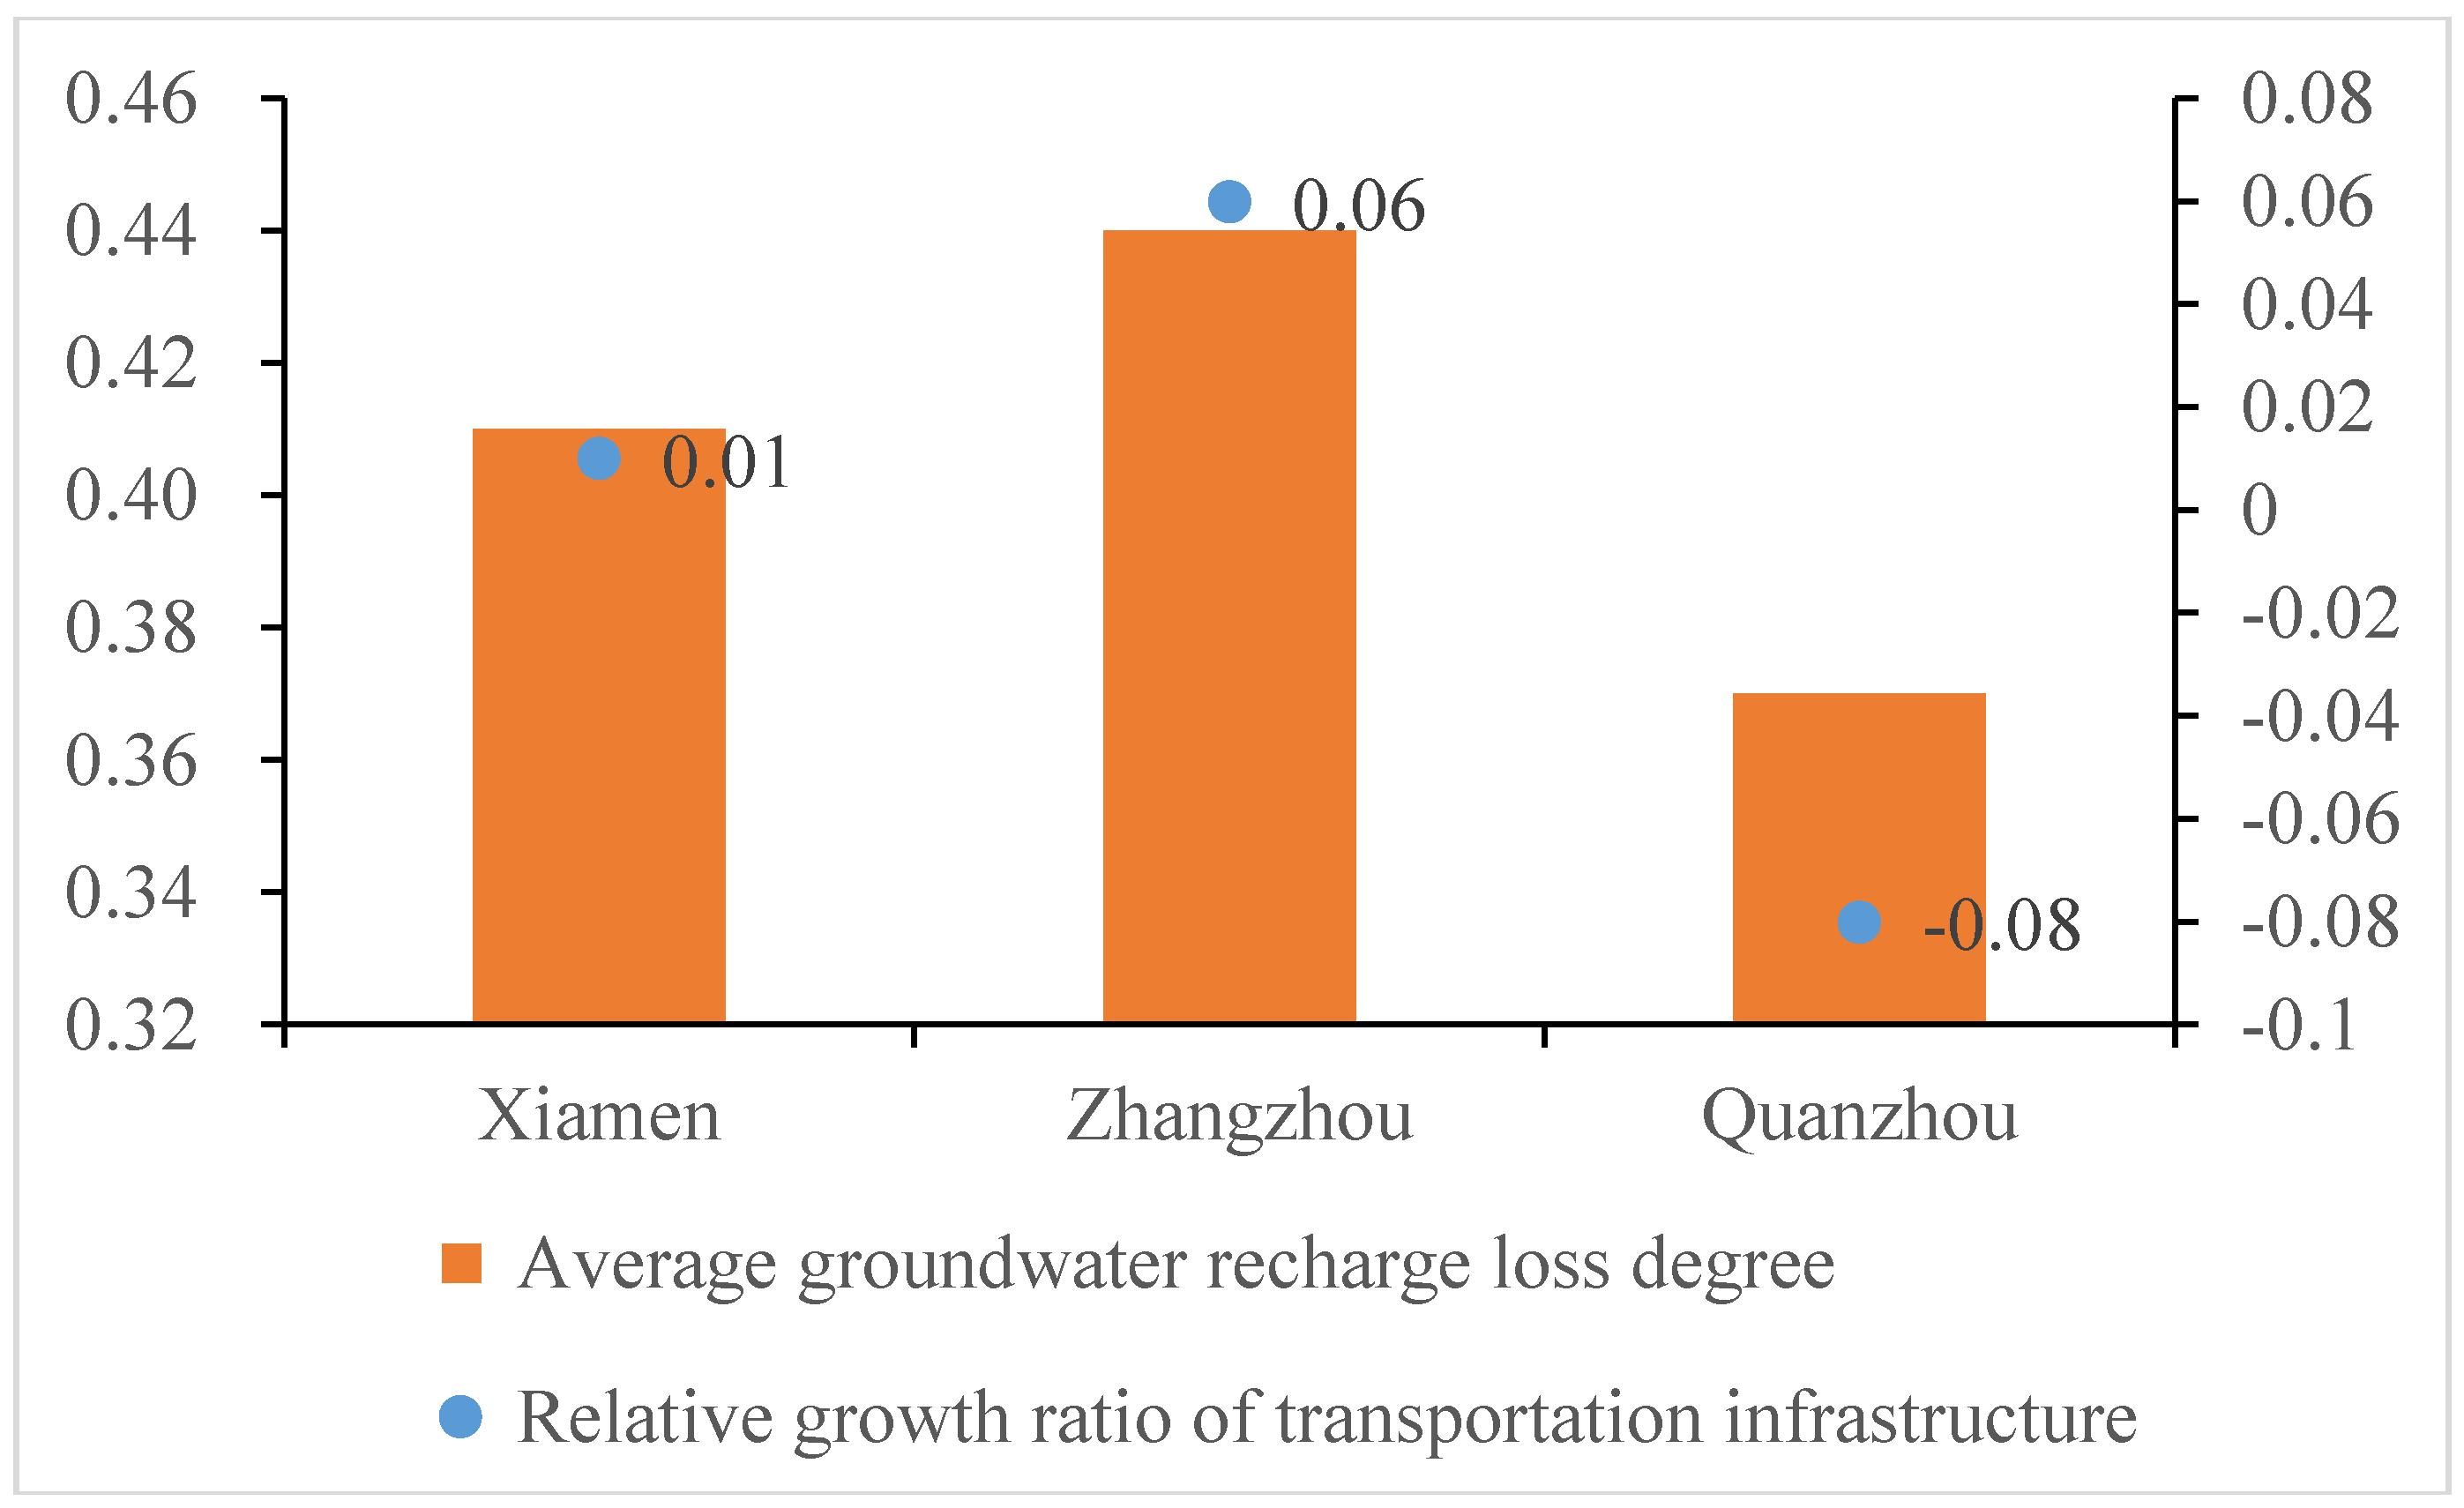
The assessment results in 2015 and the prediction results in 2030 showed that, under the stress of RTD, GRLD increased with the increase of pavement area. In 2030, the average GRLDs in Xiamen, Zhangzhou, and Quanzhou will be 0.41, 0.44, and 0.37, respectively (
Figure 5). The ratio of arterial road network growth in Xiamen City to the total arterial road network growth in the study area is higher than the ratio of railway. Zhangzhou City exhibits a similar pattern. In Quanzhou City, the ratio of railway growth to total railway growth is higher than the ratio of arterial road network.
The probability of the CN selection in 2030 is 0.94 and the probability of the interpolation process is 0.96, so the probability of the GRLD is 0.90. The risk uncertainty of RTD stress is 0.89, and is based on the historical experience of transportation system development of the southern Fujian Golden Triangle. Based on the multi-level risk characterization method, the ecological risk of urban agglomeration under RTD stress is shown in
Figure 6.
According to the equal interval method, the GRLD value is divided into five grades. Samples with both dense arterial roads and railways are in dark red and are of high value, while samples with low arterial road density show as light yellow and are of low value. The regions with high values largely overlapped areas of transportation hubs.
5. Discussion
By comparing the results of 2015 and 2030, we found that with the development of intercity railway facilities and highway networks, the urban agglomeration shows higher values of GRLD in the areas colored orange or deep red (
Figure 6). The GRLD value increases most in samples with increases in both arterial road and railway coverage. Samples with only arterial road growth place second, while the least change occurs in samples with only railway growth. The reason for this result is that railways are paved with gravel, and the width of the railway pavement in one direction is less than that of arterial roads.
Table 2 shows the difference among the three types of growth. Statistically significant differences are not indicated among the three groups, mainly because the increase in arterial road area is scattered throughout the study area.
Comparing the results of the three cities for 2030, the average GRLD in Quanzhou was the lowest; the highest was in Zhangzhou. Therefore, in the long term, the distribution characteristic of primary road networks promotes the distribution characteristics of GRLD value. Rapid development of the railway system in Quanzhou will not greatly enhance the average GRLD.
The ordinary Kriging interpolation method used in this study considered not only the spatial correlation of data points, but also provided a method to obtain the variance of probability. Based on the mountainous terrain in the southern Fujian Golden Triangle, clustering-assisted regression (CAR) interpolation proposed by Tang, et al. [
24] can be used to improve the probability of risk prediction by considering the influence of elevation. Based on the mechanisms underlying urban road network development, there are several main methods to simulate its evolution. Studies exploring the evolutionary law of road networks according to the characteristics of the network structure and dynamics, and the characteristics of network nodes, share an error range of 0 to 20% of most indexes used in road network assessments [
25]. Some researchers take the relationship between the intensity of land use change and road network density to invert the urban road growth and expansion model (URGS) [
26]. The method of predicting transportation infrastructure development based on government planning documents used in this study also included the history of regional coordination. This method works well with the land use situation of southern Fujian Golden Triangle, and it has strong regional applicability.
Considering the spatial possibility, managers should give priority to the samples with high GRLD value, and develop a proper railway system and arterial road network to reduce ecological risk. For the year of prediction, the risk manager should establish an acceptable probability threshold based on demand. If the predicted value of the GRLD is higher than the threshold, the overall transportation development plan should be revised.
6. Conclusions
Based on the southern Fujian Golden Triangle, this study proposes a method of ecological risk assessment-simulation-prediction, based on water regulation as the assessment endpoint for urban agglomeration under the stress of RTD. Both the arterial roads and railway system of an urban agglomeration are important transportation facilities between cities, so both were considered in this study. The multi-level risk characterization method used in this study emphasizes the definition of “risk”, including both the probability and intensity of negative ecological effects. This promotes a scientific approach to urban agglomeration risk management. Based on the current RTD plan, the ecological risk assessment with water regulation as the assessment endpoint shows that there is a probability of 0.90 that the risk distribution results will occur by 2030, and that Zhangzhou City has the highest risk intensity. The stress intensity of arterial roads to the urban agglomeration ecosystem is greater than that of the railway system. The method proposed here provides a basis for decision-makers in the planning stages of RTD to give priority to the development of the railway network system, since it has relatively lower stress intensity and higher transport capacity than that of highways.


