Bi-Objective Optimization Model Based on Profit and CO2 Emissions for Pig Deliveries to the Abattoir


Abstract
:1. Introduction
- RQ1: Is the inclusion of CO emissions penalizing optimal decisions regarding the delivery of fattened pig to the abattoir?
- RQ2: What is a reasonable margin of profit reduction in favor of a greener production?
- RQ3: Are the policy of deliveries to the abattoir affected by the inclusion of CO emissions?
- RQ4: Is there room for additional gains in reducing CO reduction preserving pig production efficiency?
2. Literature Review
3. Mathematical Modeling
3.1. The Optimal Delivery Problem
3.2. The Optimization Model
3.2.1. Indices and Sets
- t ∈ T,
- Index (in weeks) the fattening period is divided into, .
- i ∈ P,
- Index of partitions to cluster pigs into growth categories .
- k ∈ K,
- Index of types of truck .
3.2.2. Parameters
- N,
- Batch size representing the number of pigs moved to the fattening farms.
- ni,
- Cluster of growth category i, in which the initial batch was partitioned.
- ,
- Mean value of the live weight of pigs (kg) in the growth category i at week t. We assume the live weight of the batch follows a normal distribution, ).
- ω,
- Selling price, € per kg of carcass weight.
- ,
- Cumulative feed intake average (kg) by a pig in growth category i until week t.
- ,
- Bonus given by the abattoir (€/kg of carcass weight) as a function of growth category i at week t.
- δ,
- cost in Euros per kg of feed intake.
- λk,
- Fixed cost in Euros for trucks of type k sent to the abattoir.
- αi,
- Cost in Euros for other expenses in the system for growth category i, such as vets and medicines.
- ξ,
- Cost in Euros per young pig purchased.
- ψk,
- Capacity of trucks of type k in number of animals.
- τk,
- Capacity of trucks of type k in kilograms of load.
- ϱit,
- Carcass weight per growth category i at week t.
- κ,
- kg CO -eq per kg of meat produced.
- v,
- Euros per kg of CO .
- γk,
- Emissions kg CO per trip and k-truck type
- φ,
- Weight for the bi-objective function ().
3.2.3. Decision Variables
- xit,
- Number of pigs from partition i to be sent to the abattoir in fattening week t.
- ykt,
- Integer variable with the number of trucks of type k needed at week t to ship pigs.
- zit,
- Inventory of pigs for partition i at the beginning of the fattening week t.
- hit,
- Binary variable with a value of one when pigs from two consecutive partitions (, i) are sent to the abattoir, zero otherwise.
- dit,
- Binary variable with a value of one when pigs from partition i at week t are sent to the abattoir, zero otherwise.
- wit,
- Live weight when animals are sent to abattoir.
3.2.4. Objective Function
3.2.5. Constraints
4. Results and Discussion
4.1. Default Parameters
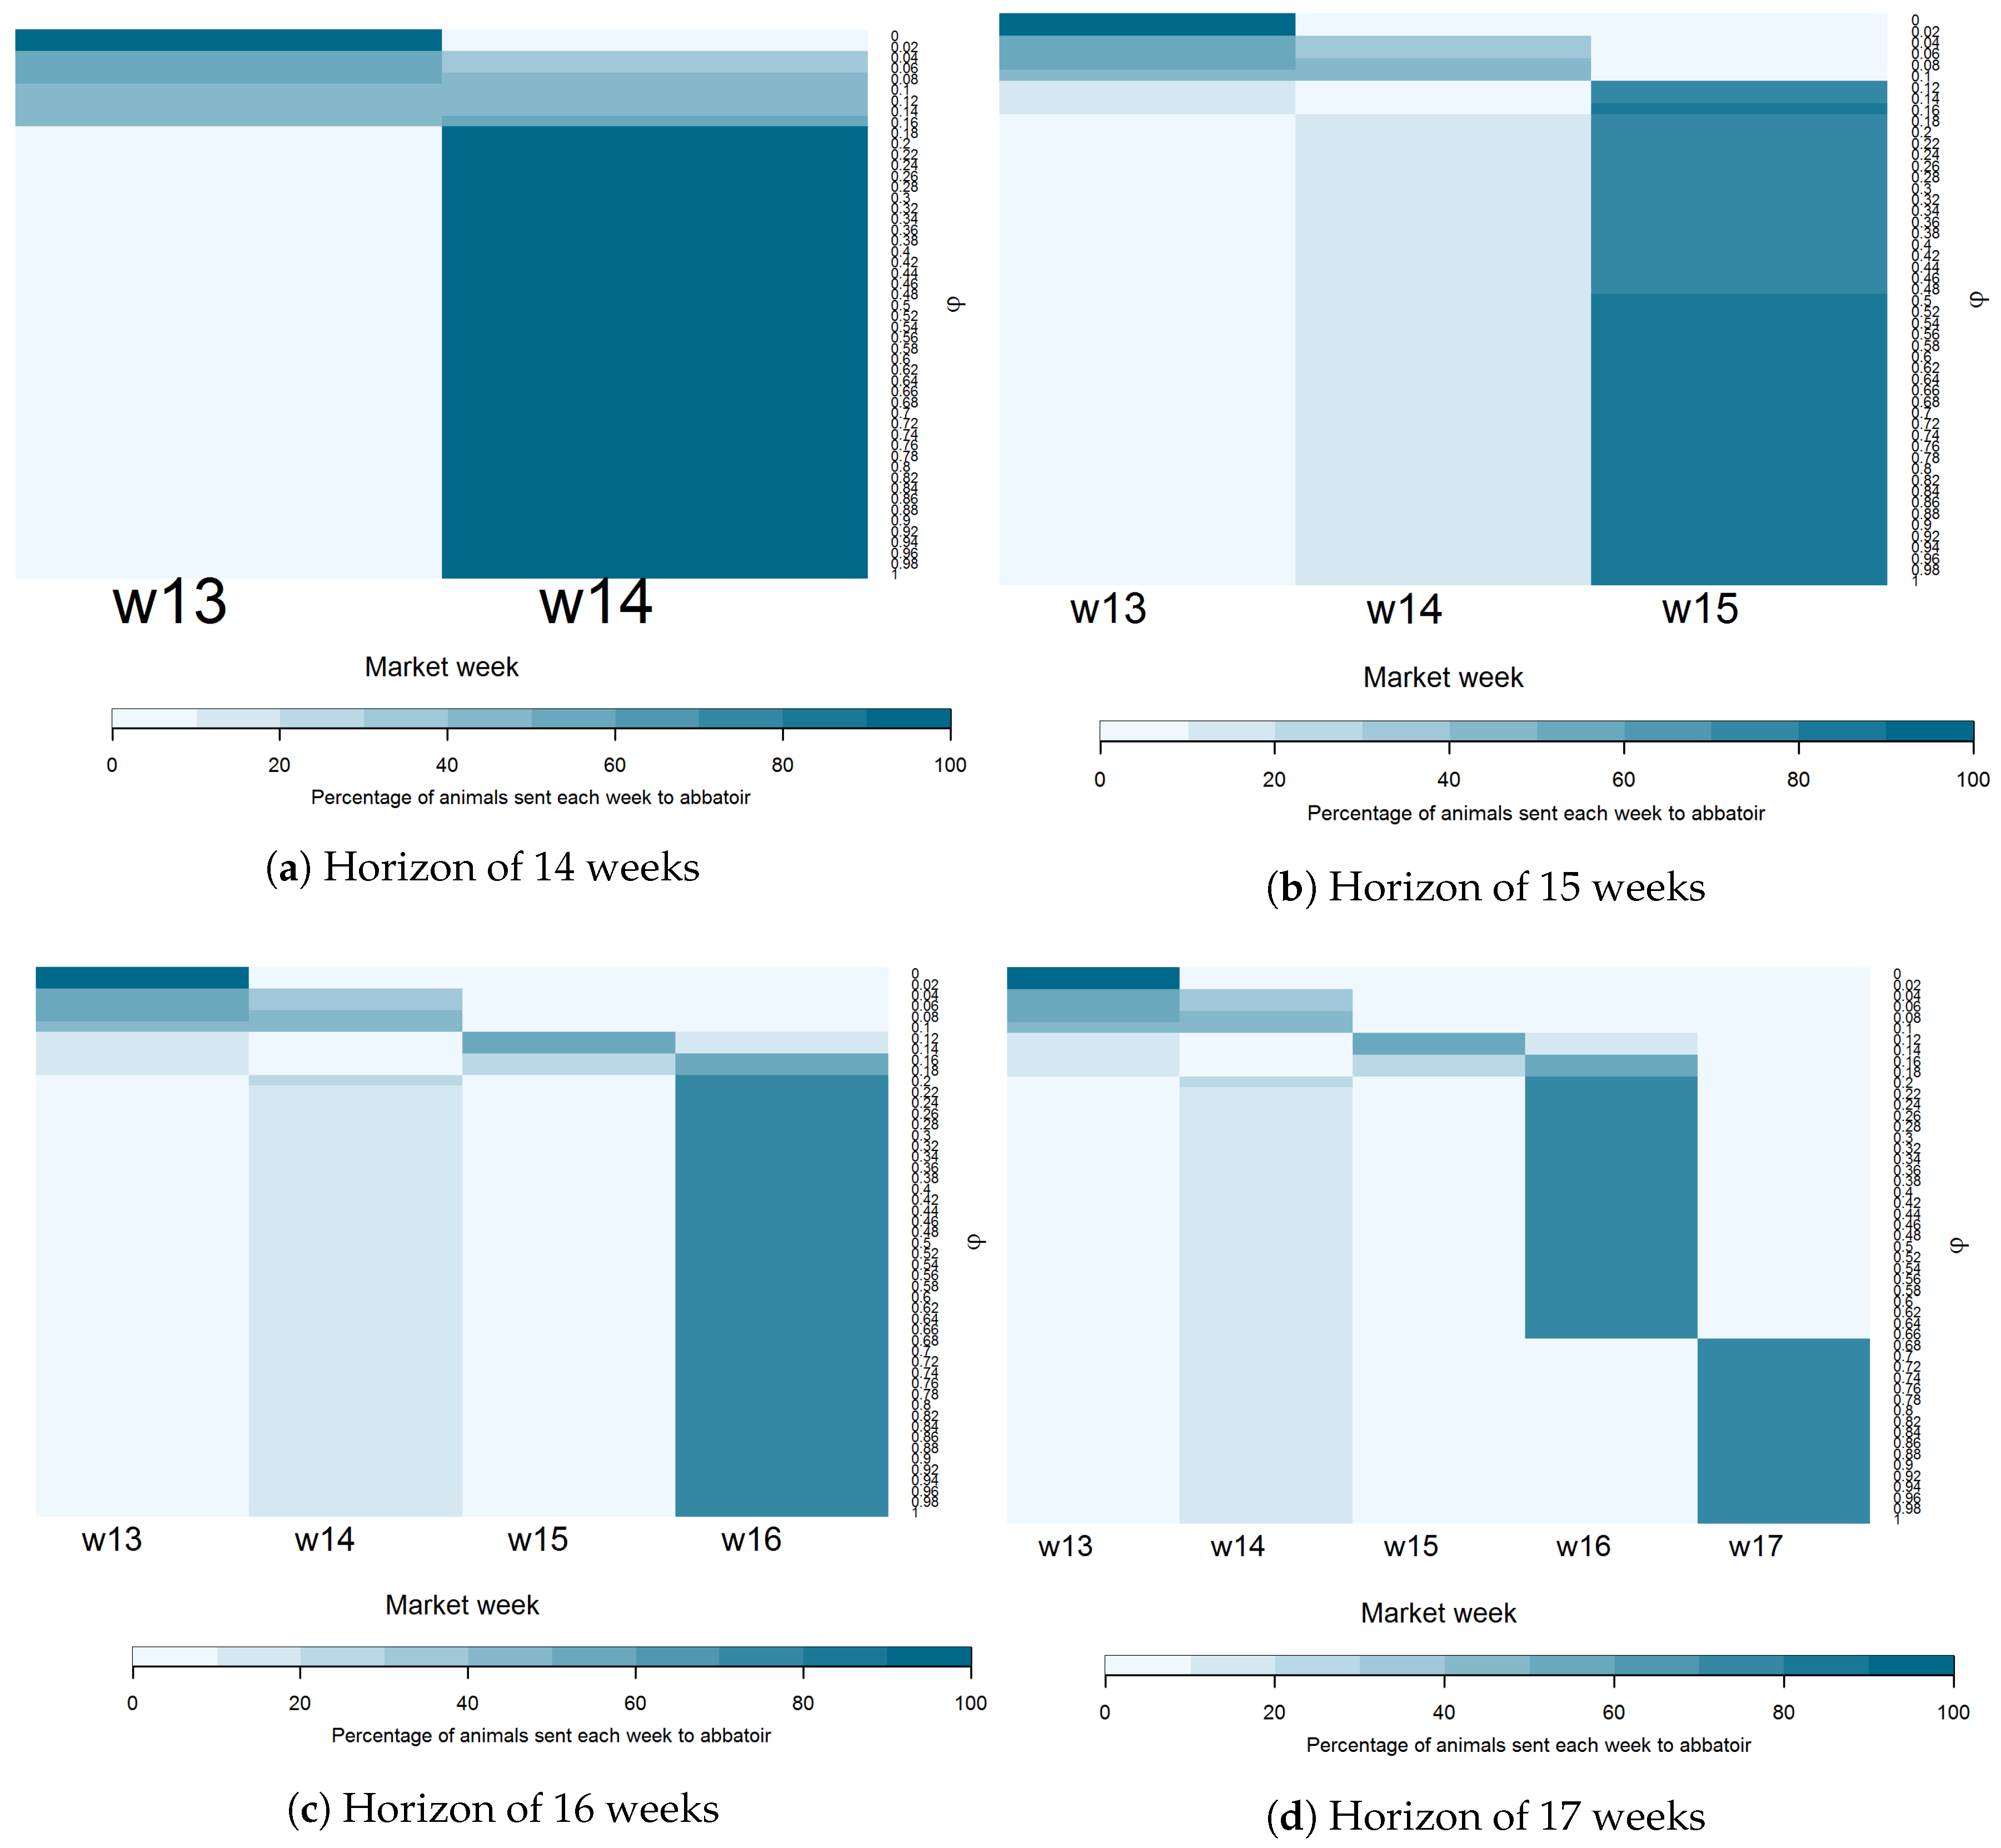
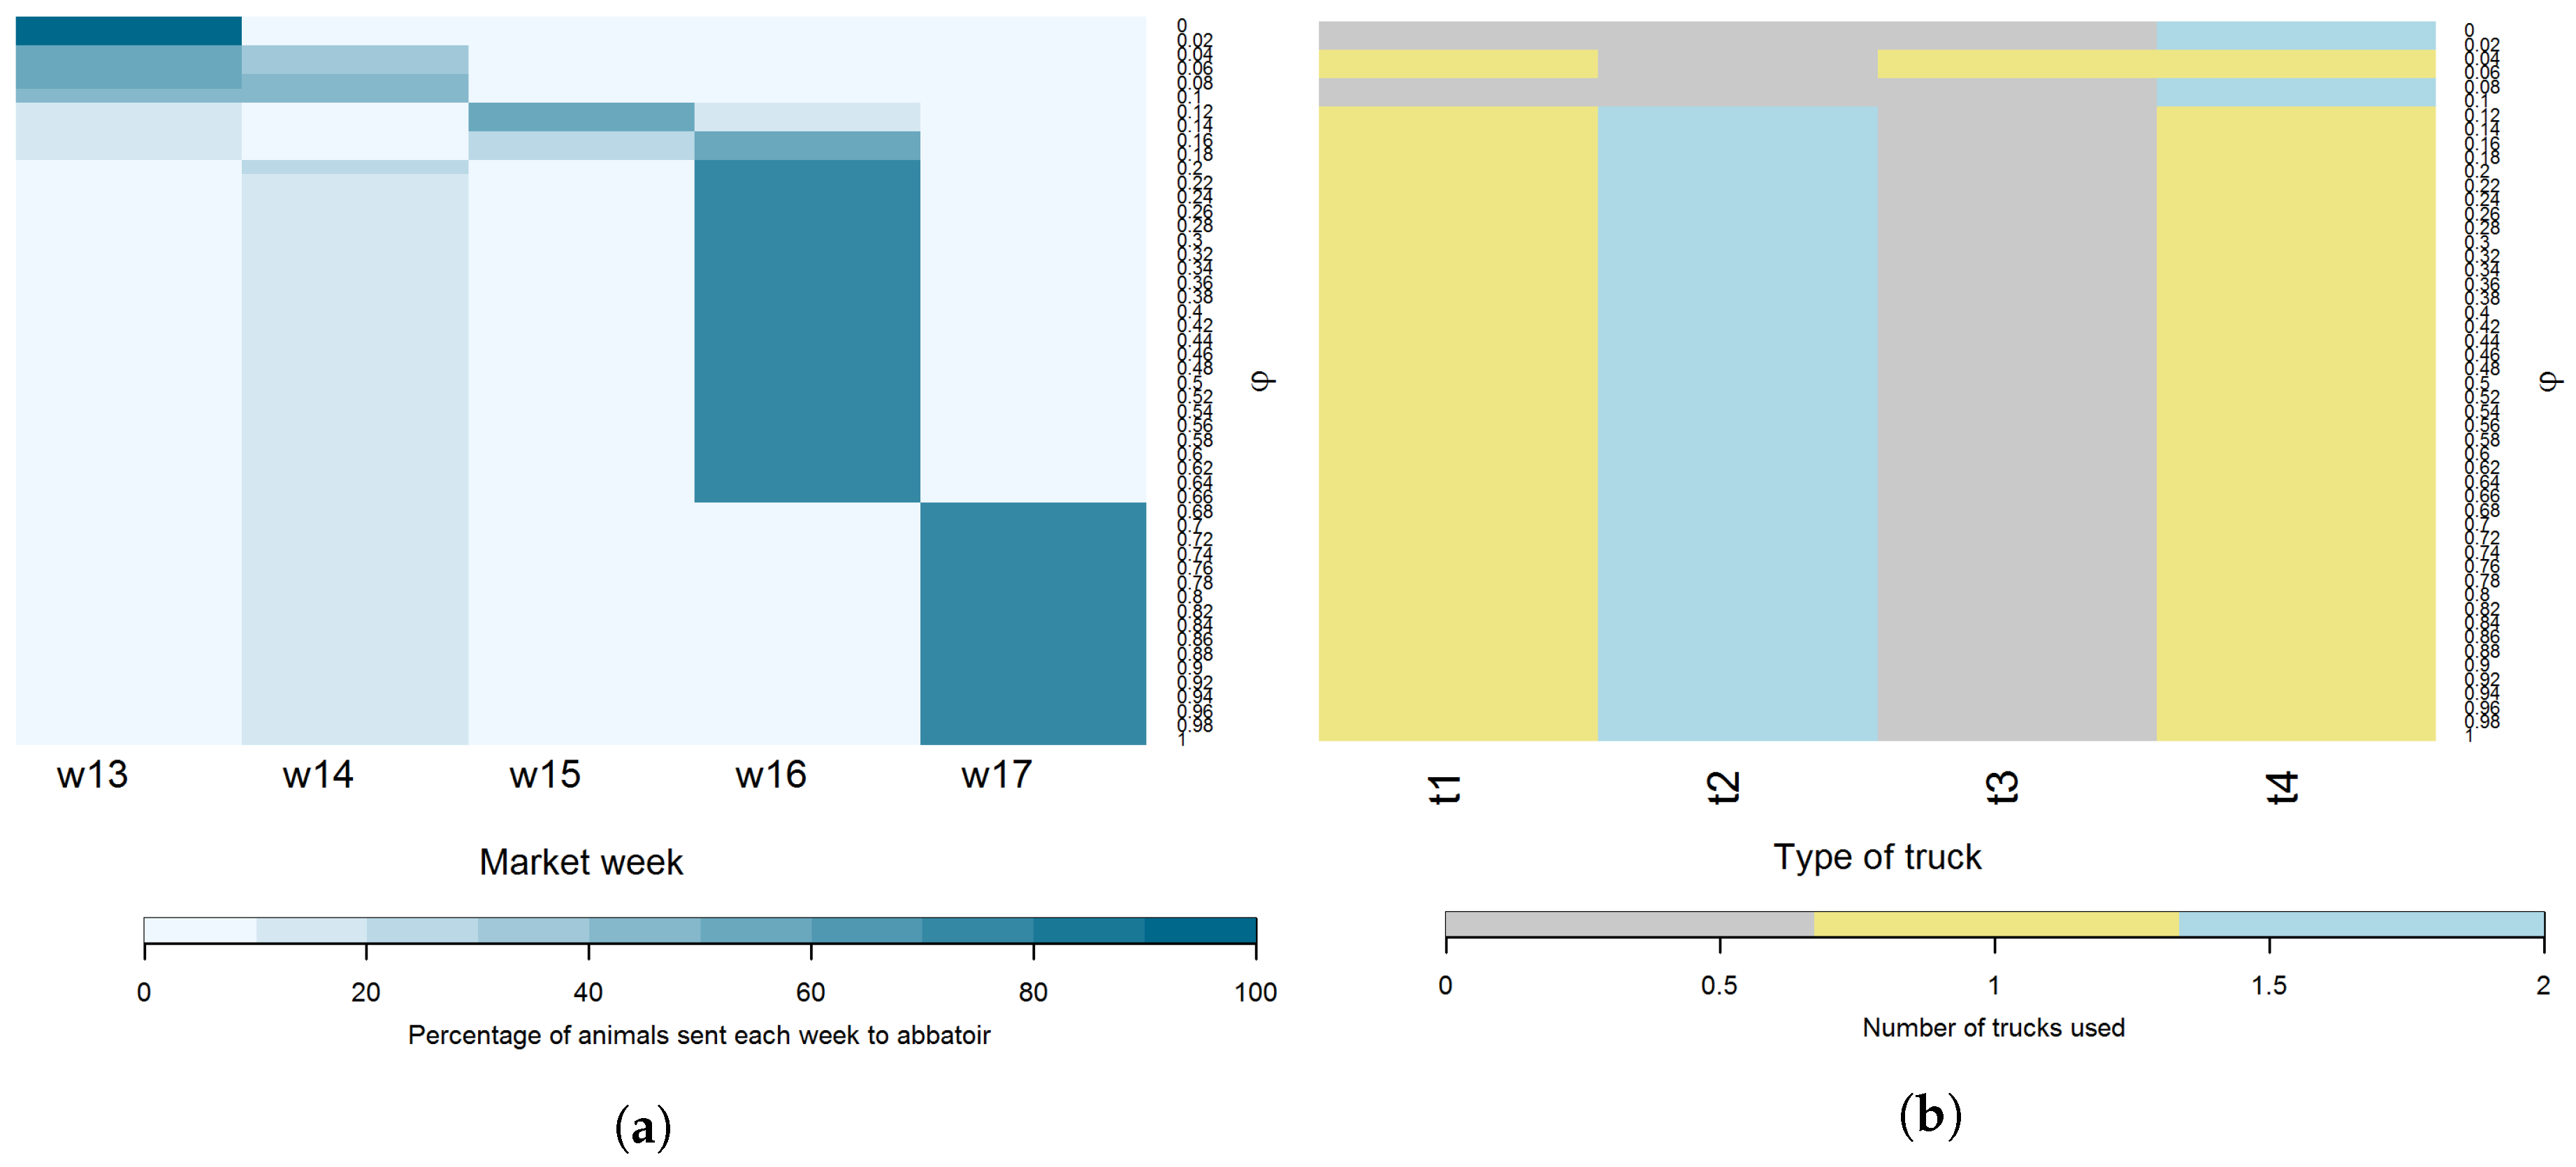
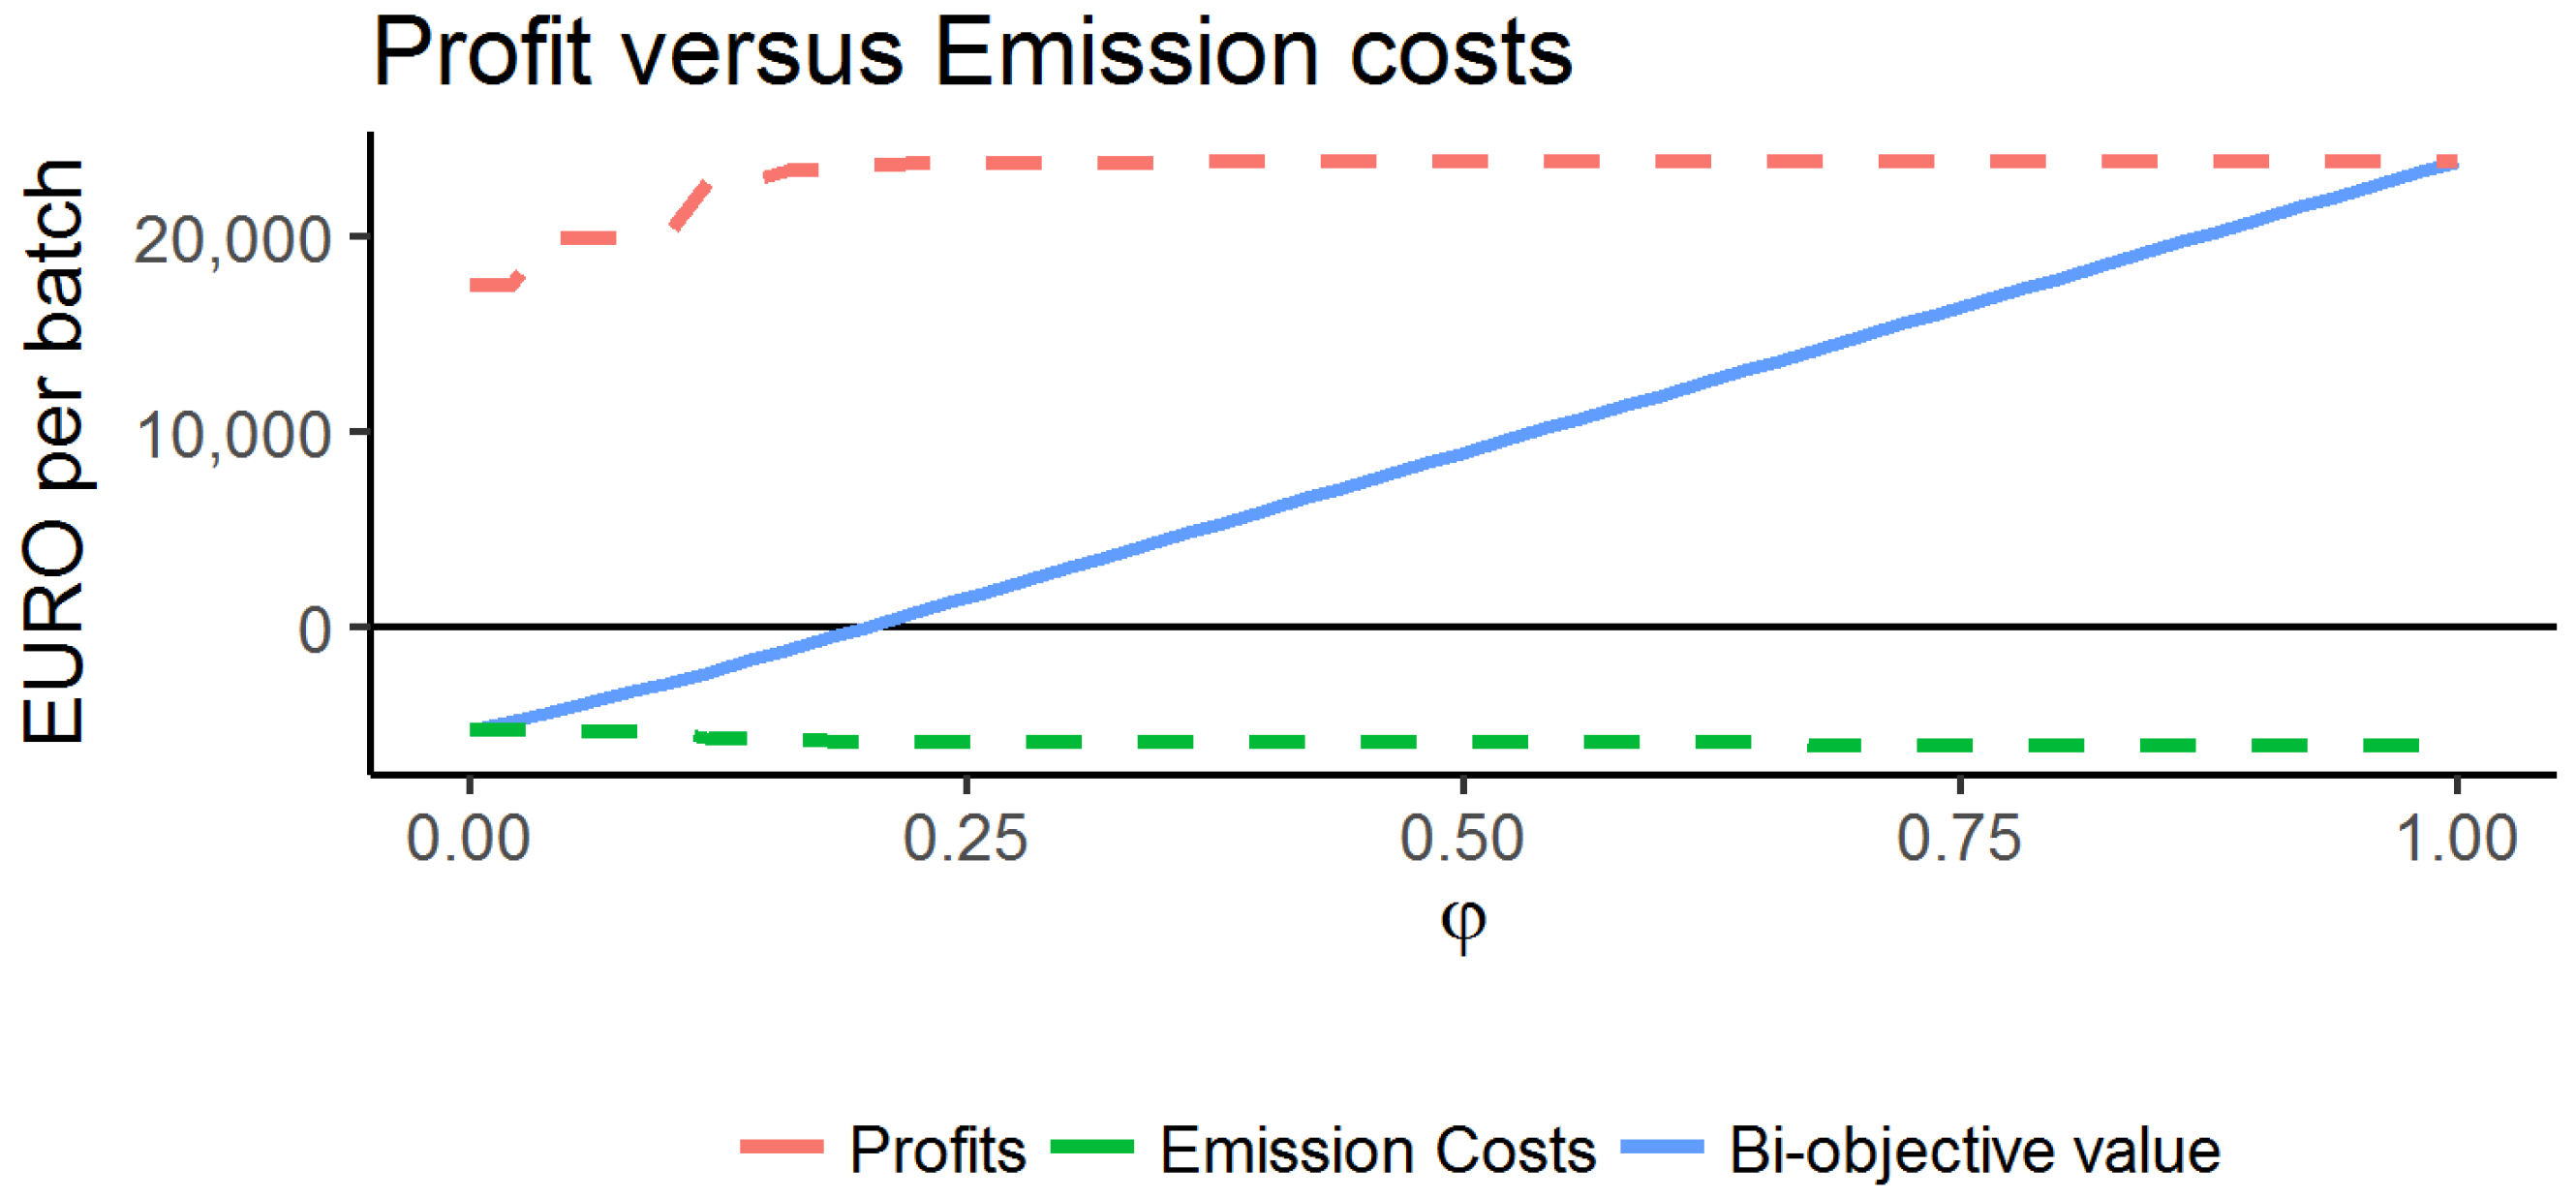
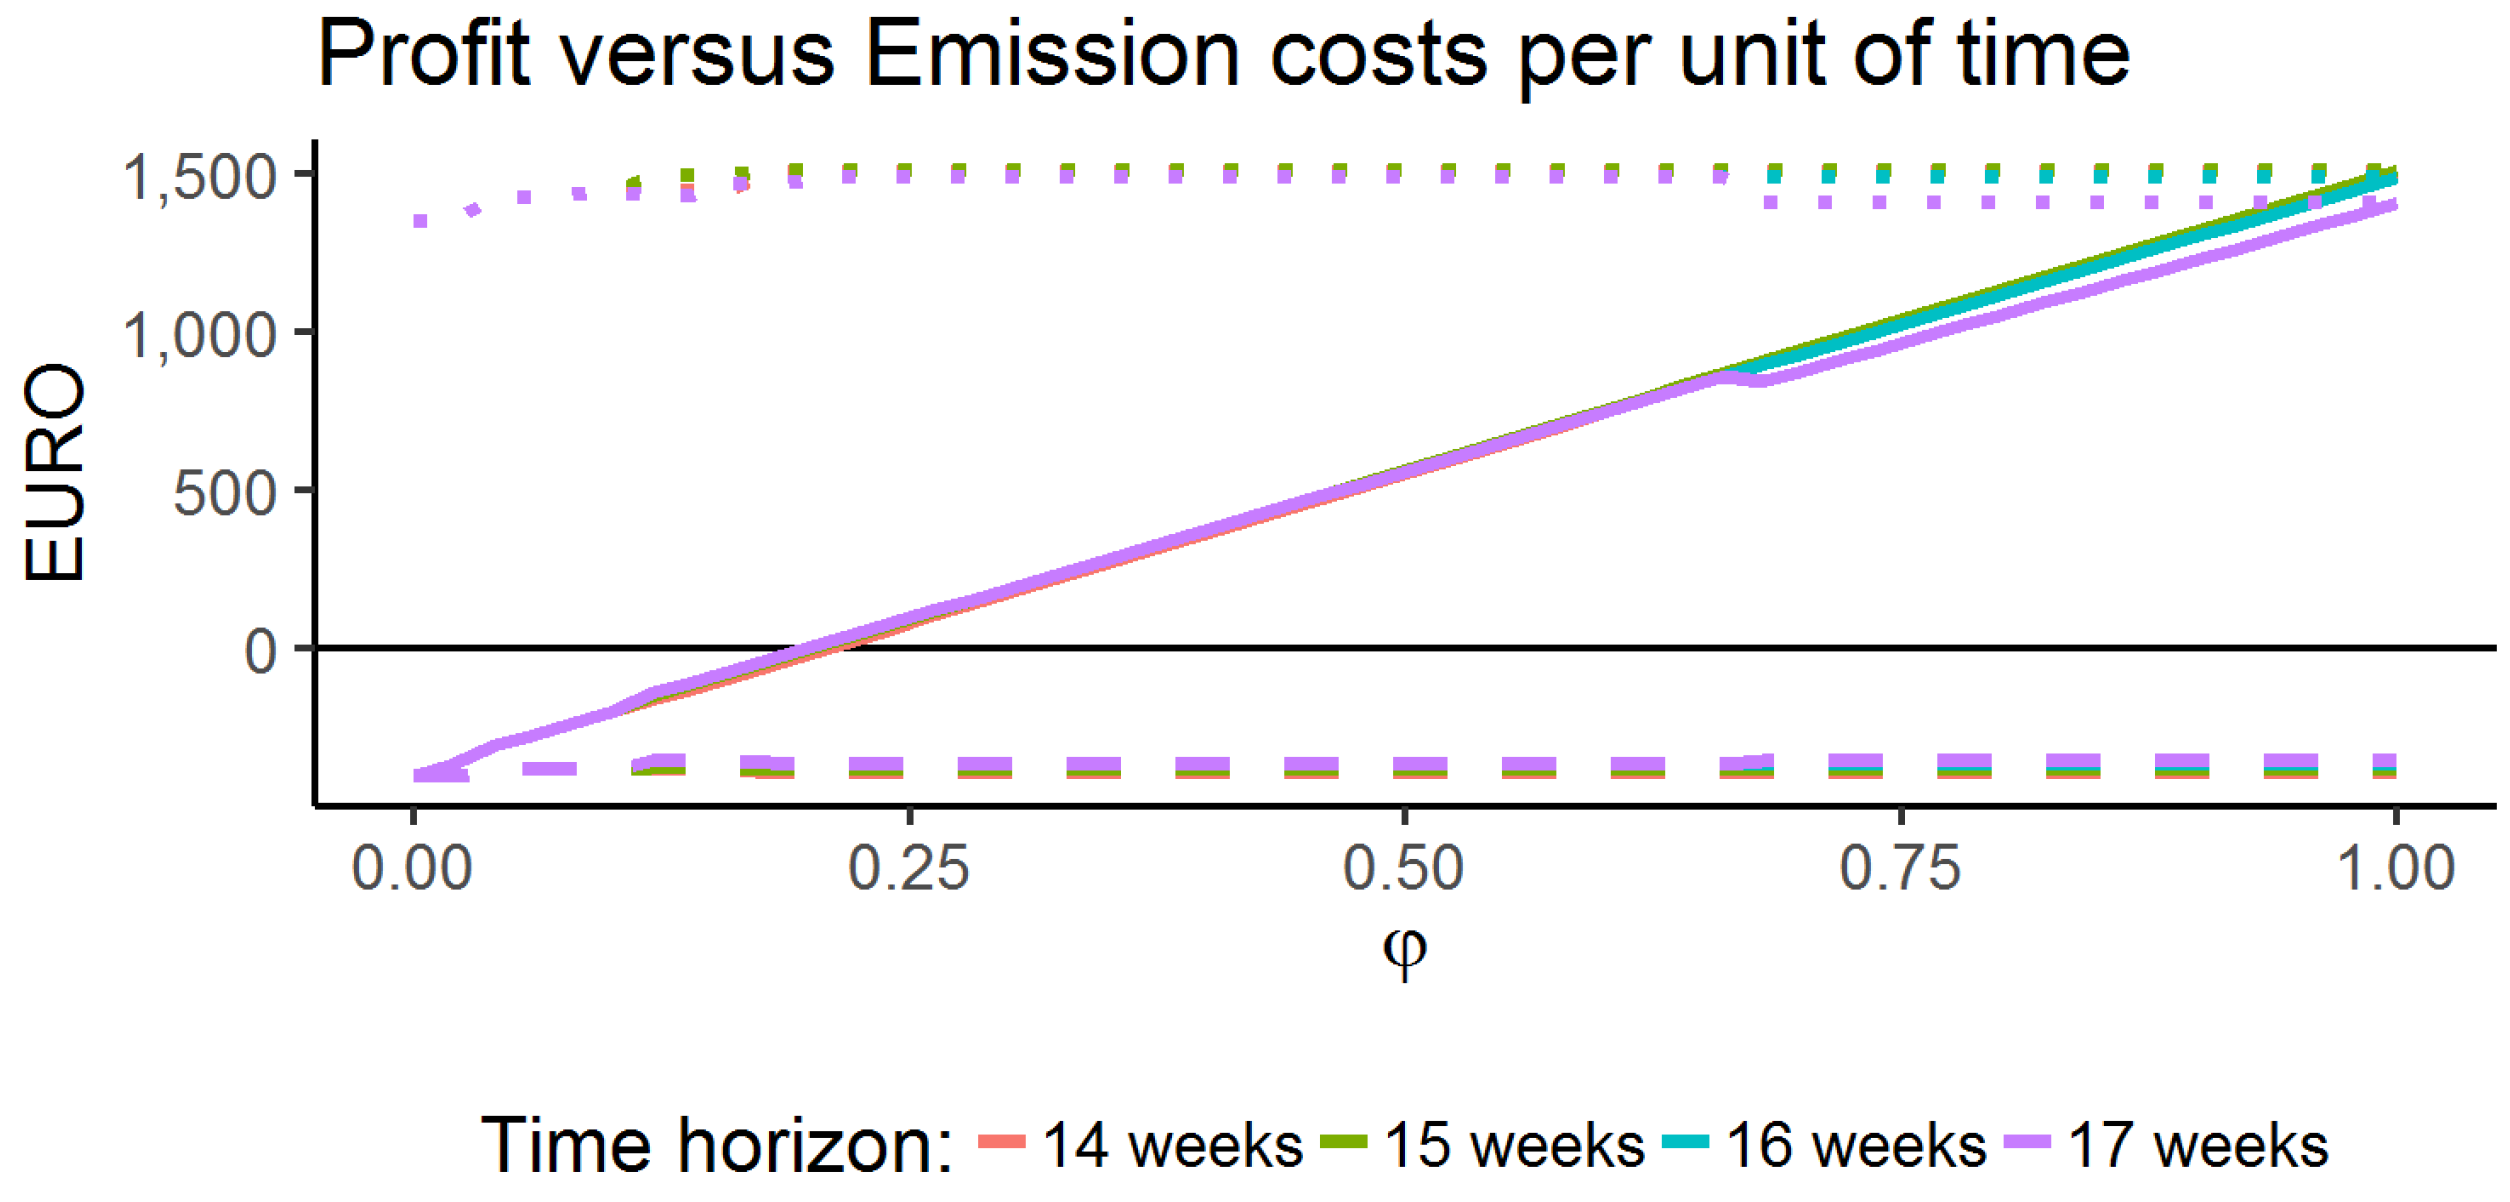
4.2. Maximizing Revenues and Minimizing CO Emissions
5. Conclusions
Author Contributions
Funding
Acknowledgments
Conflicts of Interest
References
- Rodríguez, S.V.; Plà, L.M.; Faulin, J. New opportunities in operations research to improve pork supply chain efficiency. Ann. Oper. Res. 2014, 219, 5–23. [Google Scholar] [CrossRef]
- Petit, G.; Sablayrolles, C.; Yannou-Le Bris, G. Combining eco-social and environmental indicators to assess the sustainability performance of a food value chain: A case study. J. Clean. Prod. 2018, 191, 135–143. [Google Scholar] [CrossRef]
- Vorst, J.G.; da Silva, C.A.; Trienekens, J. Agro-Industrial Supply Chain Management: Concepts and Applications; Agricultural Management, Marketing and Finance Occasional Paper; Food and Agriculture Organization of the United Nations: Rome, Italy, 2007; Volume 17. [Google Scholar]
- Rodríguez-Sánchez, S.V.; Plà-Aragonés, L.M.; Albornoz, V.M. Modeling tactical planning decisions through a linear optimization model in sow farms. Livest. Sci. 2012, 143, 162–171. [Google Scholar] [CrossRef]
- Perez, C.; Castro, R.D.; Furnols, M.F.I. The pork industry: A supply chain perspective. Br. Food J. 2009, 111, 257–274. [Google Scholar] [CrossRef]
- Lamnatou, C.; Ezcurra-Ciaurriz, X.; Chemisana, D.; Plà-Aragonés, L.M. Environmental assessment of a pork-production system in North-East of Spain focusing on life-cycle swine nutrition. J. Clean. Prod. 2016, 137, 105–115. [Google Scholar] [CrossRef]
- Ohlmann, J.; Jones, P. An integer programming model for optimal pork marketing. Ann. Oper. Res. 2011, 190, 271–287. [Google Scholar] [CrossRef]
- Rodriguez-Sanchez, S.; Pla-Aragones, L.M.; de Castro, R. Insights to Optimise Marketing Decisions on Pig Fattening Farms. Anim. Prod. Sci. 2018, in press. [Google Scholar]
- Plà-Aragonés, L.M.; Rodríguez-Sánchez, S.V.; Rebillas-loredo, V. A mixed integer linear programming model for optimal delivery of fattened pigs to the abattoir. J. Appl. Oper. Res. 2013, 5, 164–175. [Google Scholar]
- Balogh, P.; Ertsey, I.; Fenyves, V.; Nagy, L. Analysis and optimization regarding the activity of a Hungarian Pig sales and Purchased Cooperation. Stud. Agric. Econ. 2009, 109, 35–54. [Google Scholar]
- Nadal-Roig, E.; Plà, L.M. Multiperiod planning tool for multisite pig production systems. J. Anim. Sci. 2014, 92, 4154–4160. [Google Scholar] [CrossRef] [PubMed]
- Khamjan, S.; Piewthongngam, K.; Pathumnakul, S. Pig procurement plan considering pig growth and size distribution. Comput. Ind. Eng. 2013, 64, 886–894. [Google Scholar] [CrossRef]
- Kristensen, A.R.; Nielsen, L.; Nielsen, M.S. Optimal slaughter pig marketing with emphasis on information from on-line live weight assessment. Livest. Sci. 2012, 145, 95–108. [Google Scholar] [CrossRef]
- Pourmoayed, R.; Nielsen, L.R.; Kristensen, A.R. A hierarchical Markov decision process modeling feeding and marketing decisions of growing pigs. Eur. J. Oper. Res. 2016, 250, 925–938. [Google Scholar] [CrossRef]
- Li, N.; Preckel, P.V.; Foster, K.A.; Schinckel, A.P. Analysis of economically optimal nutrition and marketing strategies for Paylean® usage in hog production. J. Agric. Resour. Econ. 2003, 28, 272–286. [Google Scholar]
- McAuliffe, G.A.; Chapman, D.V.; Sage, C.L. A thematic review of life cycle assessment (LCA) applied to pig production. Environ. Impact Assess. Rev. 2016, 56, 12–22. [Google Scholar] [CrossRef]
- Notarnicola, B.; Sala, S.; Anton, A.; McLaren, S.J.; Saouter, E.; Sonesson, U. The role of life cycle assessment in supporting sustainable agri-food systems: A review of the challenges. J. Clean. Prod. 2017, 140, 399–409. [Google Scholar] [CrossRef]
- Nguyen, T.L.T.; Hermansen, J.E.; Mogensen, L. Fossil energy and GHG saving potentials of pig farming in the EU. Energy Policy 2010, 38, 2561–2571. [Google Scholar] [CrossRef]
- Van Der Werf, H.M.; Petit, J.; Sanders, J. The environmental impacts of the production of concentrated feed: The case of pig feed in Bretagne. Agric. Syst. 2005, 83, 153–177. [Google Scholar] [CrossRef]
- Reckmann, K.; Traulsen, I.; Krieter, J. Life Cycle Assessment of pork production: A data inventory for the case of Germany. Livest. Sci. 2013, 157, 586–596. [Google Scholar] [CrossRef]
- Röös, E.; Sundberg, C.; Tidåker, P.; Strid, I.; Hansson, P.A. Can carbon footprint serve as an indicator of the environmental impact of meat production? Ecol. Indic. 2013, 24, 573–581. [Google Scholar] [CrossRef]
- Basset-Mens, C.; Van Der Werf, H.M. Scenario-based environmental assessment of farming systems: The case of pig production in France. Agric. Ecosyst. Environ. 2005, 105, 127–144. [Google Scholar] [CrossRef]
- Eriksson, I.S.; Elmquist, H.; Stern, S.; Nybrant, T. Environmental systems analysis of pig production—The impact of feed choice. Int. J. Life Cycle Assess. 2005, 10, 143–154. [Google Scholar] [CrossRef]
- Sasu-Boakye, Y.; Cederberg, C.; Wirsenius, S. Localising livestock protein feed production and the impact on land use and greenhouse gas emissions. Anim. Int. J. Anim. Biosci. 2014, 8, 1339–1348. [Google Scholar] [CrossRef] [PubMed]
- González-García, S.; Belo, S.; Dias, A.C.; Rodrigues, J.V.; Costa, R.R.D.; Ferreira, A.; Andrade, L.P.D.; Arroja, L. Life cycle assessment of pigmeat production: Portuguese case study and proposal of improvement options. J. Clean. Prod. 2015, 100, 126–139. [Google Scholar] [CrossRef]
- Dalgaard, R.; Halberg, N.; Hermansen, J. Danish Pork Production: An Environmental Assessment. DJF Anim. Sci. 2007, 82, 1–34. [Google Scholar]
- Dourmad, J.Y.; Ryschawy, J.; Trousson, T.; Bonneau, M.; Gonzalez, J.; Houwers, H.W.J.; Hviid, M.; Zimmer, C.; Nguyen, T.L.T.; Morgensen, L. Evaluating environmental impacts of contrasting pig farming systems with life cycle assessment. Anim. Int. J. Anim. Biosci. 2014, 8, 2027–2037. [Google Scholar] [CrossRef] [PubMed]
- De Miguel, Á.; Hoekstra, A.Y.; García-Calvo, E. Sustainability of the water footprint of the Spanish pork industry. Ecol. Indic. 2015, 57, 465–474. [Google Scholar] [CrossRef]
- Bava, L.; Zucali, M.; Sandrucci, A.; Tamburini, A. Environmental impact of the typical heavy pig production in Italy. J. Clean. Prod. 2017, 140, 685–691. [Google Scholar] [CrossRef]
- Noya, I.; Aldea, X.; Gasol, C.M.; González-García, S.; Amores, M.J.; Colón, J.; Ponsá, S.; Roman, I.; Rubio, M.A.; Casas, E.; et al. Carbon and water footprint of pork supply chain in Catalonia: From feed to final products. J. Environ. Manag. 2016, 171, 133–143. [Google Scholar] [CrossRef] [PubMed]
- Espagnol, S.; Demartini, J. Environmental impacts of extensive outdoor pig production systems in Corsica. In Proceedings of the 9th International Conference on Life Cycle Assessment in the Agri-Food Sector (LCA Food 2014), San Francisco, CA, USA, 8–10 October 2014; pp. 364–371. [Google Scholar]
- Grupo de gestión porcina Departamento de Producción Animal, U. L’ Observatori del Porcí, Annual Report. 2015. Available online: http://agricultura.gencat.cat/web/.content/de_departament/de02_estadistiques_observatoris/08_observatoris_sectorials/04_observatori_porci/informes_anuals/fitxers_estatics/CAT_Informe-sector-porci-2015_20160814.pdf (accessed on 24 April 2018).
- Oficina Catalana del Cambio Climàtic. Guía de cálculo de emisiones de gases de efecto invernadero. Available online: http://canviclimatic.gencat.cat/es/redueix_emissions/com-calcular-emissions-de-geh/guia_de_calcul_demissions_de_co2/ (accessed on 24 April 2018).
- European Energy Exchange AG. Available online: https://www.eex.com/en/market-data/environmental-markets/spot-market/european-emission-allowances (accessed on 24 April 2018).


| Age (Week) | Weight (kg) Mean | SD | Intake (kg) Mean | SD |
|---|---|---|---|---|
| 1 | 29.7 | 3.9 | 5.1 | 5.5 |
| 2 | 33.4 | 4.6 | 12.1 | 8.5 |
| 3 | 37.8 | 5.4 | 20.5 | 12.1 |
| 4 | 42.6 | 6.3 | 30.2 | 15.9 |
| 5 | 47.9 | 7.4 | 41.3 | 19.7 |
| 6 | 53.5 | 8.4 | 53.4 | 23.6 |
| 7 | 59.3 | 9.5 | 66.4 | 27.5 |
| 8 | 65.3 | 10.6 | 80.3 | 31.4 |
| 9 | 71.3 | 11.8 | 94.9 | 35.3 |
| 10 | 77.4 | 12.9 | 110.1 | 39.2 |
| 11 | 83.4 | 14.0 | 125.7 | 43.2 |
| 12 | 89.2 | 15.2 | 141.6 | 47.1 |
| 13 | 94.8 | 16.3 | 157.6 | 51 |
| 14 | 100 | 17.5 | 173.7 | 54.9 |
| 15 | 104.8 | 18.7 | 189.6 | 58.9 |
| 16 | 109.1 | 19.8 | 205.3 | 62.8 |
| 17 | 112.8 | 21.0 | 220.6 | 66.7 |
| T1 | T2 | T3 | T4 | |
|---|---|---|---|---|
| Capacity () | 50 | 220 | 440 | 550 |
| Cost per trip () | 125 | 475 | 900 | 1000 |
| Emissions kg CO /trip () | 28.25 | 66.30 | 57.99 | 79.14 |
| S | E | U | R | O | P | Live Weight (kg) | Carcass Weight (kg) |
|---|---|---|---|---|---|---|---|
| 0.57 | 0.28 | 0.12 | 0.03 | 0.00 | 0.00 | 50 | 39.4 |
| 0.55 | 0.27 | 0.14 | 0.04 | 0.00 | 0.00 | 55 | 43.4 |
| 0.53 | 0.26 | 0.15 | 0.05 | 0.01 | 0.00 | 60 | 47.4 |
| 0.50 | 0.28 | 0.16 | 0.05 | 0.01 | 0.00 | 65 | 51.4 |
| 0.49 | 0.27 | 0.17 | 0.05 | 0.01 | 0.00 | 70 | 55.5 |
| 0.49 | 0.28 | 0.17 | 0.06 | 0.01 | 0.00 | 75 | 59.5 |
| 0.45 | 0.27 | 0.18 | 0.08 | 0.01 | 0.00 | 80 | 63.6 |
| 0.44 | 0.26 | 0.19 | 0.09 | 0.03 | 0.01 | 85 | 67.6 |
| 0.43 | 0.25 | 0.18 | 0.09 | 0.03 | 0.01 | 90 | 71.7 |
| 0.41 | 0.24 | 0.19 | 0.10 | 0.04 | 0.01 | 95 | 75.8 |
| 0.40 | 0.23 | 0.19 | 0.11 | 0.05 | 0.02 | 100 | 79.9 |
| 0.39 | 0.23 | 0.19 | 0.12 | 0.05 | 0.02 | 105 | 84.0 |
| 0.38 | 0.22 | 0.19 | 0.12 | 0.06 | 0.03 | 110 | 88.1 |
| 0.38 | 0.21 | 0.19 | 0.13 | 0.07 | 0.04 | 115 | 92.3 |
| 0.37 | 0.2 | 0.18 | 0.13 | 0.07 | 0.04 | 120 | 96.4 |
| % Profit Decrease | % CO emission Decrease | Profit (€) | CO Cost (€) | |
|---|---|---|---|---|
| 1 | 23,891 | 6051 | ||
| 0.68 | 0.00 | 0.00 | 23,891 | 6051 |
| 0.38 | 0.33 | 2.65 | 23,812 | 5891 |
| 0.22 | 0.50 | 3.44 | 23,684 | 5843 |
| 0.20 | 0.87 | 3.44 | 23,684 | 5843 |
| 0.16 | 1.189 | 4.35 | 23,440 | 5788 |
| 0.12 | 4.48 | 6.05 | 22,821 | 5685 |
| 0.10 | 15.30 | 11.36 | 20,237 | 5364 |
| 0.08 | 15.88 | 11.59 | 20,098 | 5350 |
| 0.04 | 16.63 | 11.82 | 19,919 | 5336 |
| 0 | 26.68 | 13.31 | 17,516 | 5246 |
| 13 | 14 | 15 | 16 | 17 | |
|---|---|---|---|---|---|
| 0 | 1,000 | 0 | 0 | 0 | 0 |
| 0.04 | 600 | 400 | 0 | 0 | 0 |
| 0.08 | 550 | 450 | 0 | 0 | 0 |
| 0.1 | 500 | 500 | 0 | 0 | 0 |
| 0.12 | 200 | 0 | 600 | 200 | 0 |
| 0.16 | 180 | 0 | 220 | 600 | 0 |
| 0.20 | 50 | 220 | 0 | 730 | 0 |
| 0.22 | 50 | 180 | 0 | 770 | 0 |
| 0.38 | 0 | 200 | 50 | 750 | 0 |
| 0.68 | 0 | 200 | 0 | 0 | 800 |
| 1 | 0 | 200 | 0 | 0 | 800 |
© 2018 by the authors. Licensee MDPI, Basel, Switzerland. This article is an open access article distributed under the terms and conditions of the Creative Commons Attribution (CC BY) license (http://creativecommons.org/licenses/by/4.0/).
Share and Cite
Nadal-Roig, E.; Pagès-Bernaus, A.; Plà-Aragonès, L.M. Bi-Objective Optimization Model Based on Profit and CO2 Emissions for Pig Deliveries to the Abattoir. Sustainability 2018, 10, 1782. https://doi.org/10.3390/su10061782
Nadal-Roig E, Pagès-Bernaus A, Plà-Aragonès LM. Bi-Objective Optimization Model Based on Profit and CO2 Emissions for Pig Deliveries to the Abattoir. Sustainability. 2018; 10(6):1782. https://doi.org/10.3390/su10061782
Chicago/Turabian StyleNadal-Roig, Esteve, Adela Pagès-Bernaus, and Lluís M. Plà-Aragonès. 2018. "Bi-Objective Optimization Model Based on Profit and CO2 Emissions for Pig Deliveries to the Abattoir" Sustainability 10, no. 6: 1782. https://doi.org/10.3390/su10061782
APA StyleNadal-Roig, E., Pagès-Bernaus, A., & Plà-Aragonès, L. M. (2018). Bi-Objective Optimization Model Based on Profit and CO2 Emissions for Pig Deliveries to the Abattoir. Sustainability, 10(6), 1782. https://doi.org/10.3390/su10061782