Article

Sustainability Analysis and Market Demand Estimation in the Retail Industry through a Convolutional Neural Network

1
State Key Lab for Information Engineering in Surveying, Mapping, and Remote Sensing, Wuhan University, 129 Luoyu Road, Wuhan 430079, China
2
Collaborative Innovation Center of Geospatial Technology, Wuhan University, Wuhan 430079, China
*
Author to whom correspondence should be addressed.
Sustainability 2018, 10(6), 1762; https://doi.org/10.3390/su10061762
Submission received: 21 March 2018 / Revised: 20 May 2018 / Accepted: 24 May 2018 / Published: 28 May 2018
(This article belongs to the Section Economic and Business Aspects of Sustainability)

Abstract

:
The Chinese retail industry is expected to grow dramatically over the next few years, owing to the rapid increase in purchasing power of Chinese consumers. Retail managers should analyze the market demands and avoid dull sales to promote the sustainable development of the retail industry. Economic sustainability in the retail industry, which refers to a suitable return of investment, requires the implementation of precise product allocation strategies in different regions. This study proposed a hybrid model to evaluate economic sustainability in the preparation of goods of retail shops on the basis of market demand evaluation. Through a grid-based convolutional neural network, a regression model was first established to model the relationship between consumer distribution and the potential market demand. Then, another model was proposed to evaluate the sustainability among regions based on their supply-demand analysis. An experiment was conducted based on the actual sales data of retail shops in Guiyang, China. Results showed an immense diversity of sustainability in the entire city and three classes of regions were distinguished, namely, high, moderate, and limited. Our model was proven to be effective in the sustainability evaluation of supply and demand in the retail industry after validation showed that its accuracy reached 92.8%.

1. Introduction

The concept of sustainable development requires the identification of the demands of society and the implementation of an appropriate resource allocation strategy to satisfy requirements and to avoid expenditures. The precise estimation of consumer demands ensures the considerable return and maintains economic sustainability in the economic field, especially in the retail industry.
Given the continuous growth of the Chinese economy, the purchasing ability of the Chinese has increased significantly [1], providing additional profits for the retail industry. Owing to complicated consumer activities, estimation of market demand is recognized as an important concern and a main challenge for the sustainable development of the retail market [2]. In the European retail industry, profit losses that amount to billions of dollars that are caused by the unreasonable preparation of goods, such as perishable food, have reached approximately 20% of the entire investment [3]. Confusion on consumer demand between retail shops and manufacturers that fill orders from retailers is a significant problem that exists in the retail industry. It blocks the development of a sustainable economy and it causes resource waste in the entire product supply chain.
To solve the issue of unsustainability in the retail industry, many studies have focused on the supply-demand process of the industry and have investigated several valuable estimation models. In the field of economics, information on human activities is critical for estimating regional market demand and potential. In traditional studies, survey questionnaires are frequently used to obtain customer preferences and shopping habits. The obtained information from surveys is assumed to be an effective reference for business managers to estimate consumer demand and to design purchasing strategies for products. The results are used to determine the potential locations for retailers and to predict their possible sales [3]. Survey questionnaire is a straightforward means to obtain consumer information. However, it is labor intensive and time consuming, resulting in a limited quantity of respondents [4].
The estimation of consumer demand has constantly focused on a macroscopic scale and it has not provided practical business strategies for retail shops due to the lack of appropriate auxiliary social economic data with large quantity. Social media data provide a new approach to solve the problem with the development of crowd-sourcing data. Such data are easy to obtain and their volume is larger than that of traditional survey questionnaires. With social media data, such as sign-in data, which are frequently obtained in the point of interest (POI) of a city, POI locations and their heat level can also be obtained through social media data. Researchers have realized that social media data could effectively reflect people’s daily activities [5,6,7,8]. Although studies have started to use social media data to determine the new commercial centers of a city or the influential areas of commercial facilities, the research scale remained macroscopic. Hu et al. [9] used check-in data from a popular micro-blogging platform in China to determine the hot trade areas of the entire city. The results were used for urban planning of the entire city. Qu et al. [10] and Jiang et al. [11] selected several large shopping malls as the research objects, and used a clustering algorithm to evaluate the active consumer distributions in Beijing. The abovementioned studies mainly focused on consumer activities in the entire city through social media data. However, the effective use of social media data in estimating consumption demand in a micro-scale remains an unresolved issue. Different from the macro-scale analysis, such as that of a city or province, more complex factors must be considered in micro-scale analysis, one of the most important being spatial proximity, including promotion and competitions. According to Tobler’s first law of geography, similarity and connectivity exist between nearby geographic units [12], indicating that consumer activities in a region affect the market potential of nearby geographic units. Spatial proximity is even prominent when solving economic issues in the micro-scale, where facilities are near one another. However, in previous studies, the relationship between consumers in different areas was ignored and the competition relationship between business facilities was not considered in the micro-scale.
To solve the limitations in current studies, to fill the gap in microscopic market potential estimation issues, and to provide many sustainable business strategies for retail shops, the current study proposed a new method to evaluate the economic sustainability of geographic units based on the estimation on the market demand of retailers through social media and actual sales data. In this study, a convolutional neural network (CNN) was introduced to extract the consumption information from web check-in data of Sina-Weibo (the microblogging platform of Sina Corporation, Beijing, China) and to form a grid-based market potential map. A nuclear density method was adopted by considering spatial proximity, and the results were used for training. The established model was used to estimate the market potential of areas without retailers. To verify the estimation accuracy, the proposed method was compared with ordinary least square regression and artificial neural network models through cross-validation. The results showed that the proposed method obtains higher precision than the other methods, and it can be used for predicting or estimating the market potential in the micro-scale.
The rest of this paper is organized as follows. Section 2 reviews relevant studies on market demand and deep learning methods. Section 3 introduces the study area and data source used in this research. Section 4 describes the methodology used in the study, including the established hybrid CNN and the sustainability estimation model. Section 5 conducts experiments to evaluate the economic sustainability in Guiyang through the proposed model. The accuracy of the established model is also discussed. Section 6 provides the conclusions and the directions for future work.

2. Literature Review

In this section, the literature on market potential estimation is reviewed and the application of artificial intelligence (AI) is introduced. A CNN is introduced.

2.1. Sustainability in the Retail Industry

In the retail industry, sustainability, specifically environmental sustainability, and economic sustainability, has gained increasing research attention [13]. Environmental sustainability refers to the production of environmentally friendly products and the reduction of risks that damage the natural environment. Most studies on retail sustainability focused on environmental sustainability. Sustainability in fast-food chains was initially emphasized, such as the opposition to McDonald’s opening next to Piazza di Spagna in Rome and the call for the provision of organic food, including environmentally friendly milk or vegetables [14]. In response to the proposal of environmental sustainability from the government, retail fashion shops, such as ZARA and Topshop, have adopted environmentally friendly materials, including cotton and other natural fibers [15]. Economic sustainability maintains the balance between supply and market demand and it increases the return on investment. To implement economic sustainability, small amounts of leftover goods are required to avoid profit loss and the preference of consumers should be realized to reach high sales. However, a high rate of unsold products (25–40%) occurs at the end of the selling season [16], which has a negative impact on economic sustainability in the retail industry. Although several measures, such as “buy-back” action, have been widely adopted to enhance sustainability in clothes, this action cannot be used to deal with perishable food and private goods. Choi and Chiu [13] proposed three factors, namely, the expected amount of leftover goods, rate of return on investment, and expected sales, to measure sustainability in a supply chain. The three factors are widely used to investigate the supply chain sustainability in the retail industry. Previous studies mainly focused on specific aspects, such as price [17] and competition [18]. However, these factors were macroscopic and the information on the main participants in business activities, namely, consumers, was inadequately considered. The preferences and consumer activities resulted in various demands among different regions, which led to huge differences in profit return when retail managers conducted their business strategies, such as distribution or advertising strategies. The reasonable estimation of consumer demand plays an important role in maintaining the balance between supply and consumer demand. Thus, several studies have investigated consumer activities to obtain their attitude about products and on the range of activities to achieve economic sustainability. However, business managers could only focus on the macroscopic demand of consumers among a large district because of the limitation of their data source. WalMart and Carrefour have obtained consumer information from historical data and their websites to conduct their production plan for every quarter. However, the demand uncertainty has resulted in a large amount of leftover goods. Although the estimation of consumer demand in smaller regions is now required in order to optimize economy sustainability in business management, research on consumer demand in the micro-scale remains lacking.

2.2. Estimation of Economic Consumer Demand

In traditional studies, market potential was usually predicted based on historical sales data without external data sources, and time series analysis was constantly used for prediction. Chien [19] used a moving average (ARIMA) method and a grey neural network approach to predict the consumer demand in the subsequent time period. These methods did not determine the influencing factors of retail sales, and the results did not provide practical optimization measures for the retail business. Anderson [20] used the preference data that were collected from questionnaires to investigate the influencing factors, such as age, sex, jobs, and sales income. This approach was effective in obtaining the consumption ability and preference in different areas based on the personal information of consumers and in estimating the market potential and market characteristics in different areas. However, the participation ratio was low and the data volume was small due to privacy concerns. Subsequently, the distribution data of retailers combined with urban planning data were added in order to obtain the distribution pattern of retailers and to infer the characteristics of consumption activities in different areas. For the investigation on areas with maximum market potential, Elliot [21] used a kernel density estimation (KDE) method to form a grid-based heat map according to the location of retailers. Geographic units with many retailers were assumed to be the commercial centers that occupied huge market potential. Many fashion brands, such as ZARA, have adopted this method to guide their business strategies, such as in the selection of new retailers and the distribution of goods [22]. The advantage of this method was that market potential was estimated based on the retailer density of nearby places. Thus, several places, especially those without existing retailers, were recognized to occupy high potential. Apart from the location of retailers, several external data, such as POI data, were used in the estimation of market potential. Several theories, such as central place theory [23], Huff model [12], and distance attenuation theory [24], were used to estimate the influencing areas of POI, and the places that were located at the cross-influence scope of many POI were recognized as popular places with maximum market potential [25].
Later on, along with the rapid expansion of cities, some old town with lots of POI points may become not popular, and the new city centers with much more market potential will appear, even when the POI number was smaller than the old city centers. A lot of cities in China developed very fast in thirty years, so that just consider the distribution density of POI was not enough to reflect the scale of consumer groups [26]. In order to solve this problem and to obtain more consumer data, some researchers have used big social media data from tweets or check-in data from Sina-Weibo, the popular micro-bog platform in China. The check-in data can be easily obtained from the web, and the data volume can reach several millions, moreover, the check-in data also contains the location information of POI that users are in. Hu et al. [9] used check-in data from Sina-Weibo to find out the hot trade areas of a whole city. Qu et al. [10] and Jiang [11] chose several supermarkets as the research objects, and used the clustering algorithm to calculate the active consumers around different supermarkets and to estimate the market potentiality, respectively. To estimate the consumption level of energy, Korpusik [27] used tweet data analysis and designed a deep neural network to model the relationship between the energy consumption and the distribution of tweet data.
The deep learning technology has been thought to be a new approach to conduct the prediction tasks. Kalogirou [28] established an artificial neural network (ANN) to forecast the energy consumption of a solar building. Marvuglia [29] toke account of the temporal characteristics of the electricity usage habits, and used RNN to predict power consumption in each hour, the results were compared with the traditional regression method and the error of RNN was just 1/10 of the traditional methods.
Few studies have estimated consumption in the micro-scale, and the spatial correlation in different areas has not been considered, either. Therefore, we attempt to estimate the FMCG consumption potential through social media data and historical sales data by using deep-learning technology, specifically the CNN, and find out a more precise way to estimate the market potential when compared with other methods.

2.3. Reflection of Consumer Mobility through CNN

Economic sustainability requires the valuable estimation of consumer demand through human activities. However, immense uncertainty and mobility exist in human activities and they are also affected by external social economic factors. Deep learning methods were introduced in this study to analyze consumer activities. Deep learning algorithms, which were first introduced in 1956 by McCulloch and Pitts [30], are mathematical models that are used to generalize the thinking and the learning patterns of the human brain. Deep learning algorithms are defined as “technology to mimic the human brain using the software technology” [31]. AI was not implemented at that time due to limited computing capabilities and few data sources. However, with the rapid growth in data volume and the improvement of computing ability, AI and deep learning have undergone tremendous development. The hidden layers of a deep neural network can reach over 1000 [32]. Deep learning technology can be used to model an auto-encoder that can reflect the complex relationship between input and output. When compared with traditional regression algorithms that frequently contain several parameters, thousands of parameters are trained in the deep learning framework through unsupervised learning. Over fitting can also be solved, which makes the deep learning technology more robust and accurate than traditional methods. Deep learning technology has been widely used in several domains, such as automobile driving [33], image classification [34], and energy management [35], and it is proven to be effective in solving the problems on prediction and classification tasks. Deep learning, which is a subset of machine learning algorithms, is a technology to form a kind of network consisting of synapses that interconnect neurons and contains an activation function. A deep learning neural network can extract the main features between input and output in an unsupervised manner without considering the label data. This function gives the established neural network the capability to predict the results with new input. Apart from the input and output layers, a deep neural network usually contains several hidden layers composed of neurons. Each layer in the network obtains the delivered information from its previous layer. The information is considered as knowledge and it is then delivered to the next layer. The learned knowledge or the characteristics in each layer are different. Partial and microscopic characteristics are learned in the previous layers, and many macro-scale characteristics are learned behind the layers [34]. For a nonlinear function, such as the rectified linear unit (ReLu), sigmoid is usually used in each neuron to avoid linearization.
CNN, which is a kind of deep learning network, is a combination of an automatic feature extractor and a trainable classifier. CNN extracts the characteristics of nearby units through several convolutional and pooling layers. It has been widely used in several remote sensing domains, such as image classification [36] and object and face detection [37], over huge datasets. In the medical field, CNN has been used for mammogram image classification and the intelligent identification of sick parts [38]. In [39], where the authors recognized handwriting through the open source network “AlexNet” and applied the methods into the smartphones, the accuracy rate reached 97.8%. CNN has also been used to predict traffic flow in geographic units, which is the main concern in traffic management and public safety [40]. Zheng [40] confirmed that spatial dependencies exist between nearby geographic units, as shown in Figure 1.
Figure 1 shows the spatial dependencies between nearby regions. The inflow of P2 is affected by the outflow of P1 and it becomes the inflow of P3 in the next time period due to the mobility of people. This outcome indicates that the population in a region also affects the floating population in its nearby regions and affects the traffic, commercial, and other domains compared with the unmoved POI.
When considering the mobility of consumers, the obtained locations from social media data should be treated in a manner in which their characteristics are reflected. Given that CNN considers the influence of nearby regions, a CNN is established in this study to model the relationship between social media and the actual sales data of retailers and to provide a precise means of estimating market potential.

3. Study Area and Data Description

3.1. Study Areas

Guiyang, which is the capital city of the Guiyang Province, is located in the south central of China. Its location is shown in Figure 2. Guiyang is known as the “Forest City” of China because of its high forest coverage rate. Guiyang City is near the Yunnan—Guizhou Plateau. It has an average elevation of over 1100 m, which causes the moist climate in Guiyang. As an attractive tourist city, Guiyang is famous for its moist climate and beautiful mountains, such as Huangguoshu Mountains and waterfalls. Guiyang has an entire area of 8034 km2 and it consists of six regions and three county-level cities. The permanent resident population in Guiyang is over 4.5 million. The per capita GDP in Guiyang is $10,606, which is higher than the average in China.
Guiyang has become the central city in southwest China due to the rapid development of its economic, social, and cultural industries. As an outcome of the “One Belt and One Road” program, the National Big Data Center has been established in Guiyang, making the city the gathering place for the information industry and the data trading business. Guiyang is also the pilot city of circular economy in China, and several new economic patterns have been developed in the city. All of these changes have made Guiyang a promising and attractive city for economic businesses. The development of Guiyang has resulted in the formation of new city centers. Therefore, estimating the market potential in different areas and distributing commercial resources in more reasonable ways will be challenging work for business managers.

3.2. Data Source

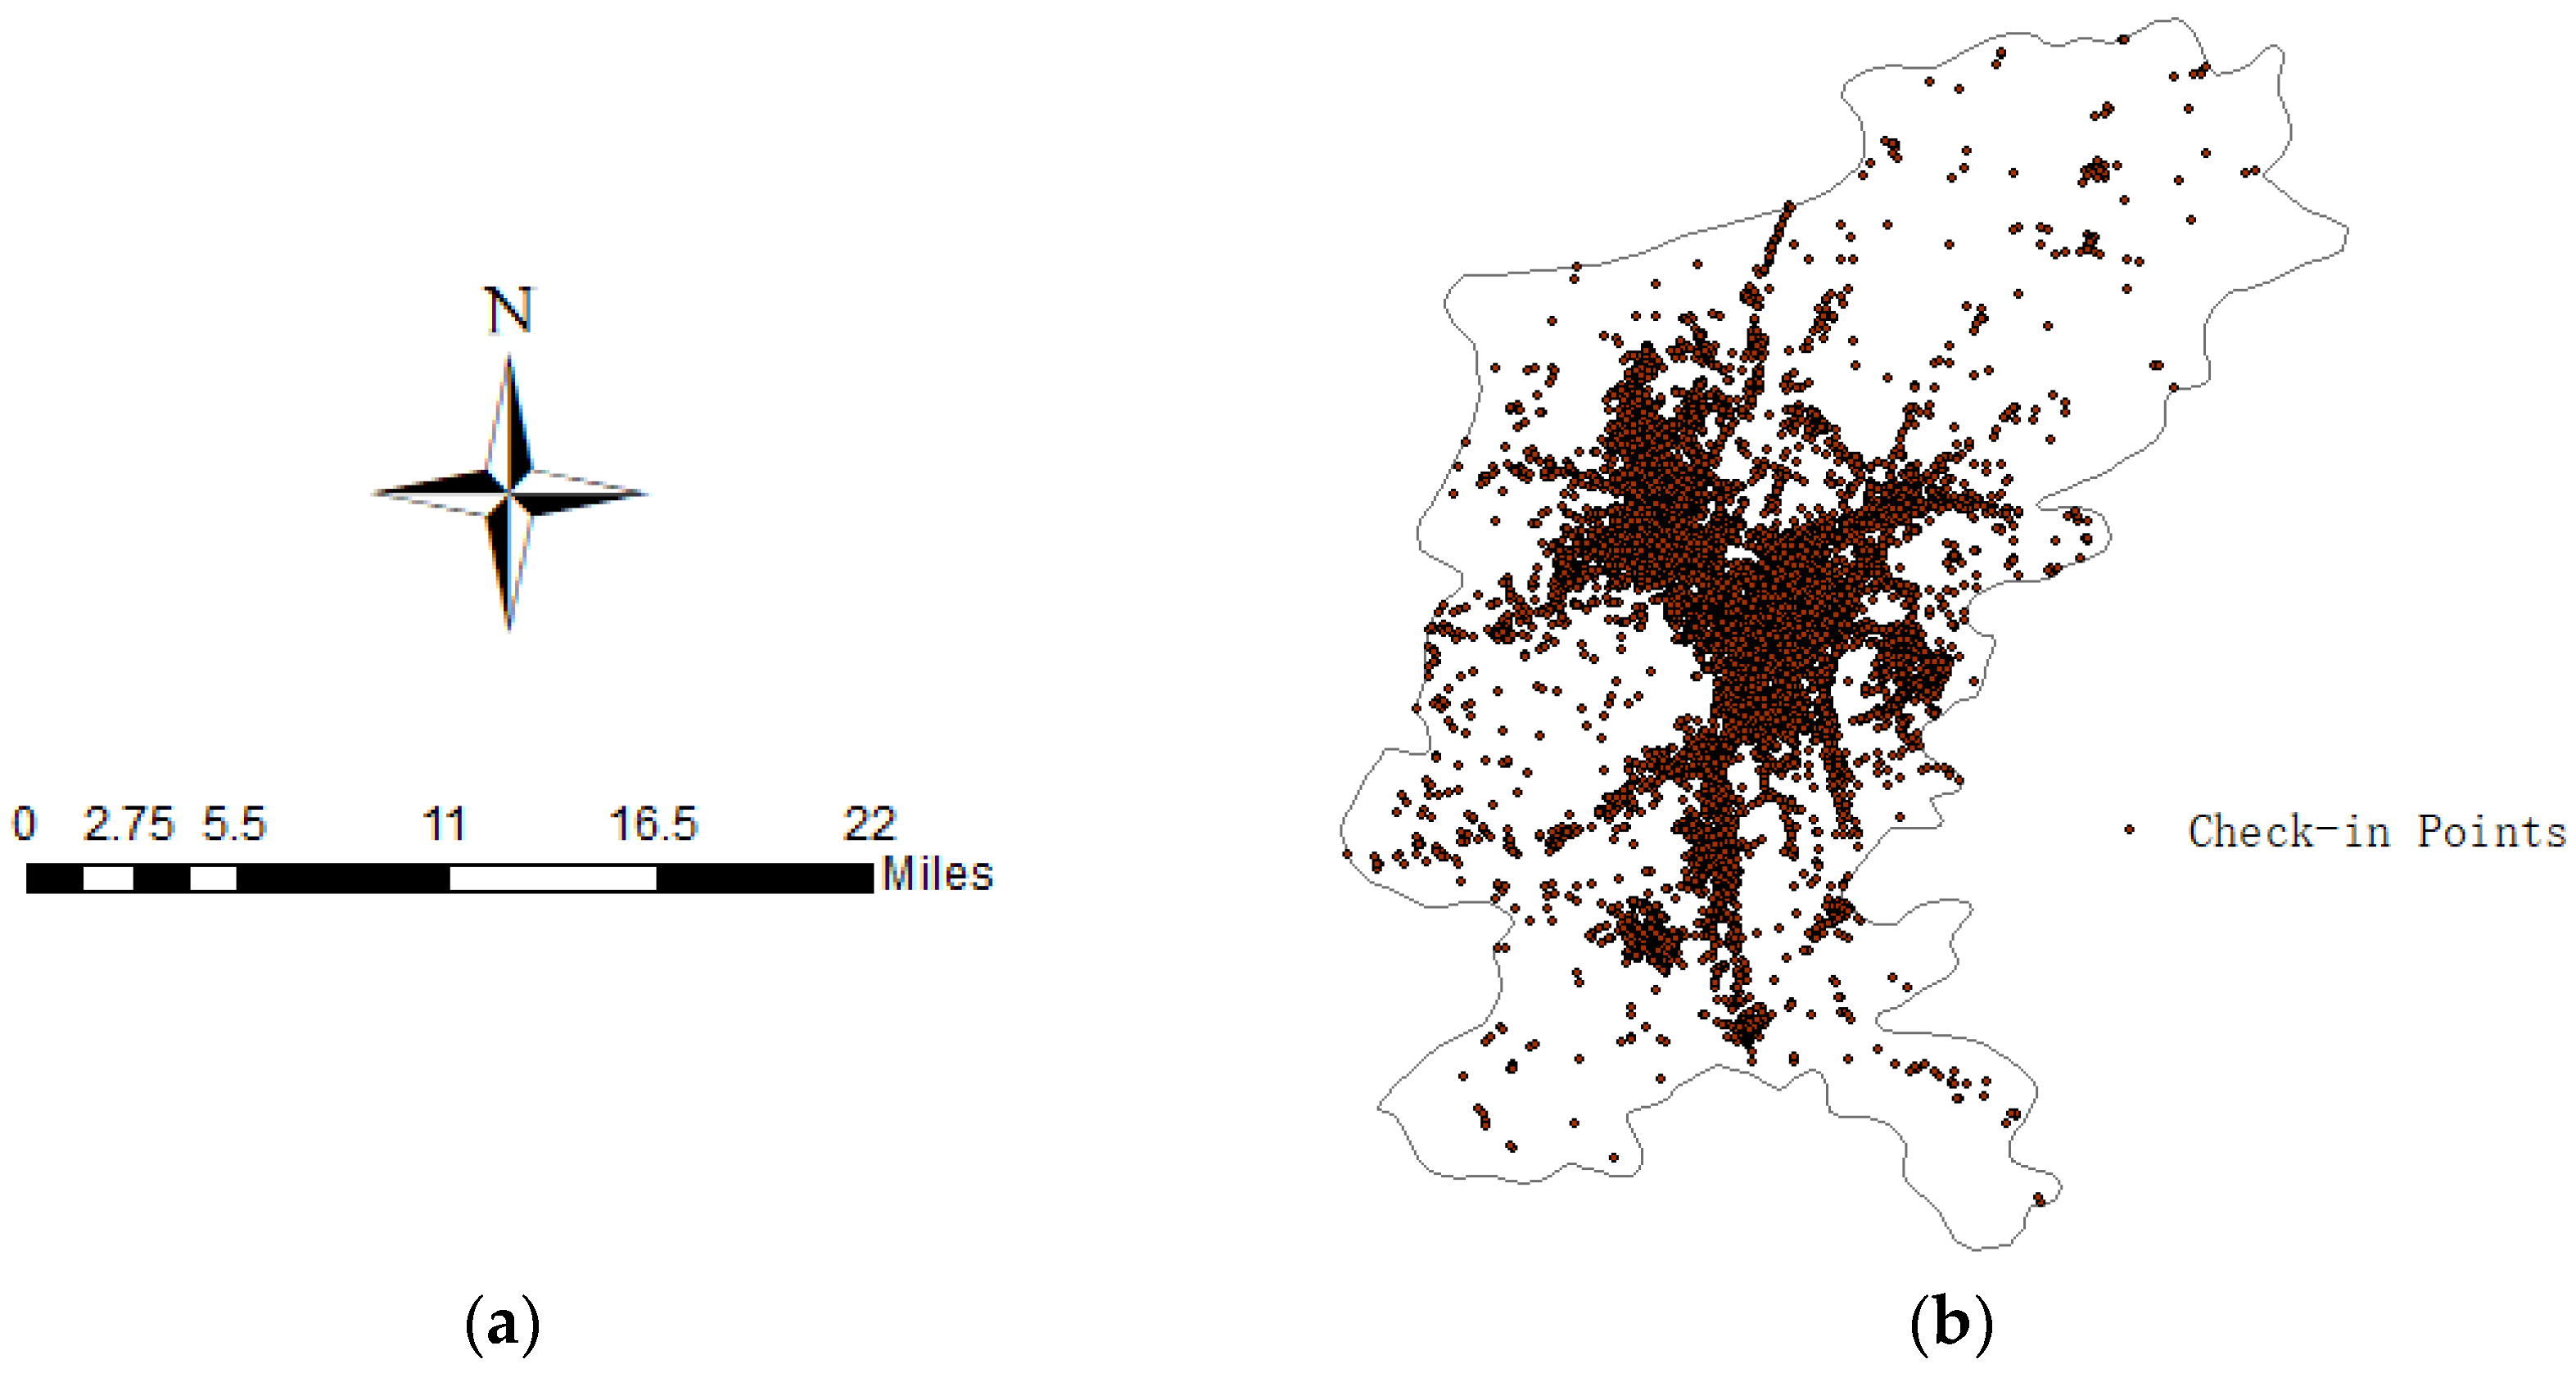
  • Mobile check-in data: The media data used in this study are the check-in data from Sina-Weibo, which is the largest blogging platform in China, between January 2016 and December 2016. The check-in data include user ID, location, check-in time, and several attributes, such as comments or pictures. After data cleaning, approximately 55,000 effective check-in data remained. The media data are shown, as follows:
  • Retailer data: The retailer data used in this study include the location and monthly sales data of FMCG between 2015 and 2016 from 5614 FMCG retail shops in Guiyang City, China. The data are provided by a local company. These shops are distinguished into three types that are based on their formats: small supermarket; chain convenient store, such as “Today” (a famous convenience chain store in China); and, groceries distributed over each street. Hypermarkets such as WalMart and Carrefour, shopping malls, and vegetable markets were not included in our data source. To improve the accuracy of analysis, retail shops with average monthly sales less than $500/month were not included in our data source. The considered goods were mainly FMCG goods, such as clothes, tobacco, wine, foods, and other daily necessities. Electrical appliance sales were removed from the data source because most retail shops did not sell them. Examples of the information that was obtained from retail shops, such as retail type, retail ID, retail name, monthly sales, and locations, are shown in Table 1.
  • External data: The external data include the road network and maps (1:200,000) of Guiyang City as spatial references and a base map.
The description of each data type is shown in Table 2.

4. Methods

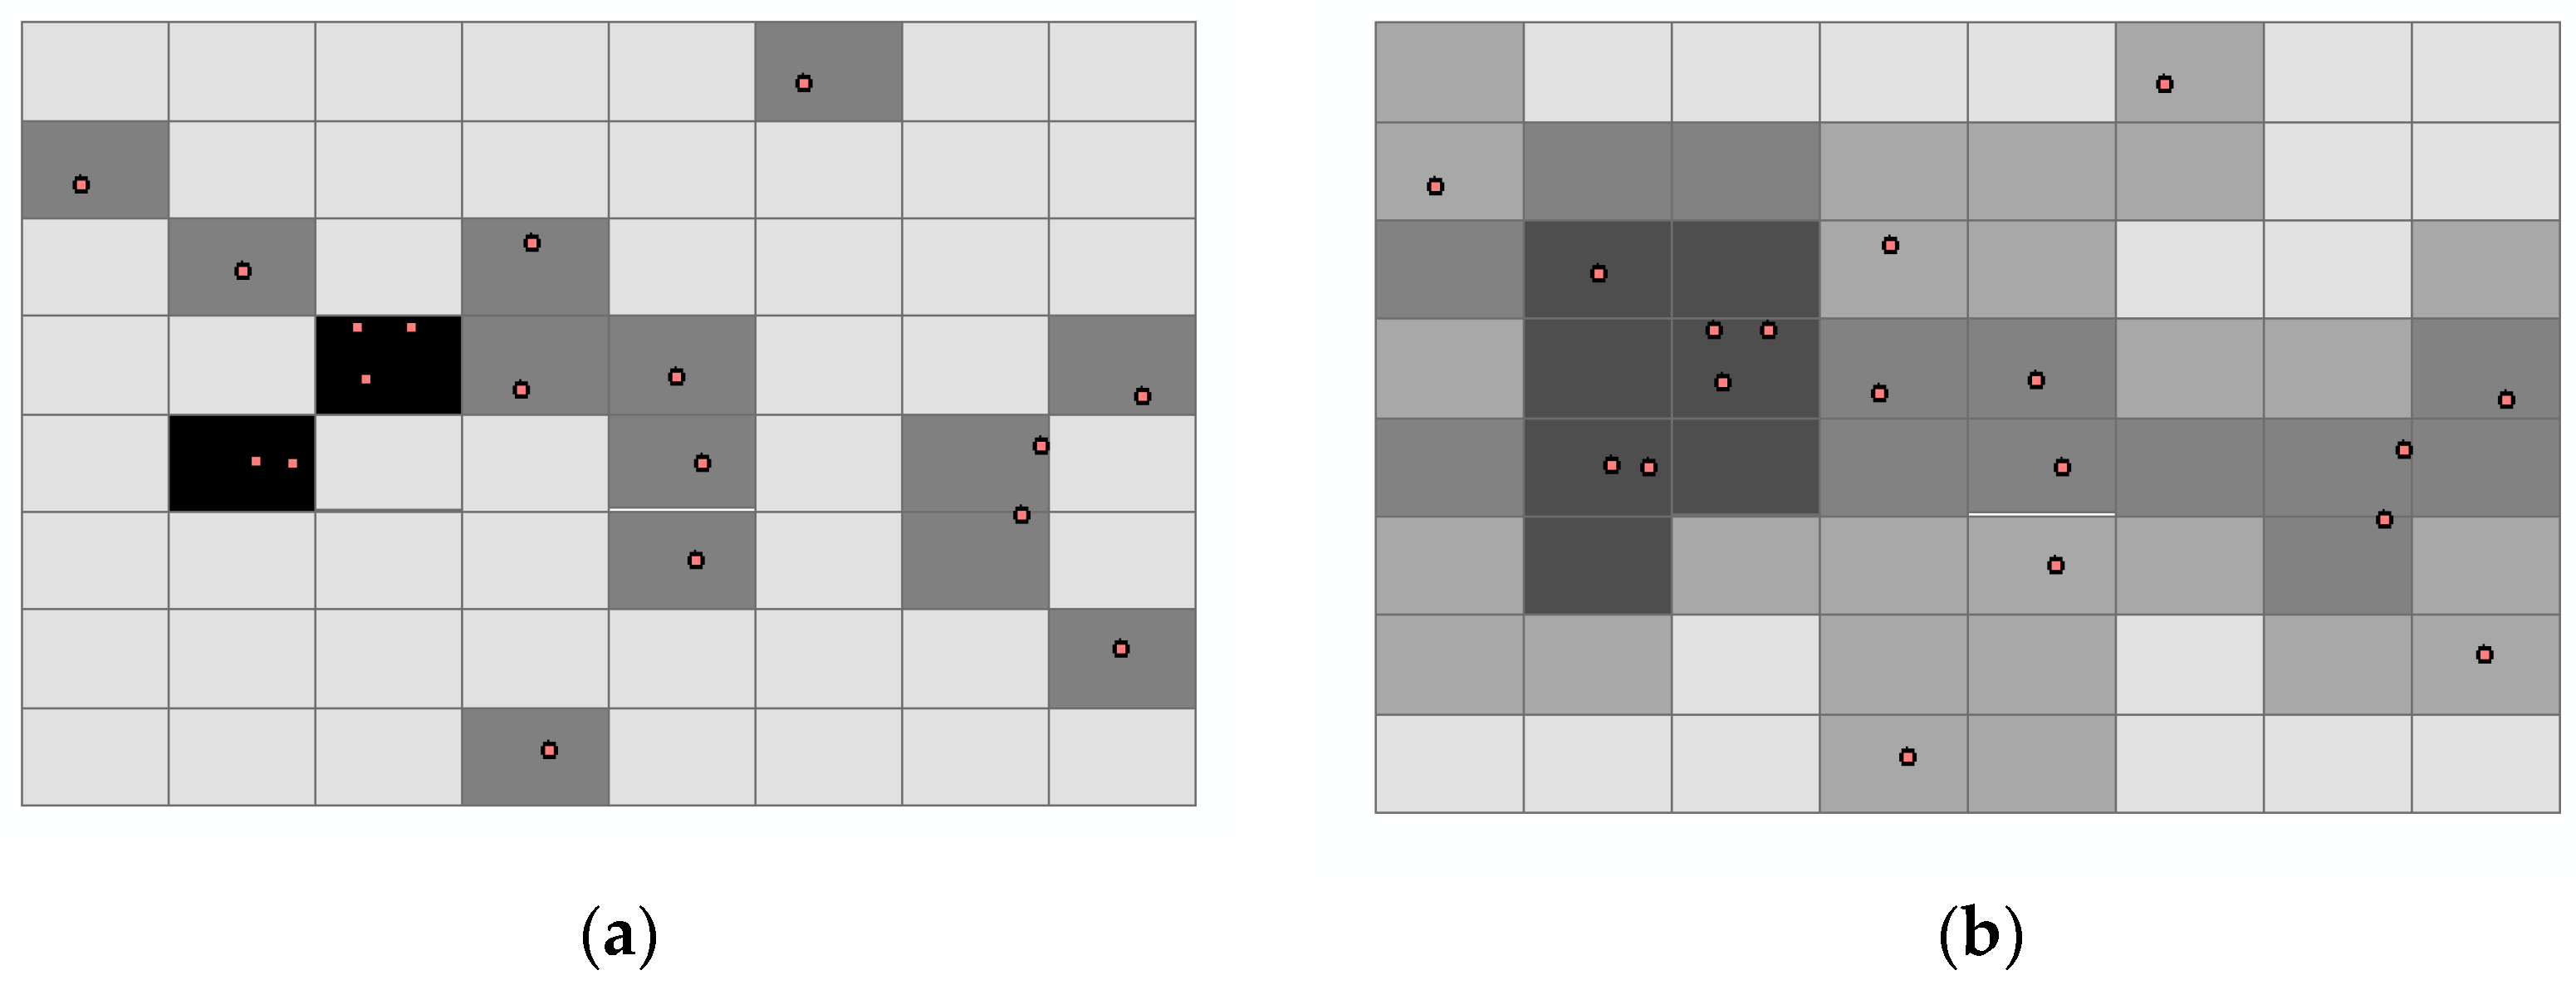
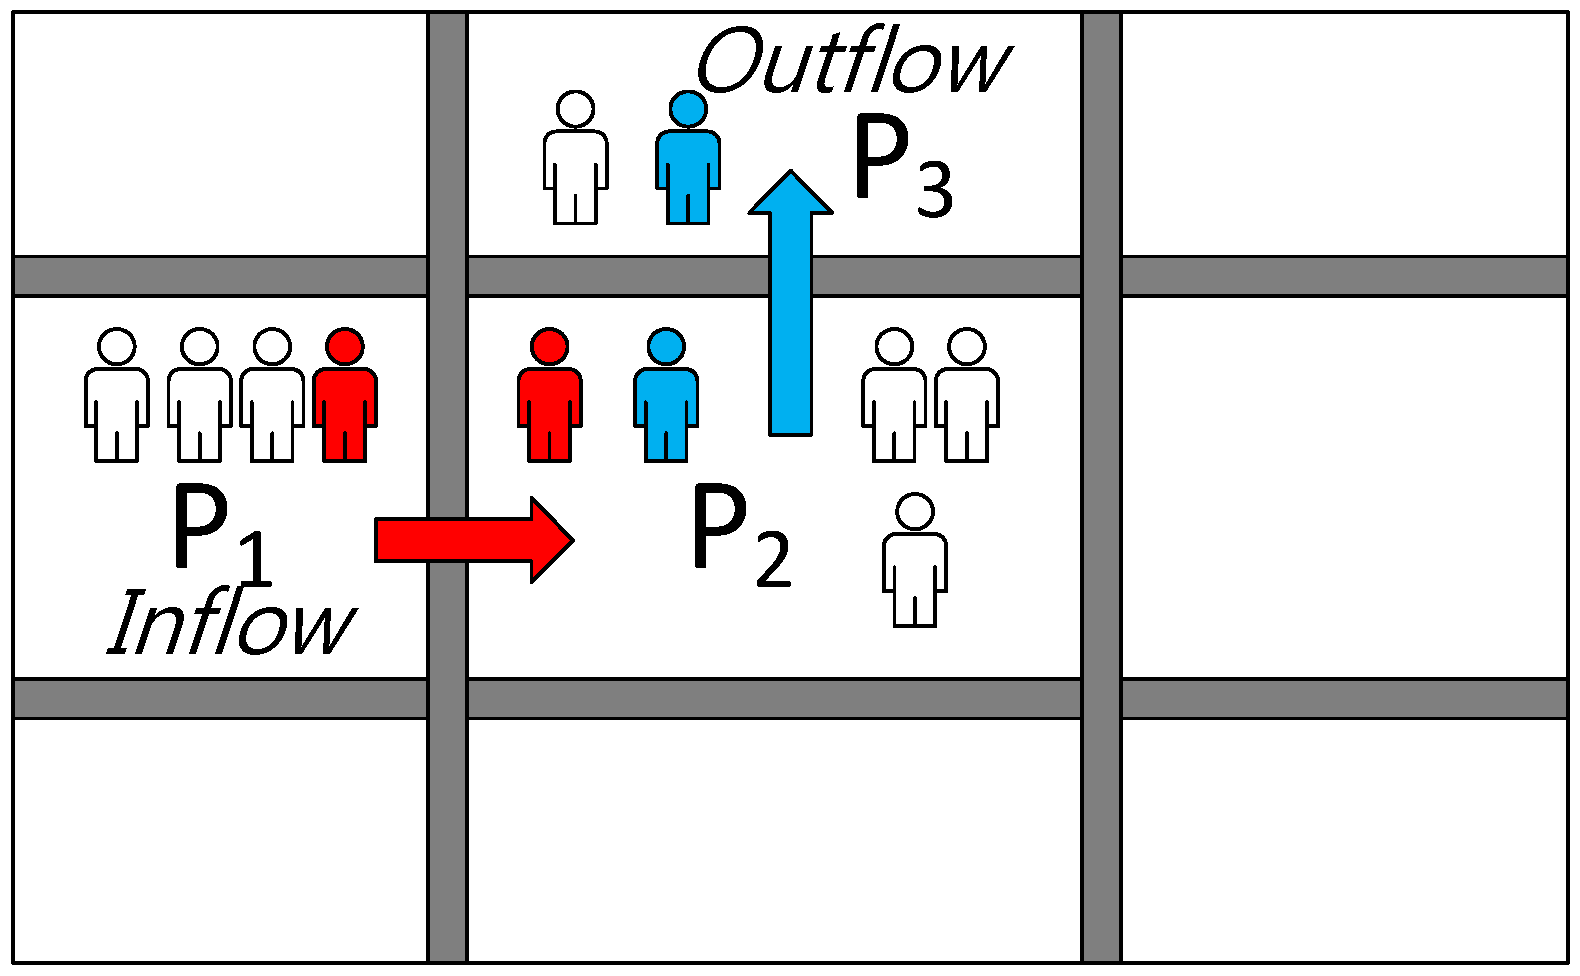
4.1. KDE of Grid Cells

Unknown or insufficient consumer information that is caused by missing data is a huge challenge in maintaining sustainable development in the retail industry and is the reason for the unbalanced accuracy distribution of several models. To solve this problem, KDE is introduced to fill the data loss in several regions. KDE is a method used to calculate the point density in a two-dimensional (2D) surface; it uses a range of values to represent the gathering degree of points based on their locations and attributions [41]. A hotspot map is formed to show the density distribution of points through the KDE method. When compared with the quadrat sampling method that sums the number of points located in each geographic unit, the KDE method considers the spatial proximity of geographic units. According to Tobler’s first law of geography “there exists a similarity and connectivity between the nearby geographic units” [42]. This condition makes the estimation results of KDE smoother than the those of the quadrat sampling method [43]. Figure 3 shows the comparison between the quadrat sampling and KDE methods.
Point distributions in the two images, are the same. However, the estimation results of image (b) are smoother than those of image (a). For the quadrat sampling method, image (a), the grid colors are determined based on the actual number of points that are located in the grids. The color of grids with more points is deeper than those of other grids, and the color of grids with no points is white. For the KDE method, image (b), the grid colors are also determined based on the points of nearby grids. Thus, in image (b), no points are observed in several grids, and their color is deep. The computation formula of KDE is expressed, as follows:
f n ( x , y ) = 1 n h 2 π i = 1 n K [ ( 1 ( x x i ) 2 + ( y y i ) 2 h 2 ) ] 2 ,
where f ( x ) refers to the density estimate at the   ( x , y )   position, h refers to the bandwidth, which is defined based on the mean integrated squared error, n refers to the number of observations, and K is the kernel function. ( x x ) + ( y y ) refers to the distance between   ( x , y ) and ( x i , y i ). The optimizing method to define the bandwidth is expressed, as follows [44]:
h = ( 1 n ) 1 3 0.9 σ ,
k = e x p ( | | x x | | ) 2 2 h 2 ,
where x represents the sample variance and x represents the center of the kernel function. A moving window is used to calculate the point density in each grid cell to estimate the kernel density of samples. The specific procedures are: (1) According to the precision requirements, determine the size of grid and conduct grid division to research areas. (2) Count the number of points that are located at each grid, the sum value is set to each grid. (3) Define a search radius with appropriate size, move the circle, and calculate the density of each grid based on the formula above. (4) Output the density values of grids. By adjusting the different radius, a most suitable size can be obtained to get a better density distribution.

4.2. Sustainability Evaluation Model-Market Stability Assessment

Market performance stability is a vital standard that is used to evaluate the sustainable level of an economy. A simple time series analysis based on historical sales data is insufficient to reveal the risk tolerance level in different regions. The sales performance in each region is an integrating influence of a nearby market environment. In this way, regions with a stable market environment show similar sales performance or market potential. The accurate identification of these regions has been of huge significance for the effective implementation of market strategies and the avoidance of investment losses.
Moran’s I is introduced to evaluate the market stability level, which is an index in spatial auto-correlation. Moran’s I is used to estimate the similarity of attributes among different areas. The value of Moran’s I ranges from −1 and 1. A value close to −1 indicates that considerable similarity exists in the region and its nearby regions. A value close to 1 indicates the existence of an opposite market potential in the region and nearby regions. Moran’s I is calculated, as follows [44]:
I g l o b a l = i = 1 n j = 1 n w i j ( x i x ¯ ) ( x j x ¯ ) i = 1 n w i j ( x i x ¯ ) 2
I l o c a l = n ( x i x ¯ ) j ( x j x ¯ ) j ( x i x ¯ ) 2
where I g l o b a l . is the indicator of global Moran’s I, which is used to show if spatial auto-correlation exists in the entire area. I l o c a l is used to show the spatial auto-correlation level in each region. In the above formulas, n represents the total number of spatial units, x i , x j represent the attributes of units i and j, and x ¯ represents the average values of i and j. W i j represents the spatial weight between units i and j. Z value is usually used to test the statistical significance of Moran’s I:
Z = ( I i E ( I i ) V A R ( I i ) ) ,  
where E ( I i ) and V A R ( I i ) denote the theoretical expected value and variance, respectively. The economic sustainability level of different regions can be evaluated through the spatial auto-correlation analysis between regions. Regions with a high sustainability level have high market potential and a high Moran’s I index.

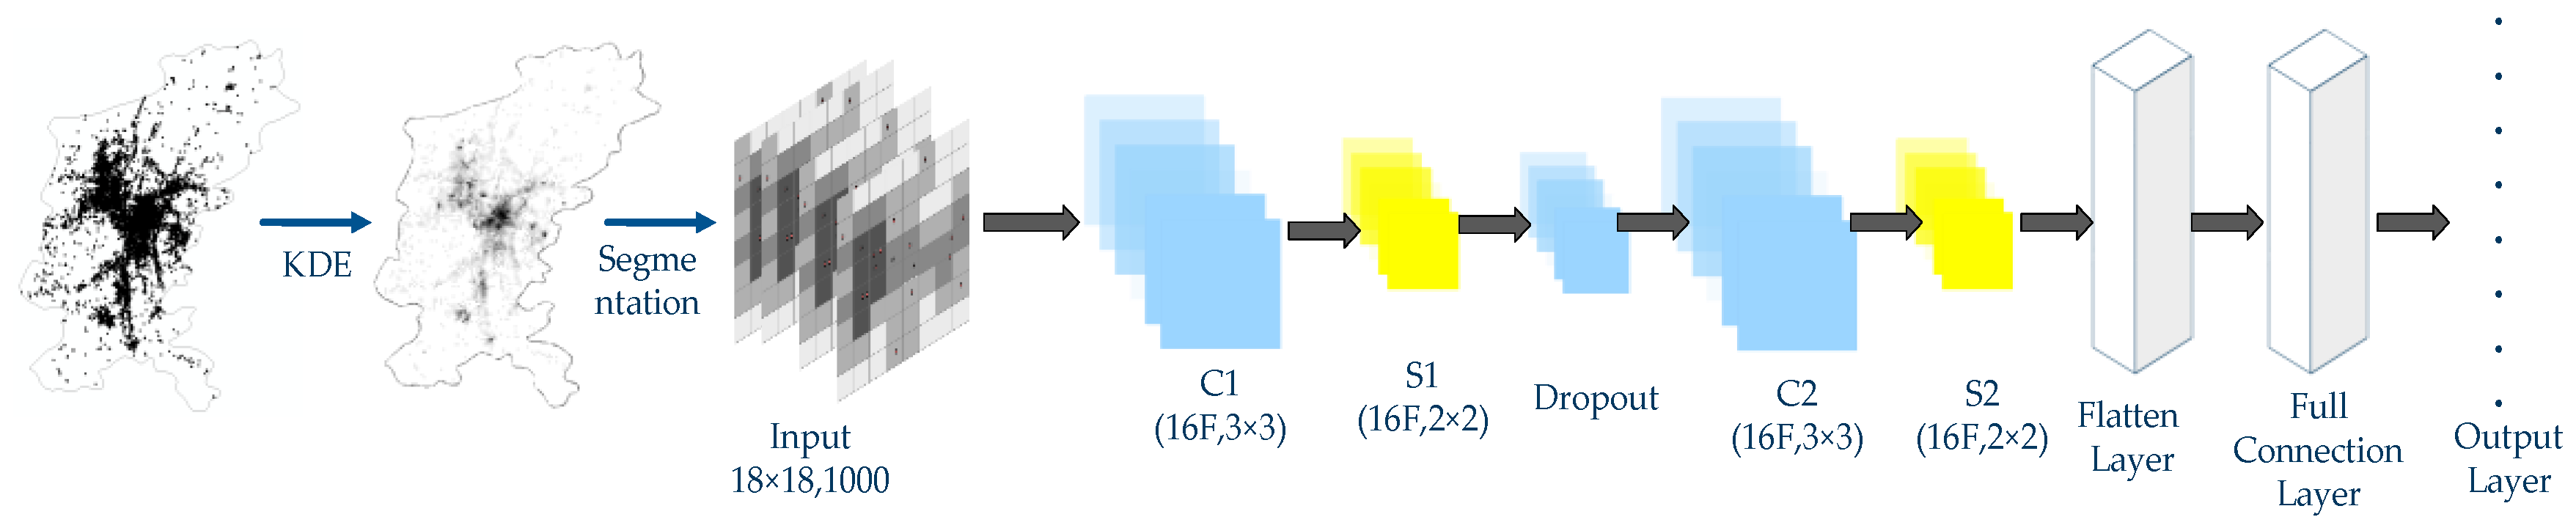
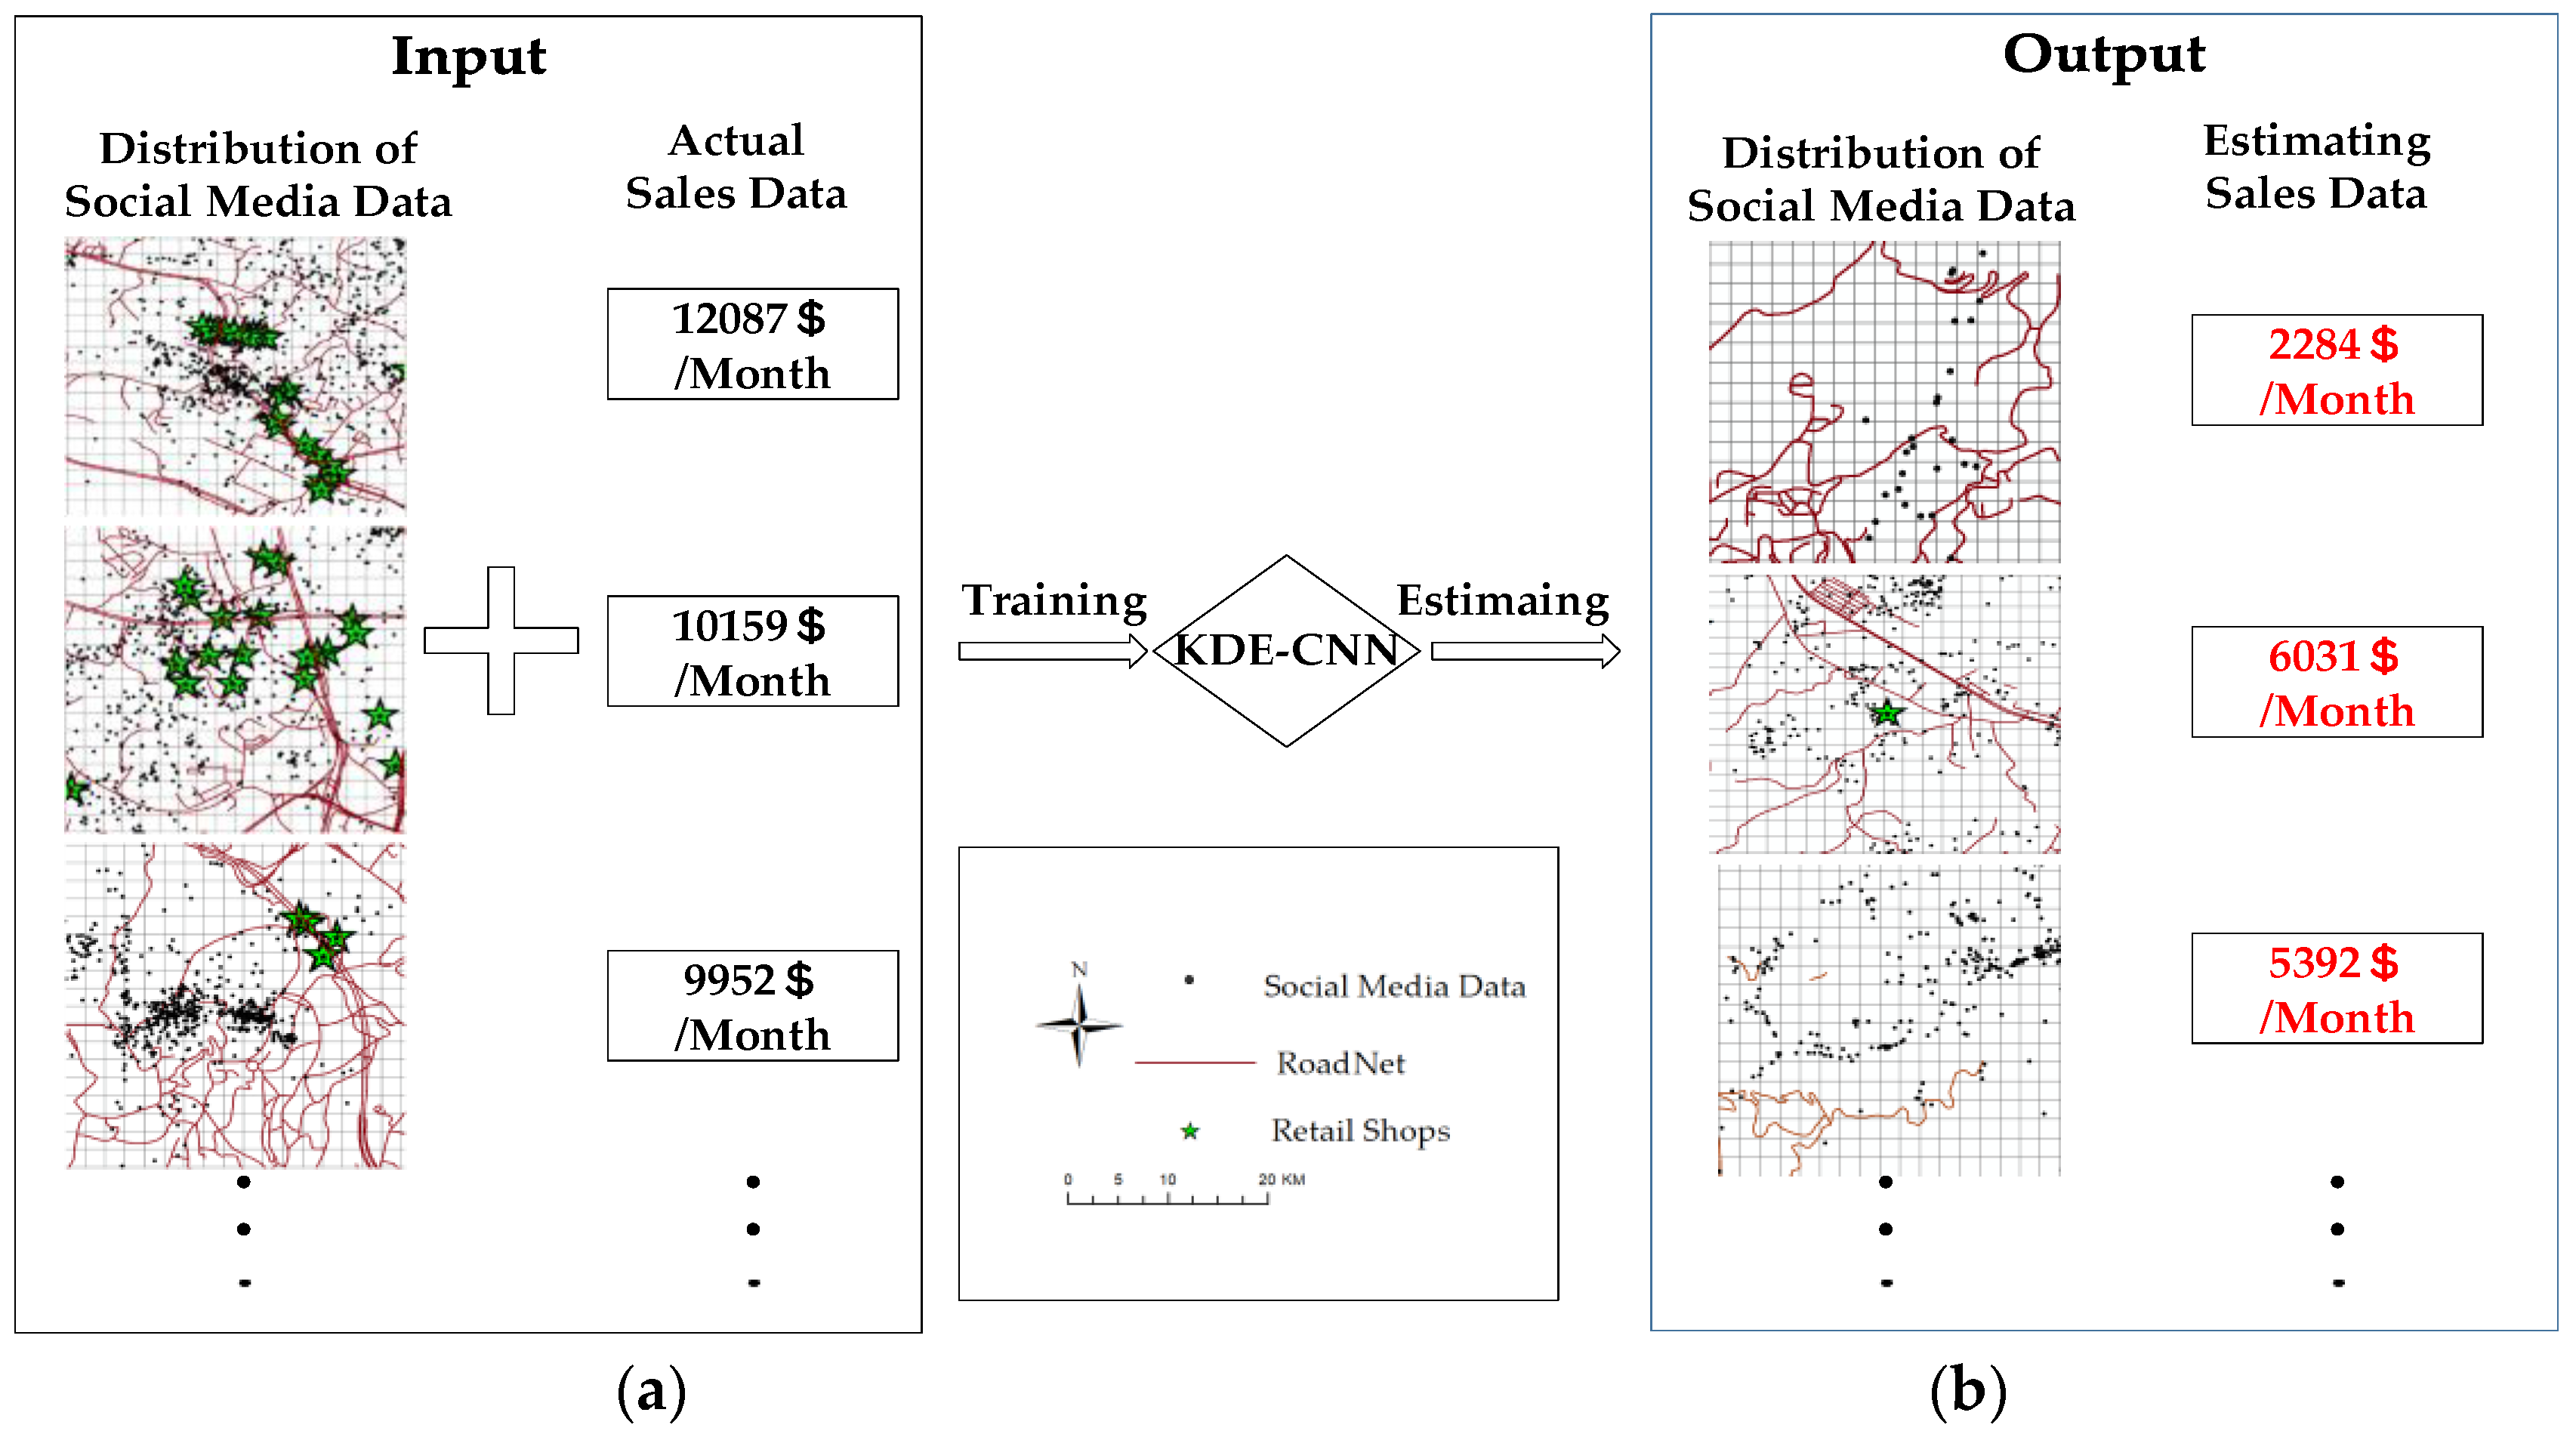
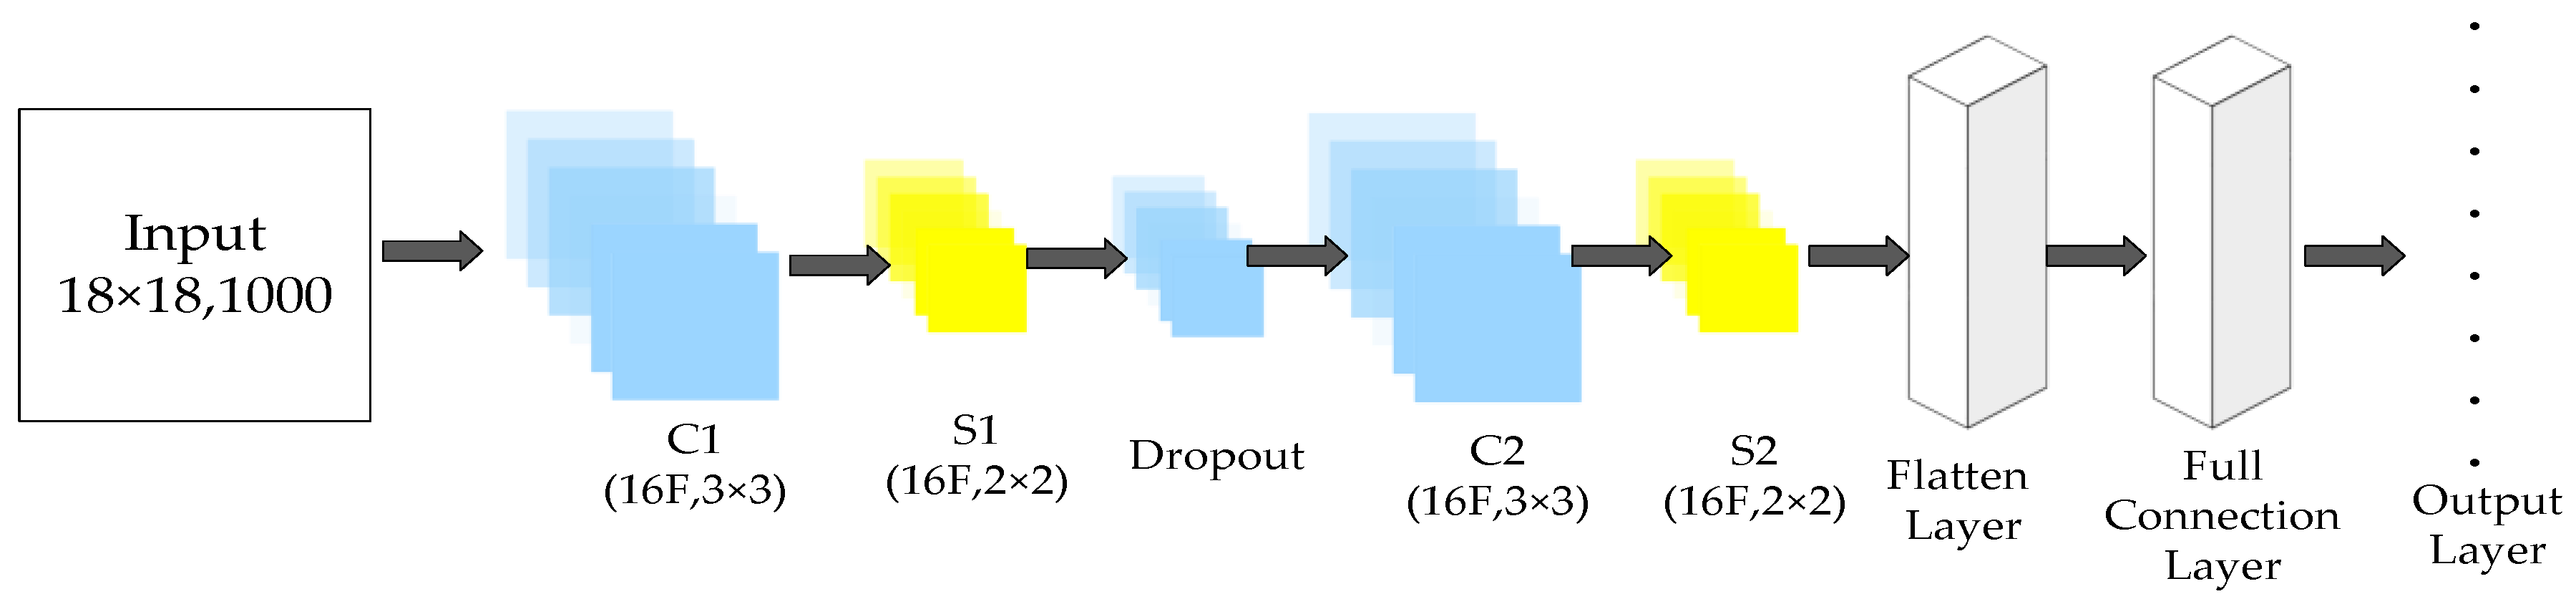
4.3. Consumer Demand Estimation through CNN

CNN is a deep learning method that is widely used in image classification problems. Three kinds of layers constitute a CNN, including convolutional, sub-sampling or pooling, and completely connected layers. CNN normally consists of several layers. The functions of each layer are described, as follows:
(1)
Convolution layer: This layer is considered to be an important layer in a CNN to extract the main information of an image. The convolution layer contains a convolution kernel, which is also called a filter. The filter is an n × n × x matrix that extracts the main information from the original input and reduces its complexity. n is the width of the filter, especially the odd numbers, such as 3 and 5, and x is the channel number of the image. Filter can be recognized as a neuron layer to regroup and simplify the information from previous layers. When the filter goes through the entire image and the pixel values that are covered by the filter are multiplied with the n × n matrix in each channel, the result is the extracted information of n × n pixels. The number of steps the filter moves in each time is called the stride, which is conventionally set to 1. In this way, the size of an m × m × x image is narrowed to ( m n + 1 ) × ( m n + 1 ) × x . However, the stride can be other values, such as 2 or 3, when dealing with several large images. For example, the m × m × x image is narrowed to ( ( m n ) / p + 1 ) × ( ( m n ) / p + 1 ) × x when the value is set to p. To avoid ( m n ) / p from becoming an integer, several columns and rows are added to the input, an action that is called padding. Thus, the data volume of the input can be effectively reduced through the convolution layer.
(2)
Pooling layer: This layer is also called the sub-sampling layer, which is frequently the next layer of the convolution layer. This layer progressively reduces the data volume of the data from the previous convolution layer. Similar to the filter in the convolution layer, a matrix also exists in the pooling layer that passes through the entire input image. The functions in the matrix can be the average, max, and positive functions. To reduce information loss, each channel is dealt with several pooling layers with different functions. Thus, the channels of the input image increase through the pooling layer.
(3)
Full connection layer: This layer is the final layer of a CNN. In this layer, the neurons connect with all of the neurons from the previous layer. After this layer, the input image with multiple dimensions is translated to one-dimensional (1D) data that are used for classification or regression. The CNN structure is shown in Figure 4.
As shown in Figure 4, the input dataset includes 1000 images with a pixel size of 20 × 20 × 1. The C1 layer is the first convolutional layer with 16 feature maps and a ReLU activation function. Each feature map in the C1 layer contains a filter with a size of 3 × 3 pixels. The obtained results from the C1 layer are transferred to a MaxPooling layer S1, which also consists of 16 feature maps. The size of the pool matrix in each feature map is 2 × 2, and the matrix extracts the maximum value of the input data from C1. A regulation layer (dropout layer) is set after S1 to reduce overfitting. The next layer is the second convolutional layer C2 with 16 feature maps. The kernel size is 3 × 3, and the activation function is ReLU, which is the same as C1. C2 is followed by the second pooling layer, called S2, and the structure of S2 is the same as S1. Subsequently, a layer called the flatten layer is designed, which converts multi-dimensional data to a single-dimensional data vector. The vector is transferred to a full connection layer, which consists of 128 neurons with a ReLU activation function. The results from the full connection layer are transferred to the last output layer. The regression results are calculated through a SoftMax activation function. In the training process, the regression results are compared with actual results. The parameters in CNN are continuously adjusted through feedback until the error between the estimation and actual results reach the threshold value.

5. Experiment

The final structure of the established hybrid CNN model is described in Figure 5. As shown in the figure, the model comprises two parts, namely, KDE and CNN. The first part is the preprocessing of check-in data, in which KDE is conducted on the check-in data using a grid-based map. Subsequently, the entire area is divided into 1000 images, each with a pixel size of 18 × 18. The image is set as the input of the second part, and the retailer sales data are established in each image in order to train the CNN model. This section introduces the experimental results and compares the KDE-CNN model with other regression methods.

5.1. Kernel Density of Commercial Activity Points

A 400 m radius was set as the research circle in the kernel density method based on Zheng [40] and Wang [45]. The calculated kernel density was shown in a grid-based map. Figure 6 shows the estimated results.
Figure 6a shows the distribution of check-in data. Figure 6b shows the check-in data in a grid-based map, in which the value of each grid is the number of retailers that are located in the geographic unit. As shown in Figure 6b, the grids were set with five different colors that are based on their values. However, several blank grids existed around the red or orange grids, which indicated that the transition between the areas was unclear. This condition indicated that social media data lacked the information on population mobility, which caused the loss of population information in several areas. Figure 6c shows the KDE results. In this method, the values of blank grids were calculated based on nearby grids, which made the transition between the areas smooth. As shown in Figure 6c, the media data were concentrated in the center of Guiyang City. The kernel density map was overlapped with the retailer distribution map, and 2500 grids contained a high kernel density and high distribution density, the results were shown in Figure 6d.

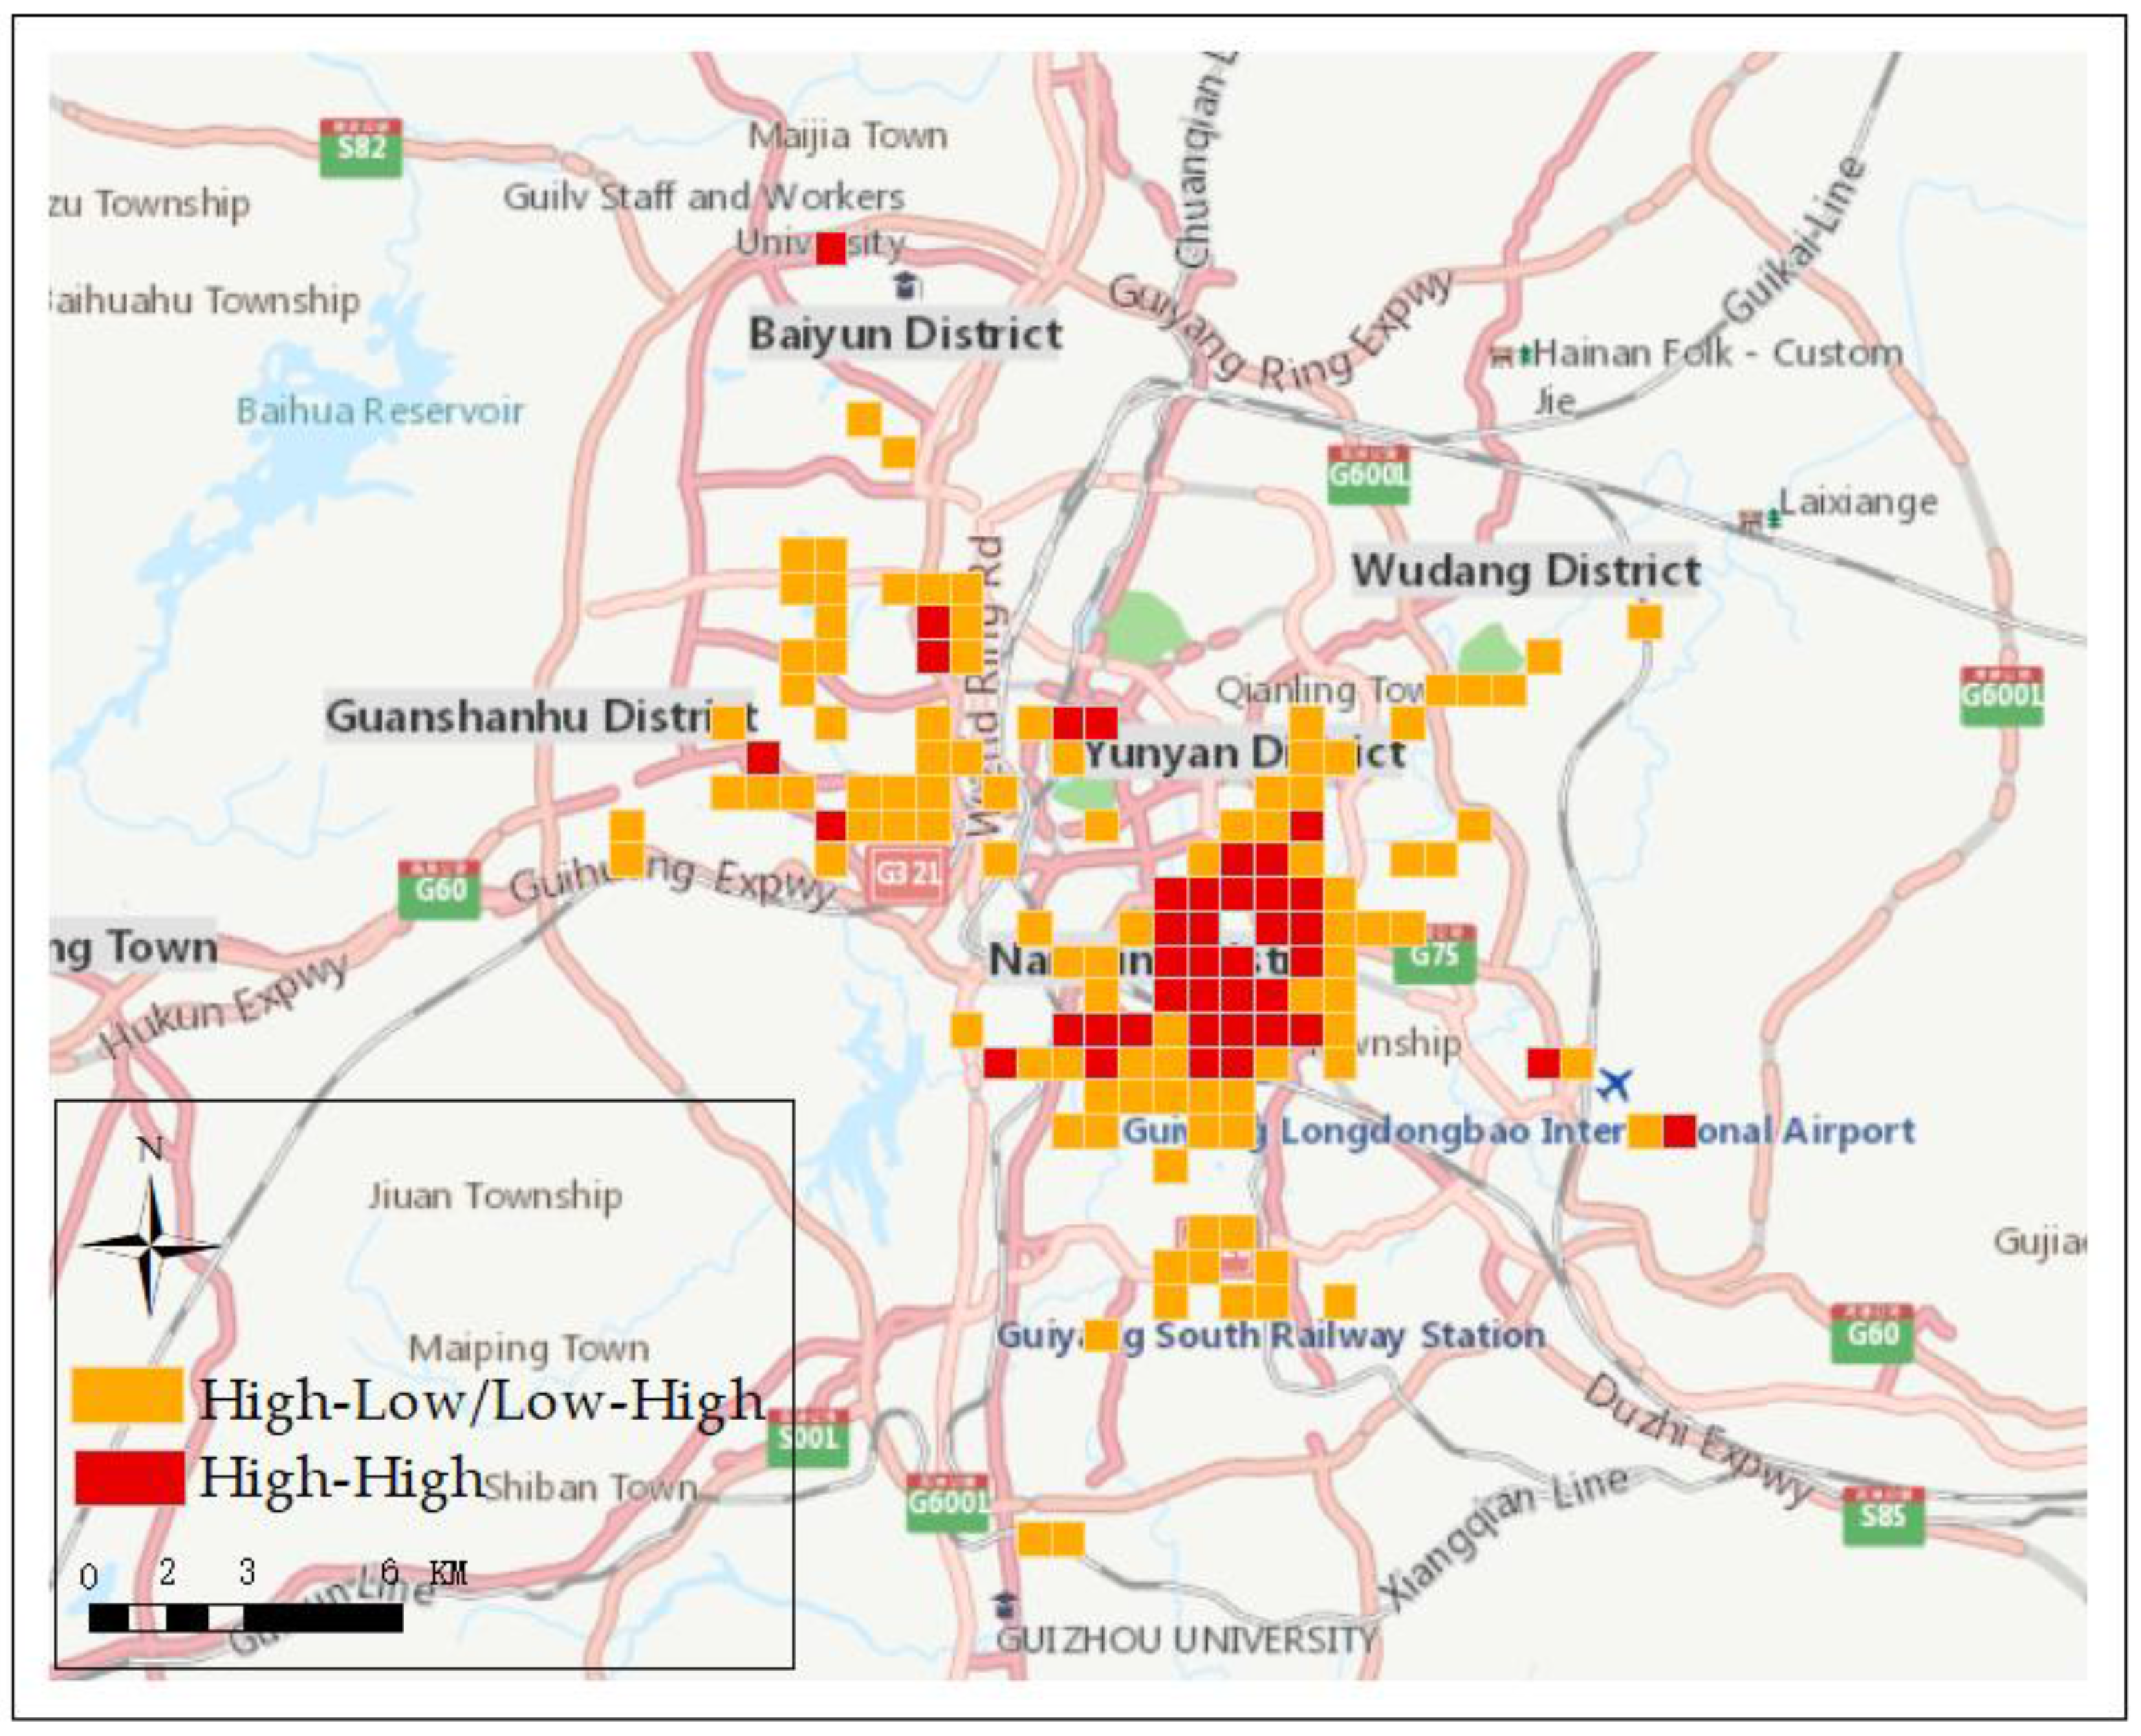
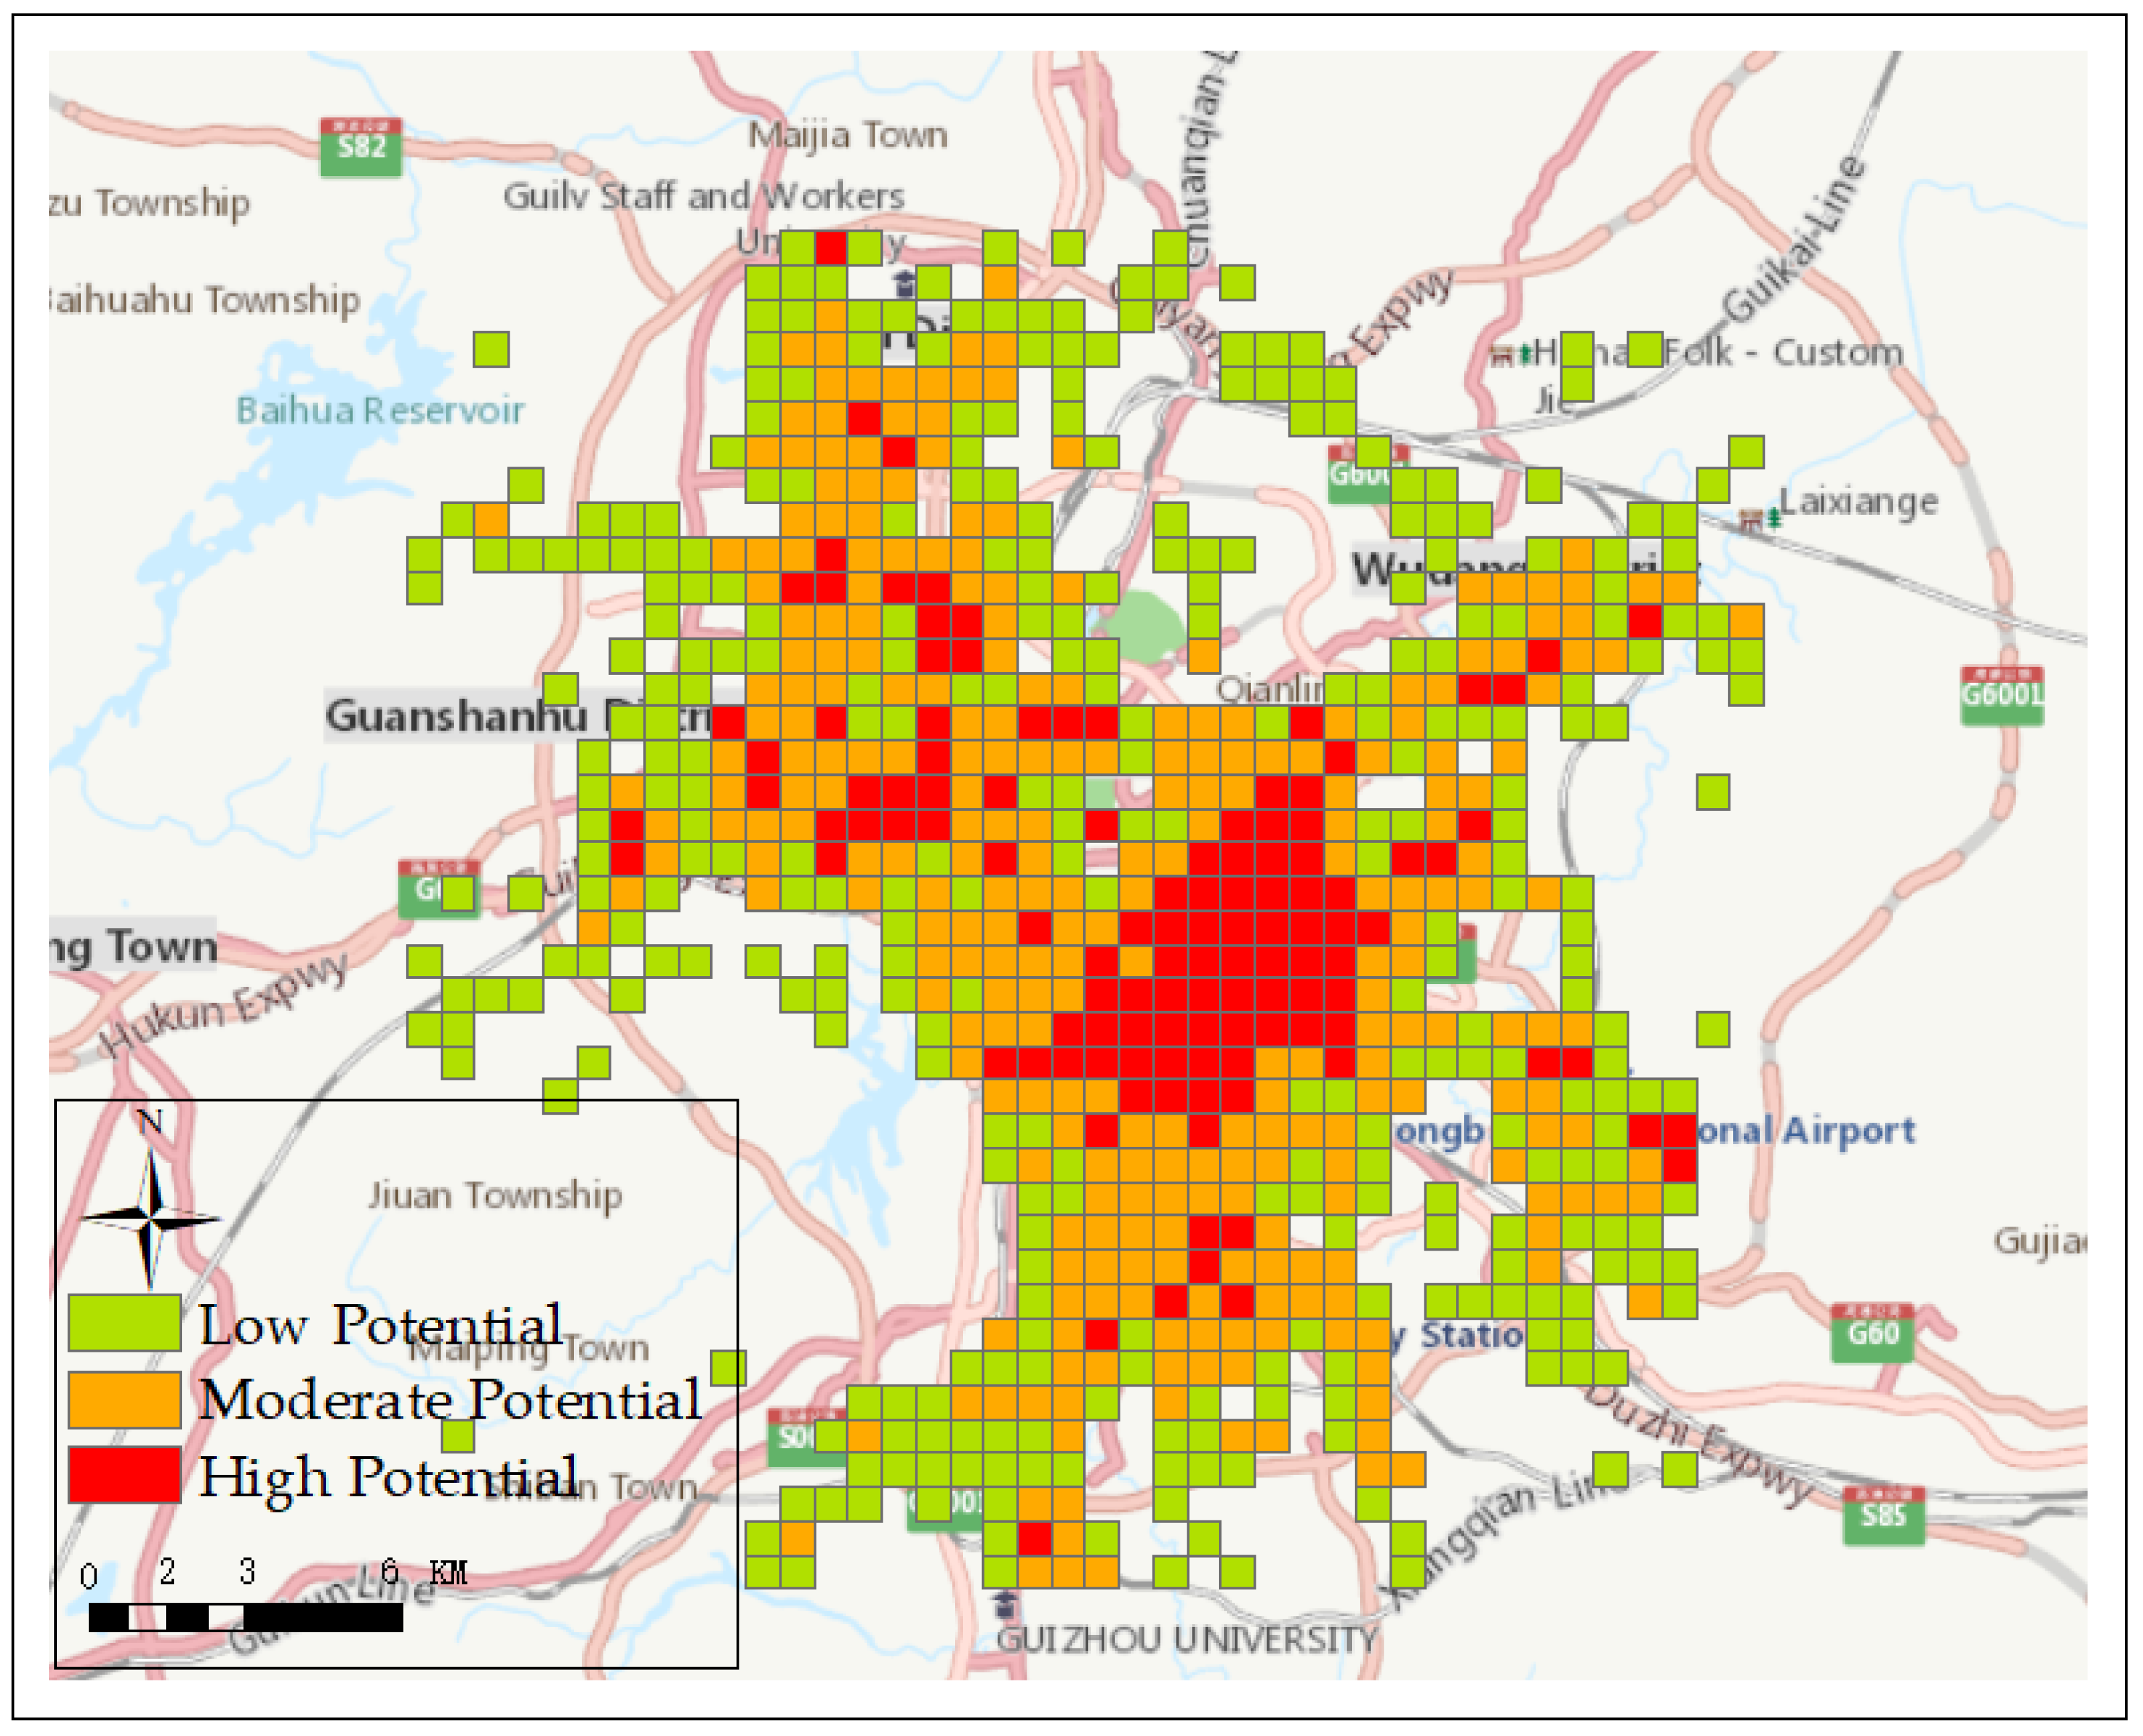
5.2. Market Potential Estimation and Sustainability Evaluation

After the different methods were compared, the KDE-CNN model was implemented in Guiyang City to show the estimated results from our method. The training dataset included 700 regions, in which the size of each region was 18 × 18 pixels. Each selected region as sample contained at least three FMCG retailers, and the sales of each region were also obtained. This process ensured that the sales data were closer than the market demand of potential in each region. The process is shown in Figure 7. As shown in Figure 7, the regions in (a) were the sample regions. The points represent the check-in data in each region, and their numbers in each grid were set as the input of KDE-CNN. The stars represent the retailers that are located in the region, and their total sales were set as the output of KDE-CNN. After the training process, the model was used to estimate the market potential of the target regions that contained the check-in data, such as (b), without retailers or plenty of retailers.
After the training process, the model was implemented in all the regions of Guiyang City. Figure 8 shows the estimated results. The grids were distinguished into three colors: green, orange, and red.
The red regions were the areas in which market demand was higher than the average sales ($10,000/month) and no retailer existed in the regions. This finding meant that some new retailers could be considered to locate in those regions. The orange regions were the areas in which market potential was over $7000/month more than the current sales of retailers. This finding indicated that the managers of the retailers considered the adjustment of their purchasing strategies to satisfy the market potential in their regions. Moreover, new retail shops were considered to open in several typical places. The green regions were the areas in which current sales were close to the market potential, which indicated that their sales strategy should not be changed.
As shown in Figure 8, the grids with high or moderate market potential showed a gathering together trend, which is a reflection of spatial auto-correlation. To evaluate the reliability of the estimated market potential, spatial auto-correlation analysis was conducted on the regions with high and moderate potential. Moran’s I was calculated based on the similarity of the estimated market potential between regions. The results are shown in Figure 9. The regions were divided into high-high regions, where the market potential in nearby regions was high, and low-high/high-low regions, where the market potential in nearby regions was close but with a slight difference.
The information on two regions are calculated in Table 3. The confidences of the two regions were more than 0.75 and 0.35–0.74, respectively. The results showed that approximately 40 regions were areas with high economic sustainability where the market potential and confidence were high. This finding indicated that investment in these regions caused considerable profits and avoided product losses.

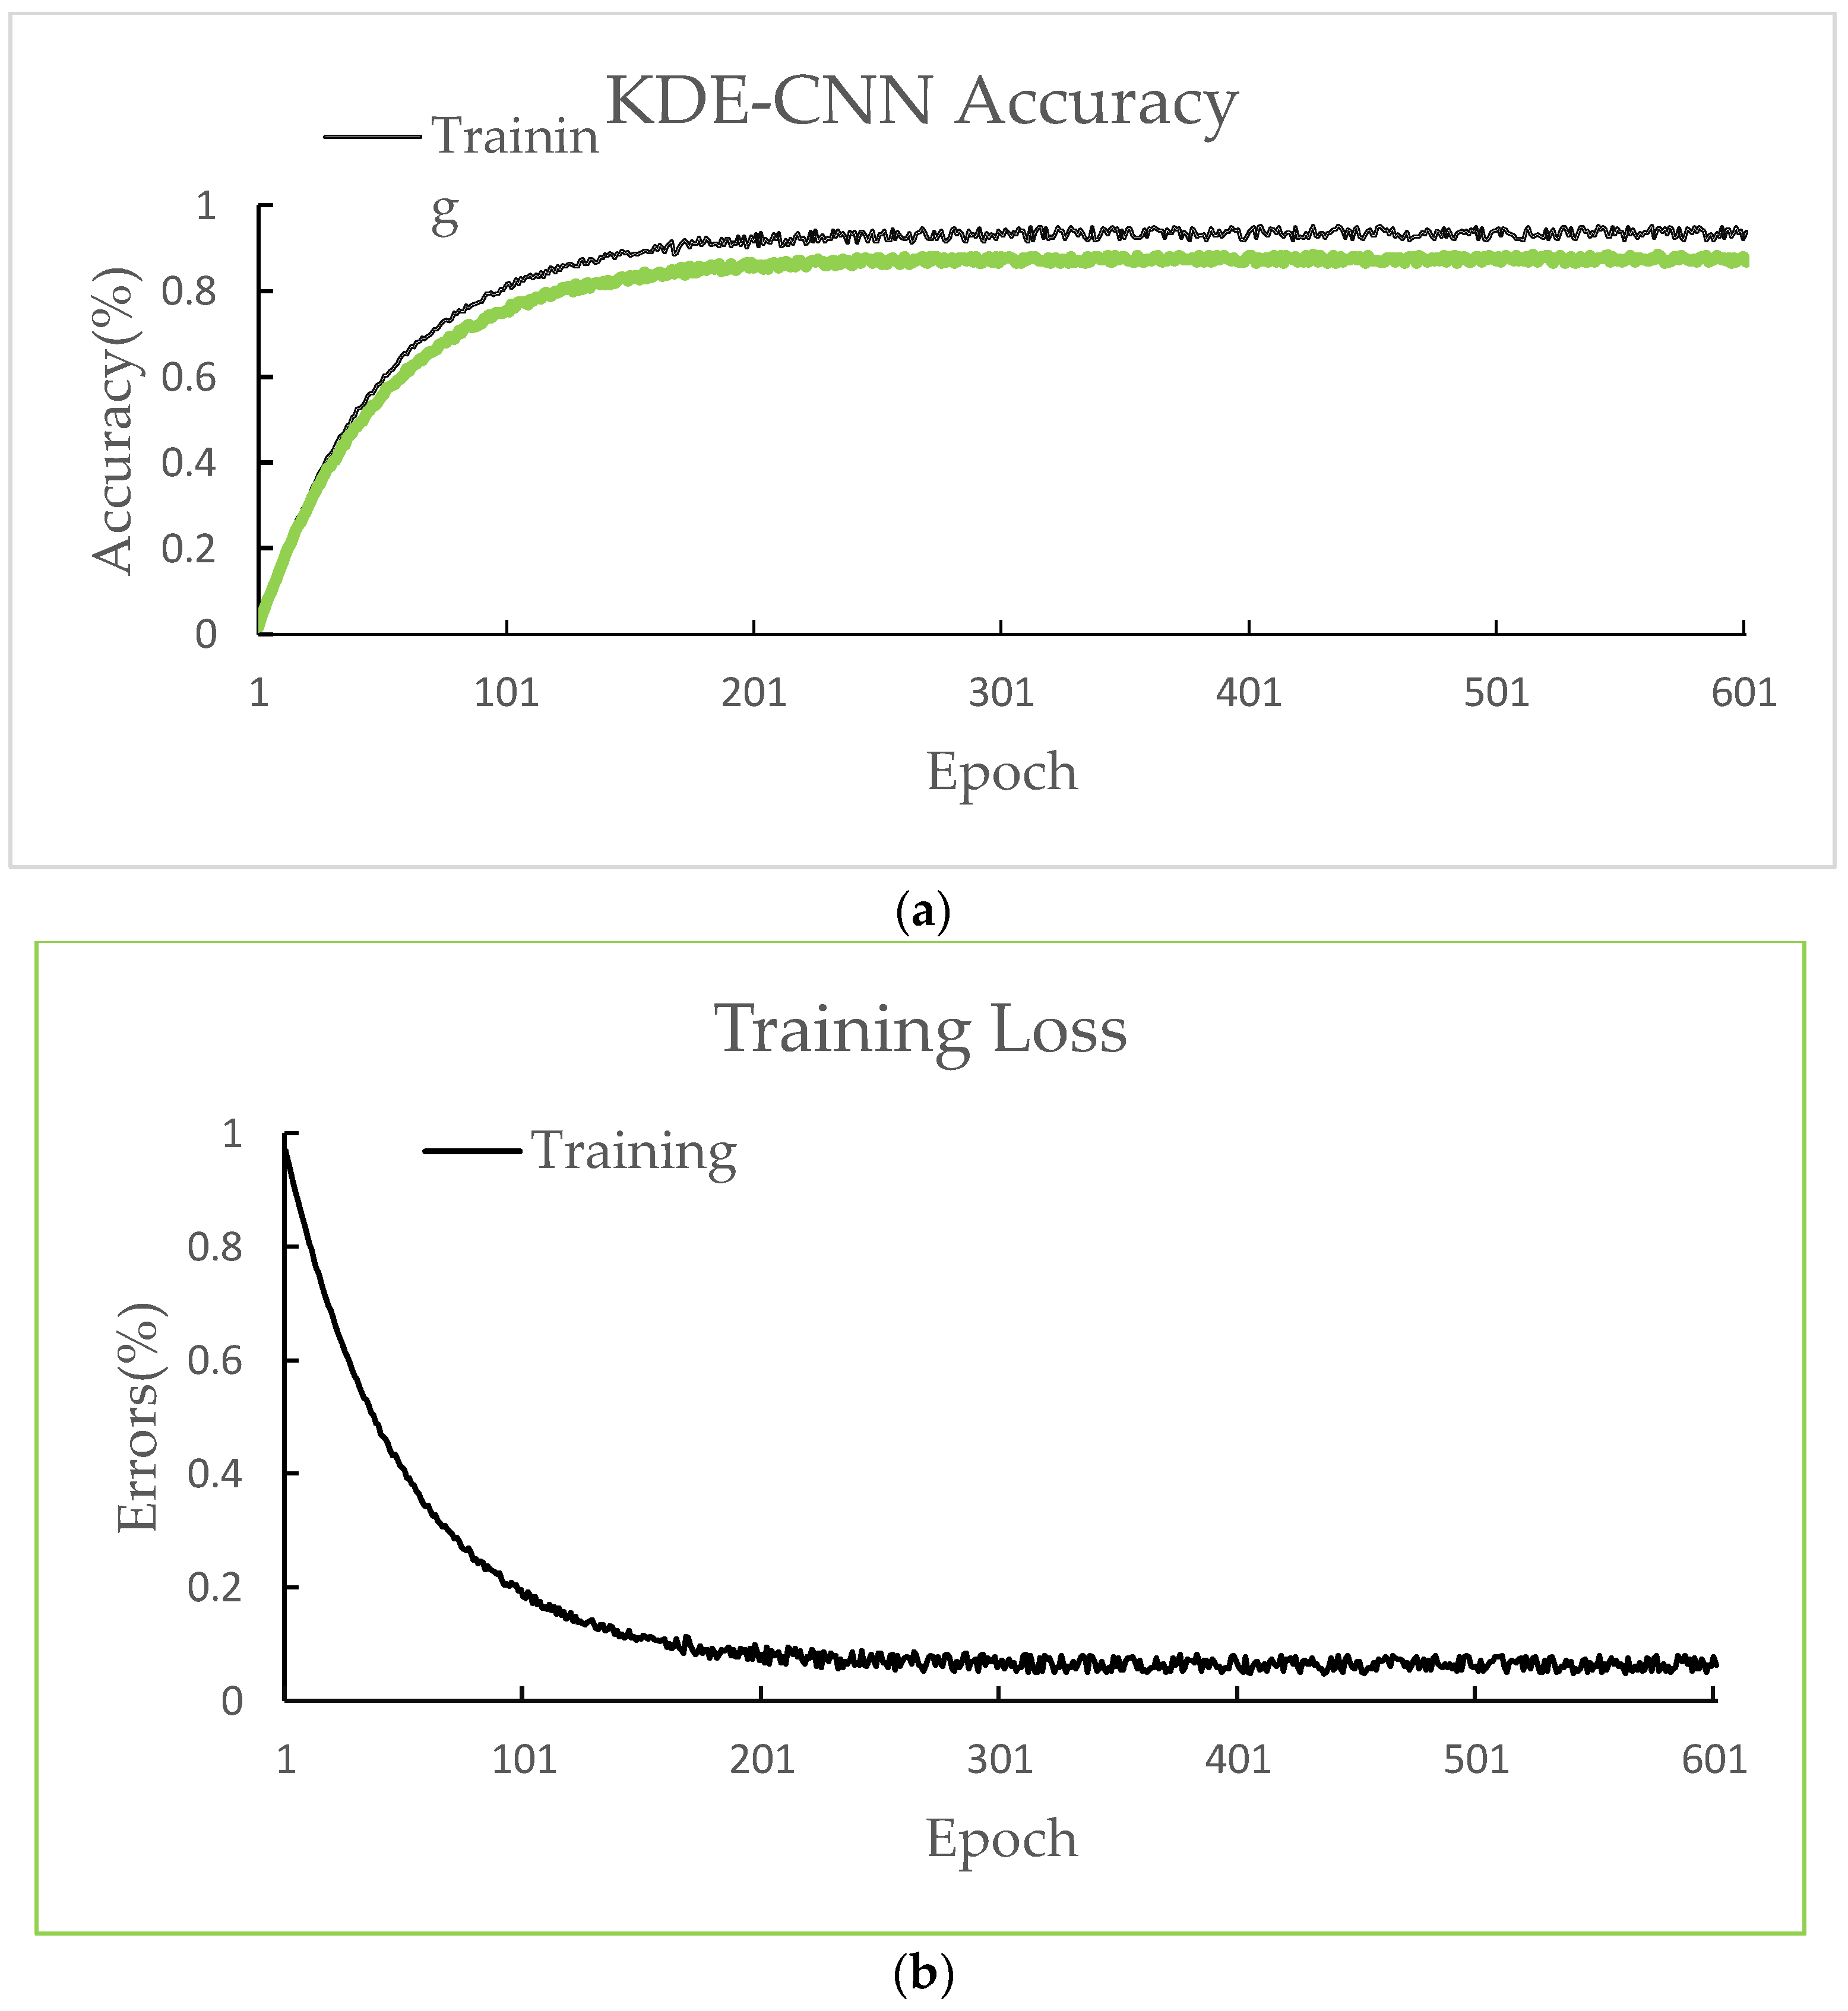
5.3. Accuracy Analysis and Comparison

Kernel density, which is a machine learning method, is widely used in spatial issues. To reflect the inflow characteristics of the population, kernel density was used to simulate the heat degree of consumer distribution in Guiyang. In our study, the values were fed in the CNN in order to estimate the market potential in different regions because the grid-based map was large to be the CNN input. In this way, the kernel density map was segmented into 1640 images. The size of each image was 18 × 18 pixels. A total of 1000 images were selected, with each image containing at least three retailers. This process ensured that the sales data effectively reflected the purchasing ability in each region. The samples were divided into two groups: a training group with 70% images and a test group with 30% images. The established CNN model was trained for 100 epochs with the training group. Subsequently, the trained CNN model was used to calculate the fitting error with the test group. Experimental models were implemented with MATLAB 2017 and Deep-Learning Tools. To evaluate the accuracy of the model, the goodness-of-fit concept was introduced, which was based on the similarity between the predicted and the actual values. The fitting statistic that was used in this study was RMSE. The greater the value, the closer their relationship will be. The formula is expressed, as follows:
R M S E = ( y * y ¯ ) 2 ( y y ¯ ) 2 ,
where y *   represents the real value and y ¯ represents the average value. For the ranges between 0 and 1, the closer to 1 the value is, the higher its fit degree will be. The closer to 0 the value is, the lower its fit degree will be.
When considering that epoch is one of the main influencing factors on accuracy, the accuracy of the model was compared under different numbers of layers. As shown in Figure 10a, a separate trend of accuracy on the training and test groups was determined with the increase of epoch. The accuracy of training and test was 0.75 when the epoch was 1. The accuracy of training and test rapidly increased until the epoch value reached 320. The training accuracy slowly increased when the epoch reached 320, and the test accuracy remained nearly the same, which was approximately 92.8%. Figure 10b shows the training loss in the training process. The training loss rapidly decreased from 0.38 to 0.05 when the epoch increased to 320. The training loss slowly decreased with the continuous increase of the epoch. The increase of epoch indicated that considerable computation time was required for the training process. An epoch of 320 was selected in the KDE-CNN model.
The accuracy and the KDE-CNN results were calculated after the training and test processes under 320 epochs. The RMSE in the KDE-CNN model was 0.065. The results showed that the established model effectively passed the cross-validation. The accuracy and advantages of the KDE-CNN model were verified. The comparison results between the KDE-CNN method and several other methods, which are frequently used in estimation and prediction tasks, are shown in Table 4.
The RMSE of Arima and Sarima were 0.275 and 0.301, respectively. The RMSE of OLS was 0.162, which indicated that the accuracy of OLS was relatively lower than the deep-learning method, but higher than the Arima method. The KDE-CNN method was compared with the CNN method, in which the input was not dealt with in kernel estimation. As shown in the results in Table 4, the accuracy of KDE-CNN was higher than the traditional CNN method. Thus, the KDE process better reflected the consumer distributions with social media data.

6. Conclusions

The concept of sustainable development requires the appropriate allocation of resources to satisfy the demand of our society. The estimation of market demand is recognized as an important concern in many business domains. Traditional methods have constantly focused on the macroscopic scale and they have not provided practical business strategies for retail shops. In this study, a hybrid model was proposed to estimate the economic sustainability in different regions. With the combination of CNN and KDE, a new concept was introduced to estimate market potential using deep-learning technologies. Subsequently, a spatial auto-correlation method was proposed to evaluate the confidence of the estimated market potential. Regions with high potential and high confidence were considered as the places with high economic sustainability. The results can provide suggestions for product distribution in the retail industry and for the site selection of retail shops. The main contributions of this paper are summarized as follows:
(1) A hybrid CNN model was proposed to estimate the market potential, which is a new application of deep learning method to solve economic problems. When considering that social media data do not reflect the mobility of consumers, the KDE method fills the information loss of social media data.
(2) This study introduced Moran’s I index to evaluate the degree of economic sustainability in different regions. The results will aid business managers in modifying their sales strategies to satisfy consumer demands in different regions, avoid risks, and to improve their profits.
Insufficient social economic data frequently make it difficult for new retail shops to estimate the actual market demand and guide their purchasing strategies to ensure economic sustainability. In this study, two factors, namely, market demand quantity and market demand stability, were used for retail shops. Social media “check-in data” were recommended for retail shops to estimate the market demand of nearby regions and were proven effective to reveal the market potential. When considering that social media data are easy to obtain, retail managers can use the data set to estimate the market demand and to determine their advertising area and purchasing quantity to avoid profit loss. The spatial relationship, including promotion and competition, can be evaluated through the CNN-KDE model, in which the market stability of each region can be distinguished. Business managers can easily select the best sites and key sales area by combining the estimation of market demand and stability.
Several limitations also existed in this study. In the actual situation, the service areas of each retail shops were different. The influence area of a supermarket was obviously larger than that of a small convenience store. However, the service area was difficult to distinguish, and thus a commonly used service area ( 400 × 400   m 2 ) was used in this study. The service area should be distinguished and considered in order to improve the estimation accuracy. Another important limitation in this study was that the information on social media data was inadequately used. The spatial locations of social media data were only considered and the semantic information, time, and personal information were ignored, which were available and valuable information. To improve the study results, much information should be considered and the spatial-temporal relationship between social media data and region market potential should be determined. Numerous factors, such as road connectivity, weather, and purchasing ability, should be added to each geographic cell to obtain accurate and precise results.

Author Contributions

L.W. and H.F. conceived and designed the main concept and experiments, L.W. and Y.W. performed the experiments, and L.W. wrote the paper.

Funding

This research was funded by the National Natural Science Foundation of China (Grant Nos. 41471323, 91746206,41661086), the National Key Research and Development Program of China (Grant No. 2017YFB0503601), and the Science and Technology Development Project of Guizhou Province Tobacco Corporation of China National Tobacco Corporation (Contract No. 201407).

Acknowledgments

The authors would like to thank Li Chuanyong, Zeng Jia, Zhao Cheng, and Yang Mei for the data collection in the experiments. Special thanks to Kang Zhao for his kindly help of this paper.

Conflicts of Interest

The authors declare no conflict of interest.

References

  1. Mcneill, L.S. The influence of culture on retail sales promotion use in chinese supermarkets. Australas. Mark. J. 2006, 14, 34–46. [Google Scholar] [CrossRef]
  2. İşlek, İ.; Öğüdücü, Ş.G. A Retail Demand Forecasting Model Based on Data Mining Techniques. In Proceedings of the IEEE International Symposium on Industrial Electronics, Buzios, Brazil, 3–5 June 2015; pp. 55–60. [Google Scholar]
  3. Li, Y.; Liu, L. Assessing the impact of retail location on store performance: A comparison of wal-mart and kmart stores in cincinnati. Appl. Geogr. 2012, 32, 591–600. [Google Scholar] [CrossRef]
  4. O’Kelly, M.E. Trade-area models and choice-based samples: Methods. Environ. Plan. A 1999, 31, 613–627. [Google Scholar] [CrossRef]
  5. Adnan, M.; Leak, A.; Longley, P. A geocomputational analysis of twitter activity around different world cities. ISPRS Int. J. Geo-Inf. 2014, 17, 145–152. [Google Scholar] [CrossRef]
  6. Sun, Y. Investigating “locality” of intra-urban spatial interactions in new york city using foursquare data. ISPRS Int. J. Geo-Inf. 2016, 5, 43. [Google Scholar] [CrossRef]
  7. Laylavi, F.; Rajabifard, A.; Kalantari, M. A multi-element approach to location inference of twitter: A case for emergency response. ISPRS Int. J. Geo-Inf. 2016, 5, 56. [Google Scholar] [CrossRef]
  8. Granell, C.; Ostermann, F.O. Beyond data collection: Objectives and methods of research using vgi and geo-social media for disaster management. Comput. Environ. Urban Syst. 2016, 59, 231–243. [Google Scholar] [CrossRef]
  9. Qingwu, H.U.; Ming, W.; Qingquan, L.I. Urban hotspot and commercial area exploration with check-in data. Acta Geod. Cartogr. Sin. 2014, 43, 314–321. [Google Scholar]
  10. Qu, Y.; Zhang, J. Trade area analysis using user generated mobile location data. In Proceedings of the International Conference on World Wide Web, Rio de Janeiro, Brazil, 13–17 May 2013; pp. 1053–1064. [Google Scholar]
  11. Wang, Y.; Jiang, W.; Liu, S.; Ye, X.; Wang, T. Evaluating trade areas using social media data with a calibrated huff model. ISPRS Int. J. Geo-Inf. 2016, 5, 112. [Google Scholar] [CrossRef]
  12. Huff, D.L. Defining and estimating a trading area. J. Mark. 1964, 28, 34–38. [Google Scholar] [CrossRef]
  13. Choi, T.M.; Chiu, C.H. Mean-downside-risk and mean-variance newsvendor models: Implications for sustainable fashion retailing. Int. J. Prod. Econ. 2012, 135, 552–560. [Google Scholar] [CrossRef]
  14. Mayer, H.; Knox, P.L. Slow cities: Sustainable places in a fast world. J. Urban Aff. 2006, 28, 321–334. [Google Scholar] [CrossRef]
  15. Zarandi, M.H.F.; Mansour, S.; Hosseinijou, S.A.; Avazbeigi, M. A material selection methodology and expert system for sustainable product design. Int. J. Adv. Manuf. Technol. 2011, 57, 885–903. [Google Scholar] [CrossRef]
  16. Altug, M.S.; Aydinliyim, T. Counteracting strategic purchase deferrals: The impact of online retailers’ return policy decisions. Soc. Sci. Electron. Publ. 2014, 18, 376–392. [Google Scholar] [CrossRef]
  17. Bernstein, F.; Federgruen, A. Decentralized supply chains with competing retailers under demand uncertainty. Manag. Sci. 2005, 51, 18–29. [Google Scholar] [CrossRef]
  18. Lippman, S.A.; Mccardle, K.F. The competitive newsboy. Oper. Res. 1997, 45, 54–65. [Google Scholar] [CrossRef]
  19. Chien, C.F.; Chen, Y.J.; Peng, J.T. Manufacturing intelligence for semiconductor demand forecast based on technology diffusion and product life cycle. Int. J. Prod. Econ. 2010, 128, 496–509. [Google Scholar] [CrossRef]
  20. Anderson, E.W.; Fornell, C.; Lehmann, D.R. Customer satisfaction, market share, and profitability: Findings from sweden. J. Mark. 1994, 58, 53–66. [Google Scholar] [CrossRef]
  21. Rabinovich, E.; Rungtusanatham, M.; Laseter, T.M. Physical distribution service performance and internet retailer margins: The drop-shipping context. J. Oper. Manag. 2008, 26, 767–780. [Google Scholar] [CrossRef]
  22. Tokatli, N. Global sourcing: Insights from the global clothing industry—The case of ZARA, a fast fashion retailer. J. Econ. Geogr. 2008, 8, 21–38. [Google Scholar] [CrossRef]
  23. Oppewal, H.; Holyoake, B. Bundling and retail agglomeration effects on shopping behavior. J. Retail. Consum. Serv. 2004, 11, 61–74. [Google Scholar] [CrossRef]
  24. KhosrowDehnad. Density estimation for statistics and data analysis. Technometrics 2012, 29, 495. [Google Scholar]
  25. Paralikas, J.; Fysikopoulos, A.; Pandremenos, J.; Chryssolouris, G. Product modularity and assembly systems: An automotive case study. CIRP Ann.-Manuf. Technol. 2011, 60, 165–168. [Google Scholar] [CrossRef]
  26. Wang, S.Y.; Wang, L.; Liu, M.; Xu, Y. An effective estimation of distribution algorithm for solving the distributed permutation flow-shop scheduling problem. Int. J. Prod. Econ. 2013, 145, 387–396. [Google Scholar] [CrossRef]
  27. Korpusik, M.; Sakaki, S.; Chen, Y.Y. Recurrent Neural Networks for Customer Purchase Prediction on Twitter; ACM Conference on Recommender Systems (RecSys). 2016. Available online: http://ceur-ws.org/Vol-1673/paper9.pdf (accessed on 28 May 2018).
  28. Kalogirou, S.A.; Bojic, M. Artificial neural networks for the prediction of the energy consumption of a passive solar building. Energy 2000, 25, 479–491. [Google Scholar] [CrossRef]
  29. Marvuglia, A.; Messineo, A. Using recurrent artificial neural networks to forecast household electricity consumption. Energy Procedia 2012, 14, 45–55. [Google Scholar] [CrossRef]
  30. Pitts, W. A logical calculus of the ideas immanent in nervous activity. Bull. Math. Biol. 1990, 52, 99. [Google Scholar]
  31. González, A.G. Artificial intelligence and soft computing: Behavioral and cognitive modeling of the human brain, amit konar. J. Chemom. 2001, 15, 685–687. [Google Scholar] [CrossRef]
  32. Lecun, Y.; Bengio, Y.; Hinton, G. Deep learning. Nature 2015, 521, 436. [Google Scholar] [CrossRef] [PubMed]
  33. Xu, M.; Fang, H.; Lv, P.; Cui, L.; Zhang, S.; Zhou, B. D-stc: Deep learning with spatio-temporal constraints for train drivers detection from videos. Pattern Recognit. Lett. 2017. [Google Scholar] [CrossRef]
  34. Chen, Y.; Jiang, H.; Li, C.; Jia, X.; Ghamisi, P. Deep feature extraction and classification of hyperspectral images based on convolutional neural networks. IEEE Trans. Geosci. Remote Sens. 2016, 54, 6232–6251. [Google Scholar] [CrossRef]
  35. Françoislavet, V.; Taralla, D.; Ernst, D.; Fonteneau, R. Deep reinforcement learning solutions for energy microgrids management. In Proceedings of the European Workshop on Reinforcement Learning (EWRL 2016), Barcelona, Spain, 3–4 December 2016. [Google Scholar]
  36. Zeiler, M.D.; Fergus, R. Visualizing and understanding convolutional networks. In Proceedings of the European Conference on Computer Vision, Zurich, Switzerland, 6–12 September 2014; pp. 818–833. [Google Scholar]
  37. Szegedy, C.; Toshev, A.; Erhan, D. Deep neural networks for object detection. Adv. Neural Inf. Process. Syst. 2013, 26, 2553–2561. [Google Scholar]
  38. Triana, N.; Cerquera, A. Computer-aided detection of microcalcifications in digital mammograms to support early diagnosis of breast cancer. In Proceedings of the V International Work-Conference on the Interplay Between Natural and Artificial Computation, Mallorca, Spain, 10–14 June 2013; pp. 293–302. [Google Scholar]
  39. Ashiquzzaman, A.; Tushar, A.K. Handwritten arabic numeral recognition using deep learning neural networks. In Proceedings of the IEEE International Conference on Imaging, Vision & Pattern Recognition, Dhaka, Bangladesh, 13–14 February 2017; pp. 1–4. [Google Scholar]
  40. Zhang, J.; Zheng, Y.; Qi, D. Deep spatio-temporal residual networks for citywide crowd flows prediction. arXiv, 2016; arXiv:1610.00081. [Google Scholar]
  41. Anderson, T.K. Kernel density estimation and k-means clustering to profile road accident hotspots. Accid. Anal. Prev. 2009, 41, 359. [Google Scholar] [CrossRef] [PubMed]
  42. Tobler, W.R. A computer movie simulating urban growth in the detroit region. Econ. Geogr. 1970, 46, 234–240. [Google Scholar] [CrossRef]
  43. Mikelbank, B.A. Quantitative geography: Perspectives on spatial data analysis, by a. S. Fotheringham, c. Brunsdon, and m. Charlton. Geogr. Anal. 2001, 33, 370–372. [Google Scholar] [CrossRef]
  44. Cai, X.J.; Zhi-Feng, W.U.; Cheng, J. Analysis of road network pattern and landscape fragmentation based on kernel density estimation. Chin. J. Ecol. 2012, 31, 158–164. [Google Scholar]
  45. Wang, L.; Fan, H.; Gong, T. The consumer demand estimating and purchasing strategies optimizing of fmcg retailers based on geographic methods. Sustainability 2018, 10, 466. [Google Scholar] [CrossRef]
Figure 1. Population mobility.
Sustainability 10 01762 g001
Figure 2. Location and boundary of Guiyang.
Sustainability 10 01762 g002
Figure 3. Comparison of the quadrat sampling and KDE methods: (a) results of the quadrat sampling method, and (b) results of the KDE method
Sustainability 10 01762 g003
Figure 4. Structure of convolutional neural network (CNN). C1 and C2 represent the convolutional layers, and S1 and S2 represent the pooling layers.
Sustainability 10 01762 g004
Figure 5. Final structure of the proposed kernel density estimation KDE-CNN model.
Sustainability 10 01762 g005
Figure 6. Comparison between the KDE and normal results: (a) distribution of mobile check-in data, (b) actual counts of check-in data in each unit, and (c) KDE results of check-in data, (d) Kernel Density analysis results of check-in data
Sustainability 10 01762 g006aSustainability 10 01762 g006b
Figure 7. Training process of KDE-CNN. (a) Sample regions with original check-in data and retail shops; (b) Estimation results through KDE-CNN.
Sustainability 10 01762 g007
Figure 8. Estimated results of the entire city. The red regions are places with high market potential, orange regions are places with moderate market potential, and green regions are places with low potential.
Sustainability 10 01762 g008
Figure 9. Evaluation of market potential confidence. Red regions are places with high confidence, and orange regions are places with moderate confidence.
Sustainability 10 01762 g009
Figure 10. Accuracy of the established KDE-CNN model: (a) accuracy in the training and test processes with the increase of epoch; and, (b) training losses with the increase of epoch.
Sustainability 10 01762 g010
Table 1. Examples of retail data.
Retail IDNameTypesLonLatSales (US Dollars/Month)
54116864Small supermarketHualian Supermarket106.71726.60568,152
54116360Small supermarket Yonghui Supermarket106.71526.58341,516
54127706Chain convenience storeHanlejia 24 h chain store106.71926.57118,196
54130581GroceriesYoujia Grocery106.69526.3357289
Table 2. Description of data.
Data TypesDescriptionData VolumeTimeSource
Media dataWeb check-in data Section of users75,000+2016Sina Weibo API
Retailer LocationsLongitude and latitude of retailers56142016Local Cooperative Enterprises
Retailer SalesFMCG sales of each retailer56142016Local Cooperative Enterprises
Basic mapVector map data of GuiyangEntire City2016OpenStreetMap (OSM)
Table 3. Structure of each layer in the CNN.
ColorsNumberMarket PotentialConfidence
Red40H-H>0.75
Orange100H-L/L-H0.35–0.74
Table 4. Comparison among different methods.
ModelRMSE
Arima0.275
SArima0.301
OLS(ordinary least squares)0.162
CNN0.117
KDE-CNN(Ours)0.065

