Article

Land Suitability and Insurance Premiums: A GIS-based Multicriteria Analysis Approach for Sustainable Rice Production

1
Graduate School of Life and Environmental Sciences, University of Tsukuba, Tsukuba 305-8572, Japan
2
Faculty of Life and Environmental Sciences, University of Tsukuba, Tsukuba 305-8572, Japan
*
Author to whom correspondence should be addressed.
Sustainability 2018, 10(6), 1759; https://doi.org/10.3390/su10061759
Submission received: 4 April 2018 / Revised: 24 May 2018 / Accepted: 25 May 2018 / Published: 27 May 2018

Abstract

:
The purpose of this research is to develop a land suitability model for rice production based on suitability levels and to propose insurance premiums to obtain maximum returns based on the harvest index and subsidy dependence factor for the marginal and moderately suitable lands in the northern part of Bangladesh. A multicriteria analysis was undertaken and a rice land suitability map was developed using geographical information system and analytical hierarchy process. The analysis identified that 22.74% of the area was highly suitable, while 14.86% was marginally suitable, and 28.54% was moderately suitable for rice production. However, 32.67% of the area, which was occupied by water bodies, rivers, forests, and settlements, is permanently not suitable; 1.19% is presently not suitable. To motivate low-quality land owners to produce rice, there is no alternative but to provide protection through crop insurance. We suggest producing rice up to marginally suitable lands to obtain support from insurance. The minimum coverage is marginal coverage (70%) to cover the production costs, while the maximum coverage is high coverage (90%) to enable a maximum return. This new crop insurance model, based on land suitability can be a rational support for owners of different quality land to increase production.

1. Introduction

Bangladesh is ranked fifth among the countries most exposed to natural disasters, including floods, cyclones, and droughts. The production losses of major cereal crops due to natural disasters over the past 29 years have been equivalent to an average of 6.4% of the national crop production every year [1]. The Bangladesh Climate Change Strategy and Action Plan 2009 has identified “insurance” as an effective disaster management tool and one of the 37 programs that various ministries/agencies plan to undertake to combat the adverse effects of climate change in Bangladesh [2]. A key challenge for the poor farmers of Bangladesh is the management of crop damage risk. One potential strategy to cope with the devastating effects of crop damage is to introduce a crop insurance scheme. The continuing growth of the population and consumption mean that the universal demand for food will increase for at least another 40 years [3]. Agriculture in Bangladesh is already under pressure, both from large and increasing demands for food as well as from obstacles related to the degradation of agricultural land [4]. Therefore, an increase in production with less land has become a global challenge [5]. In this regard, a land suitability analysis (LSA) could be the most appropriate approach to evaluate and fulfill the required criteria for these facilities.
Farmers throughout developing countries face multiple risks in agricultural production [6]. Two major risks are of concern to the agricultural sector: price risk caused by potential volatility in prices and production risk resulting from uncertainty in the levels of production that primary producers can achieve from their current activities [7]. It is estimated that during a major disaster year, occurring once every 100 years, 23% of the national paddy and wheat production is lost due to adverse weather. Due to the scarcity of affordable and suitable risk-management tools, and exposure to adverse shocks, low-income households may be forced to reduce food consumption, which threatens their economic and human development prospects [8]. Agricultural production can be increased if the uncertainty of nature and the risks associated with it can be managed in a better way. Crop insurance can play a vital role as an alternative ex ante risk coping instrument to enable poor farmers in developing economies to cope with weather-related production risks. They may significantly contribute to poverty alleviation [9,10]. The National Adaptation Program of Action, prepared by the Ministry of Environment and Forest (MoEF), suggests exploring options for spreading natural disaster risks by investigating the potential of crop insurance markets to cope with the increased risk of crop damage [11].
Crop insurance has not been successful in developing countries based on standard commercial criteria, and the experience in Bangladesh is also not good. In developing countries where the poorest parts of the population often find themselves in a spiral of recurrent damages due to natural calamities, disaster insurance schemes fail to earn sufficient premium incomes to cover payouts as well as administrative costs [12,13,14,15,16]. Data availability is the pivotal issue in designing and implementing a successful crop insurance program in developing countries [17]. A large body of theoretical and pragmatic literature advises that uninsured agricultural risk causes farmers to refrain from advancing in agricultural production. Recent experimental evidence in India has shown that once farmers have access to some form of insurance against agricultural risk, they are more motivated to increase their investment in higher-return, higher-risk investments [18]. The government of India is very active in promoting agricultural insurance under the “Pradhan Mantri Fasal Bima Yojana” through large subsidies, while in Bangladesh, insurance is not a prominent feature of agricultural development strategies or policies [19].
The LSA is a tool that is used to identify the most suitable places for locating future land uses [20]. It identifies the most appropriate spatial patterns for future land uses according to specific requirements, preferences, or predictors of some activity [21]. The LSA is a spatial multicriteria decision analysis (MCDA) process in which several elements are evaluated to conform to the necessities of stakeholders and ecological issues. Multicriteria analysis using a geographical information system (GIS) has the advantages of supporting the decision-making process in a systematic manner and reflecting a transparent decision using thematic maps [22]. This multidisciplinary approach has diverse applications in spatial analyses for land use [23,24] and is found to be a prevailing integrated method for complex land use planning [25,26]. A variety of MCDA methods can be used in a GIS setting, such as weighted linear combinations (WLC), Boolean overlays, ordered weighted averaging, analytical hierarchy process (AHP), and multiple-objective land allocation [27]. Bangladesh has a mixed land use pattern; hence, experts’ opinions in LSA studies are very important [28]. The AHP is also a multicriteria decision-making tool that gathers the spatial analysis functions of GIS in a land suitability analysis to identify the suitable sites [29]. The AHP is the most widely used MCDA method that has the flexibility to include experts’ decisions in a systematic manner that decomposes the problem into a hierarchy of subproblems to evaluate the problem more easily and subjectively [30]. The subjective evaluations are converted into numerical values that are ranked according to a numerical scale [31]. Thus, this study uses AHP as a multicriteria decision analysis tool with spatial solutions in a geographic information system and conducts a land suitability analysis to understand the risk of production in the moderately and marginally suitable lands.
Agricultural insurance solutions are an important tool for farmers to manage risks [32]. Designing a cost-effective insurance product that helps farmers to manage risks and launching persistent insurance markets for small-holder farmers are challenging propositions in Bangladesh. Farms are scattered and small in size, and the quality of land is also different. The lower quality land owners suffer more when production is lower, prices fall, or crops are damaged by natural calamities in comparison to the other farmers. There are significant numbers of crop insurance products globally, but none of them coincide directly with the Bangladesh agriculture context, and no insurance products consider the quality or suitability of land for a specific crop. Almost all crop insurance considers the weather and, at times, natural calamities. Considering the limitations of data, knowledge, the awareness of the farmers, costs, and experience, this research attempts to propose a new insurance premium model using land suitability, harvest index, and the subsidy dependence factor through community involvement. To the best of our knowledge, no research has been undertaken on crop insurance premiums based on land suitability, harvest index, and subsidy dependence factors.
Therefore, the objective of this study was to first identify the suitable areas for rice production in poverty and risk prone areas, and second, to propose a crop insurance premium model based on land suitability, harvest index, and subsidy dependence factors.

2. Methodology

2.1. Study Area and Data Collection

The study was conducted in the Rangpur, Lalmonirhat, and Kurigram districts of Rangpur Division, which are in the Teesta and Dharla river plains and are known as poverty-prone risk areas (Figure 1). Approximately 47.23% of the population lives below the upper poverty line, while the national average is 24.3% [33]. This region has an area of 5879.60 km2 and is located in the northern part of Bangladesh between 25°18′ and 26°33′ N latitudes and 88°56′ and 89°54′ E longitudes.
The area consists of 19 administrative units in 3 districts, with Rangpur, Lalmonirhat, and Kurigram having an overall population of 6.3 million [34]. The elevations range from 5 to 30 m above sea level. Agriculture is the main source of income for the population. Based on weather data, the minimum and maximum mean annual temperatures vary between 8.47 and 36.3 °C. The annual average rainfall recorded is 1932–2931 mm, with high humidity at 41%–77% [35].
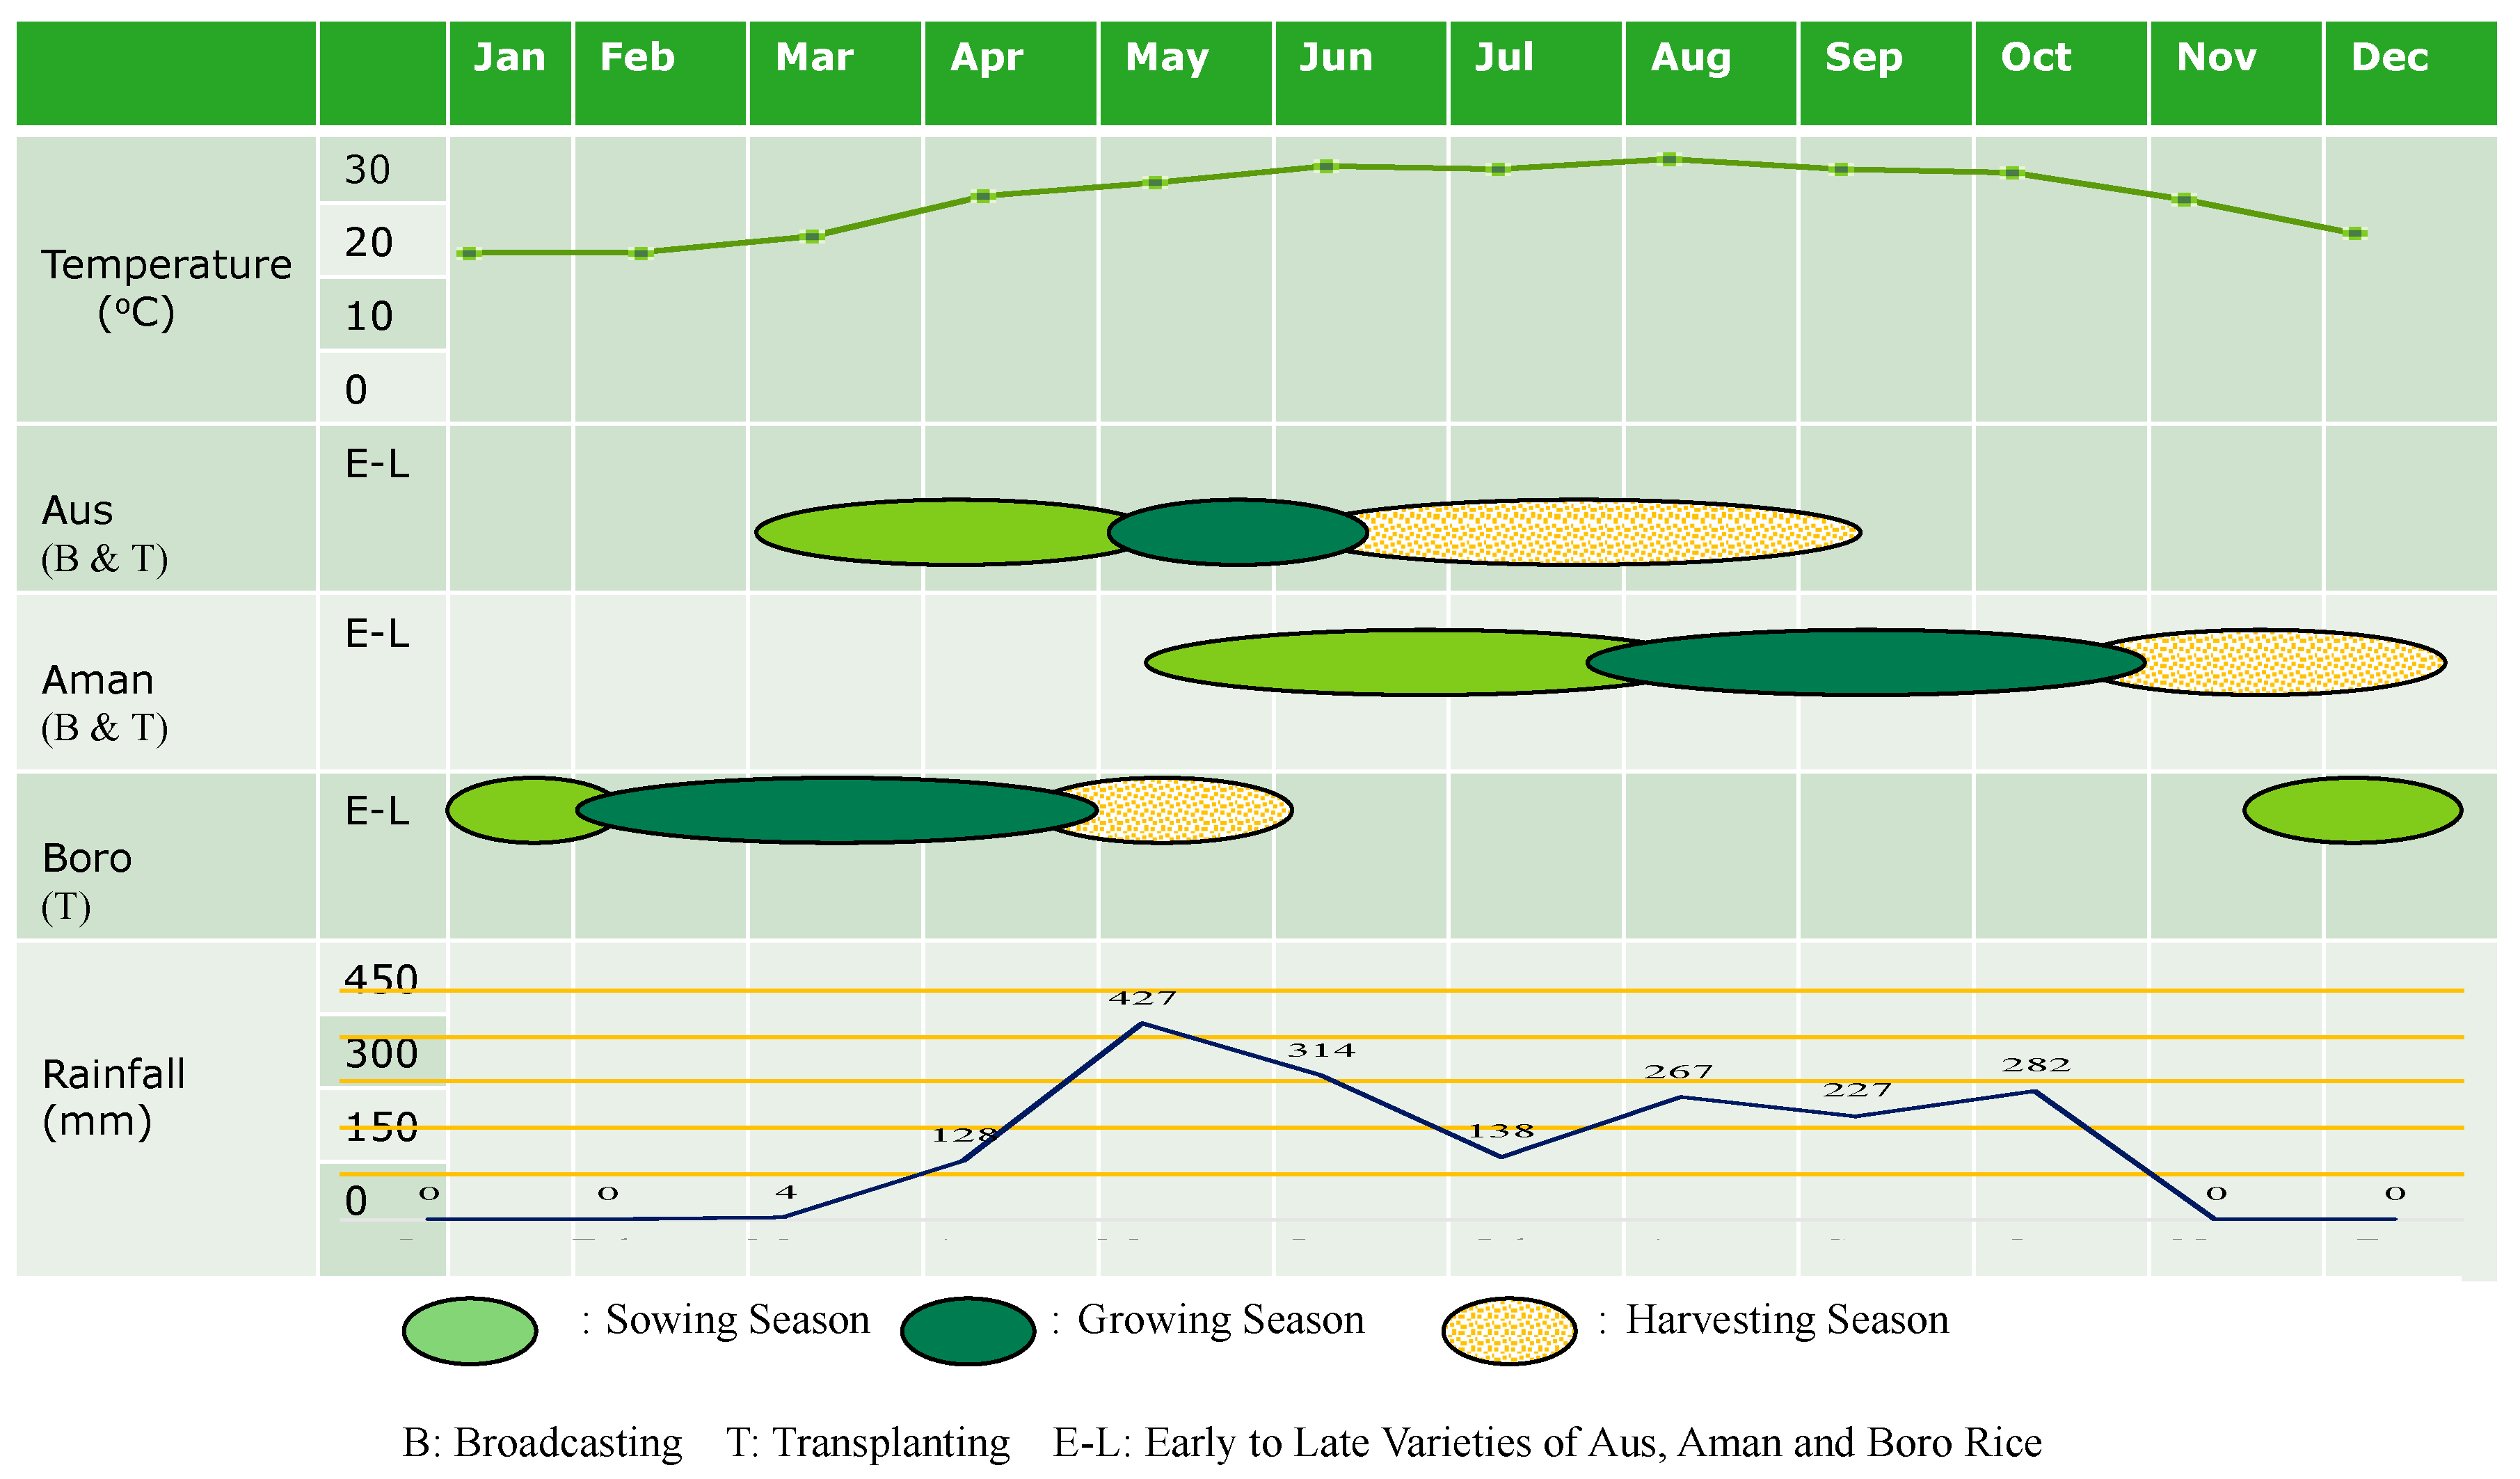
This work attempted to develop an agricultural insurance premium model considering suitable lands for rice cultivation in the northern part of Bangladesh. Basically, the area is rice intensive and most of the farmers cultivate three types of rice (Aus, Aman, and Boro) all year round (Figure 2). Major production influencing factors were used for rice land suitability analysis in the geospatial platform. Subsequently, considering the importance of the factors, the availability of data, the literature review, and expert opinions, the study identified eight criteria (slope, elevation, topsoil texture, land type, soil pH, temperature, rainfall, and flood prone) and one constraint (land use) for the analysis. Land use was identified with settlements, rivers, forests, and waterbodies as constraints. Different statistical data were obtained from the Bangladesh Bureau of Statistics (BBS). Rainfall and temperature data were collected from the regional meteorological stations, and data for agricultural production were collected from the Department of Agricultural Extension (DAE). The base maps of different factors were collected from the Local Government and Engineering Division (LGED) and the Bangladesh Country Almanac (BCA) to carry out this research work.
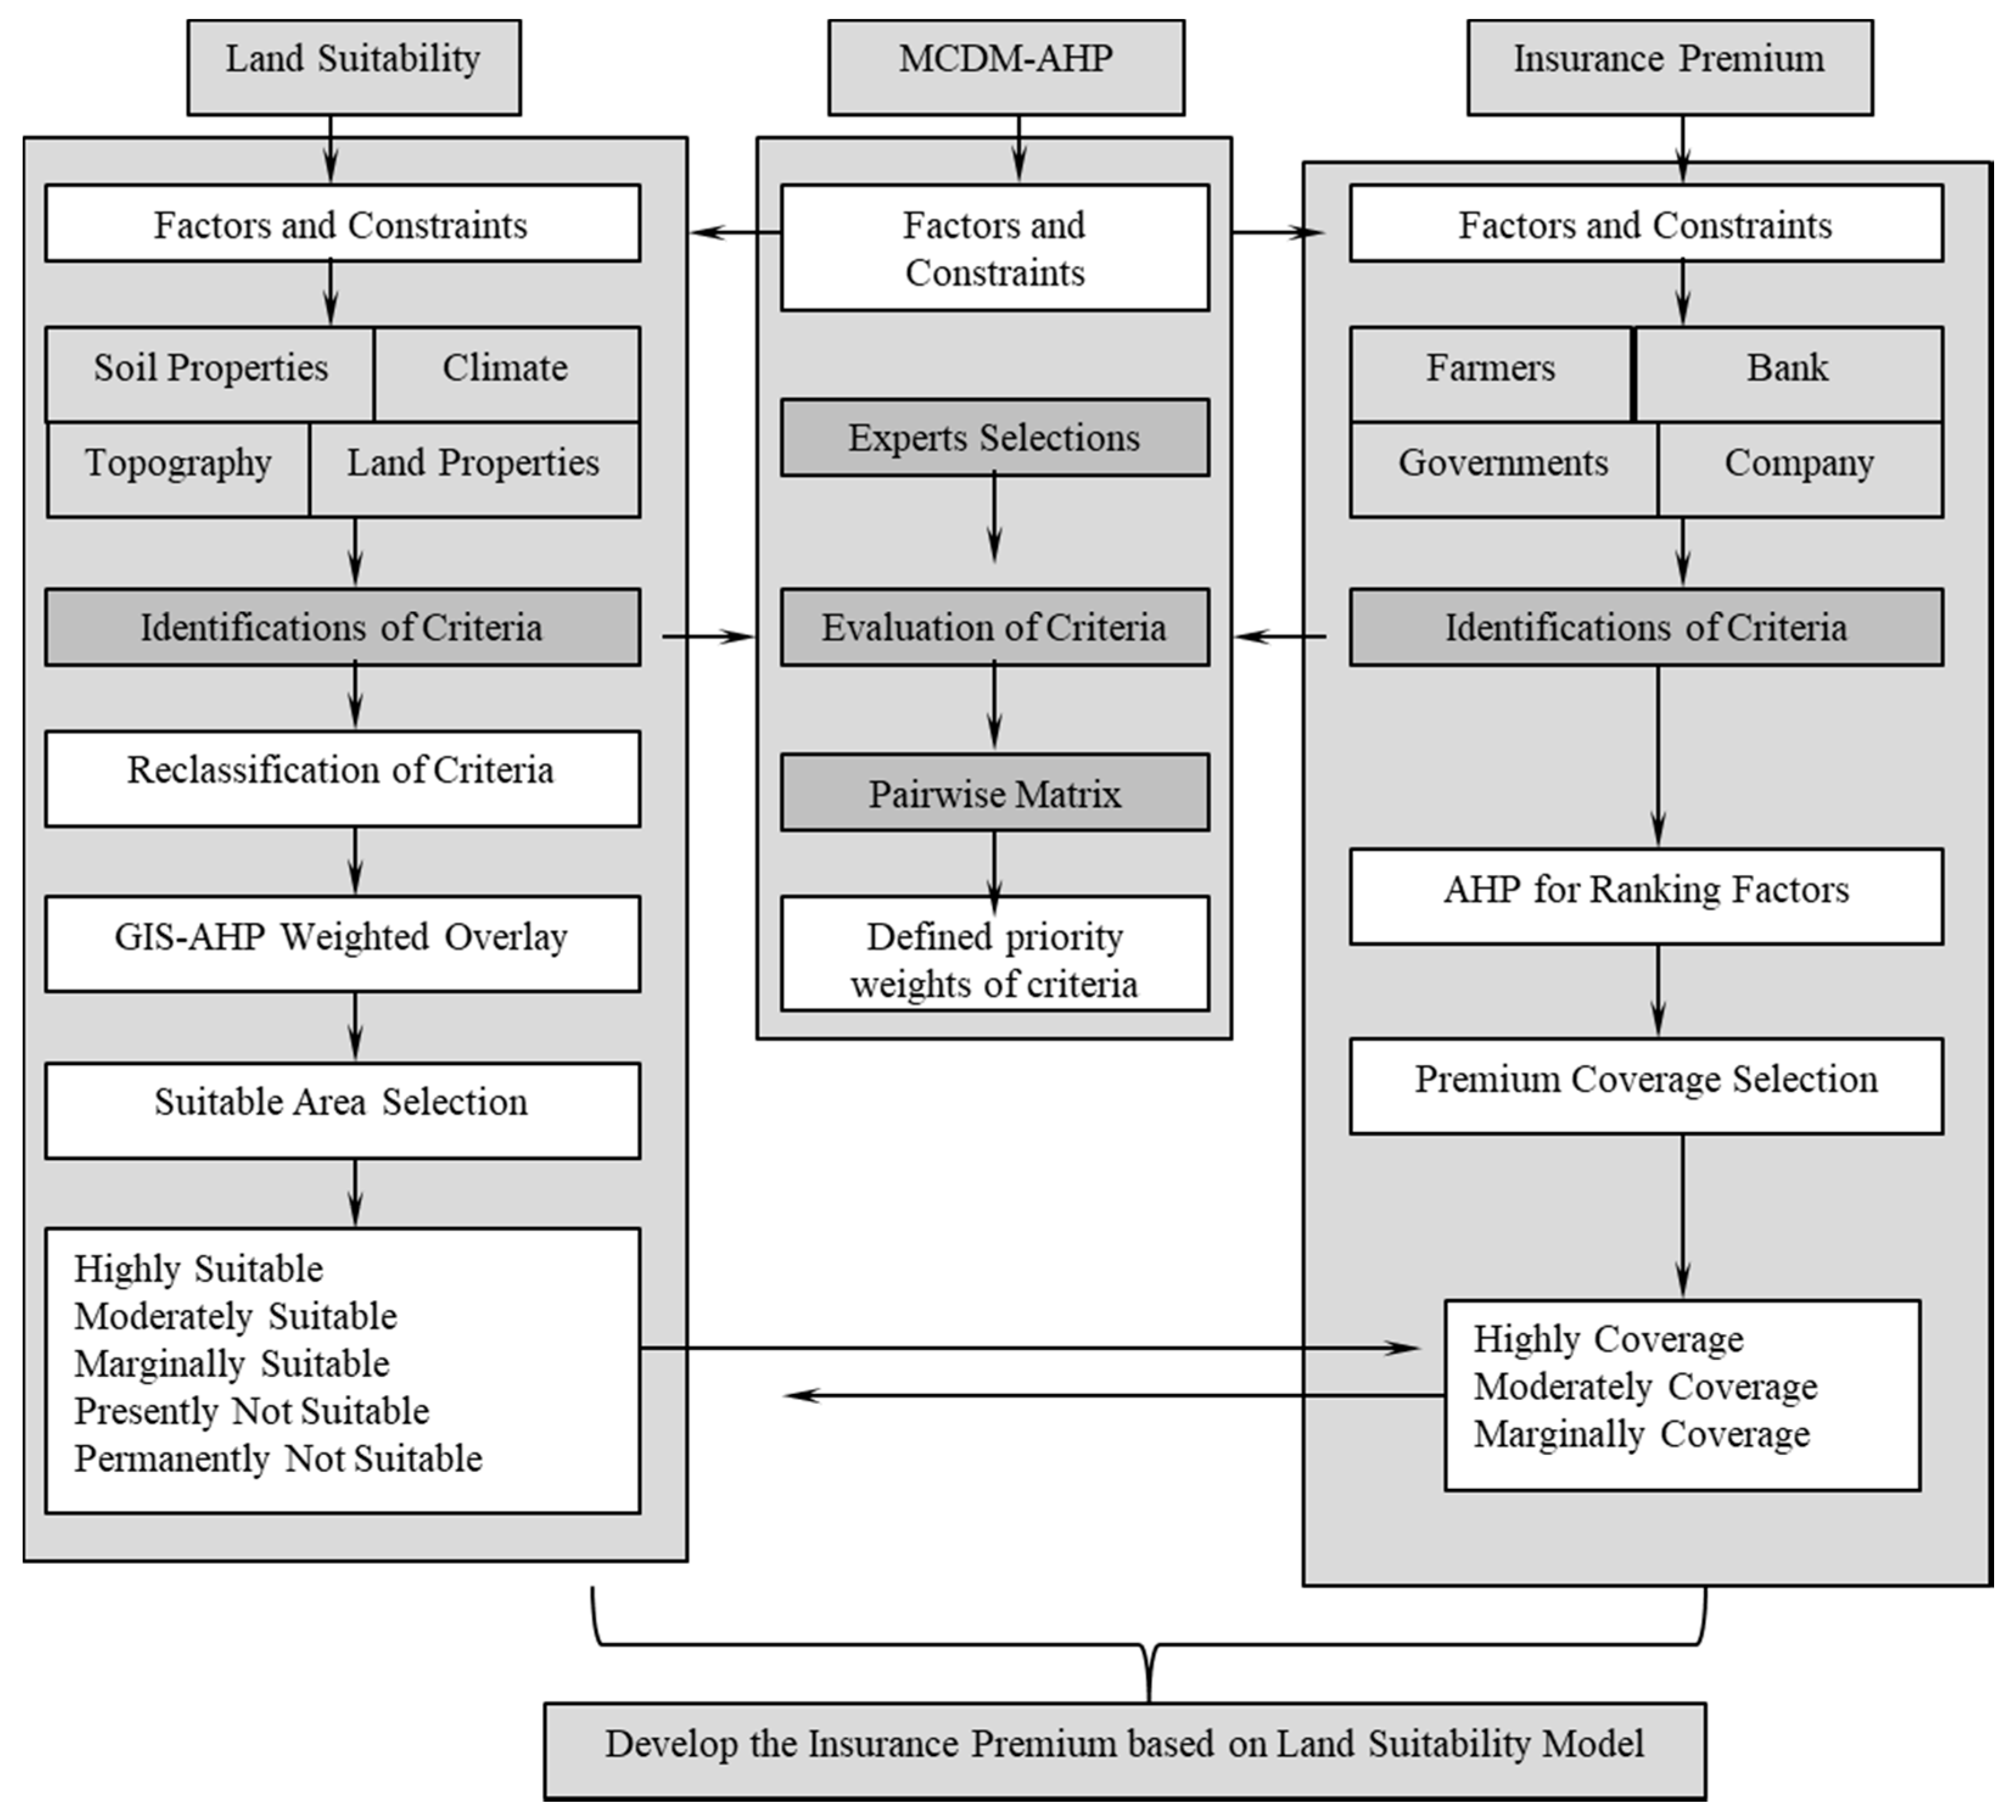
The research was conducted in two phases. In the first phase, a land suitability analysis was conducted to identify the areas suitable for rice production (Figure 3). A land suitability map was prepared in ArcGIS 10.3® based on the rice production requirement criteria. An MCDA technique was adopted to carry out the suitability analysis. AHP and MCDA were used with eight factors and one constraint to incorporate the preferences of the experts and assign weights to the factors. On the other hand, GIS was applied to manage the thematic spatial dataset of the factors and constraints’ layer maps using spatial analysis tools. A decision rule was applied to integrate GIS and AHP to develop a suitability map. In the second phase, the insurance premium model was developed based on the land suitability classifications. The following sections discuss land suitability using multicriteria analysis and insurance premiums.

2.2. Land Suitability with Multicriteria Analysis

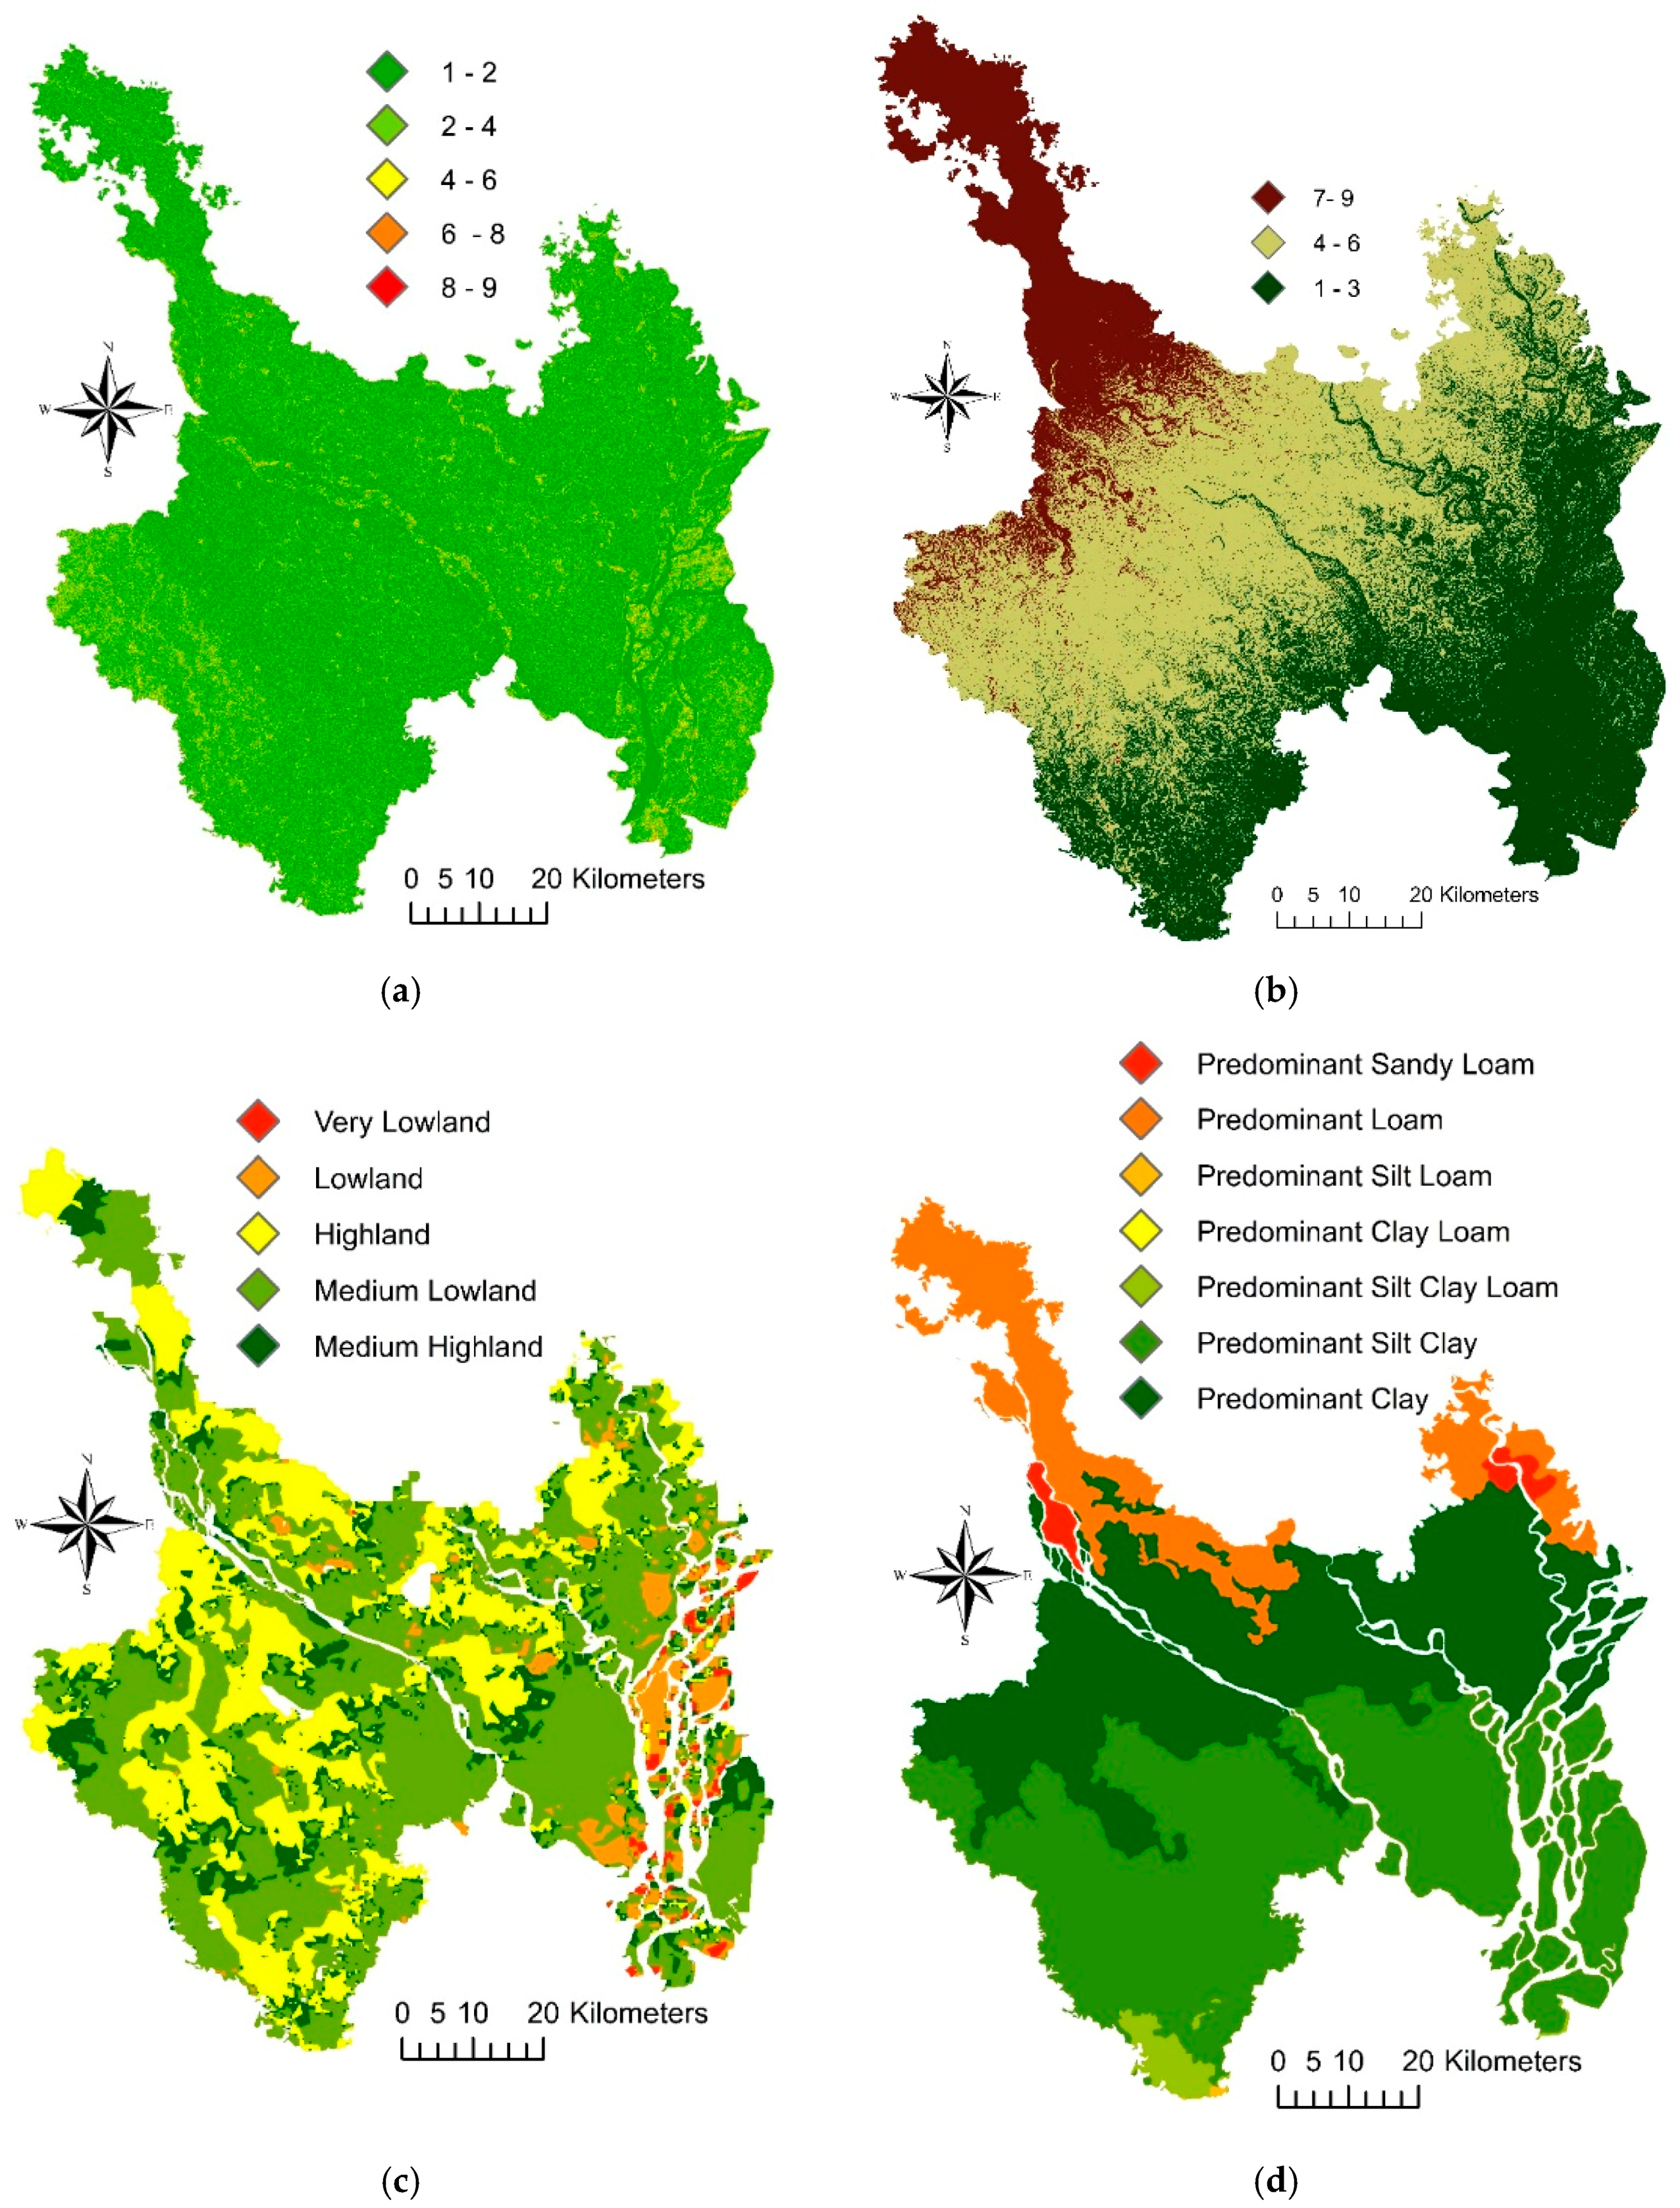
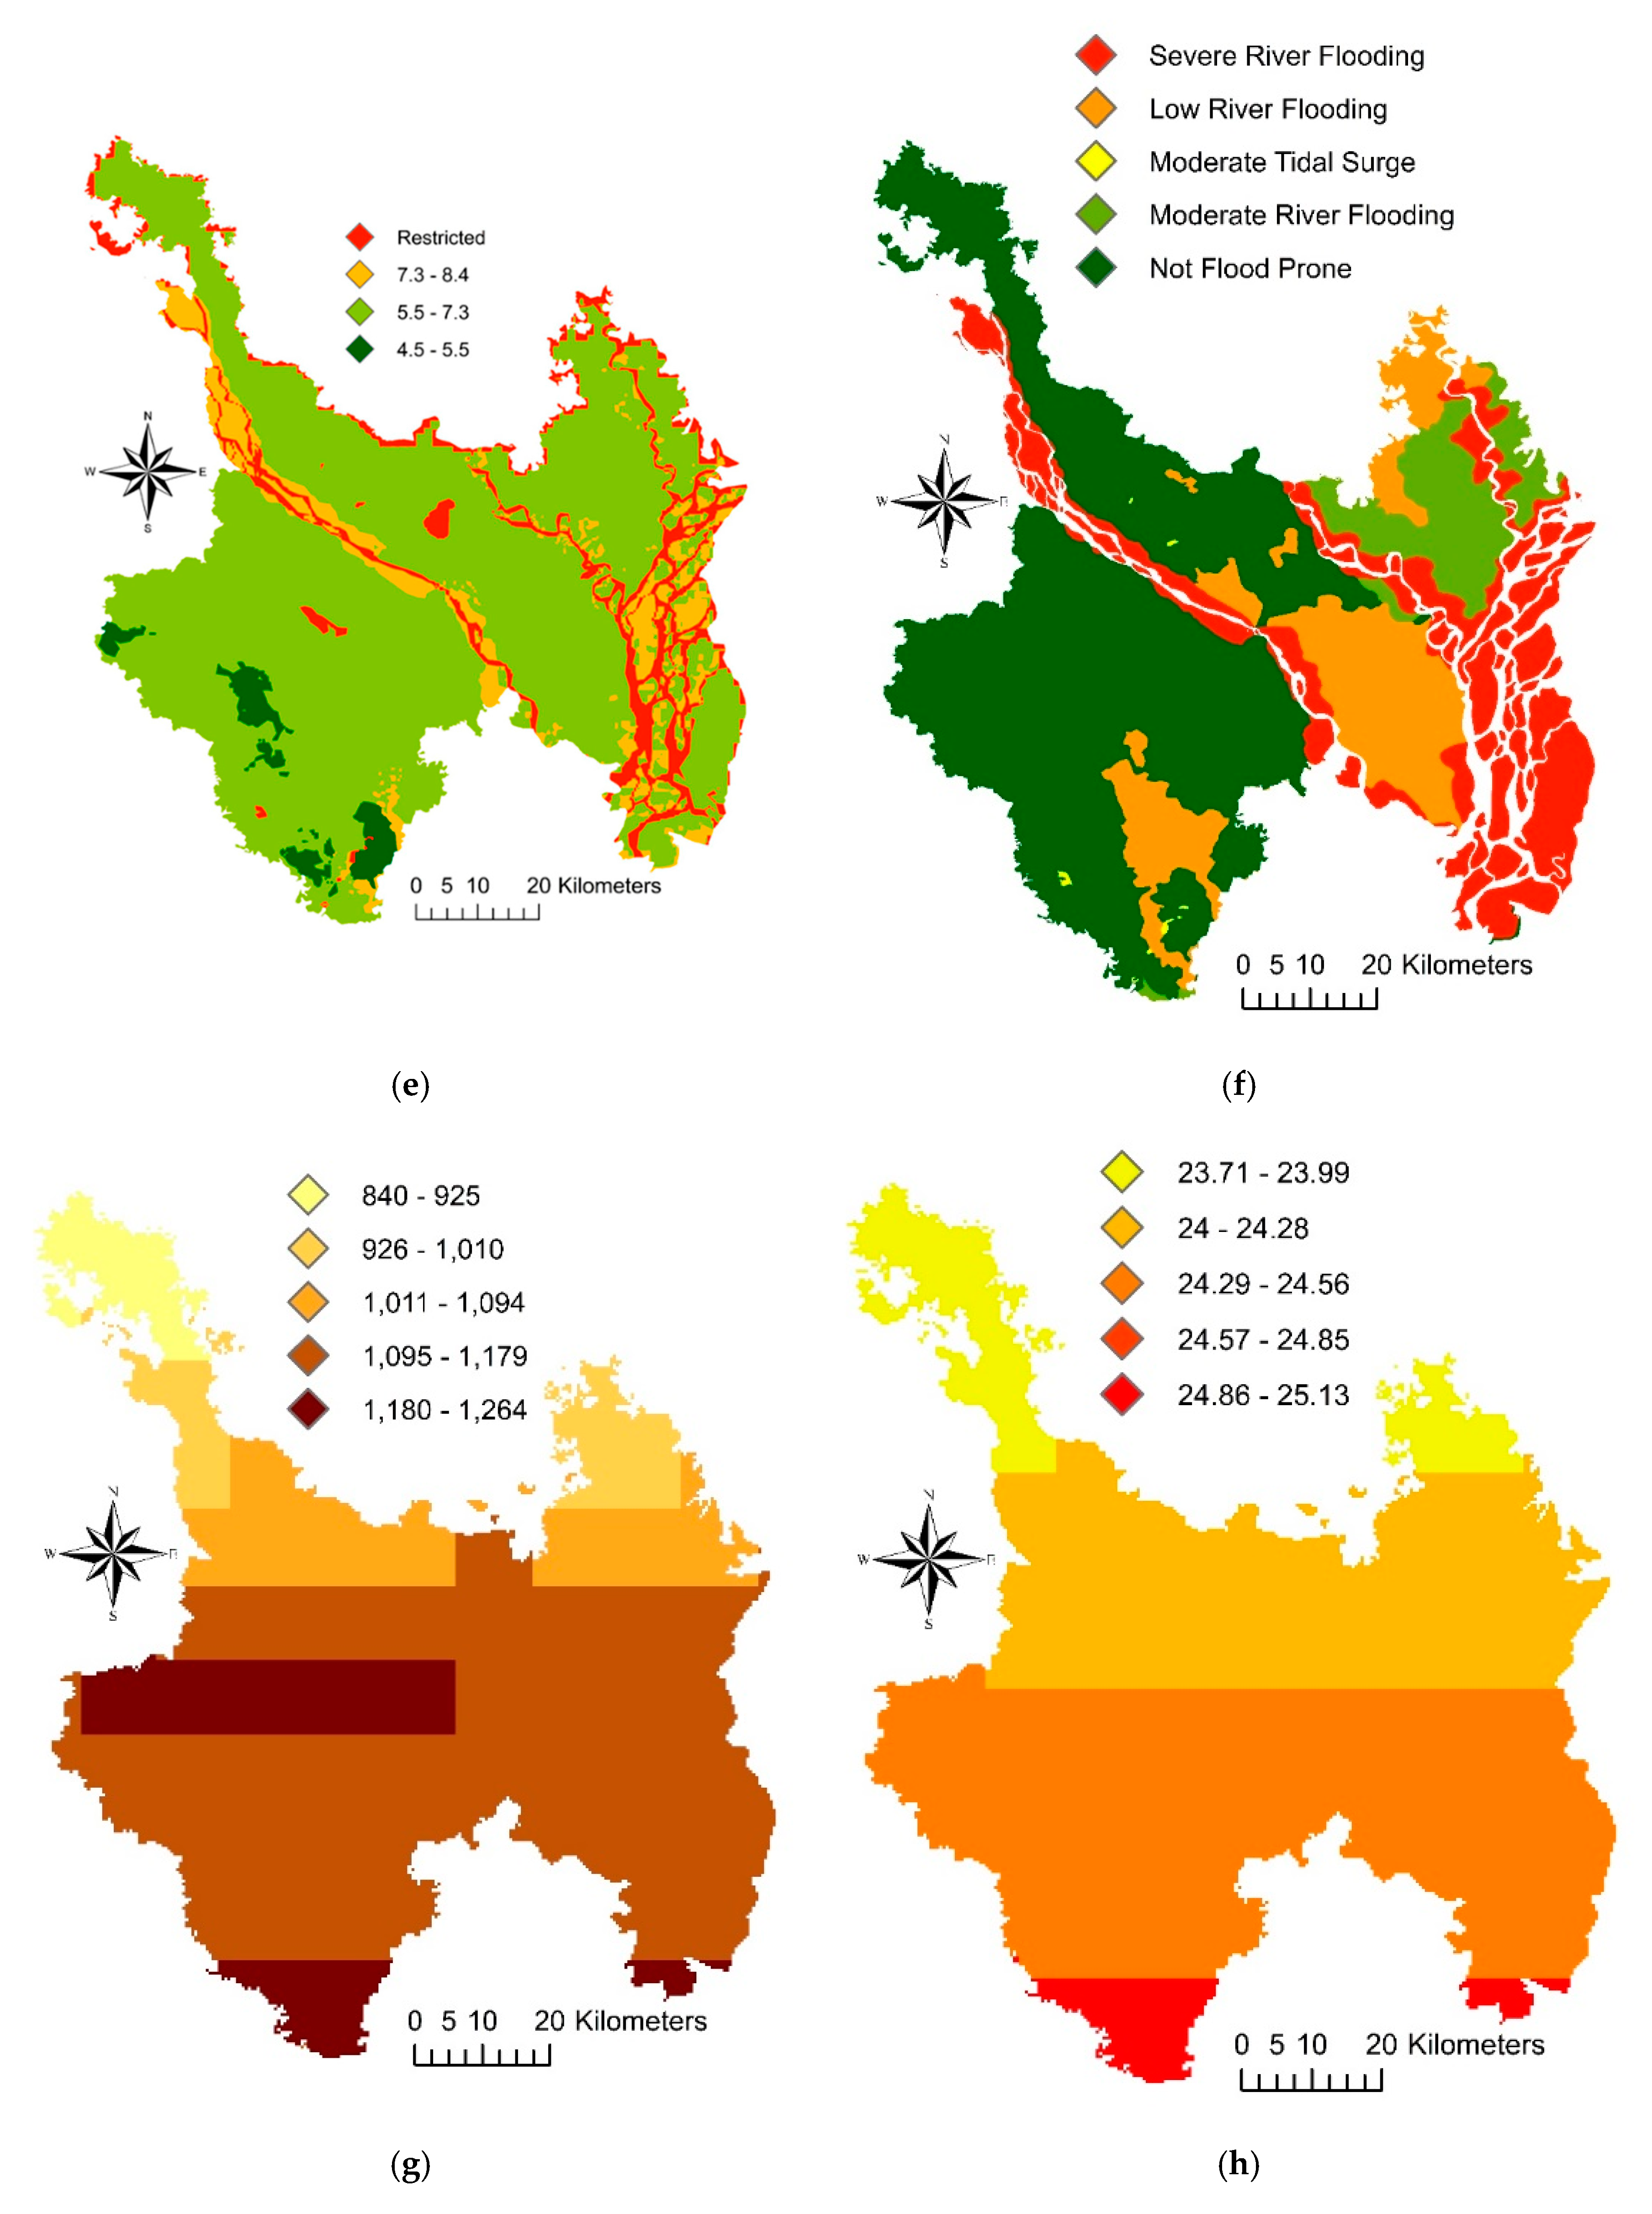
This study applied MCDA in several steps in the spatial environment. The following nine factors were selected to conduct the MCDA: (1) slope; (2) elevation; (3) land type; (4) topsoil texture; (5) soil pH; (6) flood prone; (7) rainfall; (8) temperature; and (9) land use (Figure 4). Only the land use factor was considered as a restriction on the study. A factor is a criterion that enhances or detracts from suitable alternatives for the activity under consideration, and a constraint serves to limit any alternative [36].

2.2.1. Slope

The slope refers to the topography of the area or indicators of the geomorphological properties of the soil. The thickness of the soil layer decreases with the increase of the slope [37]. The original Shuttle Radar Topography Mission (SRTM) and digital elevation models (DEM) were used to produce the slope and elevation for the study area. ArcGIS was used to rectify the topographical maps using the Universal Transverse Mercator (UTM) projection and WGS 84 datum. The datasets prepared in this process were compared to the SRTM dataset to identify the accuracy of both datasets. The slope was calculated from the maximum rate of change between each cell and its neighbors. Every cell in the output raster had a slope value. A lower slope value indicates a flatter terrain and a higher slope value indicates a steeper terrain. Flat fields had a smooth surface, which was better for rice cultivation as it facilitates the even and equal distribution of water. Ninety-five percent of the study area has less than 5% slope (Table 1); almost all the study areas are suitable for rice production in the context of slope.

2.2.2. Elevation

Elevation is an important factor that plays a role in the variation of plant cover, causing temperature changes, particularly in highlands. Rice can grow in extremely diverse elevations, including fields that are leveled, gently rolling, or steep, at altitudes of up to 2000 m [38]. However, when the elevation is less than 375 m, rice production is better [39]. Most of the study areas are plains land and the elevation is less than 70 m. Considering elevation, all the lands of the region are suitable for rice production (Table 1).

2.3.3. Top Soil Texture

Rice grain yield is significantly affected by topsoil (bulk density, water holding capacity, permeability) [40]. The rice grain yield in clay soil was 46% higher than in sandy loam soil averaged across cultivars and water areas [41]. The effective soil depth is defined as the thickness of soil above a layer restricting root growth (e.g., consolidated rock or cemented materials, such as gravel). Most annual crops had a rooting depth of approximately 50 cm, while for tree crops, the rooting system can reach beyond 150 cm. However, most crops produce good yields in soils with an effective soil depth of approximately 100 cm, and this value has been used as an upper limit. There were seven categories of topsoil format available in the area: predominant clay, predominant silt clay, predominant silt clay loam, predominant silt loam, predominant clay loam, predominant silt loam, and predominant sandy loam (Table 1). These categories were converted into a land suitability class according to their characteristics for rice cultivation based on the United States Department of Agriculture (USDA) soil texture suitability rating for rice and are observed as sands, loamy sands, sandy loams, sandy clay loam, and silt (Table 2).

2.2.4. Land Type

Good water retention capacity and a high amount of clay with organic matter are considered ideal for rice cultivation. Highlands are used to grow broadcast Aman and Aus rice, medium highlands are suitable for broadcast Aus and Aman, and medium lowlands are used to grow transplanted Aman and mixed broadcast Aus and transplanted Aman. Broadcast Aman is typically grown in lowland areas [42]. Based on seasonal flooding, the government of Bangladesh (GoB) has divided the land into five categories: highland, medium highland, medium lowland, lowland, and very lowland [43]. Most of the area is medium lowland (54%), followed by highland (28%), medium highland (12%), and lowland and very lowland (<6%). Medium highland and lowland are considered to be highly suitable, highland to be moderately suitable, lowland to be marginally suitable, and very lowland is considered to be presently not suitable for rice cultivation (Table 1).

2.2.5. Soil pH

The pH of the soil is defined as the negative logarithm of the hydrogen ion concentration of the soil solution. The pH is an important factor in the quality assessment for paddy soils [44]. Slightly acidic soils having a pH value of 6 to 7 are better for rice cultivation. However, rice can grow in a wide range of pH varying from values of 4 to 8 [45,46,47]. Considering the availability of the data format, the study ranked pH 5.5–7.3 as highly suitable (79%), pH 7.3–8.4 as moderately suitability (8%), and pH 4.5–5.5 as marginally suitable (<3%) (Table 1).

2.2.6. Temperature

Temperature and rainfall are two climatic factors that have a favorable influence and, in some cases, unfavorable influence on the development, growth, and yield of rice. Being a tropical and subtropical crop, rice is normally grown at a fairly high temperature–high rainfall regime ranging from 20 to 40 °C. The capacity of soil is the amount of water held in the soil between tensions corresponding to field capacity and the permanent wilting point [45,47]. Although the research area had three administrative districts, the temperature was almost similar in all of the areas. The average temperature was 23.5 °C (Table 1).

2.2.7. Rainfall

Rainfall, in the critical stages of paddy growth, increases crop yield through the rapid dissolution of nutrients for uptake by plants [48]. Three districts in the study area receive 1250–2000 mm of annual rainfall. The annual average rainfall was recorded between 1932 and 2931 mm (Table 1).

2.2.8. Flood Prone

Bangladesh ranks as the sixth most flood-prone country in the world [49]. Flood-prone environments include deep water areas submerged under more than 100 cm of water from 10 days to a few months, and areas that are affected by flash floods of longer than 10 days [43,50]. Due to the availability of the data on flood prone areas, the area was categorized into five types: not flood prone (54%), low river flooding (16.6%), moderate river flooding (8.6%), moderate tidal surge (0.13%), and severe river flooding (20%). According to the depth and duration of water stagnation, not flood prone is considered as highly suitable, low river flooding is considered as moderately suitable, moderate river flooding is considered as marginally suitable, and moderate tidal surge and severe river flooding are considered as not suitable for rice farming [51] (Table 1).

2.2.9. Land Use

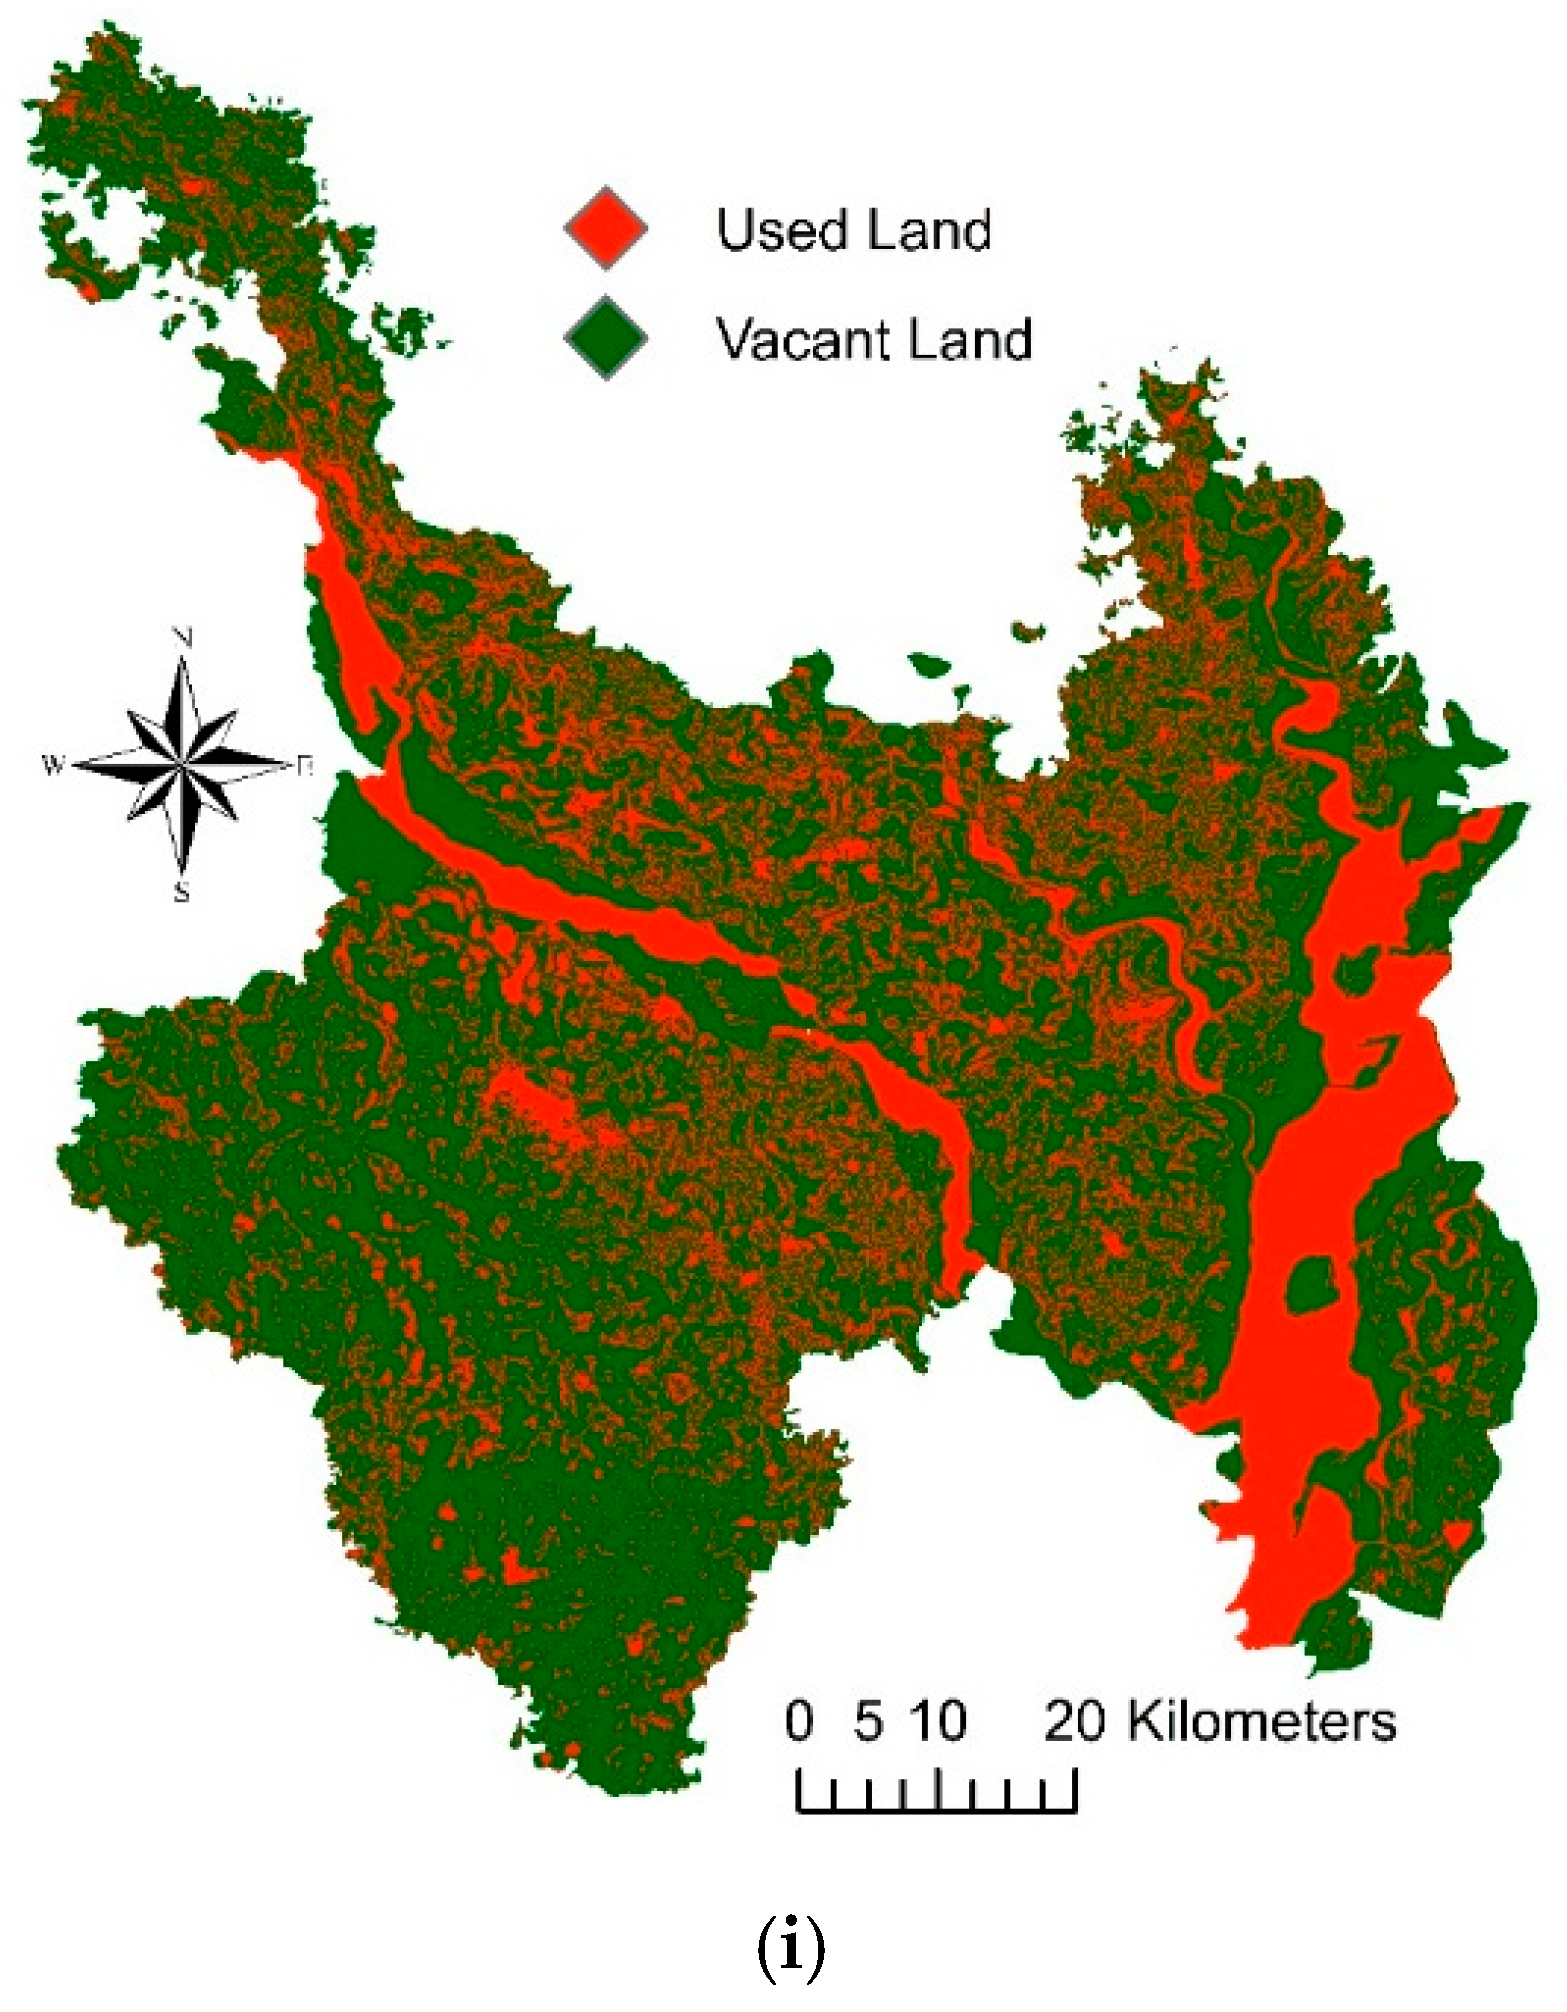
Land use is an important factor to identify the suitable sites for any crop production. In this study, we considered rivers, forests, waterbodies, and settlements as land use and they are considered as restrictions in the analysis. Approximately 33% of the total lands were occupied by settlements, rivers, and forests. As such, only 67% of the land was considered as suitable for rice production (Table 1).

2.3. Preferences of Criteria in Decision Analysis

The preferences of criteria can be referred by the weights. The purpose of weighting is to express the importance or preference of each criteria related to other criteria on crop yield and growth rate. A literature review of various references and interviews with local agronomists and researchers in this field were selected to identify the critical requirements for suitable rice growing areas. Factors were identified for selecting suitable sites for rice. The suitability levels for each of the factors were defined; these levels were used as a base to construct the maps (one for each factor). The suitability levels were: highly suitable-S1, moderately suitable-S2, marginally suitable-S3, and not suitable-N, based on the structure of FAO land suitability classification [52].
The procedure of the MCDA included several stages. First, the relevant factors and constraints were established [53]. Using the abovementioned factors, a pairwise comparison matrix was constructed. Although there are a variety of existing procedures for the development of weights, a pairwise comparison matrix in the context of a decision-making process known as the AHP was used [30]. The comparison concerns the relative importance of the two factors involved in determining the suitability of the stated objective [53]. In a land suitability analysis, a map represents each evaluation criteria with ordinal values (such as S1, S2, S3, and N), indicating the degree of suitability with respect to a sub-criterion and based on the crop requirements [54].

2.4. Analytical Hierarchy Process (AHP)

The AHP is one of the most widely accepted procedures and is considered as the most reliable multicriteria decision-making technique [55]. The process was applied to a set of factors to establish a hierarchical structure by providing a weight for each factor in the complete decision-making process [56]. Therefore, many decision-making methods attempt to determine the relative importance, or weight, of the alternatives in terms of each factor involved in each decision-making problem. The AHP provides a structural ground for quantifying the strong comparison of design factors in a pairwise technique, and thus decreases the complexity of the decision-making process [57]. Weights were used to determine the priorities of factors (elevation, slope, land type, soil pH, topsoil textures, flood prone, temperature, and rainfall) and to identify the suitability of different land uses for rice production. The resultant AHP weights were used to determine the priority of each factor for weighted overlay applications using GIS.
In the first stage of the analysis, we organized the factors of the decision model into a hierarchy for land suitability and an insurance premium (Figure 3). The second stage involved scoring the factors via pairwise comparisons and scoring scales of relative importance (Table 3). Questionnaires were used to gather expert opinions on the relative importance of the factors considered (Appendix A). The comparative results (for each factor pair) were described as integer values of 1 (equal value) to 9 (extremely different), where a higher number denotes that the chosen factor was more important than the other factor to which it was compared. A rating of 9 indicates that in relation to the column factor, the row factor is more important. On the other hand, a rating of 1/9 indicates that relative to the column factor, the row factor is less important [54]. In cases where the column and row factors are equally important, they have a rating value of 1. For example, when comparing elevation and slope angle factors, a score of 1 indicates that both were equally relevant to evaluate suitability, and a score of 9 indicates that elevation is more important than the slope angle. All scores were assembled in a pairwise comparison matrix with diagonal and reciprocal scores located in the lower left-hand triangle. Reciprocal values (1/3, 1/5, 1/7, and 1/9) were used where the row factor was found to be less important than the column factor (Table 3).
Third, we calculated the matrix and ensured the consistency of the pairwise comparison factors. The AHP also provided the measurements to calculate the normalized values of each factor and to determine the normalized principal eigenvalue and priority vectors. The pairwise matrix was calculated and is given by the following expression:
[ C 11 C 12 . .   . C 1 n C 21 C 22 . .   . C 2 n . . . . . . . . C n 1 C n 2 . C n n ]
The sum of each column of the pairwise matrix was denoted as follows:
C i j = i = 1 n C i j
We then divided each element of the matrix by its column total to generate a normalized pairwise matrix as follows:
X i j =   C i j i = 1 n C i j = [ X 11 X 12 . .   . X 1 n X 21 X 22 . .   . X 2 n . . . . . . . . X n 1 X n 2 . X n n ]
Finally, we divided the sum of the normalized matrix column by the number of factors used (n) to generate the weighted matrix of priority factors as follows:
W i j =   j = 1 n X i j n = [ W 11 W 12 . . W 1 n ]
The initial consistency vectors were derived by multiplying the pairwise matrix by the vector of weights as follows:
[ C 11 C 12 . .   . C 1 n C 21 C 22 . .   . C 2 n . . . . . . . . C n 1 C n 2 . C n n ] x [ W 11 W 12 . . W 1 n ] = [ C 11 W 11 + C 12 W 11 + + C 13 W 11 C 21 W 12 + C 22 W 12 + + C 23 W 12 . . .    . . . .    . C n 1 W 1 n C n 1 W 1 n . C n 1 W 1 n ] = [ V 11 V 12 . . V 1 n ]
The principal eigenvector (λmax) was then calculated by averaging the values of the consistency vector as follows:
λ m a x = i n C V i j
Eigenvalues were calculated by averaging the rows of each matrix. Eigenvalues were also referred to as relative weights. The largest eigenvalue was equal to the number of factors, and when λmax = n, judgments were consistent. Normalized eigenvalues were generated as weights of priority factors. The principle value suggests that the eight criteria were consistent, as the calculation results reveal a maximum value of 8.34 (Table 4). The judgments were also checked to determine the consistency index (CI), which was calculated as follows:
C I = λ m a x n n 1
Here, n is the total number of criteria. Saaty introduced the consistency ratio (CR) and compared it to the CI and random index (RI) values, which is the calculated value for matrices of different sizes [58] (Table 5). The consistency ratio was calculated as follows:
C R = C I R I
A lower CR ratio indicates more consistency. If the value of CR is 0.10 or more, then the weight values of the matrix indicate inconsistencies and the method (AHP) may not provide a meaningful result [30].

2.5. Weighted Overlay Analysis for Land Suitability

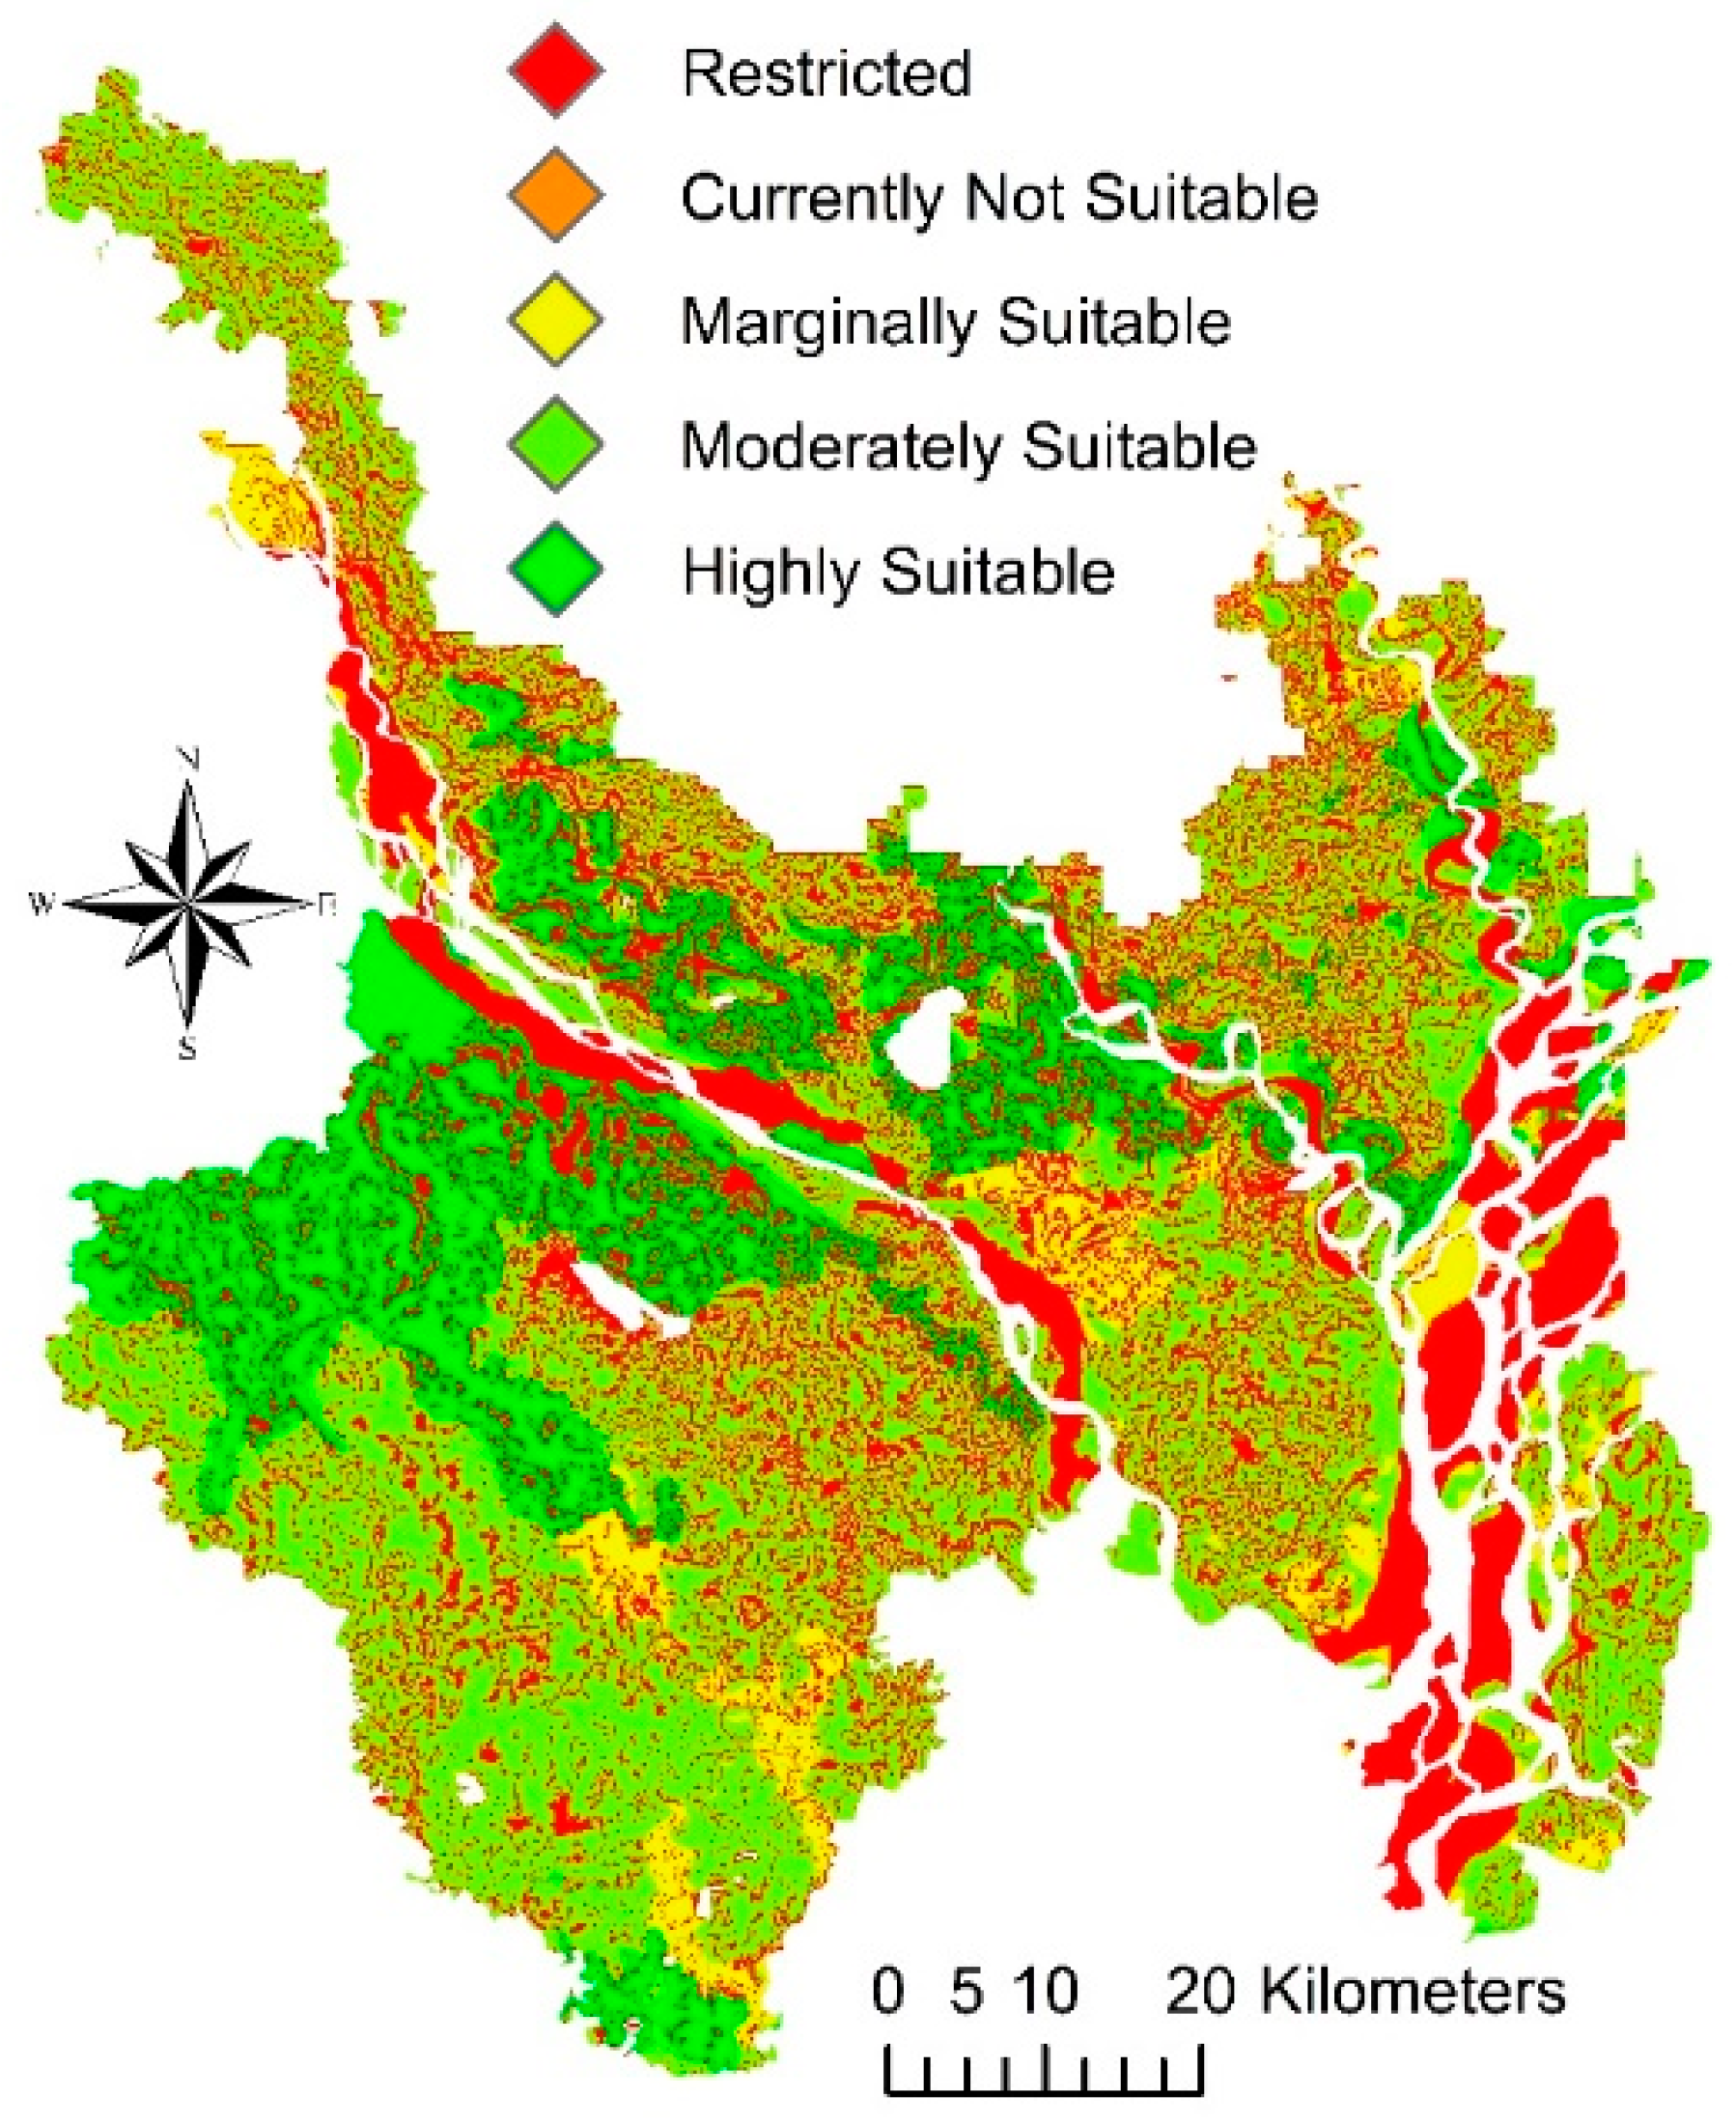
The rice crop suitability map was identified by the weighted sum overlay using the spatial analyst tools in ArcGIS 10.3® with both vector and raster layers (Figure 5). Initially, nine thematic vector layers of slope, elevation, soil pH, topsoil texture, land type, temperature, rainfall, flood prone, and land use (rivers, water bodies, settlements, and forests) were taken in a base geographical coordinate system, WGS 1984 (Table 6). These vector layers were projected in WGS 1984 UTM Zone 45N to obtain the same geographic extent. The thematic layers were then converted to raster layers to conduct the spatial analysis. The AHP weights were obtained from the experts’ opinions using a designed questionnaire for the priority weights of the factors. The constraints were stated as “restrictions”. To aggregate the weights of the factors and constraints, a decision rule, WLC, was applied to determine suitable locations in the GIS environments.

2.6. Crop Insurance

Farmers face a variety of substantial risks in the production and marketing phases, yet agricultural insurance has rarely been available outside of subsidized government offerings, which typically reach only a small fraction of small-scale farmers. A large number of newly developed products were piloted in developing countries including Bangladesh, however, none were perfect considering the socioeconomic characteristics of the farmers in Bangladesh [59]. In this study, the insurance premium mainly considers the quality of the land or suitability of the land. An AHP survey was first conducted to identify the criteria for the insurance premium. After literature reviews and a pilot survey, we identified some major factors that could be highly influential to take decisions about agricultural insurance. In different perspectives, we tried to identify the factors and causes of the agricultural insurance market. Subsequent to the careful analysis of all the factors, eight major factors were selected, which were highly influential in different stakeholder’s decisions. The major factors identified were product price, government subsidy, awareness, willingness of the government, belief of the benefits, trust in the company, rules and regulations, and the collection and distribution of money. To determine the crop insurance premium, the factors were ranked by the experts and the influence in the crop insurance program was obtained; most of the experts mentioned product price as the main factor for participating in a crop insurance program (Table 7). Finally, the study proposed an insurance premium model based on land suitability with the consideration of the harvest index and subsidy dependence factor to increase rice production domestically. The product price depends on the production, which was influenced by the harvest index (HI). The HI can be calculated from the crop information of past years based on the biological yield, and yield of dry matter or yield of grain and straw [60,61]; the subsidy dependence factor was considered because it is difficult to find any crop insurance that was successful without a government subsidy.

2.6.1. Product Price

Most of the farmers in Bangladesh have limited incomes and consider insurance premiums as another cost of production. During the 1980s and 1990s, agricultural insurance was exclusively provided through the state-owned insurance company, Shadharan Bima Corporation (SBC). SBC offered an individual grower multiple peril crop insurance product as well as livestock mortality and aquaculture insurance. Insurance demand is moderately price elastic [62], while crop insurance demand varies across the household head’s primary occupation, land ownership, and the size of the farm land [63].

2.6.2. Awareness

Farmers had limited awareness of agricultural insurance. In most cases, no field-level practice of crop insurance is the main cause for this. The lack of knowledge and awareness in the design, rating, and implementation of agricultural insurance need to be considered.

2.6.3. Belief of the Benefits

Almost all the farmers had some bad experiences, not directly owing to the insurance company, but some other microfinance organizations. Due to the bad experiences, farmers do not have sufficient confidence for a payment for any loss.

2.6.4. Collection and Distribution of Money

There are some fixed costs and high administrative costs for any operation, as rural infrastructure is not well developed and most of the farms are small in size. The sizes of many farms were less than one hectare, which causes the costs of insurance delivery, underwriting, and claims administration to be prohibitively high [64]. The main constraints and opportunities for crop and livestock insurance in developing countries are considered, such as insurance product types, hazards, vulnerability, and rural institutions that can support organization and distribution [65].

2.6.5. Trust in the Company

There is no clear policy framework for agricultural insurance in Bangladesh, including a lack of clarity on the role of government in supporting agricultural insurance through the private insurance sector. The commercial insurance companies are not willing to take a lead in developing crop insurance products.

2.6.6. Rules and Regulations

Establishing a business and continuing it in an appropriate manner needs some appropriate rules and regulations. How a company can work, what are the terms and conditions, and how a farmer participates in a crop insurance policy and gains benefit should be clear and understandable. While a premium subsidy is the most common intervention, other enabling measures are important, such as the legal and regulatory framework, reinsurance, technical and administrative assistance, and linkages to government extension services in agriculture, animal health, or meteorology [65].

2.6.7. Willingness of the Government

In developing countries, most of the decisions are made through government intervention. Agricultural insurance is normally undertaken as a market-based activity by private or state sector insurance companies, often with support measures from the government. In high and some middle-income countries, such as the United States, Canada, Spain, Italy, Japan, and South Korea, governments have significantly intervened, created sophisticated market structures, and accepted significant annual budgets for agricultural insurance [65].

2.6.8. Government Subsidy

Private commercial insurance companies in Bangladesh have limited financial capacity, and are, in general, reluctant to take a lead in investing in agricultural insurance staff and the design of products and policies, systems, and procedures, as this is a high-risk class of insurance. Thus, introducing crop insurance in a vast area that requires a good budget from the government for a subsidy. The estimated discrepancies between an expected indemnity and expected premium appear too large to be financed by government subsidy on a continuous basis [63].

2.7. Insurance Coverage and Premium Rate

Agricultural insurance is generally undertaken as a market-based activity by private or state sector insurance companies, often with support measures from the government [65]. The demand for crop insurance is said to be moderately price elastic [62,66]. Government-subsidized crop insurance programs have been established and developed for decades in developed countries, particularly in the United States and Canada [67]. In many developing countries including Bangladesh, crop insurance was introduced approximately three decades ago. Some of these countries are continuing to offer such insurance, while in some others, it has stopped functioning owing to heavy losses. Insurance in the United States is provided by 17 private companies. They work in agreement with the USDA Risk Management Agency and approximately 45% of the field crops’ production value are insured (23% in the European Union (EU)). The average premium rate is close to 9%, which is much higher than in Europe (4%), mainly because they offer a wider coverage—revenue or yield insurances versus mainly single-peril or combined-risk insurances. The premium subsidies amount to $1900 million (58% of the total premiums). The United States government also provides funds for the administrative costs of insurance companies and provides reinsurance. Thus, the total support provided to insurance amounts to 72% of the total premiums (in the EU, approximately 500 M€ = 32% support) [68].
In this research, the insurance premium mainly considers the quality of land or suitability of the land to cover the crop revenue of farmers. An AHP survey was conducted to first identify the criteria involved for insurance premiums (Appendix B). To determine the premium rate, different low interest rates were considered that could have the ability or “willingness to pay.” The range was 2%–6% of the insured revenue, which was considered as the willingness to pay the premium for their crops. The premium rate varies due to the land quality and risks [52]. The expected revenue was calculated with the help of the regional average production of time series data and the government floor price.
The insurance coverage was categorized as high coverage (90%), moderate coverage (80%), and marginal coverage (70%) considering the average production costs of the production of rice [69]. The minimum insurance coverage was considered marginal coverage (70%) to overcome the production costs, while the maximum coverage was estimated as high coverage (90%) to ensure the production efficiency of the factors of productions. Insurance coverage was the same for different land suitability, harvest index, and subsidy dependence factors, however, the premiums were different. Thus, it could benefit land owners with moderately suitable or marginally suitable lands. No insurance was covered for the presently not suitable areas due to the physical and economic viability. A farmer could buy a product of insurance from the three categories and could pay the premium in 12 installments (every month). The future value of annuity (V) was calculated using regional yield and the price of rice varieties as follows [70]:
V = 12   P   { 1 + ( i 12 ) } 12 n 1 i
where P is the premium for different coverages and can be expressed by combining the harvest index and subsidy dependence index. The future expected revenue from rice production can be expressed as follows:
V j = i = 1 n P P V i   ×   P R T
where Vj is the cumulative return from the yield for different coverages (j) of three seasonal of rice practices in one calendar year. The PPV is the average production capacity for seasonal rice (ton/ha; i is the seasonal variety: Aus, Aman, and Boro; and n is the number of years) and PRT is the average price of rice ($/ton). Therefore, the premium for different coverages (j) are based on the expected revenue, production function, and subsidy which can be expressed as follows:
P j = V j × i 12 { 1 + ( i 12 ) } 12 n 1 × H I × S D F × C j × C f
where Pj is the premium for the specific coverage (j) of three seasonal rice practices in one calendar year and HI is the harvest index and ratio between the observed yield and biological yield. The SDF is the subsidy dependence factor and was assumed to be 0.50 as a welfare consideration. The parameter Cf is the conversion factor for the pixel resolution for Landsat 8, OLI. The government of Bangladesh provides agricultural subsidies not only in the form of cash but also on price of agricultural inputs, such as seeds, fertilizer, irrigation, and fuel. Among production inputs, the cost of irrigation holds the highest share (nearly 20%) as a single cost item followed by fertilizer (approximately 18%) because of the price increase of these items at both the national and international markets [71]. Electricity in agriculture enjoyed a 20% subsidy for a long time, however, it was discontinued later to offset the impact of a rise in oil prices. Presently, the policy is proposed for at least a 25% subsidy on electricity and fuel needed to continue to meet future challenges, particularly, the Boro crop for which the irrigation is powered 40% by electricity and 60% by fossil fuel [72]. If the price of electricity and fuel is within the capacity of farmers, they will not lose interest in Boro cultivation. The subsidy expenditure as a total subsidy is presently offered at 17.30%, the proposed budget (2017–2018) by the government is 22.13%, and electricity or fuel for irrigation is proposed to increase from 20% to 25% [73]. The parameter Cj is the coverage rate (highly, moderately, and marginally) and Cf is the conversion factor to scale down the pixel level (30 m × 30 m, Landsat 8, OLI).

3. Results

3.1. Land Suitability

We have found that highly suitable land (S1) covers an area of 1337.02 sq. km (22.74%) of the total land. Hence, a significant part of the study area was highly suitable for rice cultivation (Table 8). The S1 (highly suitable) areas were characterized using a slope level of 0%–10%, elevation less than 50 m, soil pH level between 5.5 and 7.3, the topsoil texture class that included predominant clay, predominant silt clay, and predominant clay loam, the land type of medium high and medium lowland, a rainfall range between 1000 and 2000 mm, and temperatures between 20 and 30 °C. The result showed that 1678.04 sq. km (28.54%) of the area were moderately suitable (S2) for rice production, and 873.71 sq. km (14.86%) of the area were marginally suitable (S3) for the cultivation of rice with limitations of land type, soil texture, and the soil pH. This class was used less for rice production as its limitations and profitably corrected the suitability class to a moderate level. Currently, not suitable areas (N) had also covered a relatively insignificant portion of the study area of 69.97 sq. km. (1.19%). Generally, not suitable areas (N) were in very lowland areas with a sandy loam texture. In addition, the total lands that were permanently not suitable for rice production were 1920.87 sq. km (32.67%), occupied by settlements, rivers, forests, and water bodies. The results show that the majority (up to 67%) of the total land in the study area had varying degrees of suitability for rice production (Figure 5). The highly and moderately suitable areas, taken altogether, which have, according to the analysis, covered 51% of the total land was commendable for rice production. Overall, these results indicate that the study area has enormous potential for rice production. Therefore, economic levels of agricultural production can be achieved by cultivating rice crops in highly (S1) and moderately (S2) suitable areas and practicing the diversification of marginally (S3) suitable areas to crops other than rice.

3.2. Insurance Premium and Coverage

The insurance coverages were categorized as high coverage (90%), moderate coverage (80%), and marginal coverage (70%) (Table 9). Insurance coverage was the same for different land suitability, but the premiums were different. Thus, it could benefit land owners with moderately suitable or marginally suitable lands. Presently, not suitable areas are not recommended for insurance coverage because of cost effectiveness.
A farmer could buy a product of insurance from the three categories and could pay the premium in 12 installments of three rice crops (Aus, Aman, Boro) during crop plantation, in the middle of cultivation, and after harvest. The average weights for each factor were derived using individual judgments. Considering the fact that farmers want to produce rice with secured and minimum premiums, the experts’ opinions were listed to recognize the criteria to introduce an insurance premium according to land suitability.
Product price was the main factor (29%) to participate in crop insurance, which was highly involved with the production factor as mentioned in the harvest index. Farmers had limited awareness of agricultural insurance. There were 17% of the experts who mentioned that there was a low level of awareness and knowledge among Bangladeshi farmers on the role of agricultural insurance. Although the villagers had no understanding of crop insurance, when they understood the theme, they were rather worried (9%) about the benefits. In the case of collection and distribution of money, the collection of the premium and distribution of the insurer’s money had a large involvement in the cost issue (3%). Trust in the company was also a challenge to prove (5%). In the rules and regulations criteria, the lack of a national framework (4.5%) for agricultural insurance and limited agricultural insurance provisions were mentioned by the experts. The willingness of the government was the second (18%) most important criteria for the establishment of the crop insurance market. In the case of the government subsidy, private commercial insurance companies in Bangladesh have limited financial capacity and are generally reluctant to take a lead in investing in agricultural insurance. Therefore, introducing crop insurance in the poverty and risk-prone areas requires the government to provide a subsidy. In the survey, we found that 16% of the experts’ opinions consider a government subsidy as an important factor for farmer participation in crop insurance.

4. Discussion

In this research, the suitability mapping of rice production for the poverty prone and risk regions of Bangladesh was conducted to increase production and to ensure food security. From the expert analysis information, a key challenge for poor farmers of the study area was the management of the activities to reduce crop damage risk. One potential strategy for coping with the devastating effects of crop damage is to identify the suitability areas and introduce a crop insurance scheme on a cooperative basis. Agricultural insurance along with the cooperation of the community could help farmers to stabilize farm income and investment and guard against disastrous effects of losses due to natural hazards, low production, or low market prices. Crop insurance not only stabilizes farm incomes but also helps farmers to initiate production activity after a bad agricultural year, shock of crop losses, or low prices by providing farmers with a minimum amount of protection and helping farmers invest more in agriculture.
The socioeconomic identities of farmers, poor rural infrastructure, very low household incomes, large family sizes, low productivity, and insufficient training on agriculture made the regions more risk prone. To achieve sustainable livelihoods, a crop insurance policy needs to be introduced with a cooperative procedure, as most of the farmers do not deal with banks and nongovernmental organizations. In this research, a procedure to calculate premiums was introduced, based on land suitability areas, a harvest index, and a subsidy dependence factor. Considering the above factors, the government of Bangladesh needs to take initiatives by subsidizing this sector initially, which suggests a premium rate of 2%–6% of the expected outcome based on land suitability, harvest index, and subsidy dependence factor. Considering land suitability, there are three types of insurance coverage: high coverage (90%), moderate coverage (80%), and marginal coverage (70%). We suggest producing rice up to marginally suitable land; a low harvest index could gain support through insurance. The minimum coverage was marginal coverage (70%), which covered the production costs, while maximum coverage was designed using high coverage (90%) to utilize the maximum benefit against the risk-prone marginal areas. The expected outcome can be calculated from the time-series production data. The insurance premium introduced in India has offered a monumental and path-breaking bounty of crop insurance at a nominal premium—as low as 1.5% and 2% of the sum assured—which is unprecedented, to boost the farm sector and derisk the vast farming community. Under this new scheme, the government of India has substantially reduced the premium to be paid by the farmers—1.5% on Rabi crops (dry season), 2% on Kharif crops (wet season), and 5% on commercial/horticultural crops. To reduce delays and leakages, the payment of compensation was undertaken through direct transfers into the bank accounts of farmers [74]. Further research needs to be undertaken considering community acceptance to justify the premium as proposed in the research considering land suitability, harvest index, and subsidy in the risk-prone areas of Bangladesh.

5. Conclusions

To meet the demand of food for the increasing population with decreasing land resources, land suitability identification for crop production is very important. The study conducted an LSA analysis on the northern part of Bangladesh and found that approximately 33% of the total land, which was occupied by water bodies, rivers, forests, and settlements, was permanently not suitable, and 1.19% was presently not suitable. However, 22.74% of the study area was highly suitable, 28.54% was moderately suitable, and 14.86% was marginally suitable for rice production. Considering the demand for rice by the vast population, the regions need to secure rice production up to the marginally suitable lands. In the marginally suitable lands, the risks are higher than the moderately suitable areas, and the costs of production are also higher; the production could be lower than the moderately suitable lands. To motivate owners of low-quality land to produce rice, protection through crop insurance support must be provided. This new crop insurance model, “crop insurance based on land suitability”, can be a very effective tool to manage production risks and provide rational support to owners of land of different quality, which will increase production to ensure food security. The socioeconomic characteristics of farmers in Bangladesh are far different from those in developed countries, and if we merely follow the latter’s products and policies, rice production may not be sustainable. This study suggests a premium rate of 2%–6% of the expected outcome based on land suitability. The premium calculation that is based on costs and risks does not provide a suitable environment for the introduction of crop insurance. The strategy of the government of Bangladesh to provide subsidies to the farmers at times of shocks needs to be changed to subsidies to pay insurance premiums with appropriate regulations.
We suggest producing rice up to marginally suitable land, and this can be supported by insurance. The minimum coverage is marginal coverage (70%) to cover the production costs, while maximum coverage is ensured through high coverage (90%) to enable maximum efficiency. Based on these judgments, the highest priority was the product price (26.72%), followed by willingness of the government (20.27%), government subsidy (19.18%), awareness (11.92%), belief of the benefits (7.12%), rules and regulations (6.70), trust in the company (4.76%), and collection and distribution of money (3.34%). These results are helpful for policymakers and agricultural extension workers who assist the agriculture sectors to increase the production and ensure the welfare of the farmers. The information provided, at a local level, could be used by the growers to select suitable lands and can be relevant to other crops to increase production. The government could encourage private participation to provide varied products with premium rates for commercial farmers on an individual basis. It would be wise to integrate microinsurance with microfinance in order to manage the risk of default and enterprise losses in a more proactive manner.

Author Contributions

All the authors made substantial contributions to this research. M.M.I., the first author and PhD candidate, collected data and analyzed the data with satellite remote sensing datasets in GIS, AHP environment. In addition, he completed this manuscript as a part of his requirement for his doctoral dissertation. T.A. developed the original research concept and supervised the research to develop the land suitability and geospatial insurance premium. R.N. contributed to the AHP analysis and provided scholarly comments to develop this research. All the authors consulted one another while preparing the manuscript at all stages, interpreted the results, and agreed about the conclusions and further research directions.

Acknowledgments

The authors would like to express their sincere gratitude to the University of Tsukuba, Japan for providing GIS facilities to carry out the research. We are grateful to the Department of Agricultural Extension (DAE), Ministry of Agriculture, Bangladesh, Bangladesh Metrological Department (BMD) and Local Government and Engineering Division (LGED) for their cordial support in data collection and base map preparation. We also express our sincere thanks to the United States Geological Survey (USGS) and the European Space Agency (ESA) for geographical and satellite data. Furthermore, we also express our gratitude to the Bangabandhu Fellowship Trust, Bangladesh for providing scholarship to pursue this research in Japan.

Conflicts of Interest

The authors declare no conflict of interest.

Appendix A. “Land Suitability Analysis for Paddy in Northern Parts of Bangladesh: Introducing Geo-Spatial Insurance Premium” SURVEY

With this questionnaire, we expect the willingness to fill out the questionnaire according to your opinion. The questionnaire aims to complement the research data in the context of the preparation of the thesis with the title: “Land Suitability Analysis for Paddy in Northern Areas of Bangladesh: Introducing Geo-Spatial Insurance Premium”.
(Your response will only be used for research purposes and analysis.)
Identity of Respondent
1Name
2Position and Address

Appendix A.1. Section-1: Please select scale number of criteria for land suitability mapping of rice production in the northern part of Bangladesh.

Instruction: Please choose the scale number from 1 to 9
Example: Which is the most important criteria to produce rice?
CriteriaSlopeElevationLand
Type
Top Soil
Texture
Soil pHFlood
Prone
TemperatureRainfall
Example65977433
Your Opinion
If you choose a number on scale 9, it means that Land Type is the most important, followed by Top Soil Texture, Soil pH and others. If you choose the same scale, it means equally important.

Appendix A.2. Section-2 Please select weight of criteria for land suitability mapping of rice production in the northern part of Bangladesh

Instruction: Please add a checklist (✓) on the column scale criteria (A) or at the column scale criteria (B) based on experts’ opinion.
Definition of scale:
1: the second equally important criteria3: criterion (A) is little more important than (B)
5: criteria (A) is more important than (B)7: criterion (A) is much more important than (B)
9: criterion (A) is absolutely more important than (B)* and that goes for the reverse
Example: In taking the decision to develop the crop insurance how important this criterion:
Criteria AScale ScaleCriteria B
98765432123456789
1Land Type Top Soil Texture
If you give a sign checklist (✓) on a scale of 7 in column A, then it means that the criteria An in this example “Land Type” is more important than criteria B in this example “Topsoil Texture”.
Question: After deciding the most important criteria in Appendix A.1, how important is the criteria if it compares one to another?
Criteria AScale ScaleCriteria B
98765432123456789
1Slope Elevation
2Slope Land Type
3Slope Top Soil Texture
4Slope Soil pH
5Slope Flood Prone
6Slope Temperature
7Slope Rainfall
8Elevation Land Type
9Elevation Top Soil Texture
10Elevation Soil pH
11Elevation Flood Prone
12Elevation Temperature
13Elevation Rainfall
14Land Type Top Soil Texture
15Land Type Soil pH
16Land Type Flood Prone
17Land Type Temperature
18Land Type Rainfall
19Top Soil Texture Soil pH
20Top Soil Texture Flood Prone
21Top Soil Texture Temperature
22Top Soil Texture Rainfall
23Soil pH Flood Prone
24Soil pH Temperature
25Soil pH Rainfall
26Flood Prone Temperature
27Flood Prone Rainfall
28Temperature Rainfall
Signature    …………………………………
Name       (   )

Appendix B. “Land Suitability Analysis for Paddy in Northern Parts of Bangladesh: Introducing Geo-Spatial Insurance Premium” SURVEY

With this questionnaire, we expect the willingness to fill out the questionnaire according to your opinion. The questionnaire aims to complement the research data in the context of the preparation of the thesis with the title: “Land Suitability Analysis for Paddy in Northern Areas of Bangladesh: Introducing Geo-Spatial Insurance Premium”.
(Your response will only be used for research purposes and analysis.)
Identity of Respondent
1Name
2Position and Address

Appendix B.1. Section-1 Please select scale number of criteria for insurance premiums based on land suitability for rice production in the northern part of Bangladesh

Instruction: Please choose the scale number from 1 to 9.
Example: Which is the most important criteria to participate in crop insurance for rice production?
CriteriaProduct
Price
AwarenessBelieve of
Benefits
Collection
and
Distribution
of Money
Trust to
Company
Rules and
Regulations
Willingness
of Govt.
Govt.
Subsidy
Example95627433
Your Opinion
If you choose a number on scale 9, it means that Product Price is the most important, followed by Awareness, Believe of Benefits and others. If you choose the same scale, it means equally important.

Appendix B.2. Section-2 Please fill out with selecting weight of criteria for insurance premiums based on land suitability for rice production in the northern part of Bangladesh

Instruction: Please add a checklist (✓) on the column scale criteria (A) or at the column scale criteria (B) based on experts’ opinion.
Definition of scale:
1: the second equally important criteria3: criterion (A) is little more important than (B)
5: criteria (A) is more important than (B)7: criterion (A) is much more important than (B)
9: criterion (A) is absolutely more important than (B)* and that goes for the reverse
Example: In taking the decision to develop the crop insurance, how important this criterion:
Criteria AScale ScaleCriteria B
98765432123456789
1Product Price Awareness
If you give a sign checklist (✓) on a scale of 7 in column A, then it means that the criteria An in this example “Product Price” was more important than criteria B in this example “Awareness”.
Question: After deciding the most important criteria in Appendix B.1, how important the criteria if it compares one to another?
Criteria AScale ScaleCriteria B
98765432123456789
1Product Price Awareness
2Product Price Believe of Benefits
3Product Price Collection and
Distribution of
Money
4Product Price Trust to the Company
5Product Price Rules and
Regulations
6Product Price Willingness of
Government
7Product Price Govt. Subsidy
8Awareness Believe of Benefits
9Awareness Collection and
Distribution of
Money
10Awareness Trust to the Company
11Awareness Rules and
Regulations
12Awareness Willingness of
Government
13Awareness Govt. Subsidy
14Believe of
Benefits
Collection and
Distribution of
Money
15Believe of
Benefits
Trust to the Company
16Believe of
Benefits
Rules and
Regulations
17Believe of Benefits Willingness of
Government
18Believe of Benefits Government Subsidy
19Collection and
Distribution of
Money
Trust to the
Company
20Collection and
Distribution of
Money
Rules and
Regulations
21Collection and
Distribution of
Money
Willingness of
Government
22Collection and
Distribution of
Money
Government Subsidy
23Trust to the
Company
Rules and
Regulations
24Trust to the
Company
Willingness of
Government
25Trust to the
Company
Government
Subsidy
26Rules and Regulations Willingness of
Government
27Rules and
Regulations
Government Subsidy
28Willingness of
Government
Government Subsidy
Signature    …………………………………
Name       (   )

References

  1. Salman, S.M.; Mahul, O.; Bagazonzya, H.K. Agricultural Insurance in Bangladesh Promoting Access to Small and Marginal Farmers; The World Bank: Washington, DC, USA, 2010; p. 146. [Google Scholar]
  2. Habiba, U.; Shaw, R. Crop Insurance as a Risk Management Strategy in Bangladesh. In Disaster Risk Reduction Approaches in Bangladesh; Springer: Tokyo, Japan, 2009. [Google Scholar]
  3. Godfray, H.C.J.; Beddington, J.R.; Crute, I.R.; Haddad, L.; Lawrence, D.; Muir, J.F.; Pretty, J.; Robinson, S.; Thomas, S.M.; Toulmin, C. Food security: The challenge of feeding 9 billion people. Science 2010, 327, 812–818. [Google Scholar] [CrossRef] [PubMed]
  4. Ahmed, A.; Ryosuke, S. Climate Change and Agricultural Food Production of Bangladesh: An Impact Assessment Using GIS-Based Biophysical Crop; Simulation Model; Center for Spatial Information Science, University of Tokyo: Komaba, Japan, 2000. [Google Scholar]
  5. Chen, Y.; Lu, C. A Comparative Analysis on Food Security in Bangladesh, India and Myanmar. Sustainability 2018, 10, 405. [Google Scholar] [CrossRef]
  6. Clarke, D.; De Nicola, F.; Hill, R.V.; Kumar, N.; Mehta, P. A Chat about Insurance: Experimental Results from Rural Bangladesh. Appl. Econ. Perspect. Policy 2015, 37, 477–501. [Google Scholar] [CrossRef]
  7. Iturrioz, R. Agricultural Insurance. Available online: http://siteresources.worldbank.org/FINANCIALSECTOR/Resources/Primer12_Agricultural_Insurance.pdf (accessed on 26 May 2018).
  8. Holzmann, R. Risk and Vulnerability: The Forward Looking Role of Social Protection in a Globalizing World; Social Protection Discussion Paper No. SP 0109; The World Bank: Washington, DC, USA, 2002. [Google Scholar]
  9. Mechler, R.; Linnerooth-bayer, J.; Peppiatt, D. Disaster Insurance for the Poor ? A Review of Microinsurance for Natural Disaster Risks in Developing Countries; International Institute for Applied Systems Analysi: Laxenburg, Austria, 2006; pp. 1–31. [Google Scholar]
  10. Hazell, P. Potential Role for Insurance in Managing Catastrophic Risk in Developing Countries. Int. Food Policy Res. Inst. 2001, 1–12. Available online: http://citeseerx.ist.psu.edu/viewdoc/summary?doi=10.1.1.562.3304 (accessed on 26 May 2018).
  11. National Adaptation Programme of Action (NAPA). Ministry of Environment and Forest; Final Report 64, No. 642005; Government of the People’s Republic of Bangladesh: Dhaka, Bangladesh, 2005.
  12. Hazell, P.B.R. The Appropriate Role of Agricultural Insurance in Developing Countries. J. Int. Dev. 1992, 4, 567–581. [Google Scholar] [CrossRef]
  13. Anderson, J. Risk Management in Rural Development: A Review Rural Strategy Background Paper 7; The World Bank: Washington, DC, USA, 2001. [Google Scholar]
  14. Quiggin, J.; Kafwgiannis, G.; Stanton, J. Crop Insurance and Crop Production: An Empirical Study of Moral Hazard and Adverse Selection. Aust. J. Agric. Econ. 1993, 37, 95–113. [Google Scholar] [CrossRef]
  15. Spaulding, A.; Kanakasabai, M.; Hao, J.; Skees, J. Can Weather Derivative Contracts Help Mitigating Agricultural Risk? Microeconomic Policy Implications for Romania. In Proceedings of the International Conference for Policy Model, Istanbul, Turkey, 3–5 July 2003. [Google Scholar]
  16. Eugene, G.; Mahul, O. Enabling Productive but Asset-Poor Jamaican Farmers to Succeed: A Risk Financing Framework; WB Policy Reserch Working Paper; 2004; vol. 3211. Available online: http://siteresources.worldbank.org/CMUDLP/Resources/Gurenko_Farmer.pdf (accessed on 26 May 2018).
  17. Bryla, E.; Syroka, J. Developing Index-Based Insurance for Agriculture in Developing Countries. Sustain. Dev. Innov. Briefs 2007, 9, 421–438. [Google Scholar]
  18. Cole, S.; Giné, X.; Vickery, J. How Does Risk Management Influence Production Decisions? Evidence from a Field Experiment. Rev. Financ. Stud. 2017, 30, 1935–1970. [Google Scholar] [CrossRef]
  19. Berber, K.; Patrick, W. Research for Agricultural Insurance in South Asia: A Regional Dialogue; International Food Policy Research Institute: Washington, DC, USA, 2018; pp. 1–5. [Google Scholar]
  20. Collins, M.G.; Steiner, F.R.; Rushman, M.J. Land-Use Suitability Analysis in the United States: Historical Development and Promising Technological Achievements. Environ. Manag. 2001, 28, 611–621. [Google Scholar] [CrossRef] [PubMed]
  21. Malczewski, J. GIS-Based Land-Use Suitability Analysis: A Critical Overview. Prog. Plan. 2004, 62, 3–65. [Google Scholar] [CrossRef]
  22. Ferretti, V.; Pomarico, S. An Integrated Approach for Studying the Land Suitability for Ecological Corridors through Spatial Multicriteria Evaluations. Environ. Dev. Sustain. 2013, 15, 859–885. [Google Scholar] [CrossRef]
  23. Hassan, M.M.; Nazem, M.N.I. Examination of Land Use/land Cover Changes, Urban Growth Dynamics, and Environmental Sustainability in Chittagong City, Bangladesh. Environ. Dev. Sustain. 2016, 18, 697–716. [Google Scholar] [CrossRef]
  24. Hossain, M.S.; Chowdhury, S.R.; Das, N.G.; Sharifuzzaman, S.M.; Sultana, A. Integration of GIS and Multicriteria Decision Analysis for Urban Aquaculture Development in Bangladesh. Landsc. Urban Plan. 2009, 90, 119–133. [Google Scholar] [CrossRef]
  25. Abdullahi, S.; Pradhan, B.; Mansor, S.; Shariff, A.R.M. GIS-Based Modeling for the Spatial Measurement and Evaluation of Mixed Land Use Development for a Compact City. GISci. Remote Sens. 2015, 52, 18–39. [Google Scholar] [CrossRef]
  26. Talukder, B.; Blay-Palmer, A.; Hipel, K.W.; vanLoon, G.W. Elimination Method of Multi-Criteria Decision Analysis (MCDA): A Simple Methodological Approach for Assessing Agricultural Sustainability. Sustainability 2017, 9, 287. [Google Scholar] [CrossRef]
  27. Rikalovic, A.; Cosic, I.; Lazarevic, D. GIS Based Multi-Criteria Analysis for Industrial Site Selection. Procedia Eng. 2014, 69, 1054–1063. [Google Scholar] [CrossRef]
  28. Muhsin, N.; Ahamed, T.; Noguchi, R. GIS-based multi-criteria analysis modeling used to locate suitable sites for industries in suburban areas in Bangladesh to ensure the sustainability of agricultural lands. Asia-Pac. J. Reg. Sci. 2017, 1–30. [Google Scholar] [CrossRef]
  29. Chandio, I.A.; Matori, A.N.B.; WanYusof, K.B.; Talpur, M.A.H.; Balogun, A.L.; Lawal, D.U. GIS-Based Analytic Hierarchy Process as a Multicriteria Decision Analysis Instrument: A Review. Arab. J. Geosci. 2013, 6, 3059–3066. [Google Scholar] [CrossRef]
  30. Saaty, T.L. The Analytic Hierarchy Process; McGraw Hill: New York, NY, USA, 1980. [Google Scholar]
  31. Bhushan, N.; Rai, K. Strategic Decision Making Applying the Analytic Hierarchy Process; Springer, CREAX Information Technologies Pvt. Ltd.: Bangalore, India, 2004; pp. 11–21. [Google Scholar]
  32. Dalhaus, T.; Musshoff, O.; Finger, R. Phenology Information Contributes to Reduce Temporal Basis Risk in Agricultural Weather Index Insurance. Sci. Rep. 2018, 8, 1–10. [Google Scholar] [CrossRef] [PubMed]
  33. HIES. Preliminary Report on Household Income and Expenditure Survey 2016; Bangladesh Bureau of Statistics (BBS), Statistics and Informatics Division (SID), Ministry of Planning: Dhaka, Bangladesh, 2016.
  34. Bangladesh Bureau of Statistics (BBS). Small Area Atlas of Bangladesh; Ministry of Planning: Dhaka, Bangladesh, 2014.
  35. Bangladesh Bureau of Statistics (BBS). Statistical Pocket Book Bangladesh 2016; Ministry of Planning: Dhaka, Bangladesh, 2017.
  36. Euro, B.; Nijkamp, P. Land-Use Management and the Path towards Sustainability, Multicriteria Analysis for Land-Use Management; Springer: Dordrecht, The Netherlands, 1998; pp. 1–13. [Google Scholar]
  37. Ashford, S.A.; Sitar, N.; Lysmer, J.; Deng, N. Topographic Effects on the Seismic Response of Steep Slopes. Bull. Seismol. Soc. Am. 1997, 87, 701–709. [Google Scholar]
  38. Global Rice Science Partnership (GRiSP). Rice Almanac; GRiSP: Maisach, Germany, 2013. [Google Scholar]
  39. Hussain, W.; Sohaib, O.; Ahmed, A.; Khan, M.Q. Geographical Information System Based Model of Land Suitability for Good Yield of Rice in Prachuap Khiri Khan Province, Thailand. Sci. Technol. Dev. 2012, 31, 1–9. [Google Scholar]
  40. Asai, H.; Samson, B.K.; Stephan, H.M.; Songyikhangsuthor, K.; Homma, K.; Kiyono, Y.; Horie, T. Biochar amendment techniques for upland rice production in Northern Laos: 1. Soil physical properties, leaf SPAD and grain yield. Field Crops Res. 2009, 111, 81–84. [Google Scholar] [CrossRef]
  41. Dou, F.; Soriano, J.; Tabien, R.E.; Chen, K. Soil Texture and Cultivar Effects on Rice (Oryza Sativa, L.) Grain Yield, Yield Components and Water Productivity in Three Water Regimes. PLoS ONE 2016, 11, e0150549. [Google Scholar] [CrossRef] [PubMed] [Green Version]
  42. Paul, B.; Rashid, H. Climatic Hazards in Coastal Bangladesh: Non-Structural and Structural Solution; Butterworth-Heinemann: Oxford, UK, 2016; pp. 121–152. [Google Scholar]
  43. Bangladesh Bureau of Statistics (BBS). Yearbook of Agricultural Statistics-2015; Ministry of Planning: Dhaka, Bangladesh, 2016.
  44. Guo, X.; Li, H.; Yu, H.; Li, W.; Ye, Y.; Biswas, A. Drivers of spatio-temporal changes in paddy soil pH in Jiangxi Province, China from 1980 to 2010. Sci. Rep. 2018, 8, 2702. [Google Scholar] [CrossRef] [PubMed]
  45. Samanta, S.; Pal, B.; Pal, D.K. Land Suitability Analysis for Rice Cultivation Based on Multi-Criteria Decision Approach through GIS. Data Base 2011, 12–20. [Google Scholar] [CrossRef]
  46. Ayehu, G.T.; Besufekad, S.A. Land Suitability Analysis for Rice Production: A GIS Based Multi-Criteria Decision Approach. Am. J. Geogr. Inf. Syst. 2015, 4, 95–104. [Google Scholar]
  47. Kihoro, J.; Bosco, N.J.; Murage, H. Suitability Analysis for Rice Growing Sites Using a Multicriteria Evaluation and GIS Approach in Great Mwea Region, Kenya. Springerplus 2013, 2, 265. [Google Scholar] [CrossRef] [PubMed]
  48. Amin, M.R.; Zhang, J.; Yang, M. Effects of Climate Change on the Yield and Cropping Area of Major Food Crops: A Case of Bangladesh. Sustainability 2015, 7, 898–915. [Google Scholar] [CrossRef]
  49. United Nations Development Program (UNDP). Reducing Disaster Risk: A Challenge for Development-A Global Report; UNDP: New York, NY, USA, 2004. [Google Scholar]
  50. Chauhan, B.S.; Jabran, K.; Mahajan, G. Rice Production Worldwide; Springer International Publishing: Basel, Switzerland, 2017; pp. 255–277. [Google Scholar]
  51. Ministry of Environment and Forests (MoEF). Bangladesh Climate Change Strategy and Action Plan 2008; Government of the People’s Republic of Bangladesh: Dhaka, Bangladesh, 2008.
  52. Food and Agriculture Organization (FAO). A Framework for Land Evaluation; Food and Agriculture Organization of the United Nations, Soils Bulletin 32; FAO: Rome, Italy, 1976. [Google Scholar]
  53. Eastman, J.R.; Jiang, H.; Toledano, J. Multi-Criteria and Multi-Objective Decision Making for Land Allocation Using GIS. Multicriteria Anal. Land Use Manag. 1998, 9, 227–251. [Google Scholar]
  54. Mustafa, A.A.; Singh, M.; Sahoo, R.N.; Ahmed, N.; Khanna, M.; Sarangi, A. Land Suitability Analysis for Different Crops: A Multi Criteria Decision Making Approach Using Remote Sensing and GIS. Water Technol. 2011, 3, 61–84. [Google Scholar]
  55. Engineering, I.; Triantaphyllou, E.; Mann, S.H. Using the Analytic Hierarchy Process for Decision Making in Engineering Applications: Some Challenges. Int. J. Ind. Eng. 1995, 2, 35–44. [Google Scholar]
  56. Kiker, G.A.; Bridges, T.S.; Varghese, A.; Seager, T.P.; Linkov, I. Application of Multicriteria Decision Analysis in Environmental Decision Making. Integr. Environ. Assess. Manag. 2005, 1, 95–108. [Google Scholar] [CrossRef] [PubMed]
  57. Saaty, T.L. How to Make a Decision: The Analytic Hierarchy Process. Eur. J. Oper. Res. 1990, 48, 9–26. [Google Scholar] [CrossRef]
  58. Saaty, T.L.; Vargas, L.G. Models, Methods, Concepts & Applications of the Analytic Hierarchy Process; Springer US: New York, NY, USA, 2012. [Google Scholar]
  59. Cole, S.A.; Xiong, W. Agricultural Insurance and Economic Development. Annu. Rev. Econ. 2017, 9, 235–262. [Google Scholar] [CrossRef]
  60. Donald, C.M.; Hamblin, J. The Biological Yield and Harvest Index of Cereals as Agronomic and Plant Breeding Criteria. Adv. Agron. 1976, 28, 361–405. [Google Scholar]
  61. Ahamed, T.; Noguchi, R.; Takigawa, T.; Tian, L. Bioproduction Engineering, Automation and Precision Agronomics for Sustainable Agricultural Systems, 2nd ed.; Nova Science Publishers: New York, NY, USA, 2016. [Google Scholar]
  62. Hill, R.V.; Kumar, N.; Magnan, N.; Makhija, S.; de Nicola, F.; Spielman, D.J.; Ward, P.S. Insuring against Droughts: Evidence on Agricultural Intensification and Index Insurance Demand from a Randomized Evaluation in Rural Bangladesh; International Food Policy Research Institute: Washington, DC, USA, 2017; p. 40. [Google Scholar]
  63. Akter, S.; Brouwer, R.; Choudhury, S.; Aziz, S. Is There a Commercially Viable Market for Crop Insurance in Rural Bangladesh? Mitig. Adapt. Strateg. Glob. Chang. 2009, 14, 215–229. [Google Scholar] [CrossRef]
  64. Mottaleb, K.A.; Mohanty, S. Farm size and profitability of rice farming under rising input costs. J. Land Use Sci. 2015, 10, 243–255. [Google Scholar] [CrossRef]
  65. Dick, W.J.A.; Wang, W. Government Interventions in Agricultural Insurance. Agric. Agric. Sci. Procedia 2010, 1, 4–12. [Google Scholar] [CrossRef]
  66. Sinha, S.; Tripathi, N.K. Assessing the Challenges in Successful Implementation and Adoption of Crop Insurance in Thailand. Sustainability 2016, 8, 1306. [Google Scholar] [CrossRef]
  67. Wang, M.; Ye, T.; Shi, P. Factors Affecting Farmers’ Crop Insurance Participation in China. Can. J. Agric. Econ. 2016, 64, 479–492. [Google Scholar] [CrossRef]
  68. European Commission. Agricultural Insurance Schemes. Summary Report, Directorate General JRC, Joint Research Centre—ISPRA, Institute for the Protection and Security of the Citizen, Agriculture and Fisheries Unit; European Commission: Brussels, Belgium, 2006; pp. 1–16. [Google Scholar]
  69. Iqbal, M.T. Cost Requirements for Cultivation of Boro Rice (Oriza Sativa) under Different Farming Systems. J. Agron. 2005, 4, 366–368. [Google Scholar]
  70. Chen, W.S.; Tse, Y.K. Financial Mathematics (2017) for Actuaries, 2nd ed.; World Scientific Publishing Pte Ltd.: Hackensack, NJ, USA, 2017; pp. 4–45. ISBN 978-981-3224-67-4. [Google Scholar]
  71. Akram, S. Subsidy in Agriculture, The Financial Express, December 08. 2017. Available online: https://thefinancialexpress.com.bd/views/opinions/subsidy-in-agriculture-1512751118 (accessed on 15 January 2018).
  72. Byron, R.K. Subsidy Expense to Go up 17.3 pc, The Daily Star, June 02. 2017. Available online: https://www.thedailystar.net/Bangladesh-Budget-2017-18/frontpage/subsidy-expense-go-173pc-1414411 (accessed on 15 October 2017).
  73. Islam, N. IFI Watch Bangladesh, Bangladesh Working Group on International Financial Institute and Trade Organizations, Agriculture Subsidies: Govt. Pledges vs. IFI’s Aversion. January 2009. Available online: http://www.unnayan.org/documents/International_Economic_Relations/IFI_Agriculture_Subsidies.pdf (accessed on 11 July 2017).
  74. Rathore, V.; Rao, M.J. The Performance of PMFBY and Other Crop Insurance Models in India. Int. J. Adv. Res. Dev. 2017, 2, 2455–4030. [Google Scholar]
Figure 1. Northern part of Bangladesh, covering three districts: Rangpur, Lalmonirhat, and Kurigram.
Sustainability 10 01759 g001
Figure 2. Rice growing season of Bangladesh with the monthly average temperature (°C) and rainfall (mm).
Sustainability 10 01759 g002
Figure 3. Conceptual framework for land suitability and insurance premiums.
Sustainability 10 01759 g003
Figure 4. Criteria layers: (a) Slope; (b) Elevation; (c) Land Type; (d) Topsoil Texture; (e) Soil pH; (f) Flood Prone; (g) Rainfall; (h) Temperature; and (i) Land Use for the northern part of Bangladesh.
Sustainability 10 01759 g004aSustainability 10 01759 g004bSustainability 10 01759 g004c
Figure 5. Rice land suitability map for the northern part of Bangladesh.
Sustainability 10 01759 g005
Table 1. Criteria used, data range, and suitability class for rice.
CriteriaS1S2S3N1Reference
Slope<10°11°–30°31°–50° Atalay, 2006
Elevation<50 m51–100 m101–150 m151–200 mGRiSP, 2013;
Walayat et al., 2012
Land TypeMedium
High/lowland
High LandLowlandVery LowlandPaul and Rashid, 2016;
BBS, 2016
Top Soil
Texture
Predominant Clay
Predominant Silt Clay
Predominant Silt
Clay Loam
Predominant
Silt Loam
Predominant
Clay Loam
Predominant
Loam
Predominant
Sandy Loam
Dou et al., 2016;
USDA;
Asai et al., 2009
Soil pH5.5–7.37.3–8.44.5–5.5<4 & >8Samanta et al., 2011;
Ayehuet al., 2015;
Kihoro et al., 2013
Flood ProneNot Flood ProneModerate
Tidal Surge
Moderate River
Flooding
Low River Flooding,
Severe River Flooding
Datta et. al., 2017;
BBS, 2016
Temperature20–3010–2030–40 Samanta et al., 2011;
Kihoro et al., 2013
Rainfall1000–2000 mm2000–3500 mmMore than
3500 mm
GRiSP, 2013
Land UseSettlements, Rivers, Waterbodies, ForestsRestrictions
Table 2. USDA topsoil texture suitability rating for rice.
Textural ClassesDescription (USDA)Rating
SandsMore than 85% sand, 0%–10% clay, and 0%–15% silt3
Loamy Sands70%–91% sand, 0%–15% clay, and 0%–30% silt3
Sandy LoamsMore than 43% sand, less than 7% clay, and less than 50% silt3
Sandy Clay LoamMore than 45% sand, 20%–35% clay, less than 28% silt3
Sandy Clay45% or more sand and 35% or more clay2
LoamLess than 52% sand, 7%–27% clay, 28%–50% silt2
Silt LoamLess than 12% clay and 50%–80% silt2
Clay Loam20%–45% sand and 27%–40% clay2
SiltLess than 12% clay and 80% or more silt2
Silty Clay LoamLess than 20% sand and 27%–40% clay1
Silty Clay40% or more clay and 40% or more silt1
ClayLess than 45% sand, 40% or more clay, and less than 40% silt1
Table 3. AHP pairwise comparison scale (Saaty, 1990).
Intensity of ImportanceExplanation
1Equally important
3Moderately important to one activity over another
5Strongly important to one activity over another
7Very strong important to one activity over another
9Extremely important to one activity over another
2, 4, 6, 8When compromise is needed Intermediate values
ReciprocalsValues for inverse comparison
Table 4. The judgements of experts in prioritizing the weights of the different factors for the land suitability analysis (A–J, experts from different fields).
FactorsABCDEFGHIJAverage
Slope0.1100.0220.0910.1270.0390.0650.0690.0330.1260.0370.072
Elevation0.1750.0400.0520.1790.0410.0490.0500.0380.0530.0380.071
Land type0.1470.3990.2780.1270.0840.2810.2150.2680.2210.3060.233
Top Soil Texture0.1080.0370.2590.1270.0400.0650.1160.0700.1920.0770.109
Soil pH0.0530.0290.0230.0550.0620.0340.0210.0350.0390.0390.039
Flood Prone0.1030.0920.0280.1330.0730.0940.0840.0960.0450.1030.085
Temperature0.1300.2340.1310.1070.3580.2210.1380.3080.0760.1880.189
Rainfall0.1730.1480.1390.1450.3030.1910.3060.1520.2460.2120.202
CR0.0860.0960.0980.0350.0940.0900.0960.0550.0970.072
Table 5. Random inconsistency indices for n = 10 (Saaty, 1980).
n12345678910
Random consistency index (RI)000.580.91.121.241.321.411.451.49
Table 6. List of data and original data sources used for land suitability assessment for rice production.
NoDataDescriptionSource
1Land Use MapScale at 1:50,0002015, LGED, Bangladesh
2Slope MapDerived from 30-m resolution2017, DEM STRM
3Elevation MapDerived from 30-m resolution2017, DEM STRM
4Land typeScale 1:50,0002015, BCA, Bangladesh
5Top Soil Texture MapScale 1:50,0002015, BCA, Bangladesh
6Soil pH MapScale 1:50,0002015, BCA, Bangladesh
7Flood Prone MapScale 1:50,0002015, BCA, Bangladesh
8Temperature MapScale 1:50,0002015, BCA, Bangladesh
9Rainfall MapScale 1:50,0002015, BCA, Bangladesh
Table 7. The judgements of experts in prioritizing the weights of the different factors for introducing crop insurance premium model (A–J, experts from different fields).
FactorsABCDEFGHIJAverage
Product Price0.2680.3410.2780.2790.0840.2810.2150.3990.2210.3060.267
Government Subsidy0.0700.2230.2590.1120.0400.0650.1160.0370.1920.0770.119
Awareness0.0330.1650.0910.0650.0390.0650.0690.0220.1260.0370.071
Willingness of the
Government
0.0350.0220.0230.0290.0620.0340.0210.0290.0390.0390.033
Believe of Benefits0.0380.0490.0520.0650.0410.0490.0500.0400.0530.0380.048
Trust to the Company0.0960.0270.0280.0280.0730.0940.0840.0920.0450.1030.067
Rules and Regulations0.1520.0910.1390.2390.3030.1910.3060.1480.2460.2120.203
Collection and
Distribution of money
0.3080.0820.1310.1830.3580.2210.1380.2340.0760.1880.192
CR0.0550.0970.0980.0970.0940.0900.0960.0960.0970.072
Table 8. Land suitability analysis for rice production sites.
ClassesArea (sq. km)%
Highly Suitable1337.0222.74
Moderately Suitable1678.0428.54
Marginally Suitable873.7114.86
Currently Not Suitable69.971.19
Permanently Not Suitable1920.8732.67
Total5879.60100
Table 9. The premium rate, premium per hector per month, and premium per pixel per month based on the proposed coverage.
Marginally Coverage
(70% Yield Coverage)
Moderately Coverage
(80% Yield Coverage)
Highly Coverage
(90% Yield Coverage)
Percent-Age
(%)
Per
Hector
(USD)
Per
Pixel
(USD)
Percent-Age
(%)
Per
Hector
(USD)
Per
Pixel
(USD)
Percent-Age
(%)
Per
Hector
(USD)
Per
Pixel
(USD)
Highly
Suitable
2%238.988.073%271.879.184%304.4510.28
Moderately
Suitable
3%237.898.034%270.629.135%303.0510.23
Marginally
Suitable
4%236.808.005%269.389.096%301.6610.18