Article

Model-Based Evaluation of Urban River Restoration: Conflicts between Sensitive Fish Species and Recreational Users

by
Aude Zingraff-Hamed
1,2,*,
Markus Noack
3,
Sabine Greulich
1,
Kordula Schwarzwälder
4,5,
Karl Matthias Wantzen
1,6 and
Stephan Pauleit
2
1
Interdisciplinary Research Center for Cities, Territories, Environment and Society (UMR CNRS 7324 CITERES), University François Rabelais, 33 allée Ferdinand de Lesseps, 37000 Tours, France
2
Strategic Landscape Planning and Management, Center of Life and Food Sciences Weihenstephan, Technical University of Munich, Emil-Ramann-Str. 6, 85354 Freising, Germany
3
Institute for Modelling Hydraulic and Environmental Systems, University of Stuttgart, Pfaffenwaldring 61, 70569 Stuttgart, Germany
4
Hydraulic and Water Resources Engineering, Technical University of Munich, Arcisstr. 21, 80333 Munich, Germany
5
Department of Civil and Environmental Engineering, Norwegian University of Science and Technology, Høgskoleringen 7a, 7491 Trondheim, Norway
6
Applied Aquatic Ecology and UNESCO Chair “River Cu lture-Fleuves et Patrimoine” CNRS UMR CITERES, University François Rabelais, 33 allée Ferdinand de Lesseps, 37000 Tours, France
*
Author to whom correspondence should be addressed.
Sustainability 2018, 10(6), 1747; https://doi.org/10.3390/su10061747
Submission received: 22 March 2018 / Revised: 13 May 2018 / Accepted: 24 May 2018 / Published: 26 May 2018
(This article belongs to the Special Issue Human–River Interactions in Cities)

Abstract

:
Urban rivers are socioecological systems, and restored habitats may be attractive to both sensitive species and recreationists. Understanding the potential conflicts between ecological and recreational values is a critical issue for the development of a sustainable river-management plan. Habitat models are very promising tools for the ecological evaluation of river restoration projects that are already concluded, ongoing, or even to be planned. With our paper, we make a first attempt at integrating recreational user pressure into habitat modeling. The objective of this study was to analyze whether human impact is likely to hinder the re-establishment of a target species despite the successful restoration of physical habitat structures in the case of the restoration of the Isar River in Munich (Germany) and the target fish species Chondostroma nasus L. Our analysis combined high-resolution 2D hydrodynamic modeling with mapping of recreational pressure and used an expert-based procedure for modeling habitat suitability. The results are twofold: (1) the restored river contains suitable physical habitats for population conservation but has low suitability for recruitment; (2) densely used areas match highly suitable habitats for C. nasus. In the future, the integrated modeling procedure presented here may allow ecological refuge for sensitive target species to be included in the design of restoration and may help in the development of visitor-management plans to safeguard biodiversity and recreational ecosystem services.

Graphical Abstract

1. Introduction

Centuries of human activities have directly or indirectly degraded, damaged, transformed, or entirely destroyed aquatic ecosystems [1], threatening worldwide riverine ecosystem services [2], e.g., water security for fauna, flora, and humans [3]. Restoration activities are essential to re-establish the functional capacities of ecosystems for providing and maintaining biological and cultural diversity [1,2,4]. River restoration is a term applied to a wide range of activities concerned with “repairing waterways that can no longer perform essential ecological and social functions” [5]. Project surveys in the United States, Japan, Australia, Germany, and France have shown that improving instream physical habitats through hydro-morphological changes is one of the most common goals of restoration [6,7,8,9,10,11]. Hydro-morphological river restoration intends to recreate natural forms of the river course or at least mitigates the human impact, for instance removing artificial embankments and meandering the river bed. However, despite significant hydro-morphological changes, indicator species may not recover [12,13,14,15], which suggests that stressors other than hydro-morphological degradations still affect the biota in restored river sections [10,12].
Urban rivers are showpieces of a socioecological system [11], and their restoration often faces conflicts between ecological quality and recreational uses. They are particularly impoverished in habitat diversity and quality [16,17], and their dysfunctions have been described as the “urban river syndrome” [18]. At the same time, urban rivers have important cultural functions [19], and their restoration (or rehabilitation) is often driven by citizens’ demands for more near-natural landscapes and for a greater recreational potential [11,20]. Rather than ecological restoration in the sense of a return to pre-disturbance conditions, which is unlikely in urban areas [21], urban river restoration often aims at integrating ecological demands into urban planning [20]. According to the socioecological approach of the “River Culture Concept” [2], improvements in ecosystem functions and biodiversity will have a positive effect on human culture, e.g., riverine recreational activities [22]. Junker and Buchecker [23] also showed that users respond very positively to morphological river restoration. With population growth and increasing demands for recreational opportunities in urban areas, an increase in the use of river beaches for leisure activities has been predicted since the 1990s [24], especially on urban rivers with improving water quality [2]. However, recreational activities cause pressures on ecosystems; for example, they negatively impact wildlife, soil, and vegetation [25,26,27,28,29,30]. Therefore, conflicts between ecological restoration and recreational uses are likely to exist [31,32], but impacts of recreational users have been overlooked in comparison to those of other perturbations [33,34,35].
While project assessment is an important procedure for feedback and guidance, few river restoration projects implement an evaluation procedure. Studies showed that in the United States, less than 10% of river restorations have been monitored [6]. Similar observations have been made in Bavaria, Germany [36]. Recent studies identified five difficulties faced in the evaluation of river-restoration projects:
  • Requisite data are missing because pre- and post-restoration monitoring is absent for many projects or occurs over a very short period [9,36].
  • Control sites are inappropriate for assessing the success of restoration [9,37].
  • Biological indicators have serious limitations [38,39,40], such as a lack of identification of the causes of failures in restoration.
  • Current evaluation procedures investigate ecological responses, but social evaluation remains lacking [9,36,41]. Few studies have performed parallel investigations into both social and biological aspects, e.g., water quality and project acceptance, but without the integration of both aspects into a single evaluation method, the resulting conclusions remain speculative.
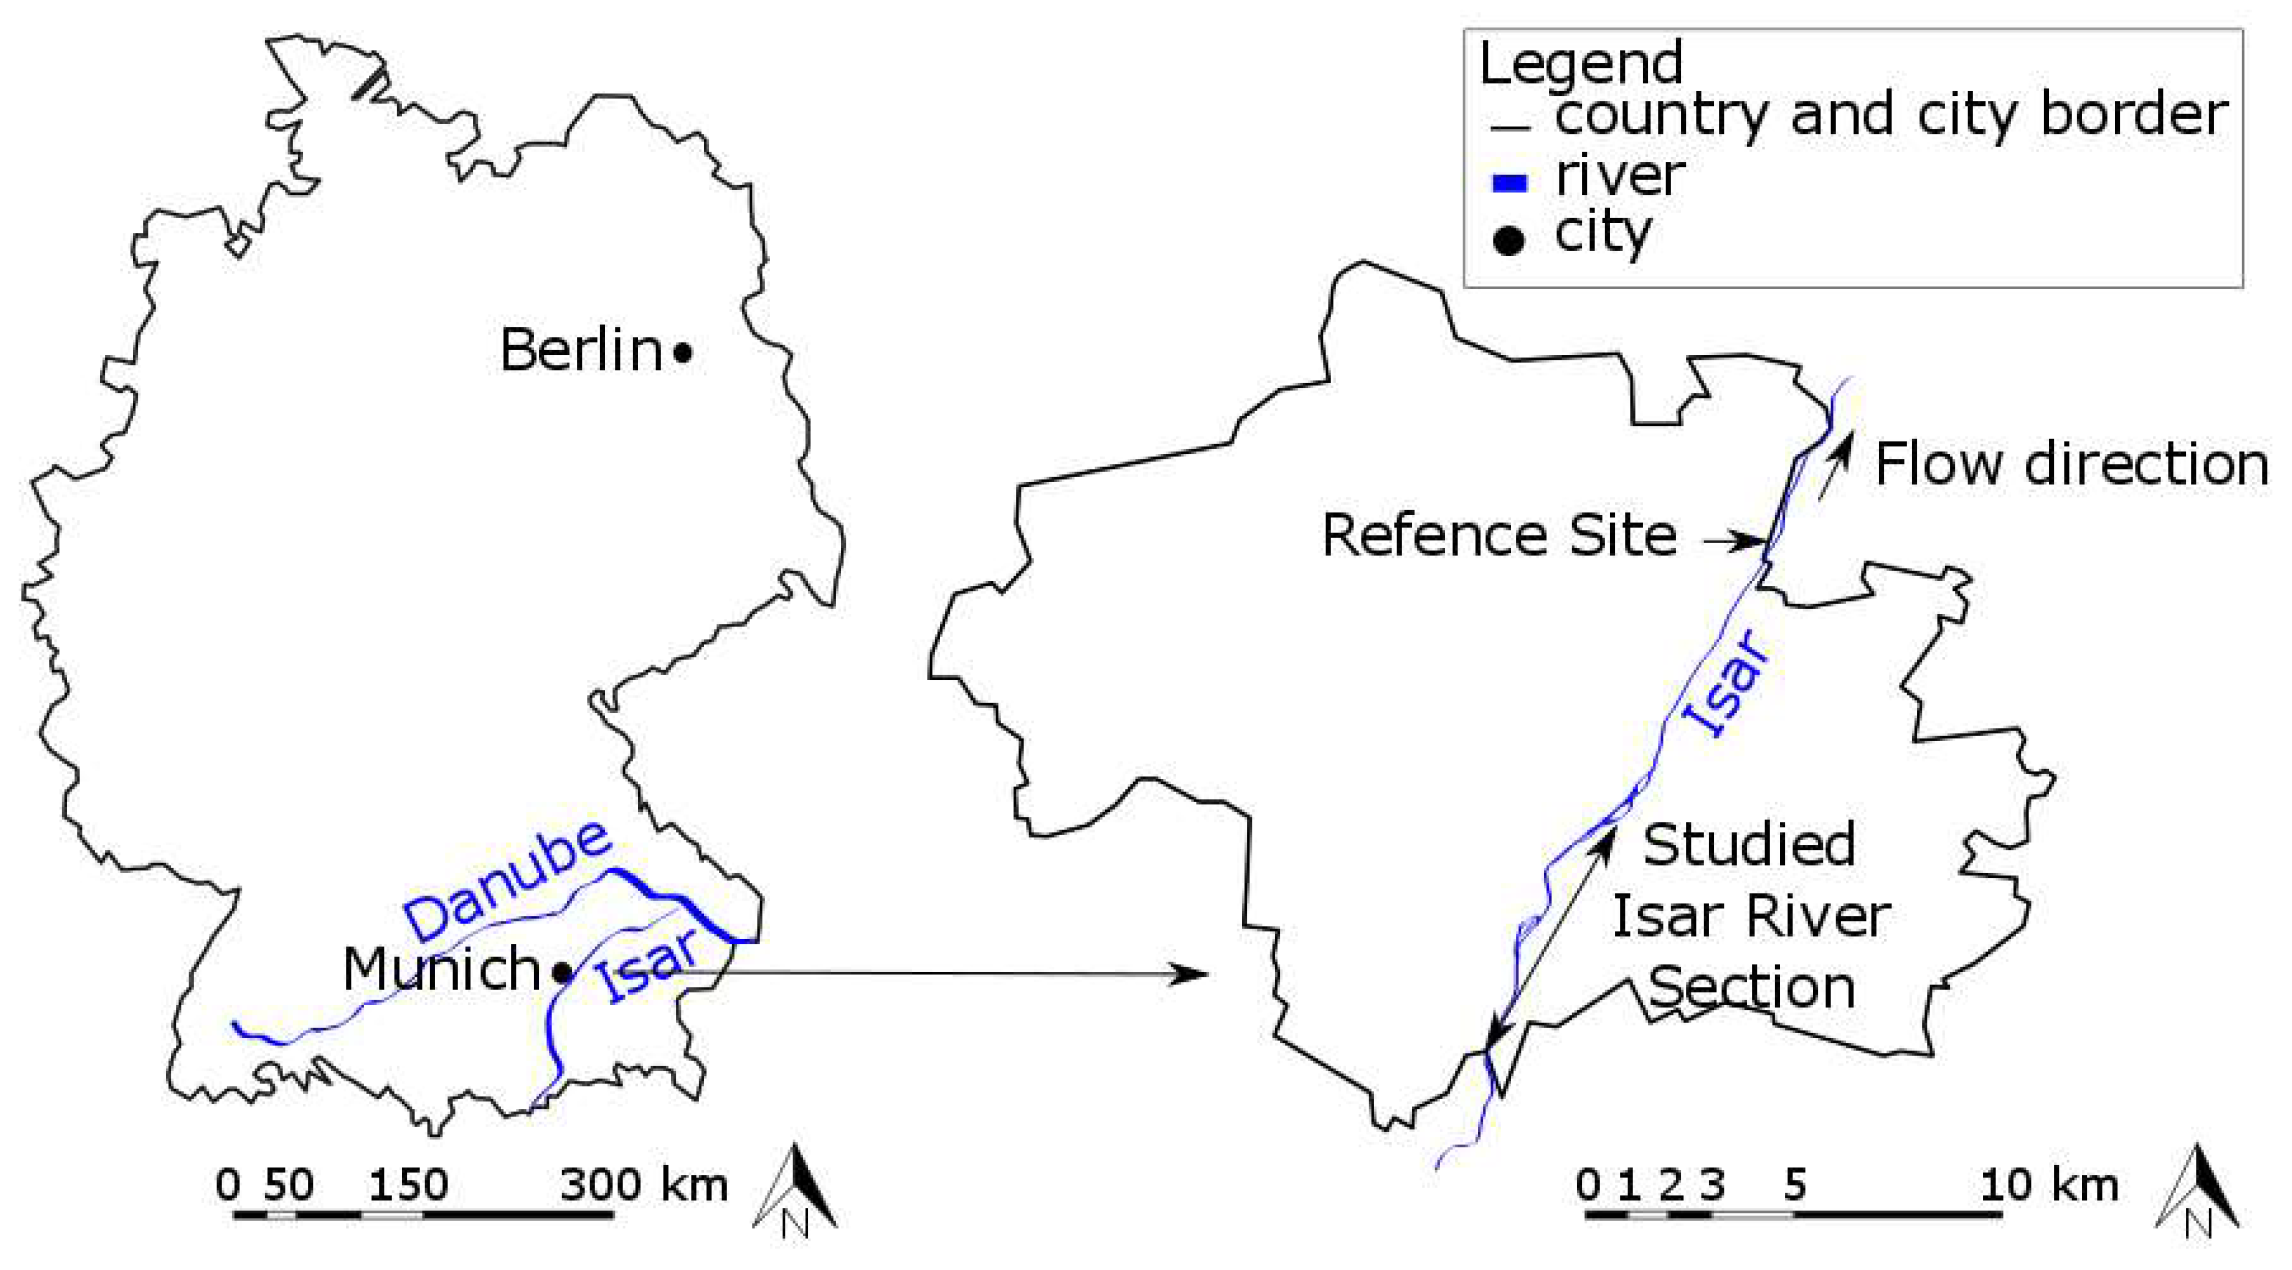
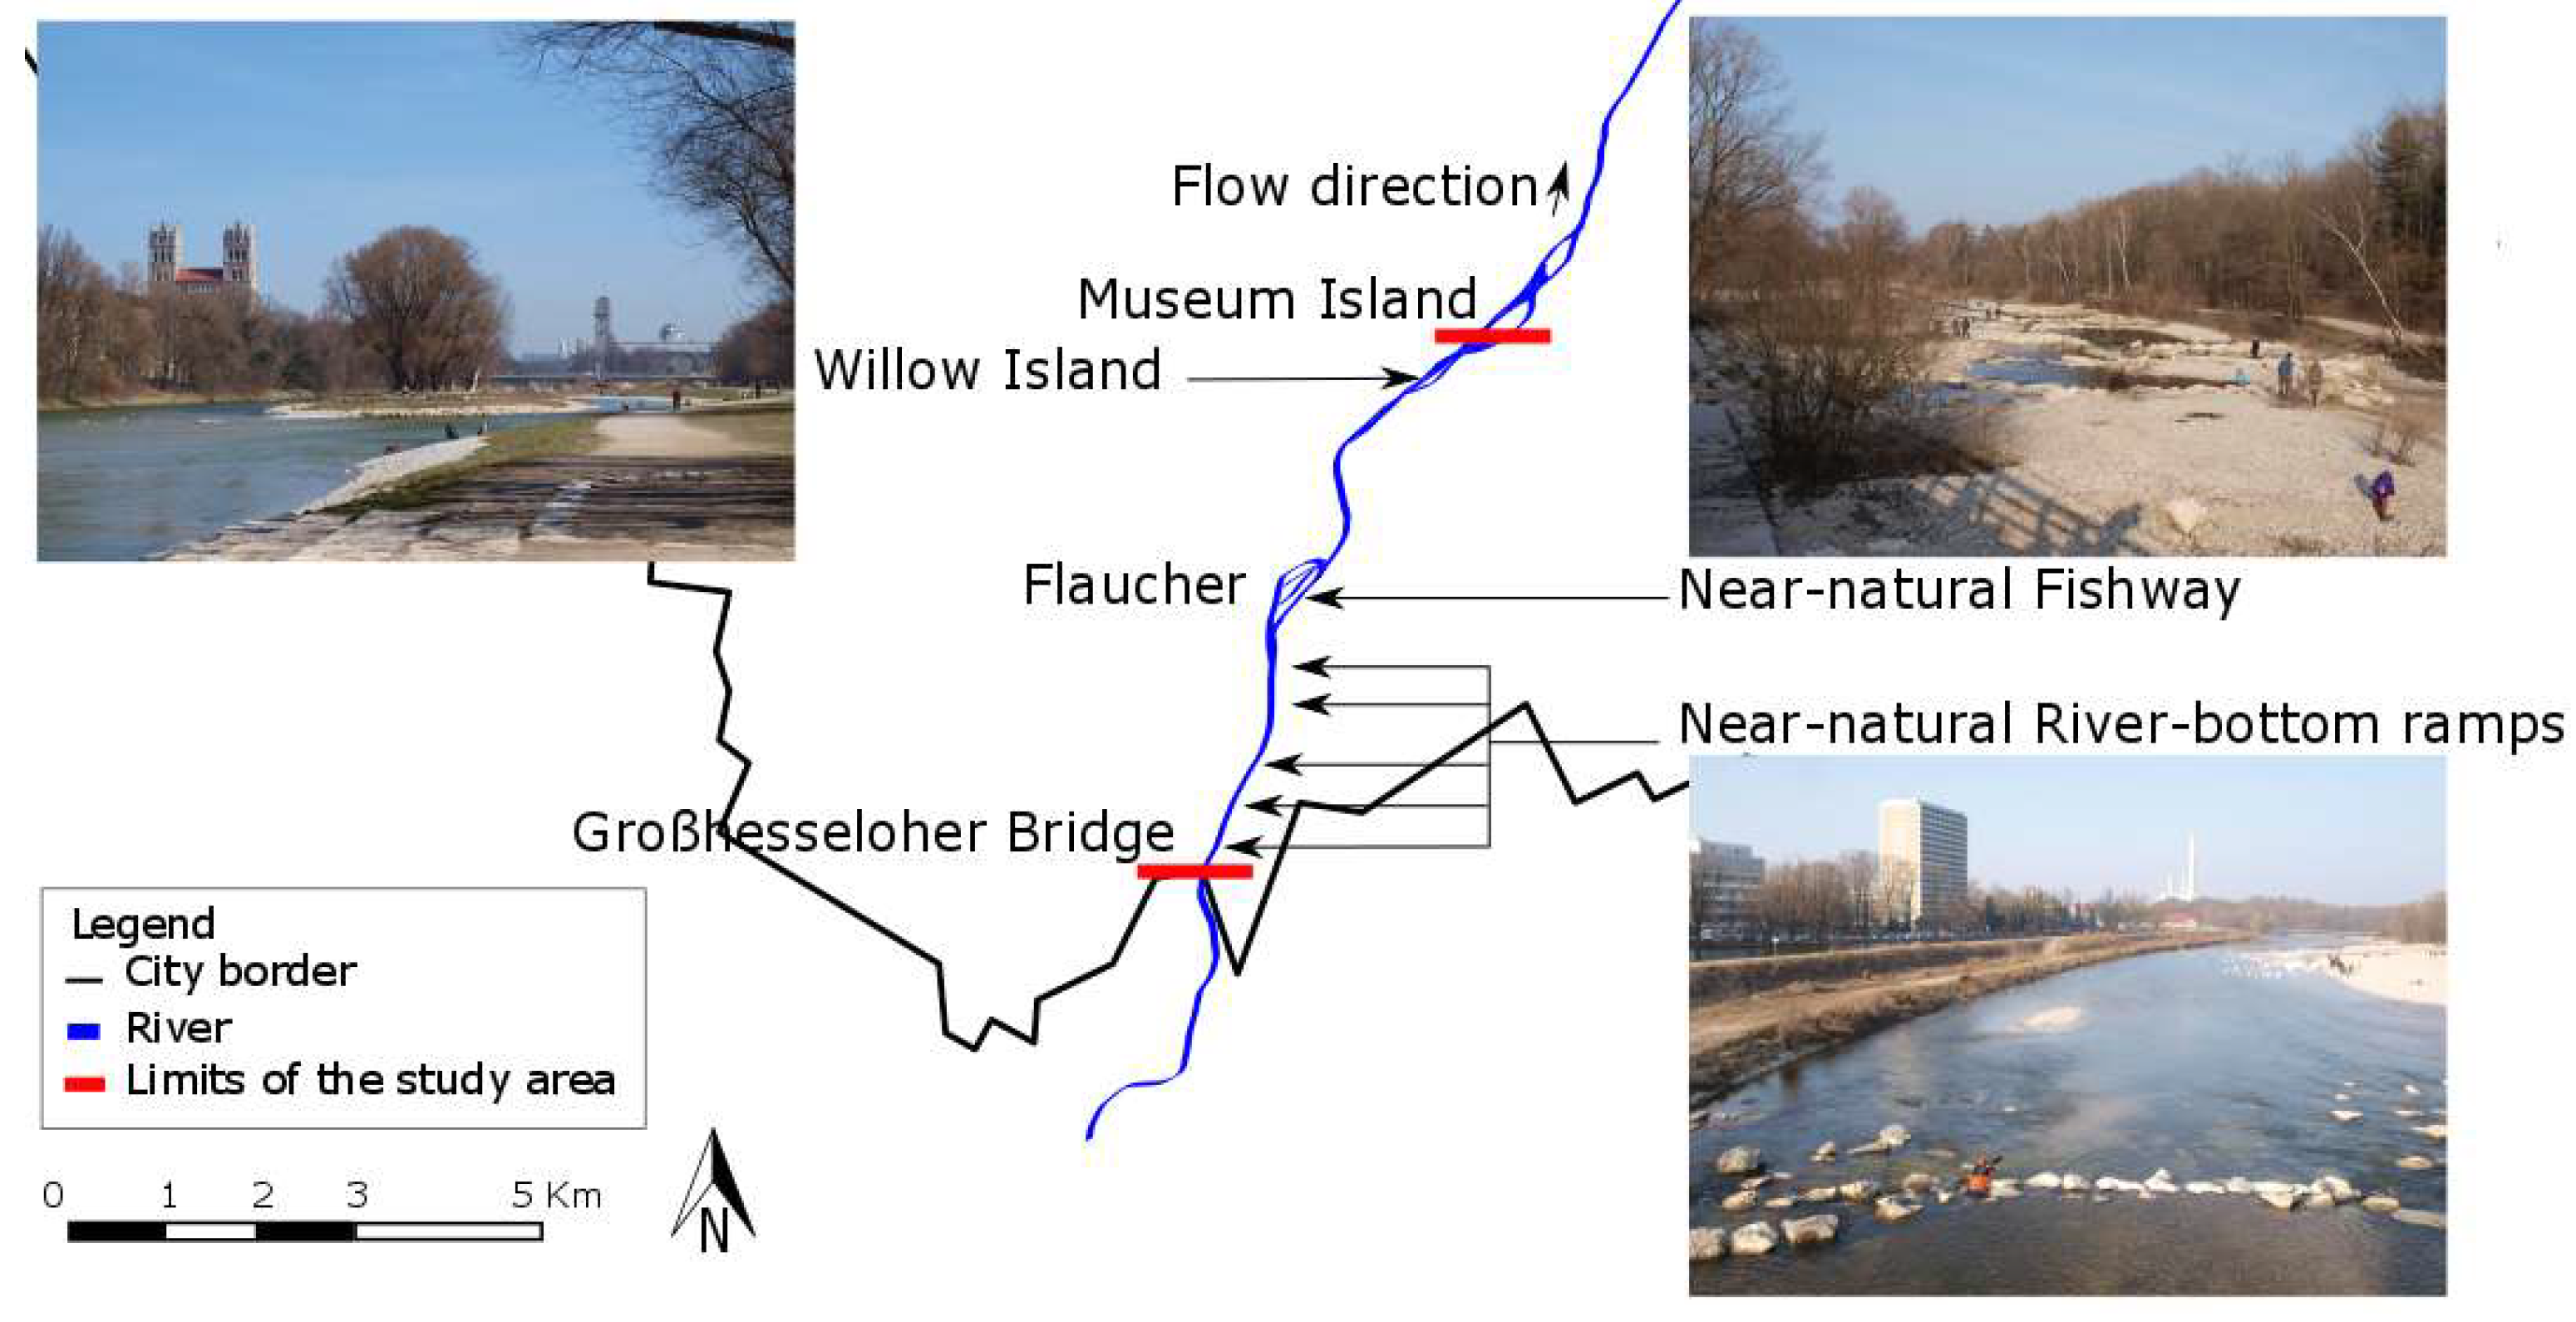
  • The time span needed for the re-establishment of a target species is often longer than the monitoring period [9,12,13].
Furthermore, the evaluation method should inform about potential conflicts, integrate social and ecological assessments, and investigate the quality of the physical habitat.
Habitat models are very promising tools and may contribute to solving this part of the problem. Habitat models are appropriate tools to investigate physical habitats and their ecological functions. Habitat simulation models are increasingly used in water management and the investigation of habitat changes caused by hydropeaking [42,43,44], weir removal [45,46], and the presence of reservoirs. The models also help in the decision-making process for choosing the most efficient restoration design [47]. The Physical Habitat Simulation (PHABSIM) model was the first widely available physical habitat model and was used in the 1990s to assess restoration measures [48], but it uses univariate functions and ignores interactions among physical habitat variables, which cause major limitations [49]. The Computer Aided Simulation Model for Instream Flow Requirements (CASiMiR) solves these limitations by using an approach based on fuzzy logic, sets, and rules to integrate interactions between physical habitat variables and enable the prediction of habitat selection for different fish species and life cycle stages in defined river types [49,50,51,52,53]. However, habitat models such as CASiMiR are solely based on physical hydro-morphological variables that affect the ecological function of habitats, whereas human impacts by recreational uses of river banks on the availability of instream habitats for the target fauna has not yet been considered.
Fish habitats are a common indicator of the quality of and richness in aquatic habitats [9,54,55,56,57]. Modeling of physical fish habitats is a suitable tool for assessing the impact (positive or negative) of hydro-morphological changes on physical instream habitats. While impacts of hydro-morphological changes on fish habitats are well described in the literature, little information exists about the response of fish to nonfishing recreational pressure. Some studies showed that anthropogenic noise negatively affects the functions of fish habitats; for example, road traffic (around 85 dB) disturbs fish migration [58], piling sounds (>120 dB) disturb communication [59] and cause total dispersion of fish schools or a drift in their habitat from a depth of 15–20 m [60], and ship noise (around 85 dB) inhibits larval development and increases rates of larval death due to predators [61]. However, we found no study that investigated the impact of recreationists along or in rivers on fish habitats.
Through a novel methodological approach, our study made a first attempt at integrating social aspects (human use of riverbanks) into habitat modeling for a sensitive fish species to detect potential conflicts between physical fish habitats and recreational uses. We investigated, in the case of the common nase (Chondrostoma nasus L.) in the restored section of the Isar River in the center of Munich, (i) whether hydro-morphological urban river restoration succeeded in providing physical habitats for different life-cycle stages of the target species, (ii) how urban recreational pressure is distributed with regard to fish habitats and how it modifies the availability of highly suitable habitats, and (iii) whether urban recreational pressure is likely to explain the absence of C. nasus from the studied restored river section.

2. Study Area

2.1. Study Area

The Isar River drains part of the Karwendel Mountains (Northern Alps), crosses the Munich conurbation (Germany), and joins the Danube River (Figure 1). The pre-alpine river has been used since prehistoric times as a trade route from the Alps, but only using rafts. Major environmental issues began in the 1920s with the construction of 28 hydroelectric power plants. The whole river has been canalized, river water has been diverted several times, and the Sylvenstein Reservoir (1954–1959) has been built in the upstream part of the river to mitigate flood risk.
The discharge of the Isar River in Munich (Figure 2) is minimal during the winter (11–202 m³/s between 1959 and 2012; www.hnd.bayern.de), although brief and slight increases in water quantity may occur, which are mostly due to rain events (annual mean maximum discharge (HQ) in winter = 450 m³/s). In spring, the discharge increases due to snowmelt (>63.8 m³/s), although substantial decreases (to as little as 8.63 m³/s) may happen sporadically due to late freeze and snowfall. During summer, minor flash flood events (mean maximum discharge (HQ) in summer = 395 m³/s) caused by summer storms in the Alps are frequent but they only occasionally reach a very high discharge (650–1050 m³/s). Dry periods may also cause minimal discharges during summer, although regulation by the upstream Sylvenstein Reservoir usually avoids these to ensure water supply for hydroelectric power plants and cooling water for the nuclear power plant. At the gauging site in Munich, NQ locally occurred because of important water diversion to supply hydropower plants (Figure 2).
Since the 1990s, restoration projects have been carried out to improve the ecological status of the river and the esthetics of its riverscape in order to decrease flood risk and to increase recreational potential. For example, the project “New Life for the Isar” (1999–2011) (Figure 3) was carried out by the Bavarian Water Agency in collaboration with the Munich city government to restore 8 km of the Isar River crossing the city of Munich in such a manner that high ecological quality could be expected in the future [62,63]. The project extended from the Großhesseloher Bridge (48°4′29.59′′ N, 11°32′25.83′′ E) to Museum Island (48°7′41.42′′ N, 11°34′46.88′′ E). The restoration focused on the eastern side of the river, while the western side remained unchanged because of topographic limits, namely, a very steep wooded slope ending at a stone wall in the river that separates the river from the housing area. One of the goals of the restoration project was the improvement of the habitats for the endemic fish species, such as the emblematic common nase (C. nasus). The project focused on hydro-morphological improvements such as the removal of the concrete embankment, the creation of seminatural fishways (Figure 4) at the 400 m long Flaucher site (Figure 4), and the construction of near-natural river-bottom ramps (Figure 4). Special care was also taken to reproduce a near-natural waterscape, and one island (Willow Island) (Figure 4) was created to satisfy citizens’ esthetic demands. Long-term monitoring confirmed that the good chemical and biological (macrozoobenthos) conditions required for the re-establishment of C. nasus had been achieved. However, electrofishing showed no recovery of C. nasus despite the potential for rapid recovery of the species [64,65,66].

2.2. Biology of Chondrostoma nasus

Chondrostoma nasus (L.), named the common nase, is a rheophilic migratory cyprinid fish that occurs in the drainage basins of the Black Sea, southern North Sea, and Baltic Sea. It inhabits moderate- to fast-flowing, medium-sized to large rivers with rock or gravel beds and grazes on benthic algae using a characteristic horny layer on the lower lip. Owing to their preference for benthic algae, nase often dwell in shallow, light-flooded habitats, where they can be easily seen. C. nasus is a potamodromous species that needs diverse and very closely connected habitats during its lifecycle. According to literature statements and expert descriptions, the nase population performs different types of movement during the year [64,65,67,68,69,70,71,72,73,74], which are also confirmed for the Isar River [65]. At the end of winter, adult nase often migrate more than 10 km upstream to reach shallow water to feed and recover after the migration and to wait until the environmental conditions are optimal for spawning. When the water temperature reaches 12 °C (between March and May), the adults perform a short migration to nearby well-oxygenated spawning areas in the main channel or tributaries. After spawning, they migrate to summer habitats downstream in the main channel. Before the first freeze-up of winter, the adults move to nearby wintering habitats. Around two weeks after spawning, eggs hatch and larvae drift to shallower habitats near the spawning area. Juveniles (1–3 years old) group in shallow water, e.g., slow-flowing anabranches, but gradually migrate to nearby summer habitats as adults (daily migration to seasonal migration). Accordingly, six habitats (Figure 5 and Table 1) have been identified by local fish biologists and cross-validated against the abovementioned literature [64,65,67,68,69,70,71,72,73,74,75].
C. nasus is a sensitive species that is locally threatened by morphological deterioration, e.g., damming and the destruction of spawning sites [64]. It is protected by the Berne Convention on the Conservation of European Wildlife and Natural Habitats [76]. According to the Red List of the International Union for Conservation of Nature and Natural Resources, C. nasus is classified as a species of “least concern” [75]. Historically, all lifecycle stages were found in the Isar River in Munich, although spawning areas were mostly located in the tributaries [65]. A population that indicates a good ecological status should reach 20 adults of C. nasus per 100 m river section [77]. In the period from 1995 to 2012, the species’ abundance dropped from 40 to fewer than 5 individuals per 100 m in the river sections upstream and downstream from Munich [77], and tributaries of the Danube near Munich (Isar River, Inn River, Vils River, etc.) lost 41% of adult fish of reproductive age (>30 cm long, 4 to around 20 years old) [77]. In 2012, no C. nasus were found in the investigated urban section of the Isar River.
C. nasus are able to recolonize restored river stretches in a very short time span [65]. Studies on the Danube showed that reconnection of habitats using a nature-oriented scheme was successful, with 46% of the source species pool present in the study area after only two months [66]. Reconnection between the main river channel and spawning areas also enabled high recruitment of juveniles only two years after restoration [78].

3. Materials and Methods

3.3. Physical Characteristics of the River

3.3.1. The Substrate

The substrate properties were determined by field measurements in 2013 and were assumed to be constant over time. Because the water at mean low discharge (MNQ) was shallow and clear, we used a classic survey procedure by boat based on a 5-meter grid (Figure 6) to characterize the substrate (N = 1628). Nine substrate types were visually distinguished on the basis of the grain size of the dominant component:
  • Organic matter or detritus
  • Silt, clay, or loam
  • Sand (<2 mm)
  • Fine gravel (2–6 mm)
  • Medium gravel (6–20 mm)
  • Large gravel (2–6 cm)
  • Large stones (6–12 cm)
  • Boulders (>20 cm)
  • Rock or concrete.

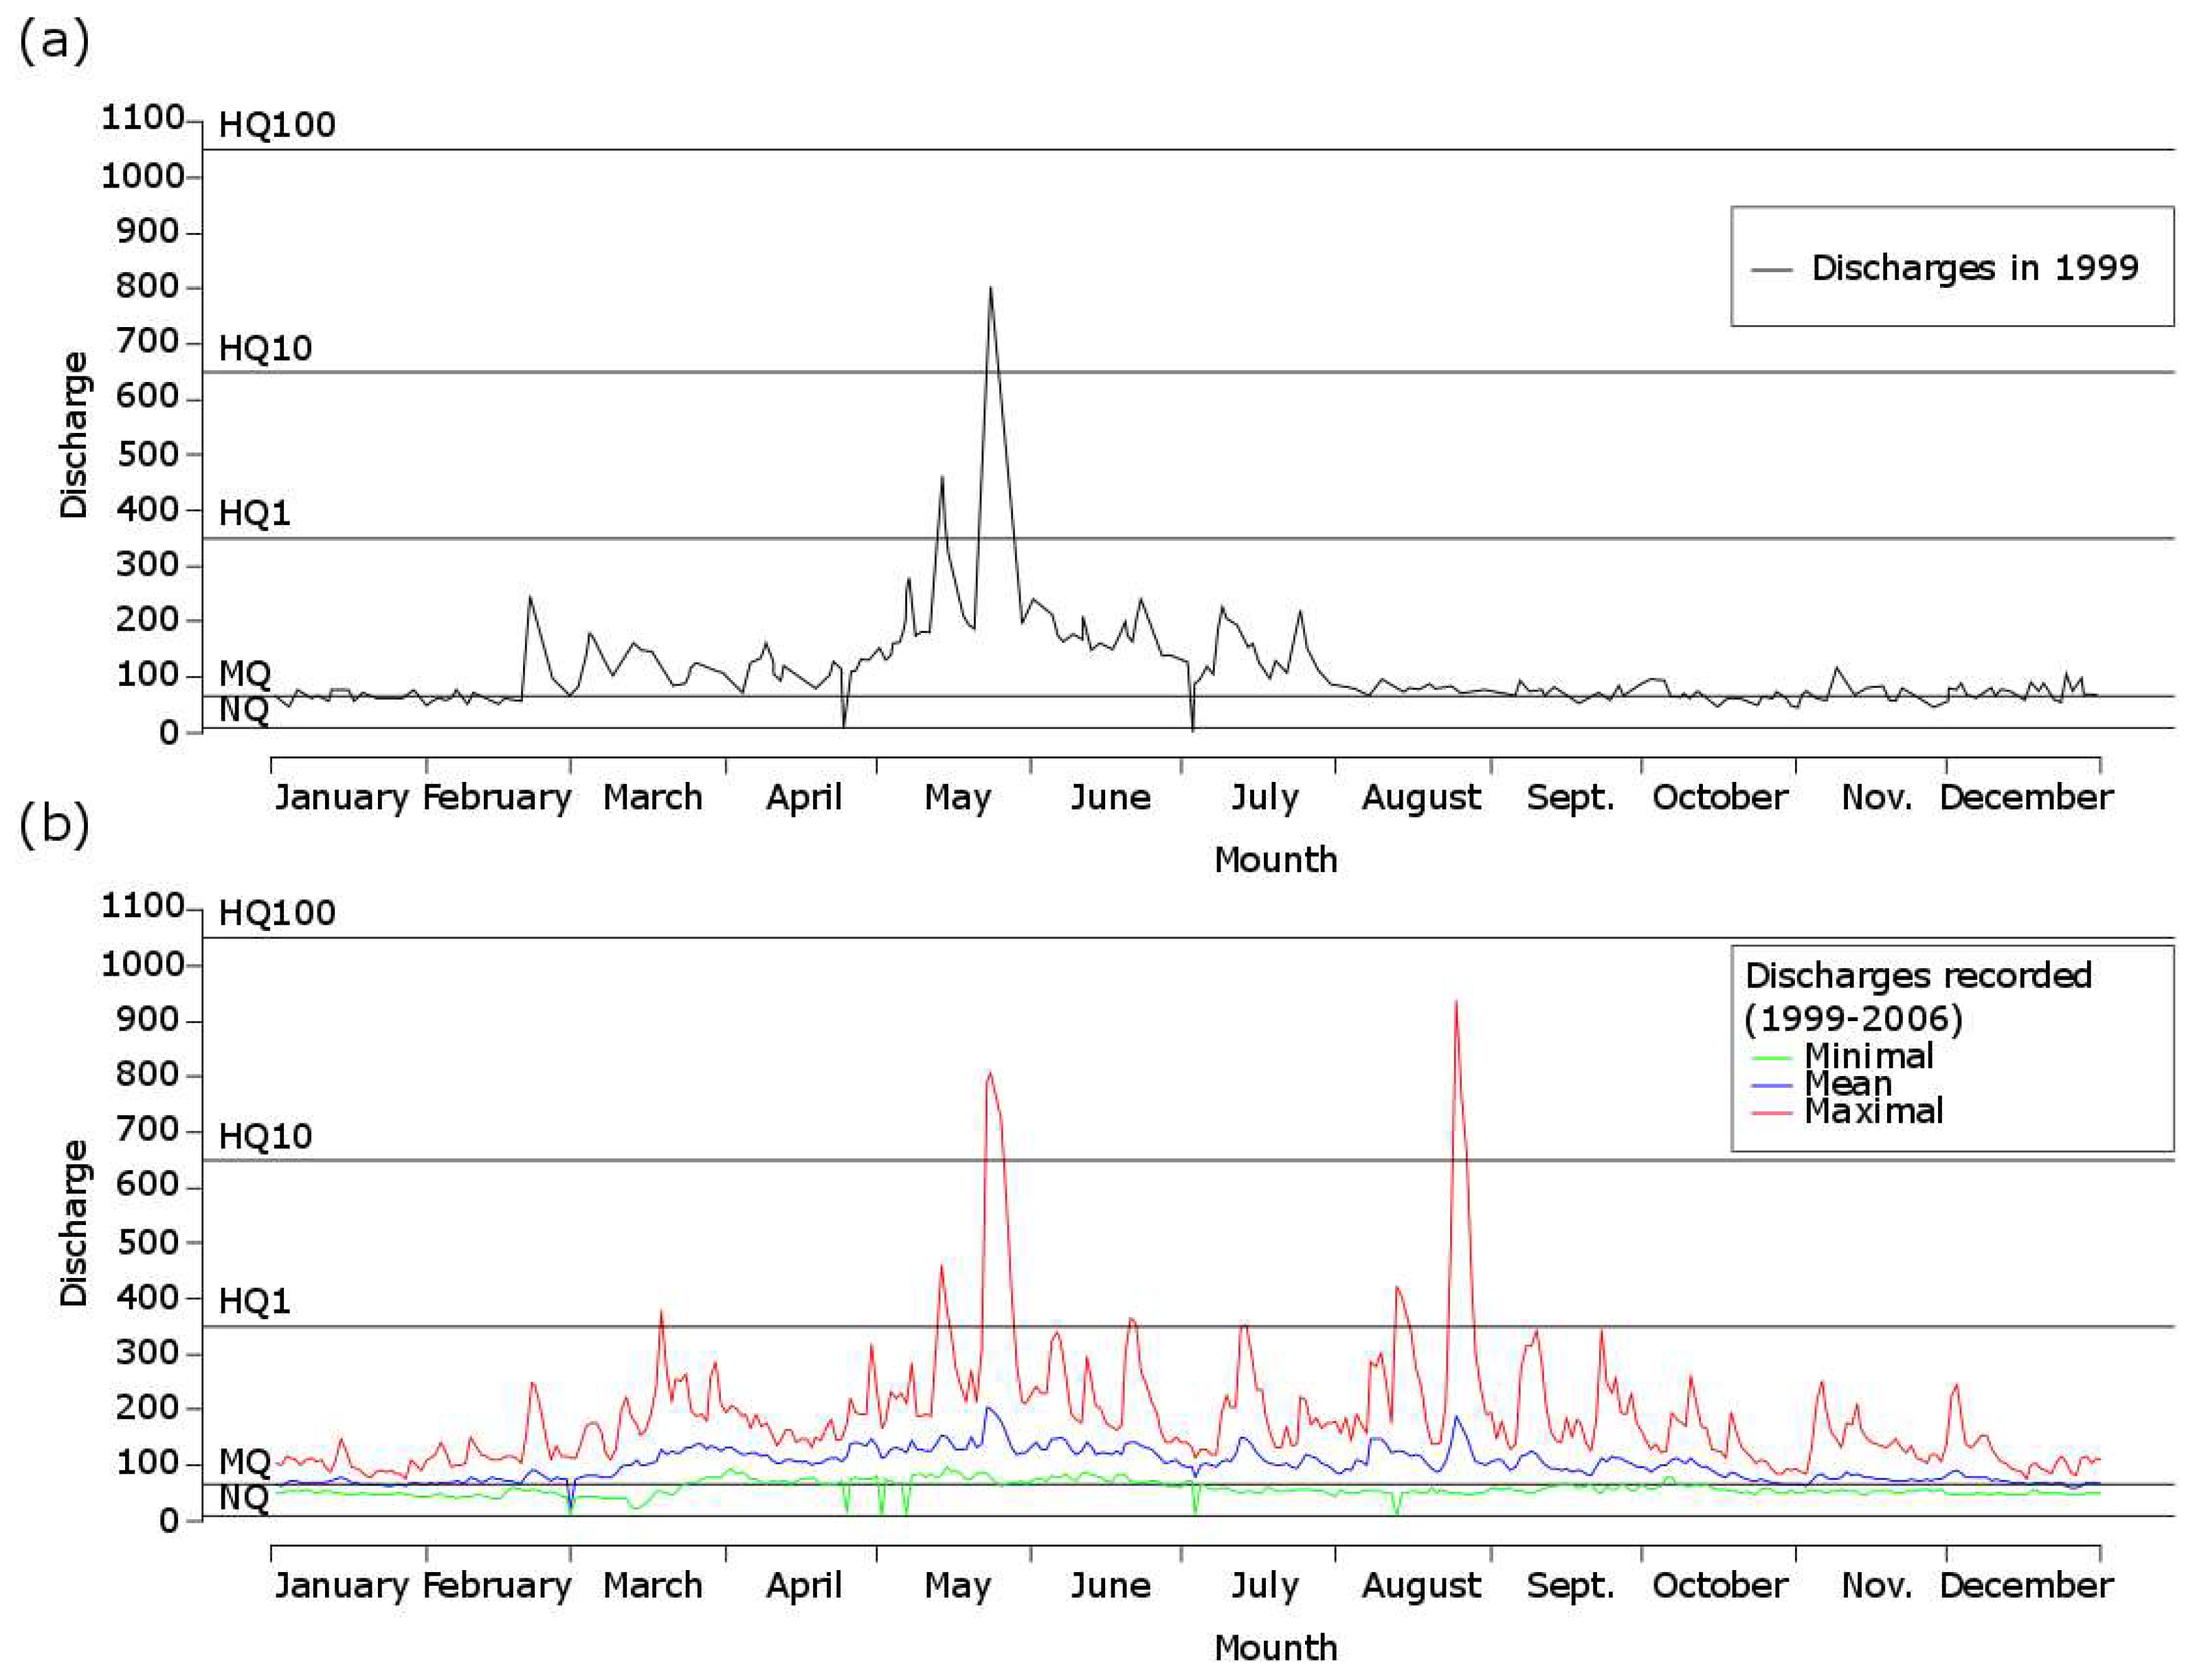
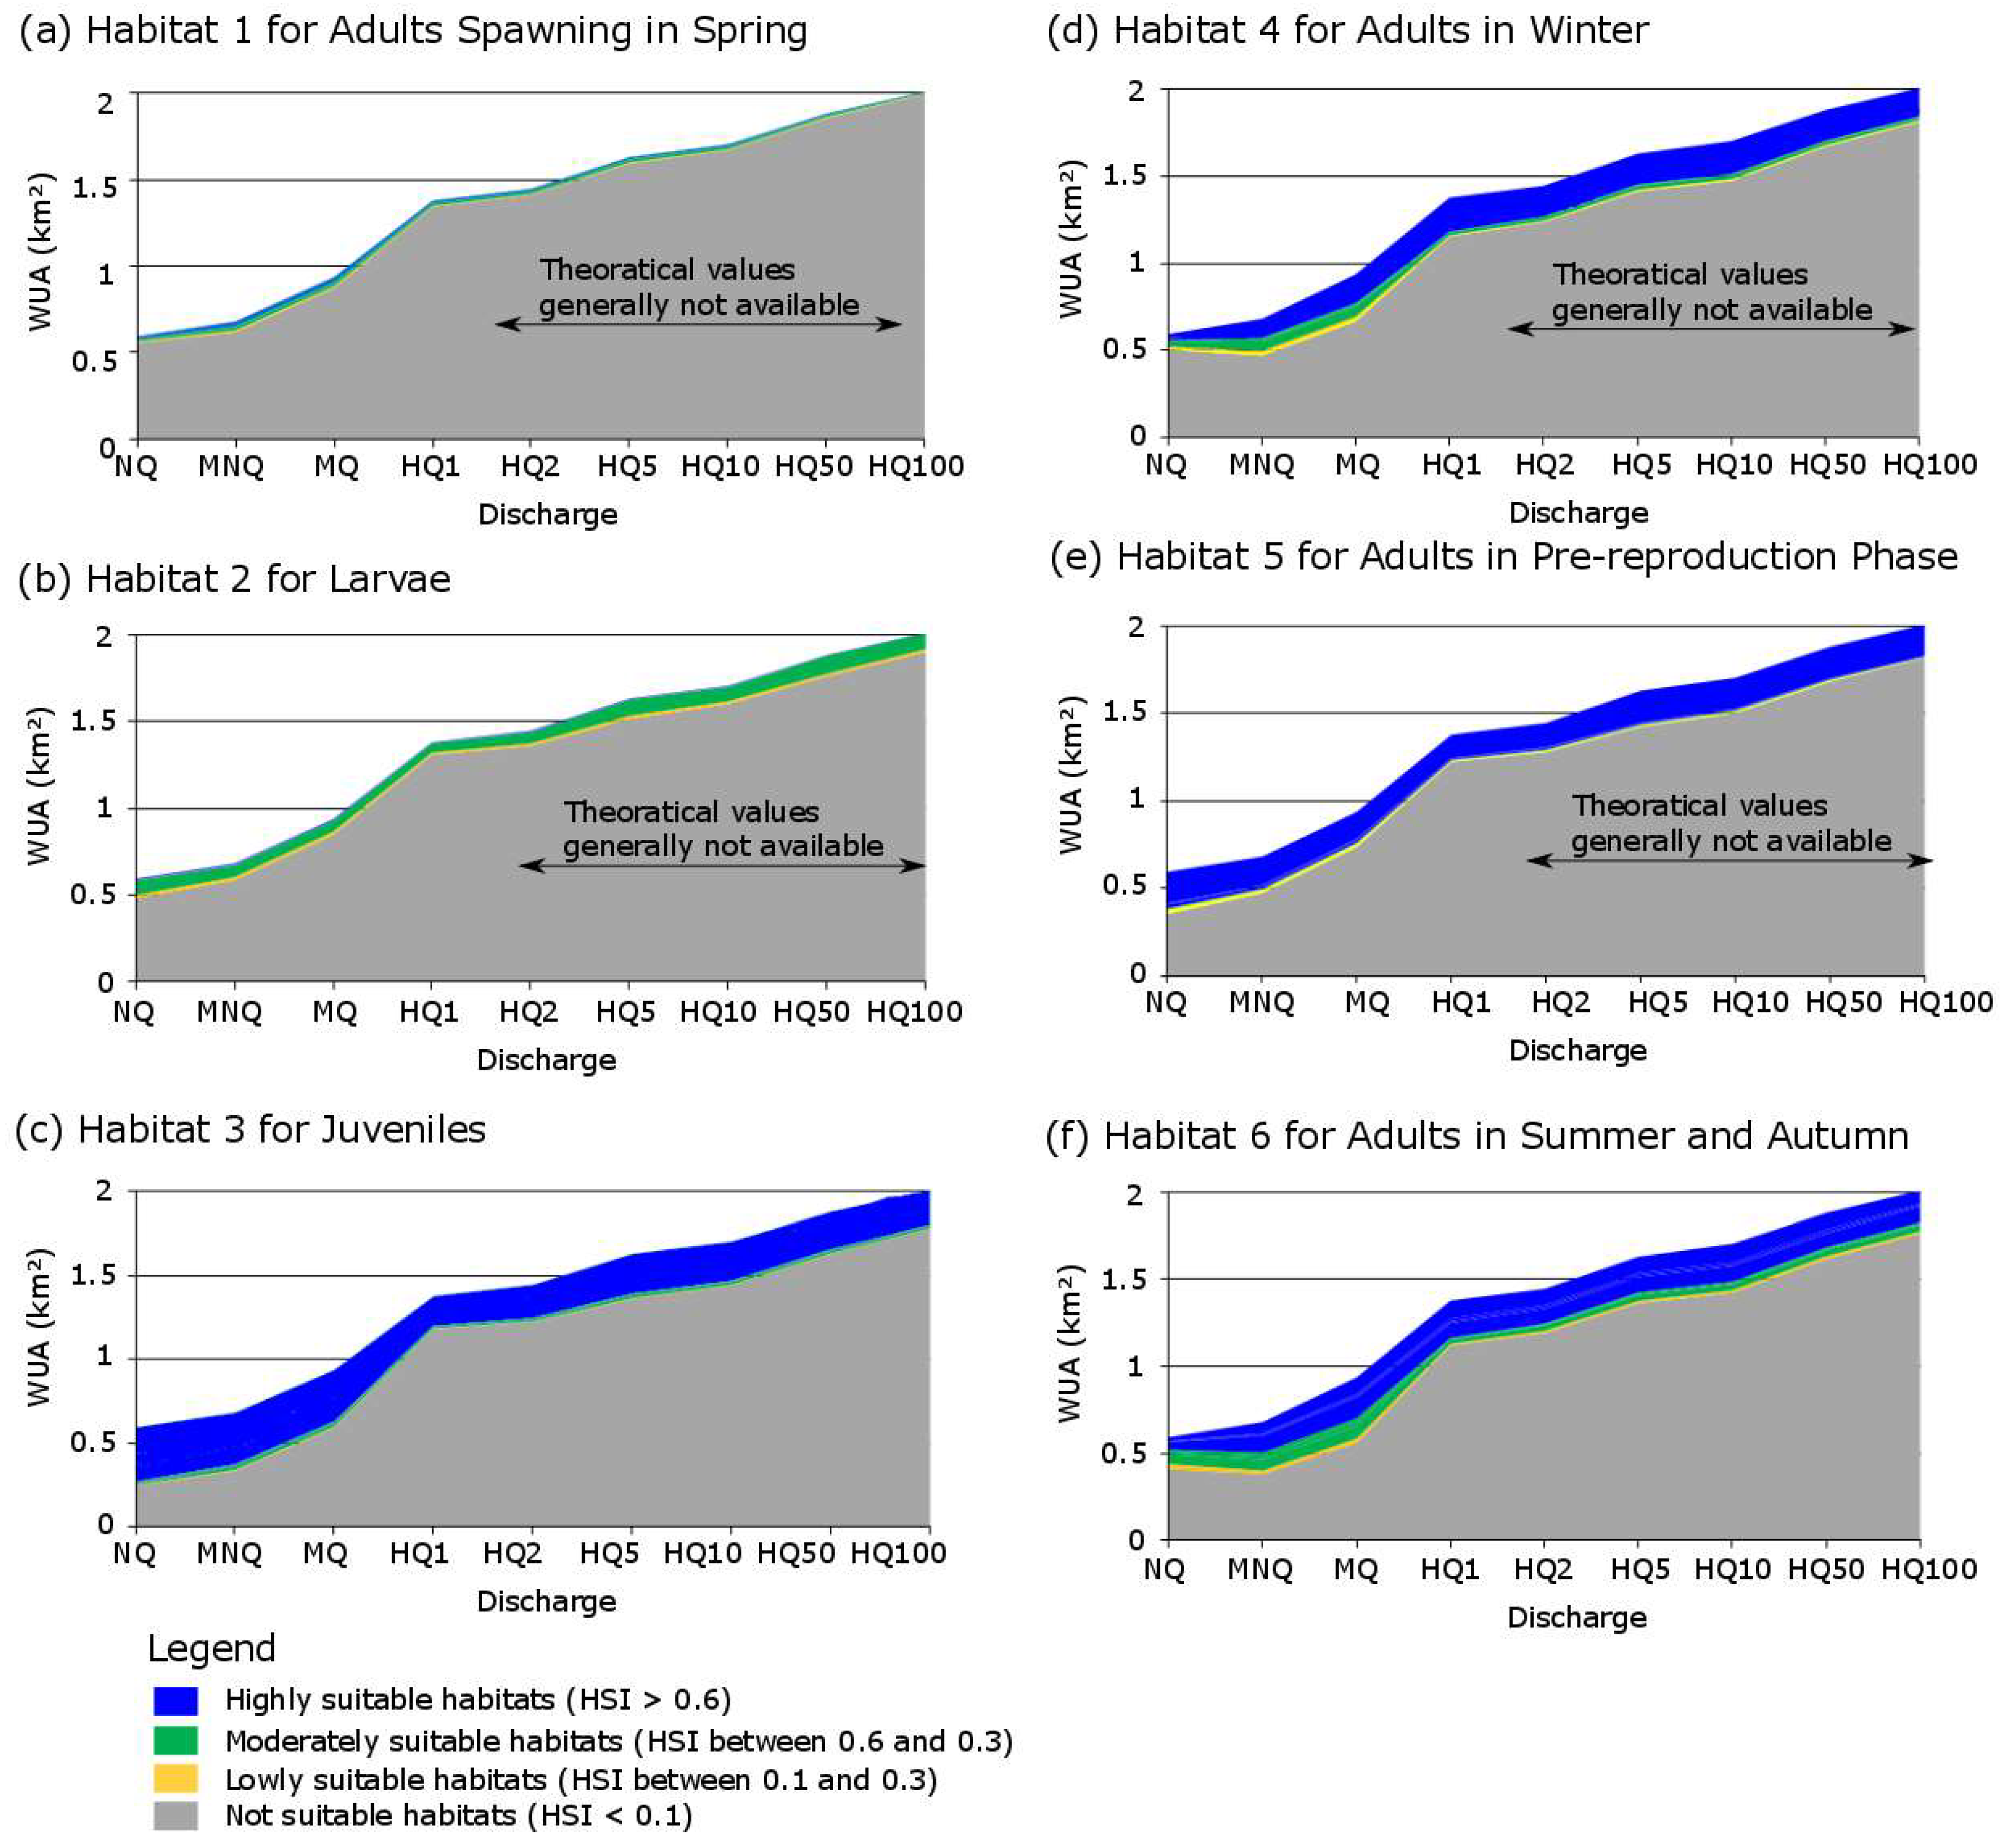
3.3.2. The 2D Hydro-Morphological Model

To investigate the conflict between a suitable habitat for fish and intensive recreational uses, we established a 2D hydro-morphological model for 8 kilometers of the restored stretch of the Isar River, namely, from the Großhesseloher Bridge (48°4′29.59″ N, 11°32′25.83″ E) to Museum Island (48°7′41.42″ N, 11°34′46.88″ E). For generation of the grid and pre- and postprocessing of the simulated data, SMS software (Surface Modeling System, Aquaveo, Provo, Utah, USA) was employed, while for the hydraulic simulations the software Hydro_AS-2D version 3, was used, which solved the shallow-water equation using a finite-volume discretization. The digital elevation model of this area was based on cross-sectional data provided by the local water authority (Wasserwirtschaftsamt München, http://www.wwa-m.bayern.de/). In addition, local topographical measurements were conducted to consider topographical details. The topographical data were interpolated to an unstructured grid of 142,000 elements for the study region (Figure 7) and 6000 elements for the reference site. The average spatial resolution was in both reaches 8.0 m in flow direction and 3.0 m in lateral direction, which represented a recommended ratio between length and width of elements. The model was extensively calibrated and validated by comparing measured water levels (provided by the local water authority, Wasserwirtschaftsamt München, http://www.wwa-m.bayern.de/) and simulated water levels [79] for four discharges ranging from 65 m³/s to 782 m³/s by adapting the roughness values to verify adequate model performance. The roughness values were adapted towards best model performance for two discharges (calibration) and verified for the other two discharges (validation). The deviations between measured and simulated water levels ranged from +8.15 cm to −0.21 cm with a mean deviation of 1.68 cm, which proved to be an adequate model performance (R² = 0.98) for both low- and high-flow conditions. The simulated scenarios were:
  • Minimum discharge (NQ = 12 m³/s)
  • Mean low discharge (MNQ = 16.5 m³/s)
  • Annual mean discharge (MQ = 63.8 m³/s)
  • Annual mean maximum discharge (HQ1 = 350 m³/s)
  • Biennial mean maximum discharge (HQ2 = 405 m³/s)
  • 5-year maximum discharge (HQ5 = 550 m³/s)
  • 10-year maximum discharge (HQ10 = 650 m³/s)
  • 50-year maximum discharge (HQ50 = 880 m³/s)
  • 100-year maximum discharge (HQ100 = 1050 m³/s).
While scenarios 2–5 were the most representative of the common situation, the other scenarios may inform about stressful situations. Scenario 1 simulated major dryness and enabled the estimation of dewatering risk as fish stranding. Scenarios 4–9 informed about the existence of refuge for the fishes during flood events, which depend of the diversity of the floodplain form. This also informed about the recreational potential of the area. Since the frequency of perturbations are important for resilience capacity of the species, we investigated different flood events from HQ1 to HQ100.

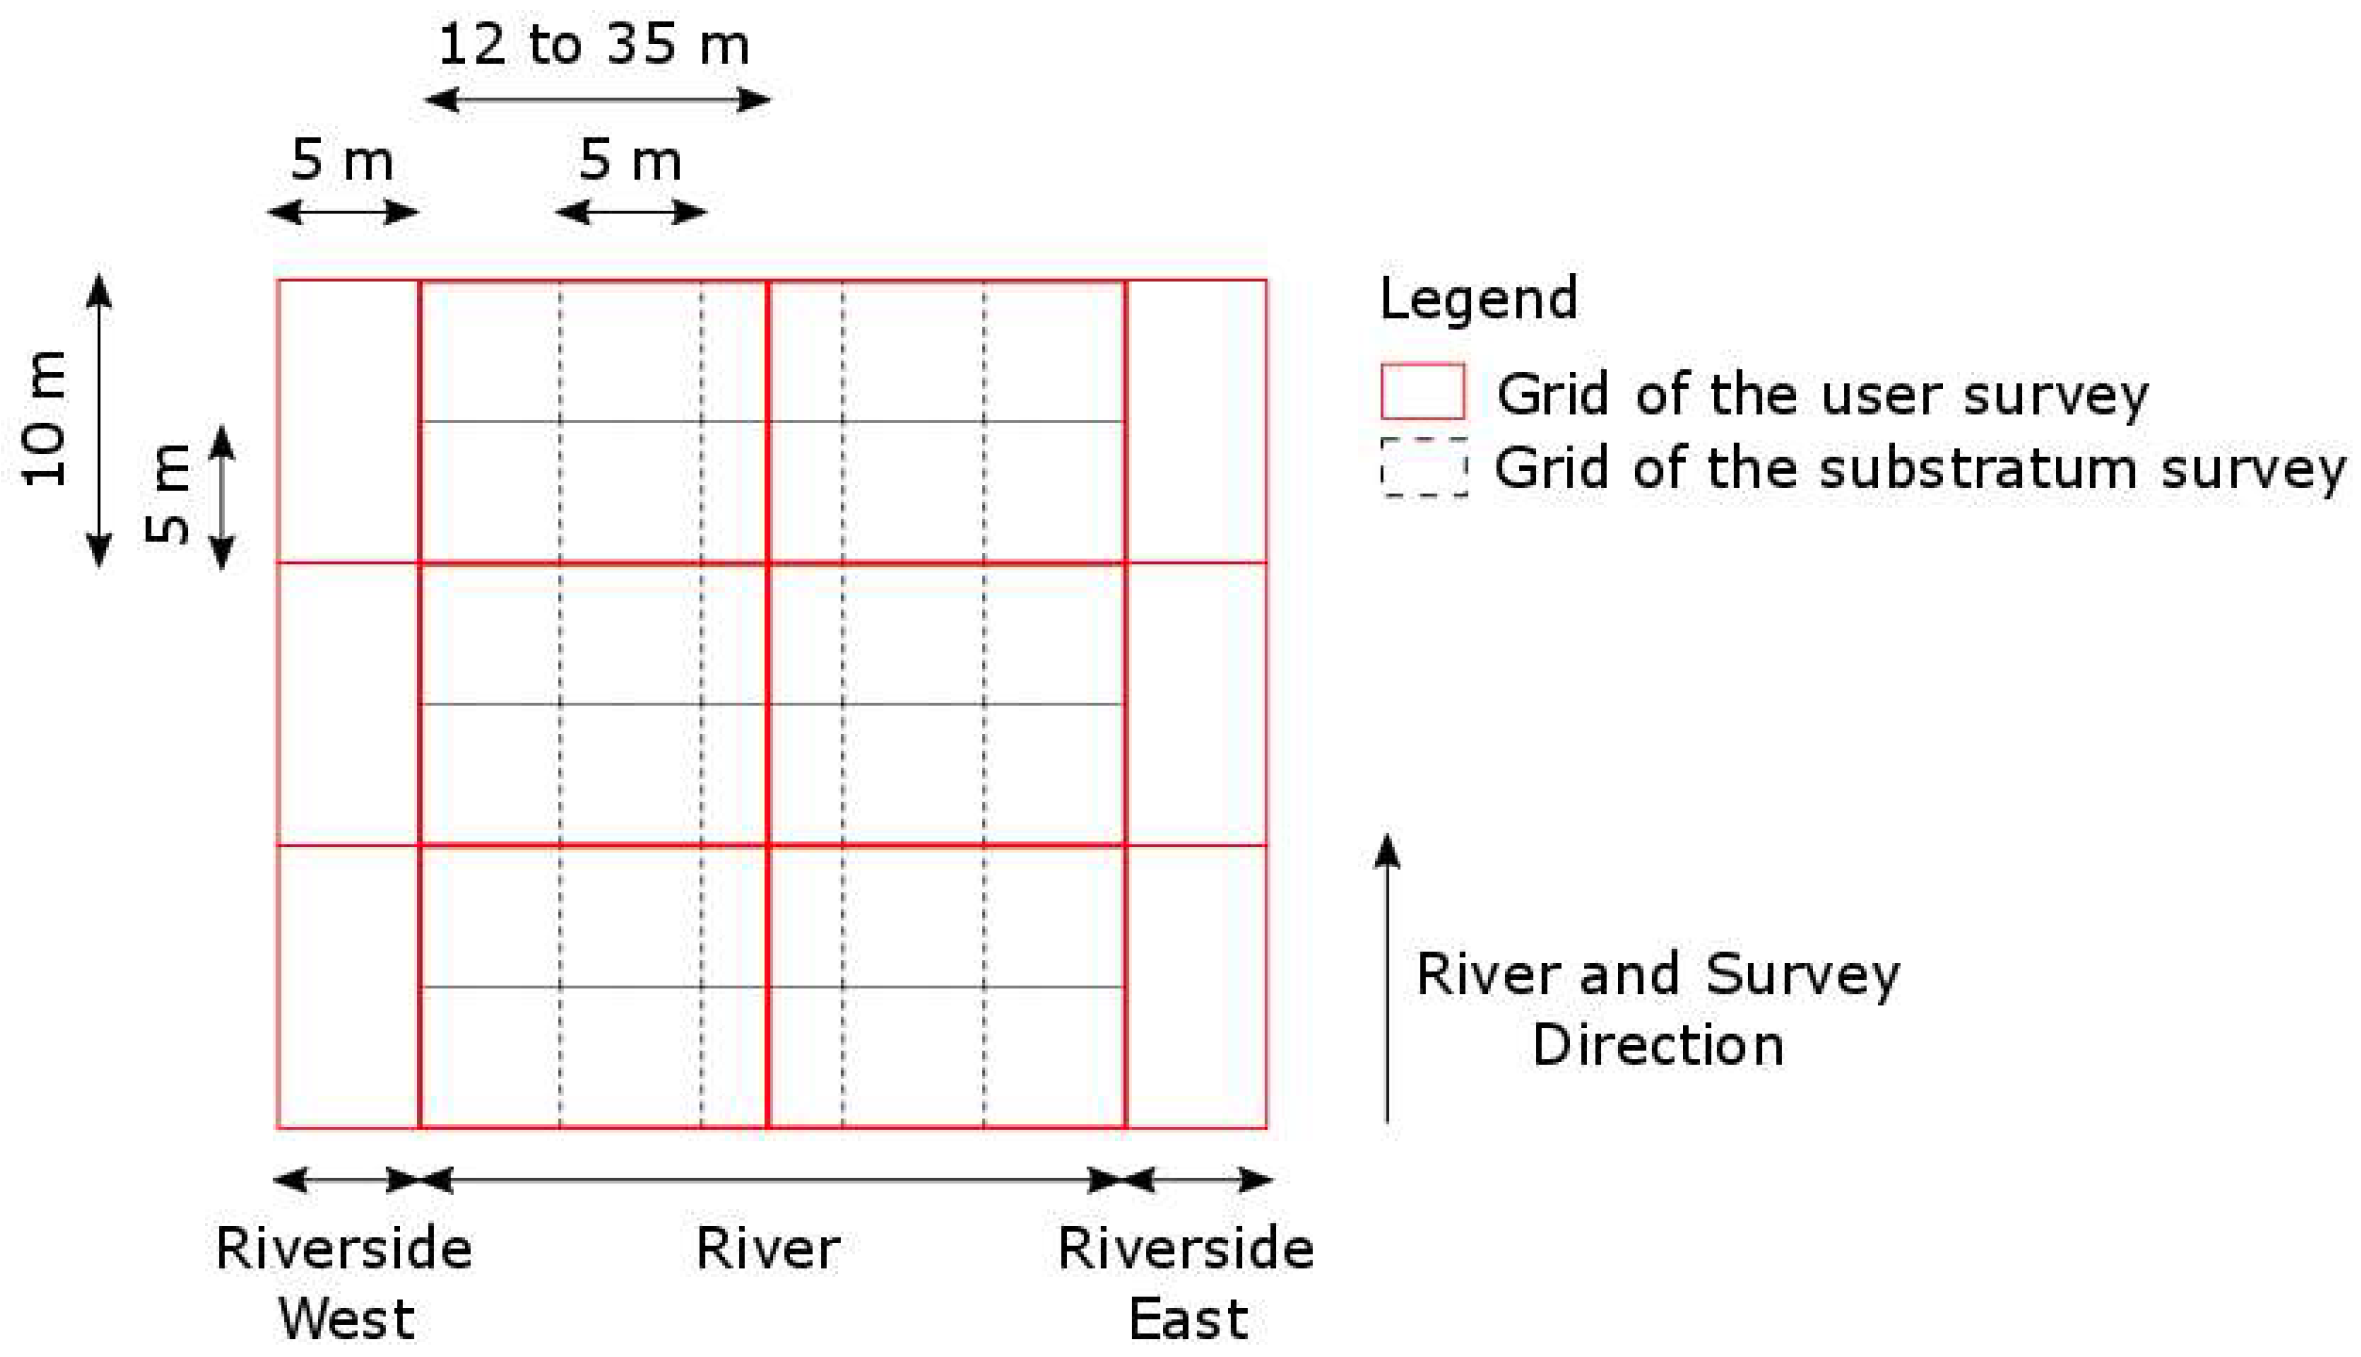
3.4. Recreational Pressure

Only expert knowledge can provide information on the response of species to recreational pressure [80]. This is commonly acquired by on-site data collection, such as user counting and surveys of user distribution [81,82,83]. Riverine recreational activities on the Isar River are water-based from May to October, e.g., boating and swimming, and land-based throughout the year, e.g., lying in the sun, walking, and cycling [84]. In accordance with common practice in studies of recreational intensity [34,36,81,82,83,85], user pressure was evaluated by counting users on a limited number of sampling days. A preliminary user survey during a sunny nonworking day in June at two sites inside the study river section showed that maximum user numbers may be found between noon and 2 p.m. in the south of the study area and between noon and 4 p.m. in the north of the study area (Figure 8). Therefore, users were counted along 8 kilometers of restored river stretch during 10 sunny days (3 during spring, 3 during summer, 3 during autumn, and 1 during winter) between noon and 3 p.m., beginning in the south of the study area. We counted all the recreational users we encountered while walking along the river. This was carried out by using a counter and by differentiating land-based and water-based activities in 10-m intervals (Figure 6), which were delimited using 10-m ropes on both sides of the river, either on the embankment (5-m broad sections) or in the water (between the embankment and the middle of the aquatic area, i.e., 12–35 m broad sections). In the water, users roamed through sections with lengths of 50–100 m by swimming and wading. User densities were classified into five ranks of recreational user density (Table 2; for the ranking procedure, see Section 3.5). User intensity maps were digitized using SMS 10 and acted as an additional parameter for the modeling procedure when testing the impact of users on the availability of fish habitats (see objectives (ii) and (iii) in Section 1).

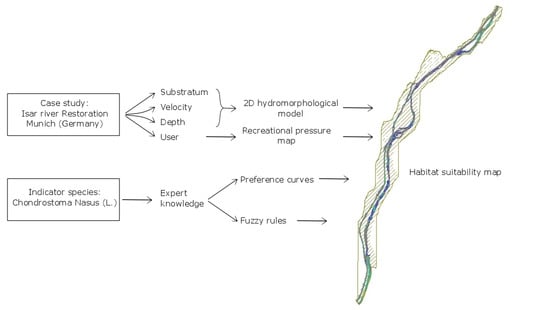
3.5. Habitat Suitability Model

The suitability of habitats for C. nasus was modeled using CASiMiR. This software was designed to determine the suitability of habitats for target species using hydraulic and morphological characteristics. The CASiMiR procedure uses the three main parameters that determine fish habitat preferences [48,86]: water depth, flow velocity, and bed substrate type. Using them, CASiMiR calculates the habitat suitability using three indicators: weighted usable area (WUA), hydraulic habitat suitability index (HHS), and the Habitat Suitability Index (HSI). Both the WUA and the HHS represent functions that relate the habitat suitability to the flow regime. The HHS is obtained by dividing the WUA by the total wetted area, which leads to an index ranging from 0 to 1. The HHS thus eliminates the influence of the size of the wetted area and enables a direct comparison between scenarios [87]; for example, between scenarios for a single study area with different discharge levels. Highly suitable habitats were defined as those with an HSI >0.6. CASiMiR uses a multivariate fuzzy logic approach to link these abiotic attributes with the habitat requirements of fish. Therefore, the overlapping fuzzy magnitudes of the descriptive physical properties are formulated in terms of linguistic categories, i.e., “very high”, “high”, “medium”, “low”, and “very low” (Table 2). This approach has proven to be an excellent modeling technique for ecological purposes because the overlapping fuzzy sets allow researchers to deal with uncertain and imprecise information, which commonly occurs in ecological investigations [88]. Because little published information on quantified habitat preferences of C. nasus on the Isar River near Munich is available, the physical limits of the categories were partly based on expert knowledge. This concerned, in particular, the behavior of C. nasus when facing manmade stressors such as walkers, swimmers, and large groups of humans on the embankment. Therefore, individual interviews were conducted with seven experts, i.e., fish biologists belonging to the Chair of Aquatic Systems Biology of the Technical University of Munich (N = 2), the Bavarian Water Agency (N = 1), and the Bavarian State Research Center for Agriculture (N = 2), as well as with two fishermen from the NGO Isarfischer. They were asked to describe the C. nasus habitats on the Isar River near Munich considering all the possible combinations of the variables (Table 2) to establish fuzzy habitat suitability sets (Table 3 and Table S1), and to define the response of the species to recreational uses. Despite the fact that we interviewed the biologists in a nondirective manner, namely without list of possible answers, no major deviations between the interviewees were observed. The greatest difference between the interviewees regarded the limits of “low” velocity, namely, 0.5–0.7 or 0.4–0.6 m/s. We considered the deviating entries as the tolerance limits of the values. To validate the resulting habitat quality rules, a reference site with an established population of C. nasus was used. The reference site was located 5 kilometers downstream of the restored reach (Figure 1). According to the last survey performed by the Bavarian fish monitoring authorities, a robust population of C. nasus remains at this site [65,77]. The reference site was close to the restored section; it did not support recreational uses, and it has a high value for spawning activities. A 2D hydro-morphological model of a 2500-m long reference site, namely a 60,000 elements mesh, was created using the same procedure as for the 2D hydro-morphological model of the restored area (presented in Section 3.3.2). We performed the expert-based habitat modeling procedure on the reference site with the existing C. nasus population. The model outcomes showed suitable physical habitats for C. nasus (Figure 9). This result validated the habitat quality fuzzy rules and set of the model. The proportion of suitable wetted area supporting each habitat slightly varies between the reference and the restored sites. This variation can be explained by the length difference between the sites.
The particular aims of this study were to integrate the survey of recreational pressure as supplementary input data into the CASiMiR interface and to integrate the influence of recreational users on habitat suitability into the fuzzy sets and rules. Our interviews with fish biologists revealed the following: (a) C. nasus is for most of the year a very shy species that is easily scared by walkers at the riverside. Even moderate recreational pressure, namely, two or more users within the area nearest to the wetted area (10-m long river section and 5-m cross section), has a negative impact on the riverside habitat used by C. nasus (juveniles and adults during the summer); (b) C. nasus is rapidly scared away by fishermen walking in the river, and even single swimmers and inflatable boats have a high impact on habitat preference; (c) Remote users (far from the wetted area) have either no or a very low, indirect impact on C. nasus; (d) If well-suited habitats are no longer usable owing to disturbances, C. nasus may, within a narrow range of tolerance, use deeper habitats with higher flow velocities; however, this behavior may cause physiological stress; (e) The species is fearless during the annual reproduction migration and the pre-reproduction period.

3.6. Model Analysis

The model was run in two different ways: (a) exclusively using the tool for modeling physical habitat suitability applied to the 8 kilometers of studied river stretch (response to objective (i) in Section 1) and (b) adding “recreational pressure” as an additional component to identify potential conflicts between recreational uses and ecological quality (response to objectives (ii) and (iii) in Section 1).
We modeled the habitats in 108 scenarios, which comprised combinations of six habitat types (type 1 for Adults spawning, type 2 for Larvae, type 3 for Juveniles, type 4 for Adults in winter, type 5 for Adults in pre-reproduction phase, and type 6 for Adults in summer and autumn), nine discharge levels (NQ, MNQ, MQ, HQ1, HQ2, HQ5, HQ10, HQ50, and HQ100), and two modalities (with and without user pressure). The outputs of the model for each of the 108 scenarios were threefold: (a) Habitat suitability maps, which were composed of the hydro-morphological grid, in which each 5-m element had a calculated habitat suitability index (HSI). The HSI is the most common index for describing biological responses to abiotic attributes and represents the suitability of a habitat for a target species and life stage. The HSI has scalar values between 0 and 1, where 1 at a given grid element represents the most suitable habitat and 0 represents the most unsuitable habitat. (b) A table listing the surface of the wetted area for each HSI value. (c) A table listing the weighted usable area (WUA) and hydraulic habitat suitability index (HHS) for each scenario.
First, to estimate the physical habitat suitability post-restoration for each of the six habitat types and for each discharge level, we first performed descriptive analyses of the WUA and HHS values. Second, to define potential conflict areas, the geographical distribution of suitable physical habitats and discharge level was indicated on physical habitat suitability maps, and the spatial distribution of users was described. Finally, to investigate the influence of recreational pressure on physical habitat suitability, we performed Mann–Whitney–Wilcoxon and Ansari–Bradley tests to compare the medians and variances of the HSI at 200 randomly chosen elements of the grid for the 108 scenarios. Analyses were performed on all scenarios. However, some Figures and Tables presented only the results at mean annual discharge. This choice had been made to increase the readability. Considering Figure 2, mean annual discharge was considered as the common situation. Results for the other scenarios are available in the supplementary material.

4. Results

4.1. Physical Habitat Suitability

Physical habitat modeling results in terms of WUA in function of discharge (Figure 10 and Table 4) showed that highly suitable habitats (HIS > 0.6) exist for adults during the winter, summer, and pre-reproduction periods and for juveniles. Few areas with suitable habitat quality for larvae and spawning adults occurred at the restored Isar River stretch (Table 4). The areas with suitable habitats were located at the site Flaucher and at near-natural river bottom ramps with honeycomb-shaped structures. On the scale of the whole modeled river section, the HHS varied between 0.01 and 0.55, according to all investigated lifecycle stages and discharge levels (Table 5). The highest rates were found at mean low discharge and mean discharge for juveniles (HHS = 0.4 and 0.3), pre-reproduction adults (HHS = 0.3 and 0.2), and adults during summer (HHS = 0.2 and 0.2). The highest HHS was reached for juveniles and pre-reproduction adults at minimum discharge—55% and 35%, respectively, of the wetted area was highly suitable. Suitable physical habitats for pre-reproduction adults and for juveniles largely decreased with an increase in discharge. Suitable habitats for larval development and spawning activities were rare at any discharge level (<10% of the wetted area).

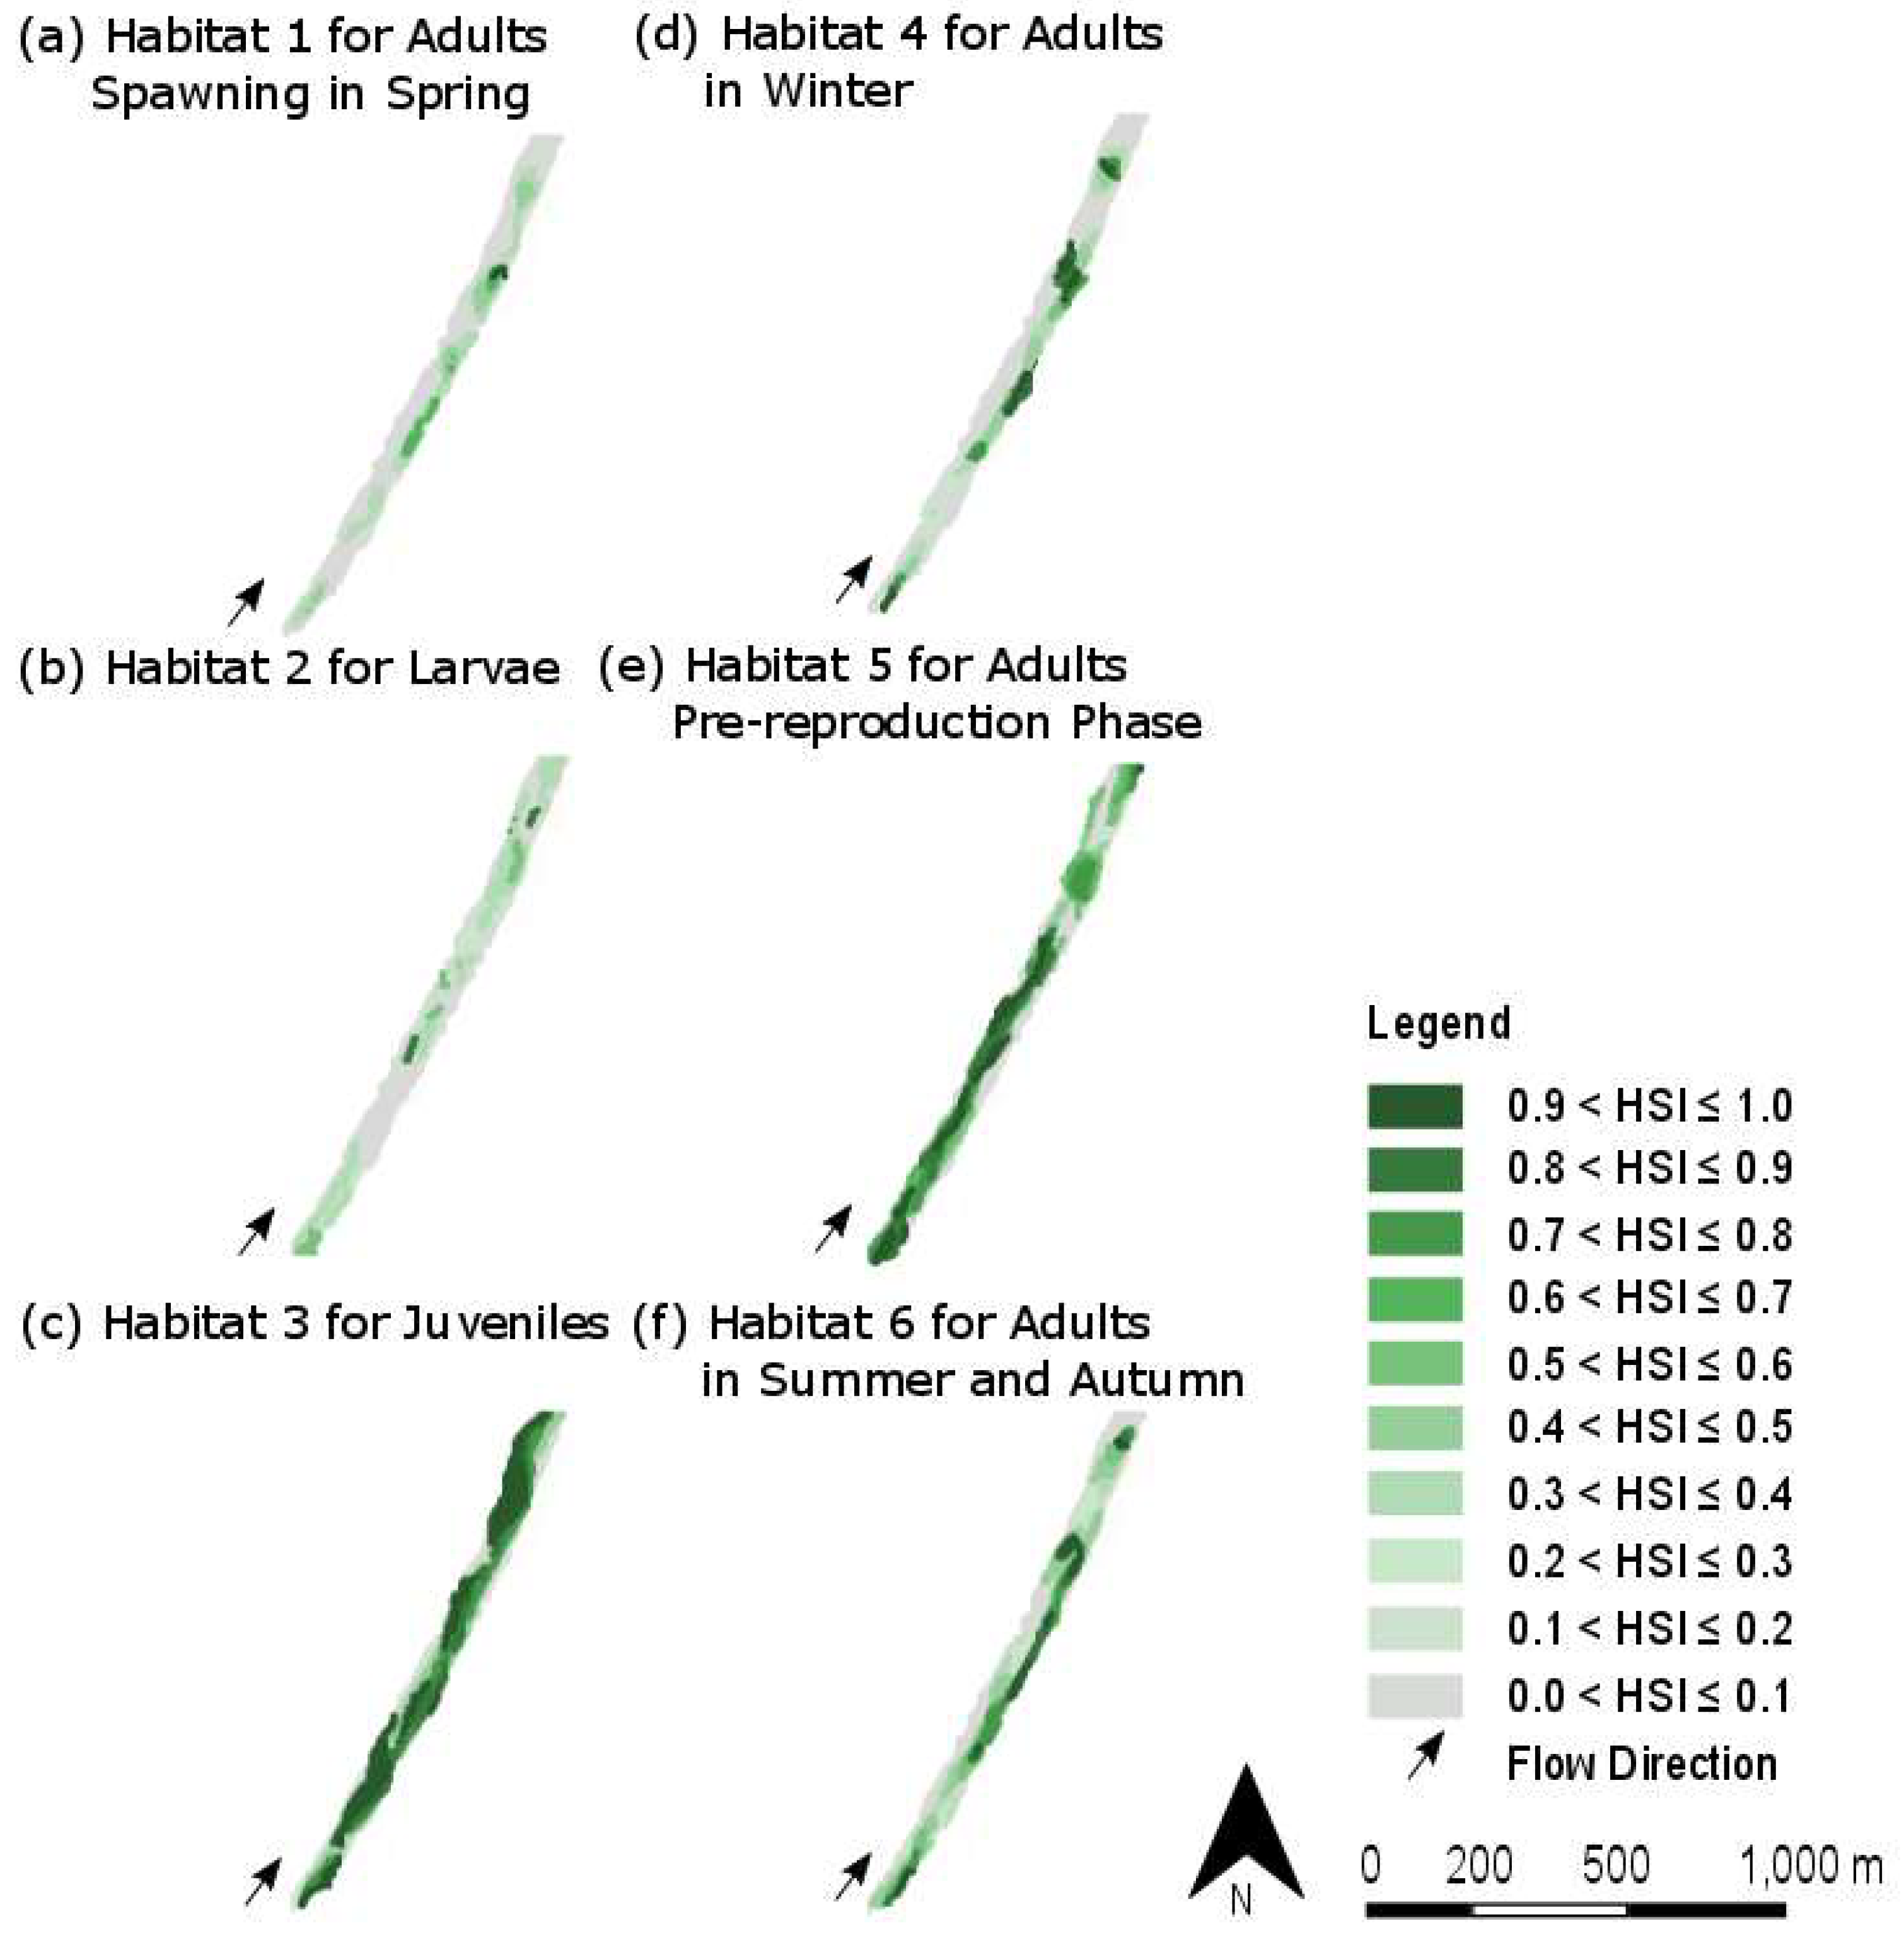
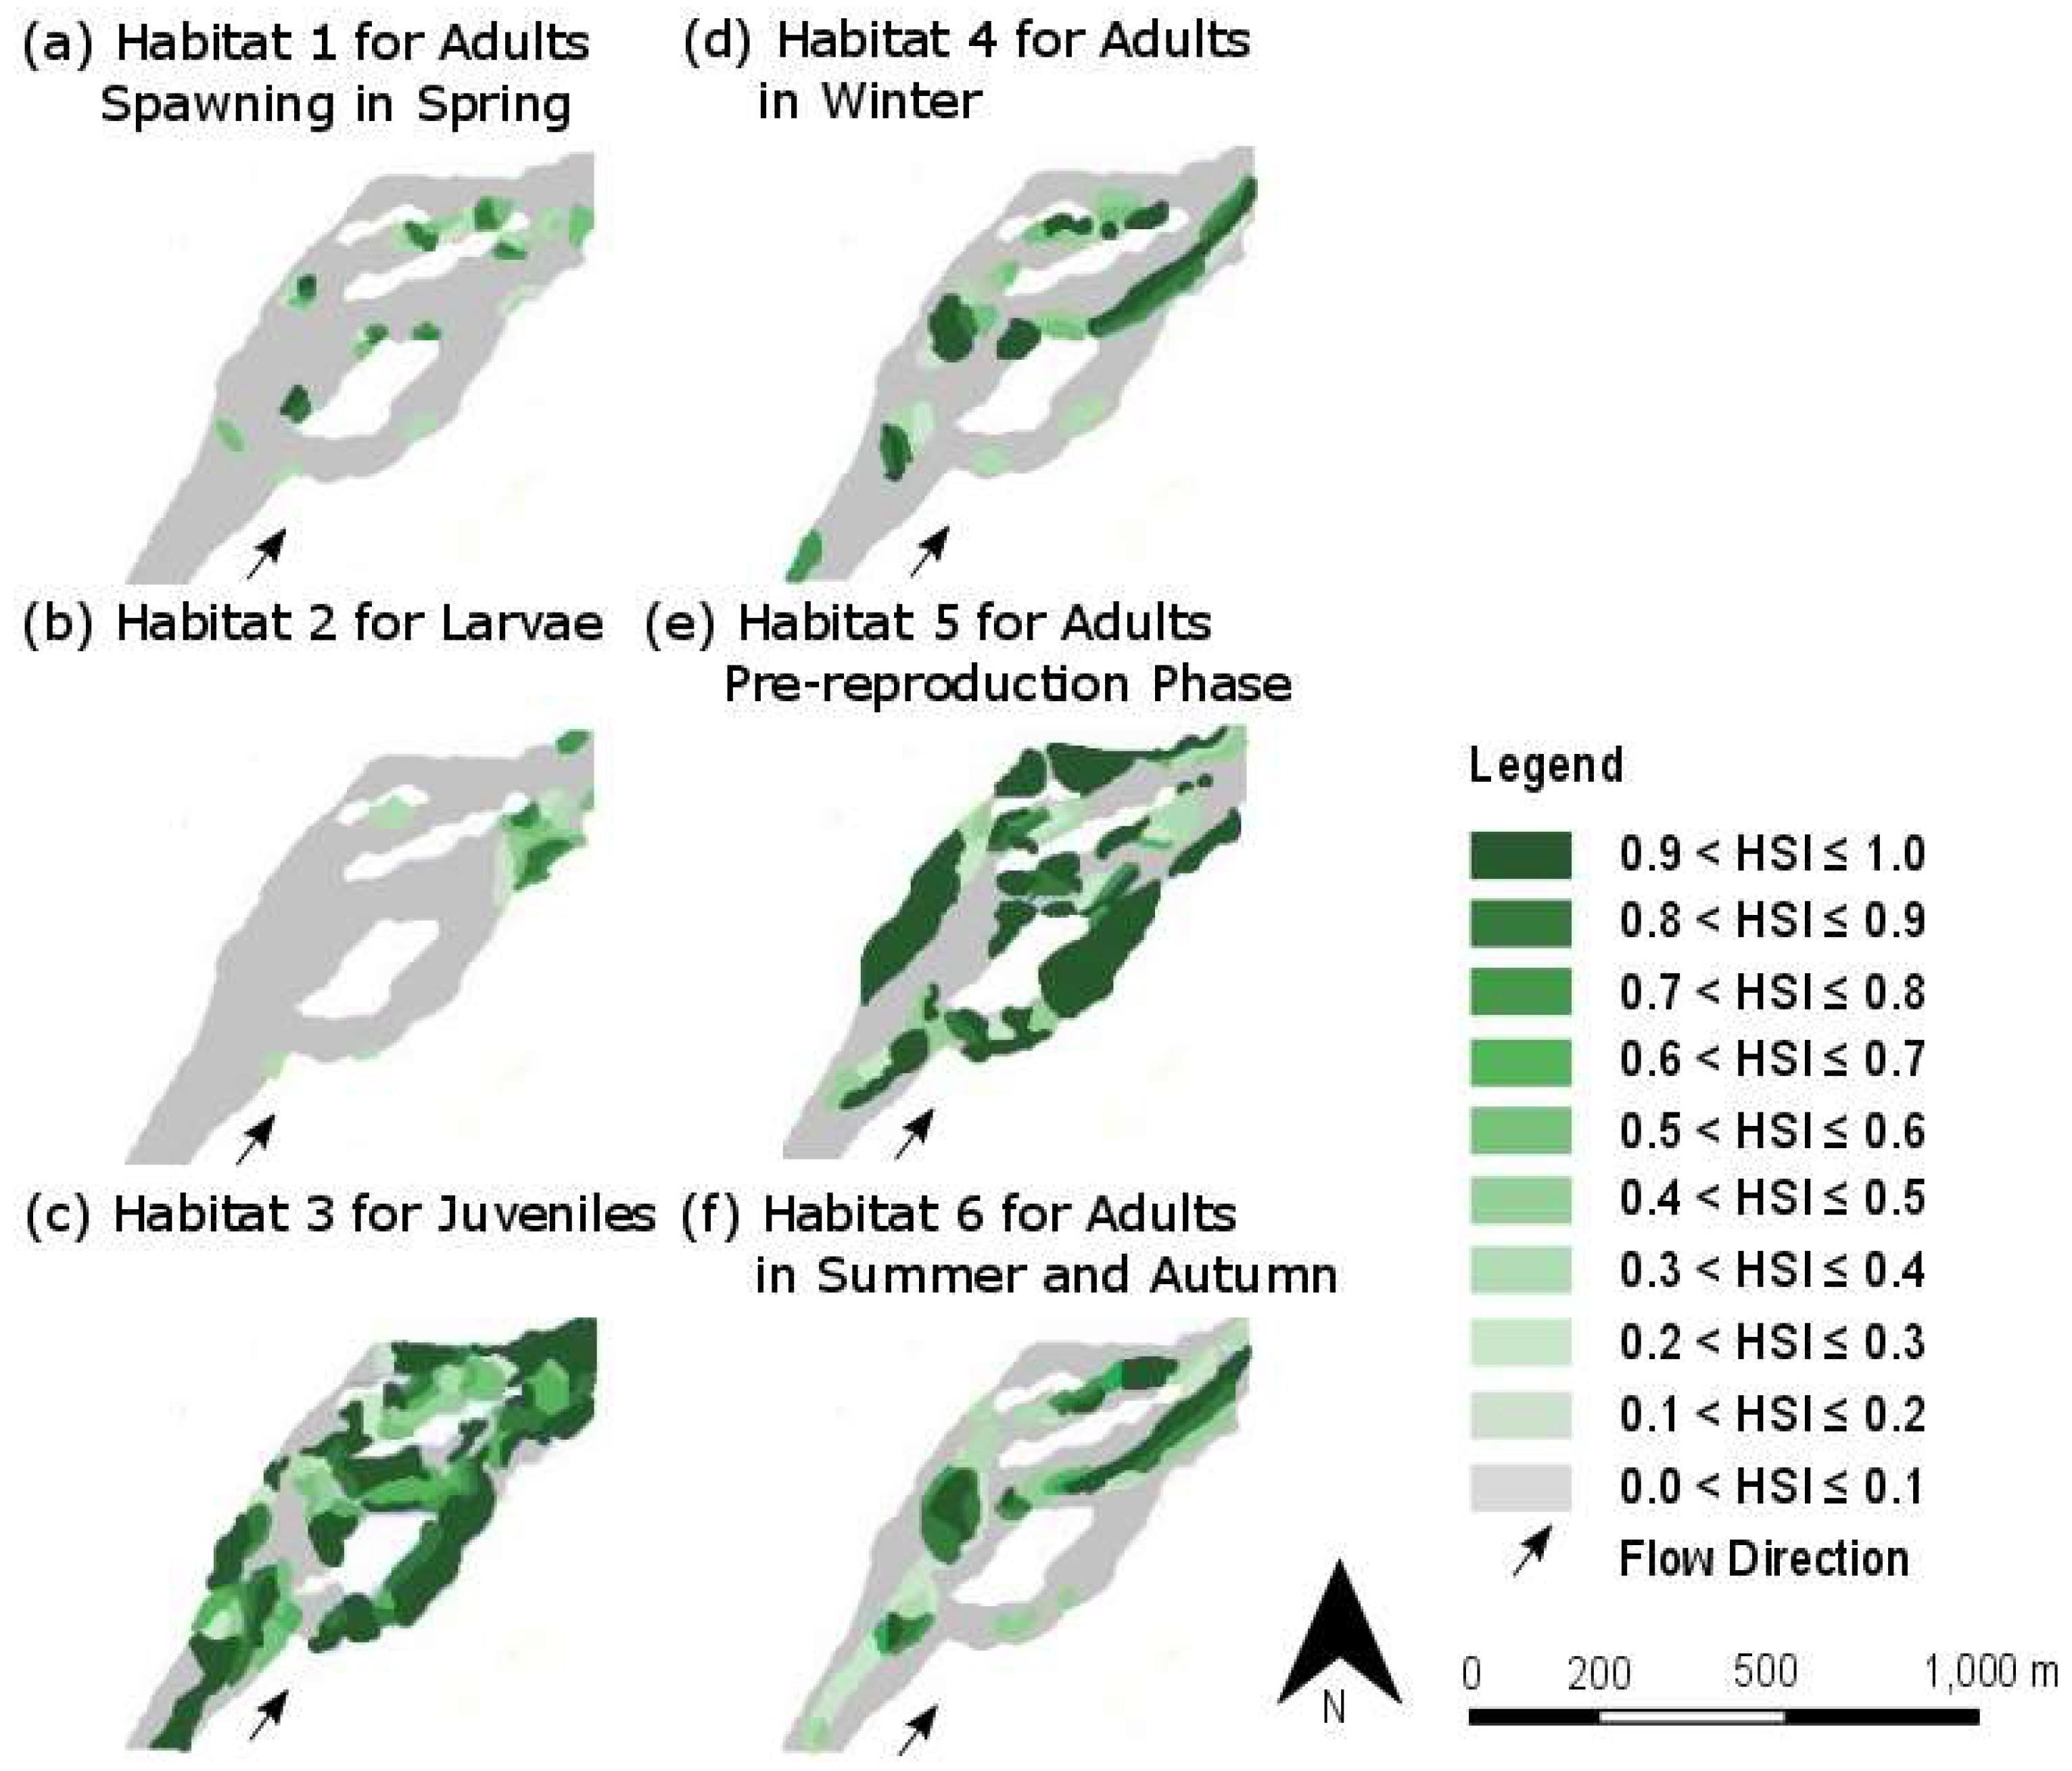
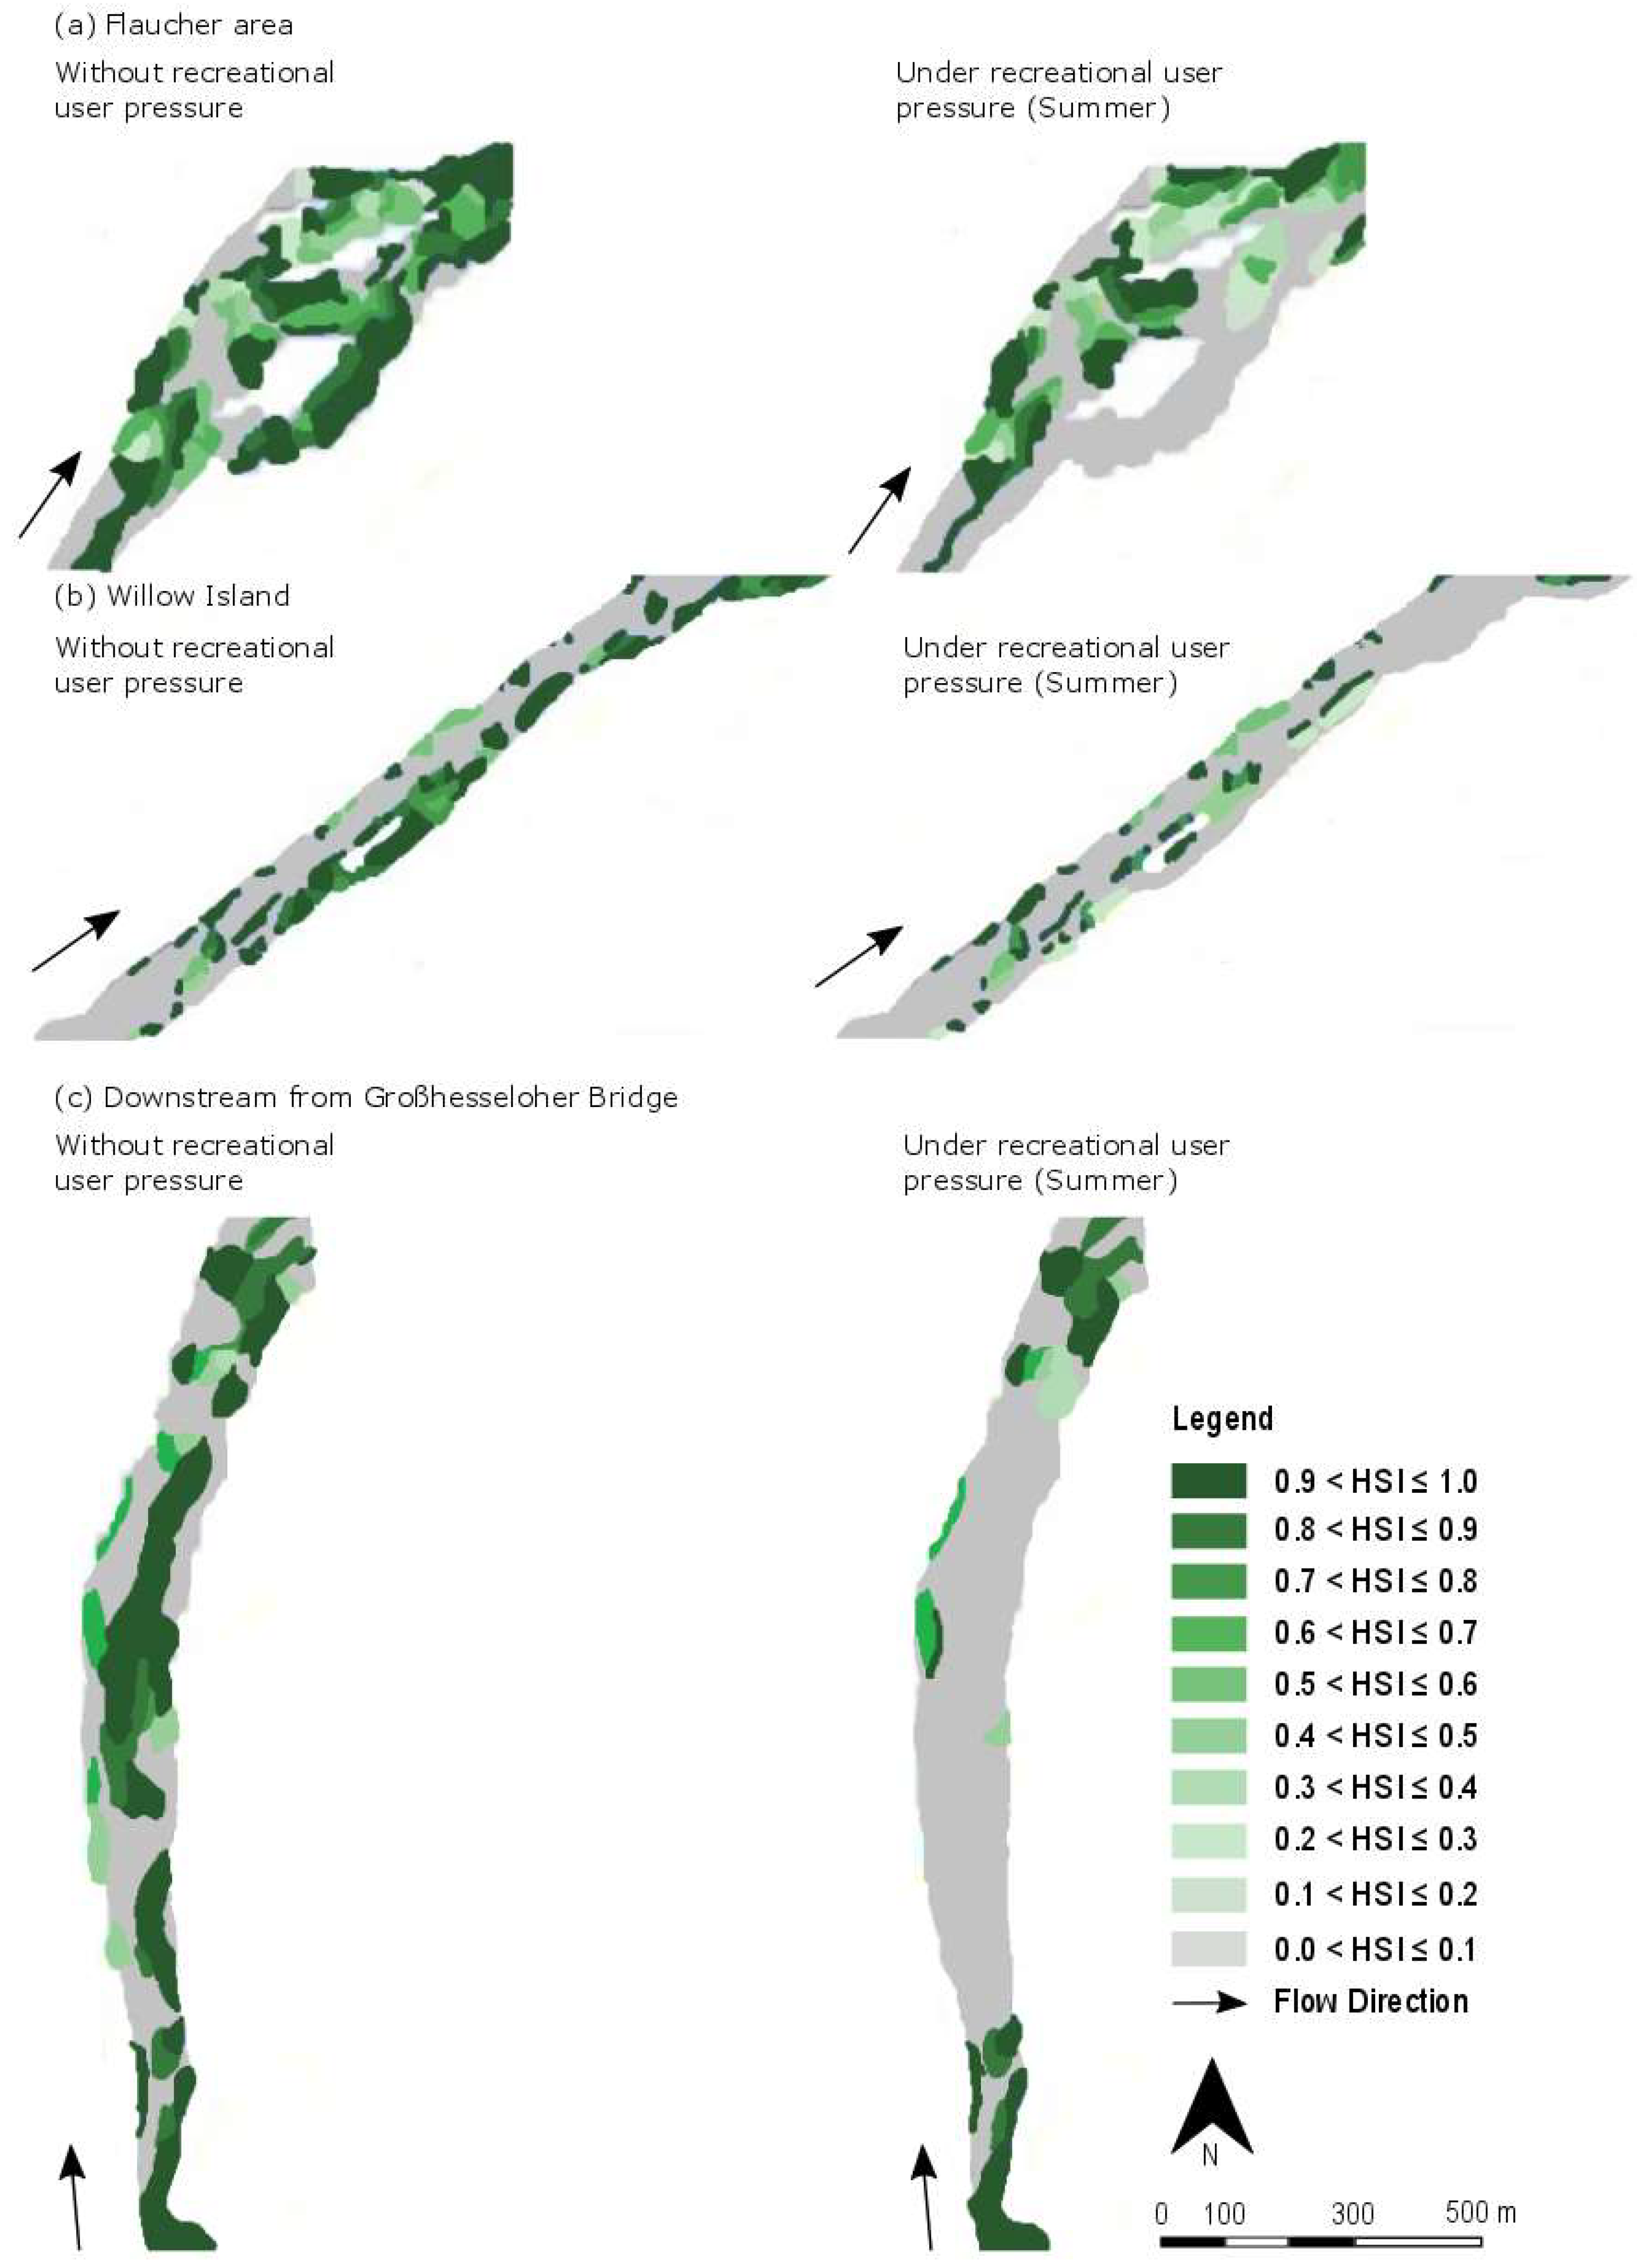
4.2. Spatial Distribution of Suitable Habitats

At NQ, MNQ, and MQ, highly suitable physical habitats for adults in winter and summer (>80%) were mostly located in the southern two-thirds of the study area and predominantly along the western riverside. The Flaucher site had high physical habitat suitability for adult fish during summer (Figure 11f) and winter (Figure 11d), except in the seminatural fishway (more than 80% of which had an HSI of <0.1). River sections (100–200 m) upstream of weirs had low HSI values (mostly <0.1). The area surrounding Willow Island (800 m upstream and 1000 m downstream) also had low HSI values (>90% of the area had an HSI of <0.1) at NQ and MNQ, but HSI values increased in this area at higher discharges. During flood events, suitable habitats for adults were relocated to the western riverside, namely, in the flooded recreational meadows. For NQ, MNQ, and MQ, suitable physical habitats for juveniles and pre-reproduction adults were found in the whole restored section, even in backwaters upstream of weirs. The areas surrounding the Flaucher (Figure 11c,e) and Willow Island had a high density of habitat patches with an HSI >0.9. During flood events, no relocation of habitats for juveniles was found. Suitable physical habitats for larvae and spawning were very limited within the whole restored river section for all investigated discharge levels, even within the Flaucher (Figure 11a,b). Surprisingly, single spots with medium HSI values (0.4–0.7) for both habitats were located on the near-natural river bottom ramps.

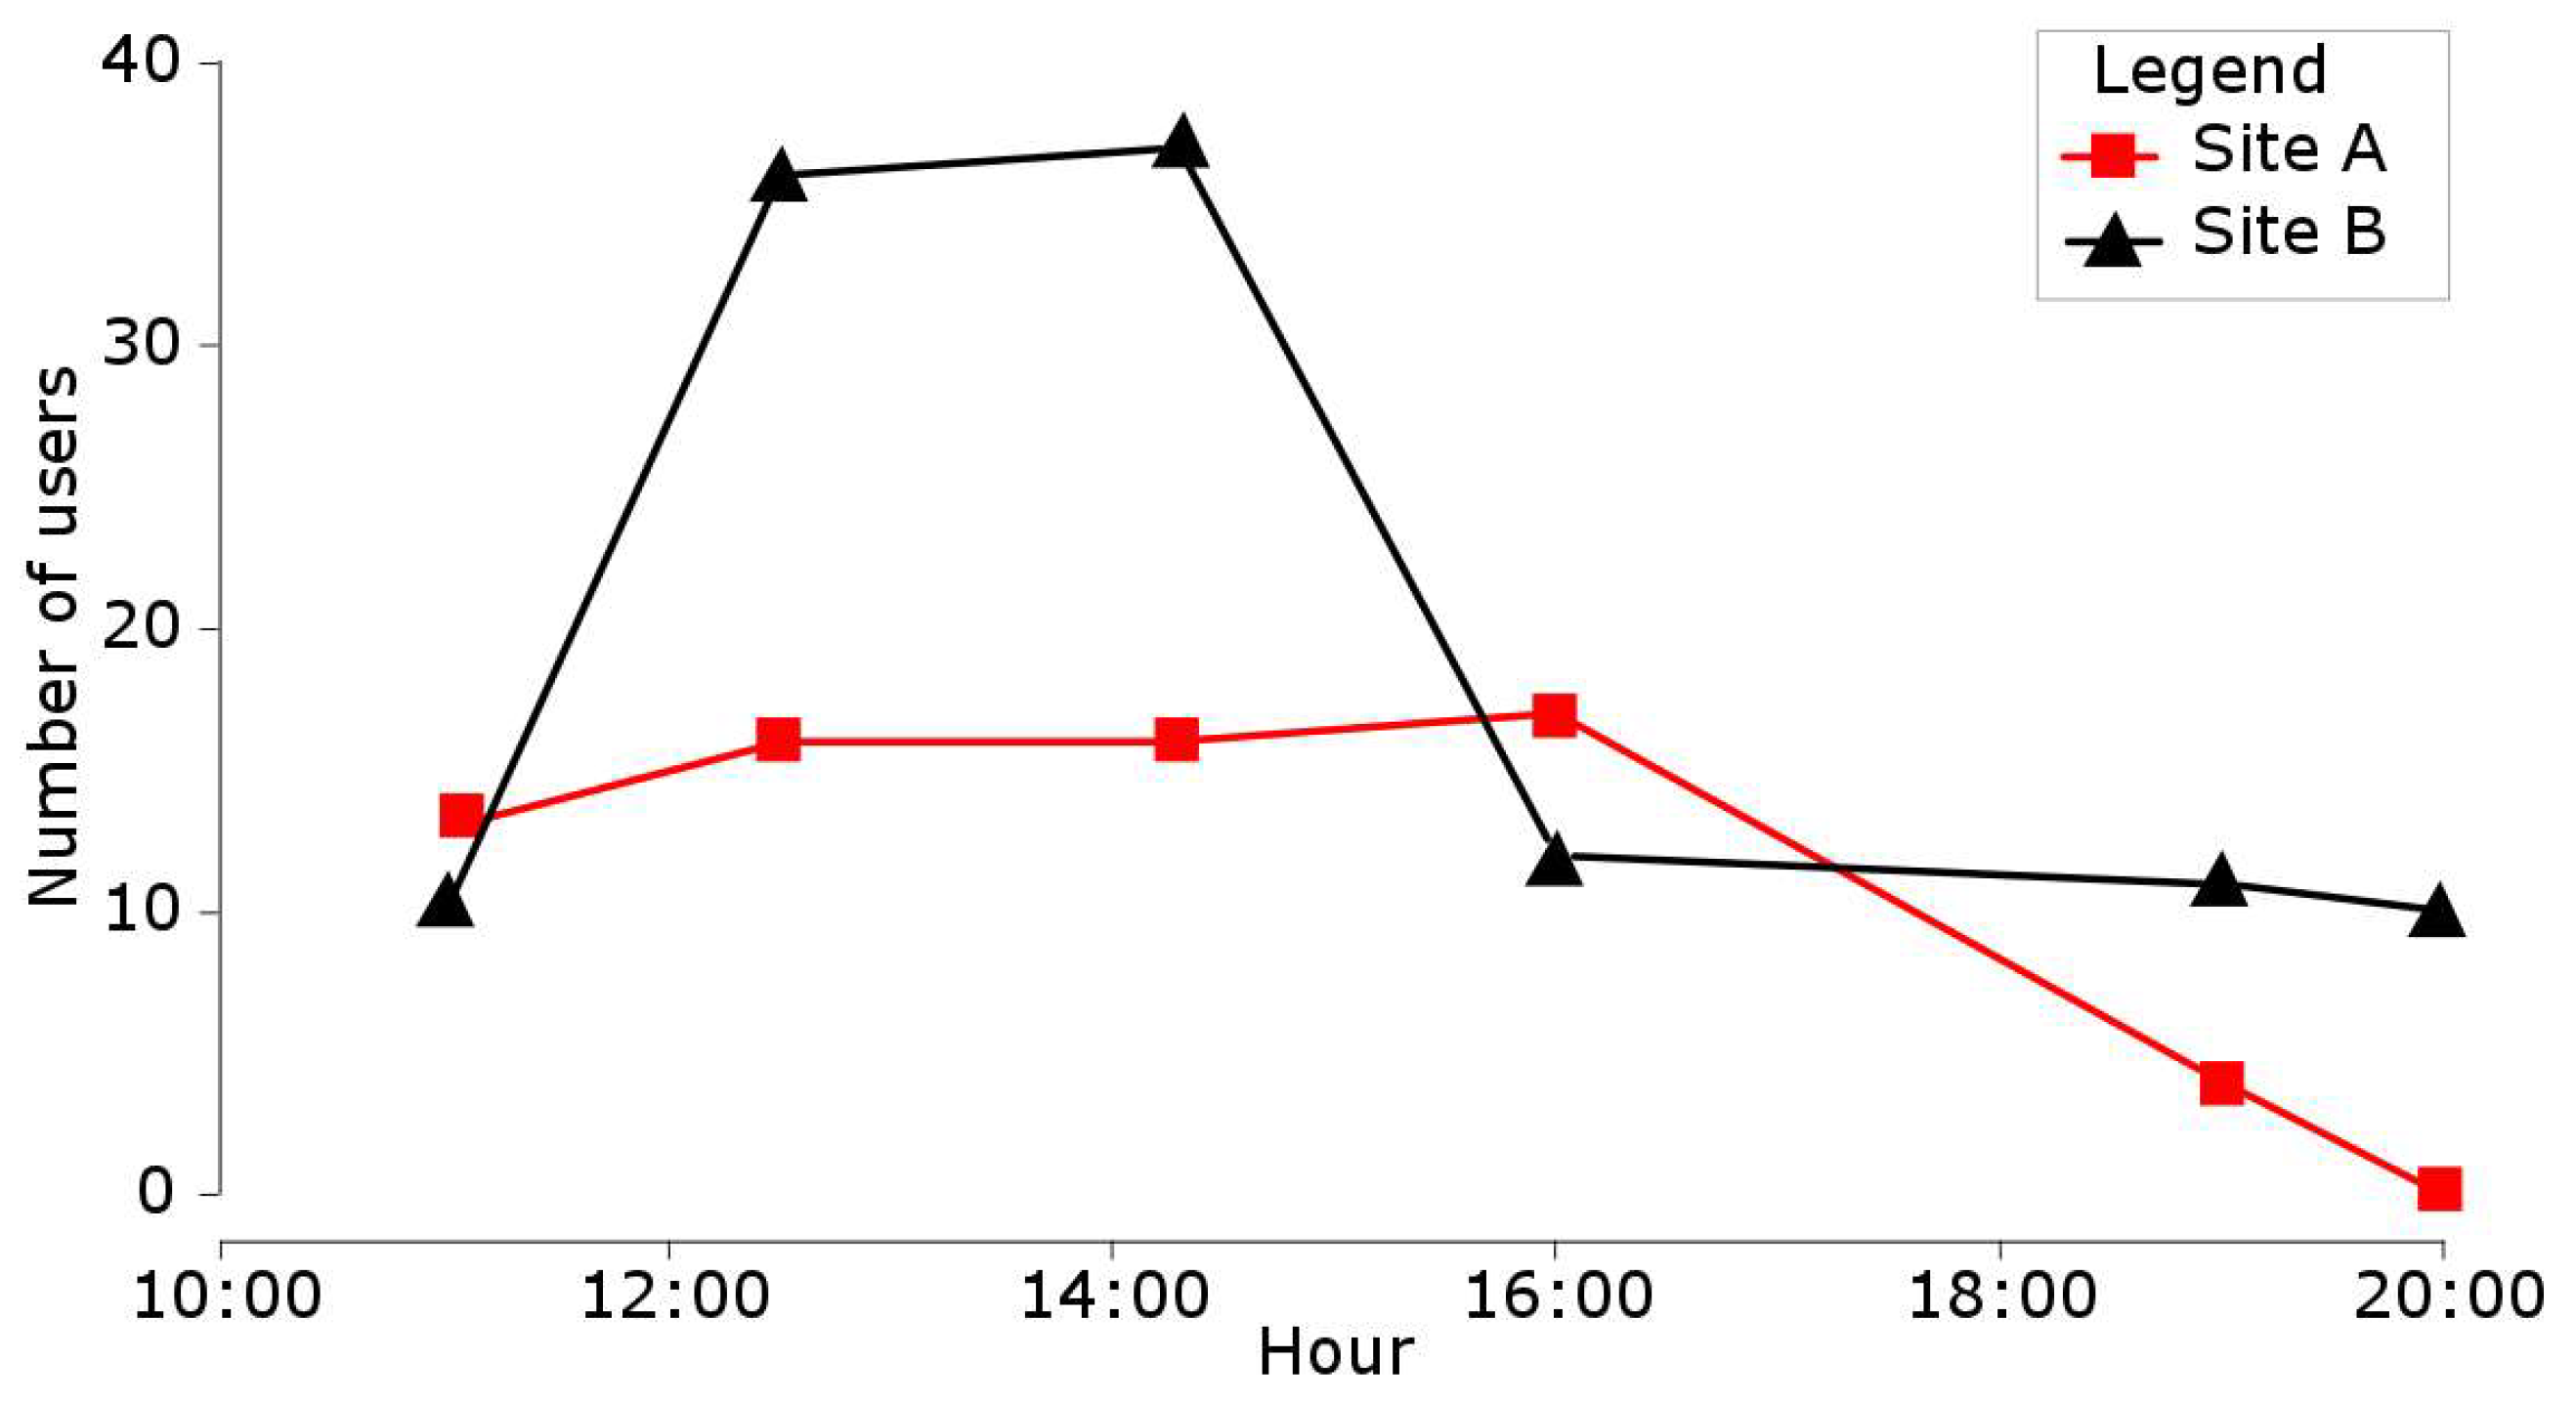
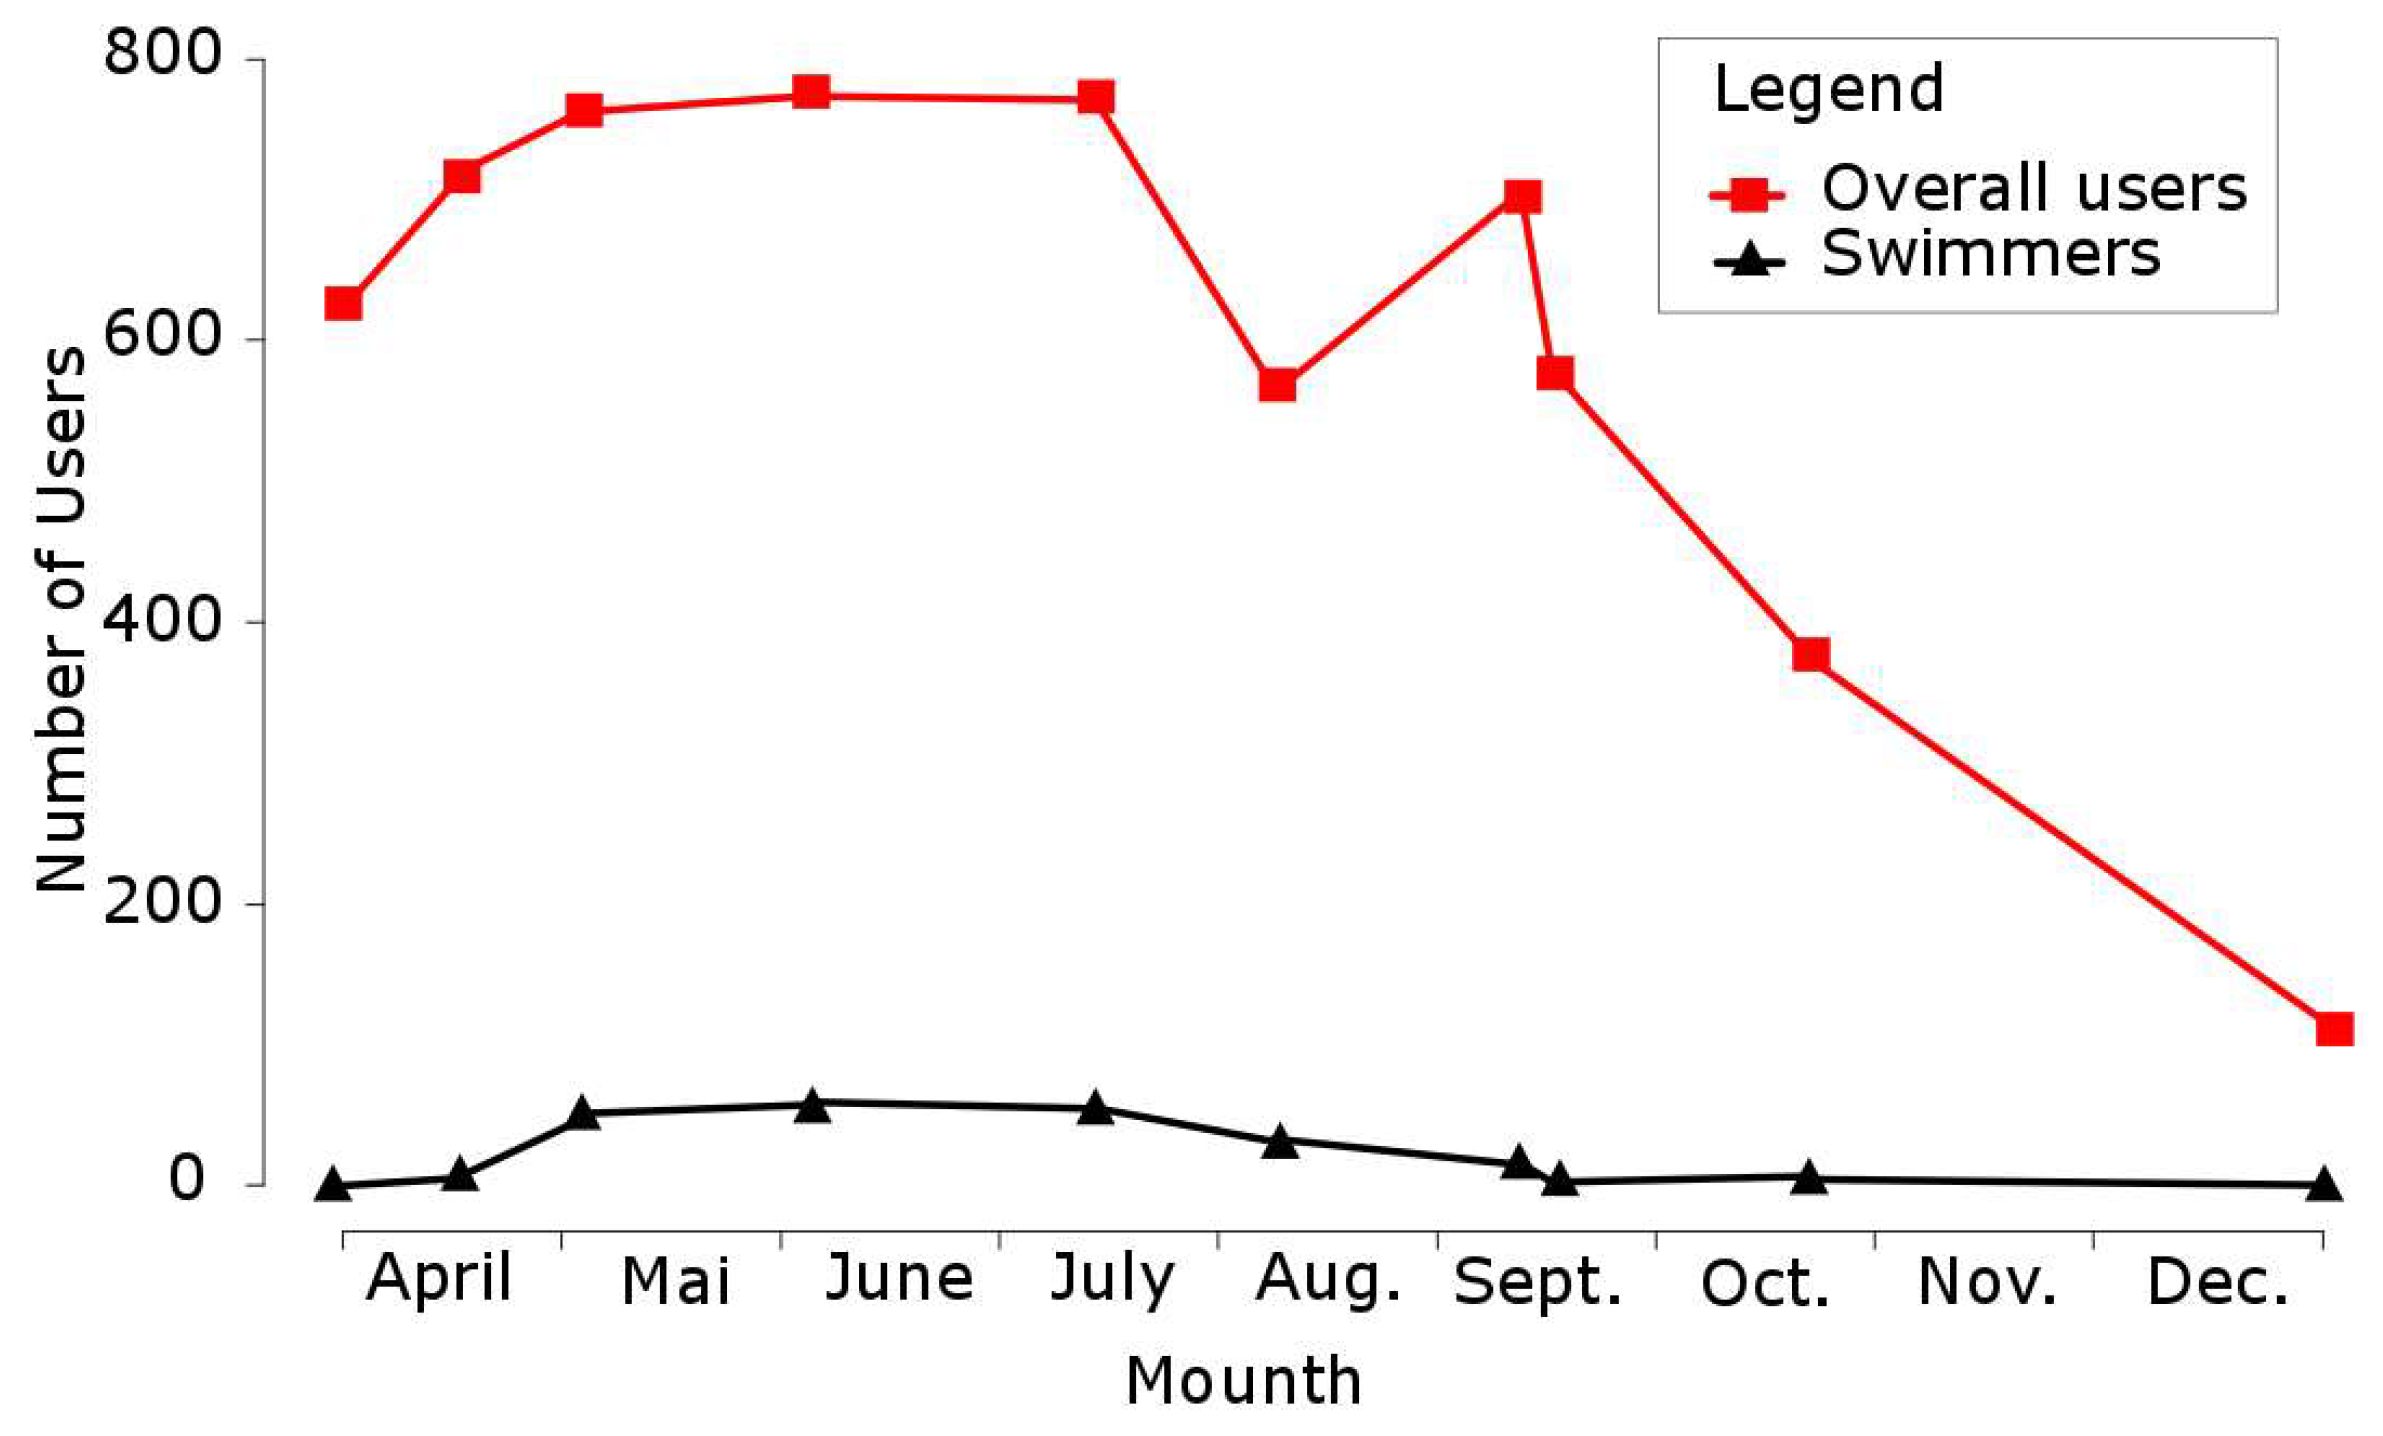
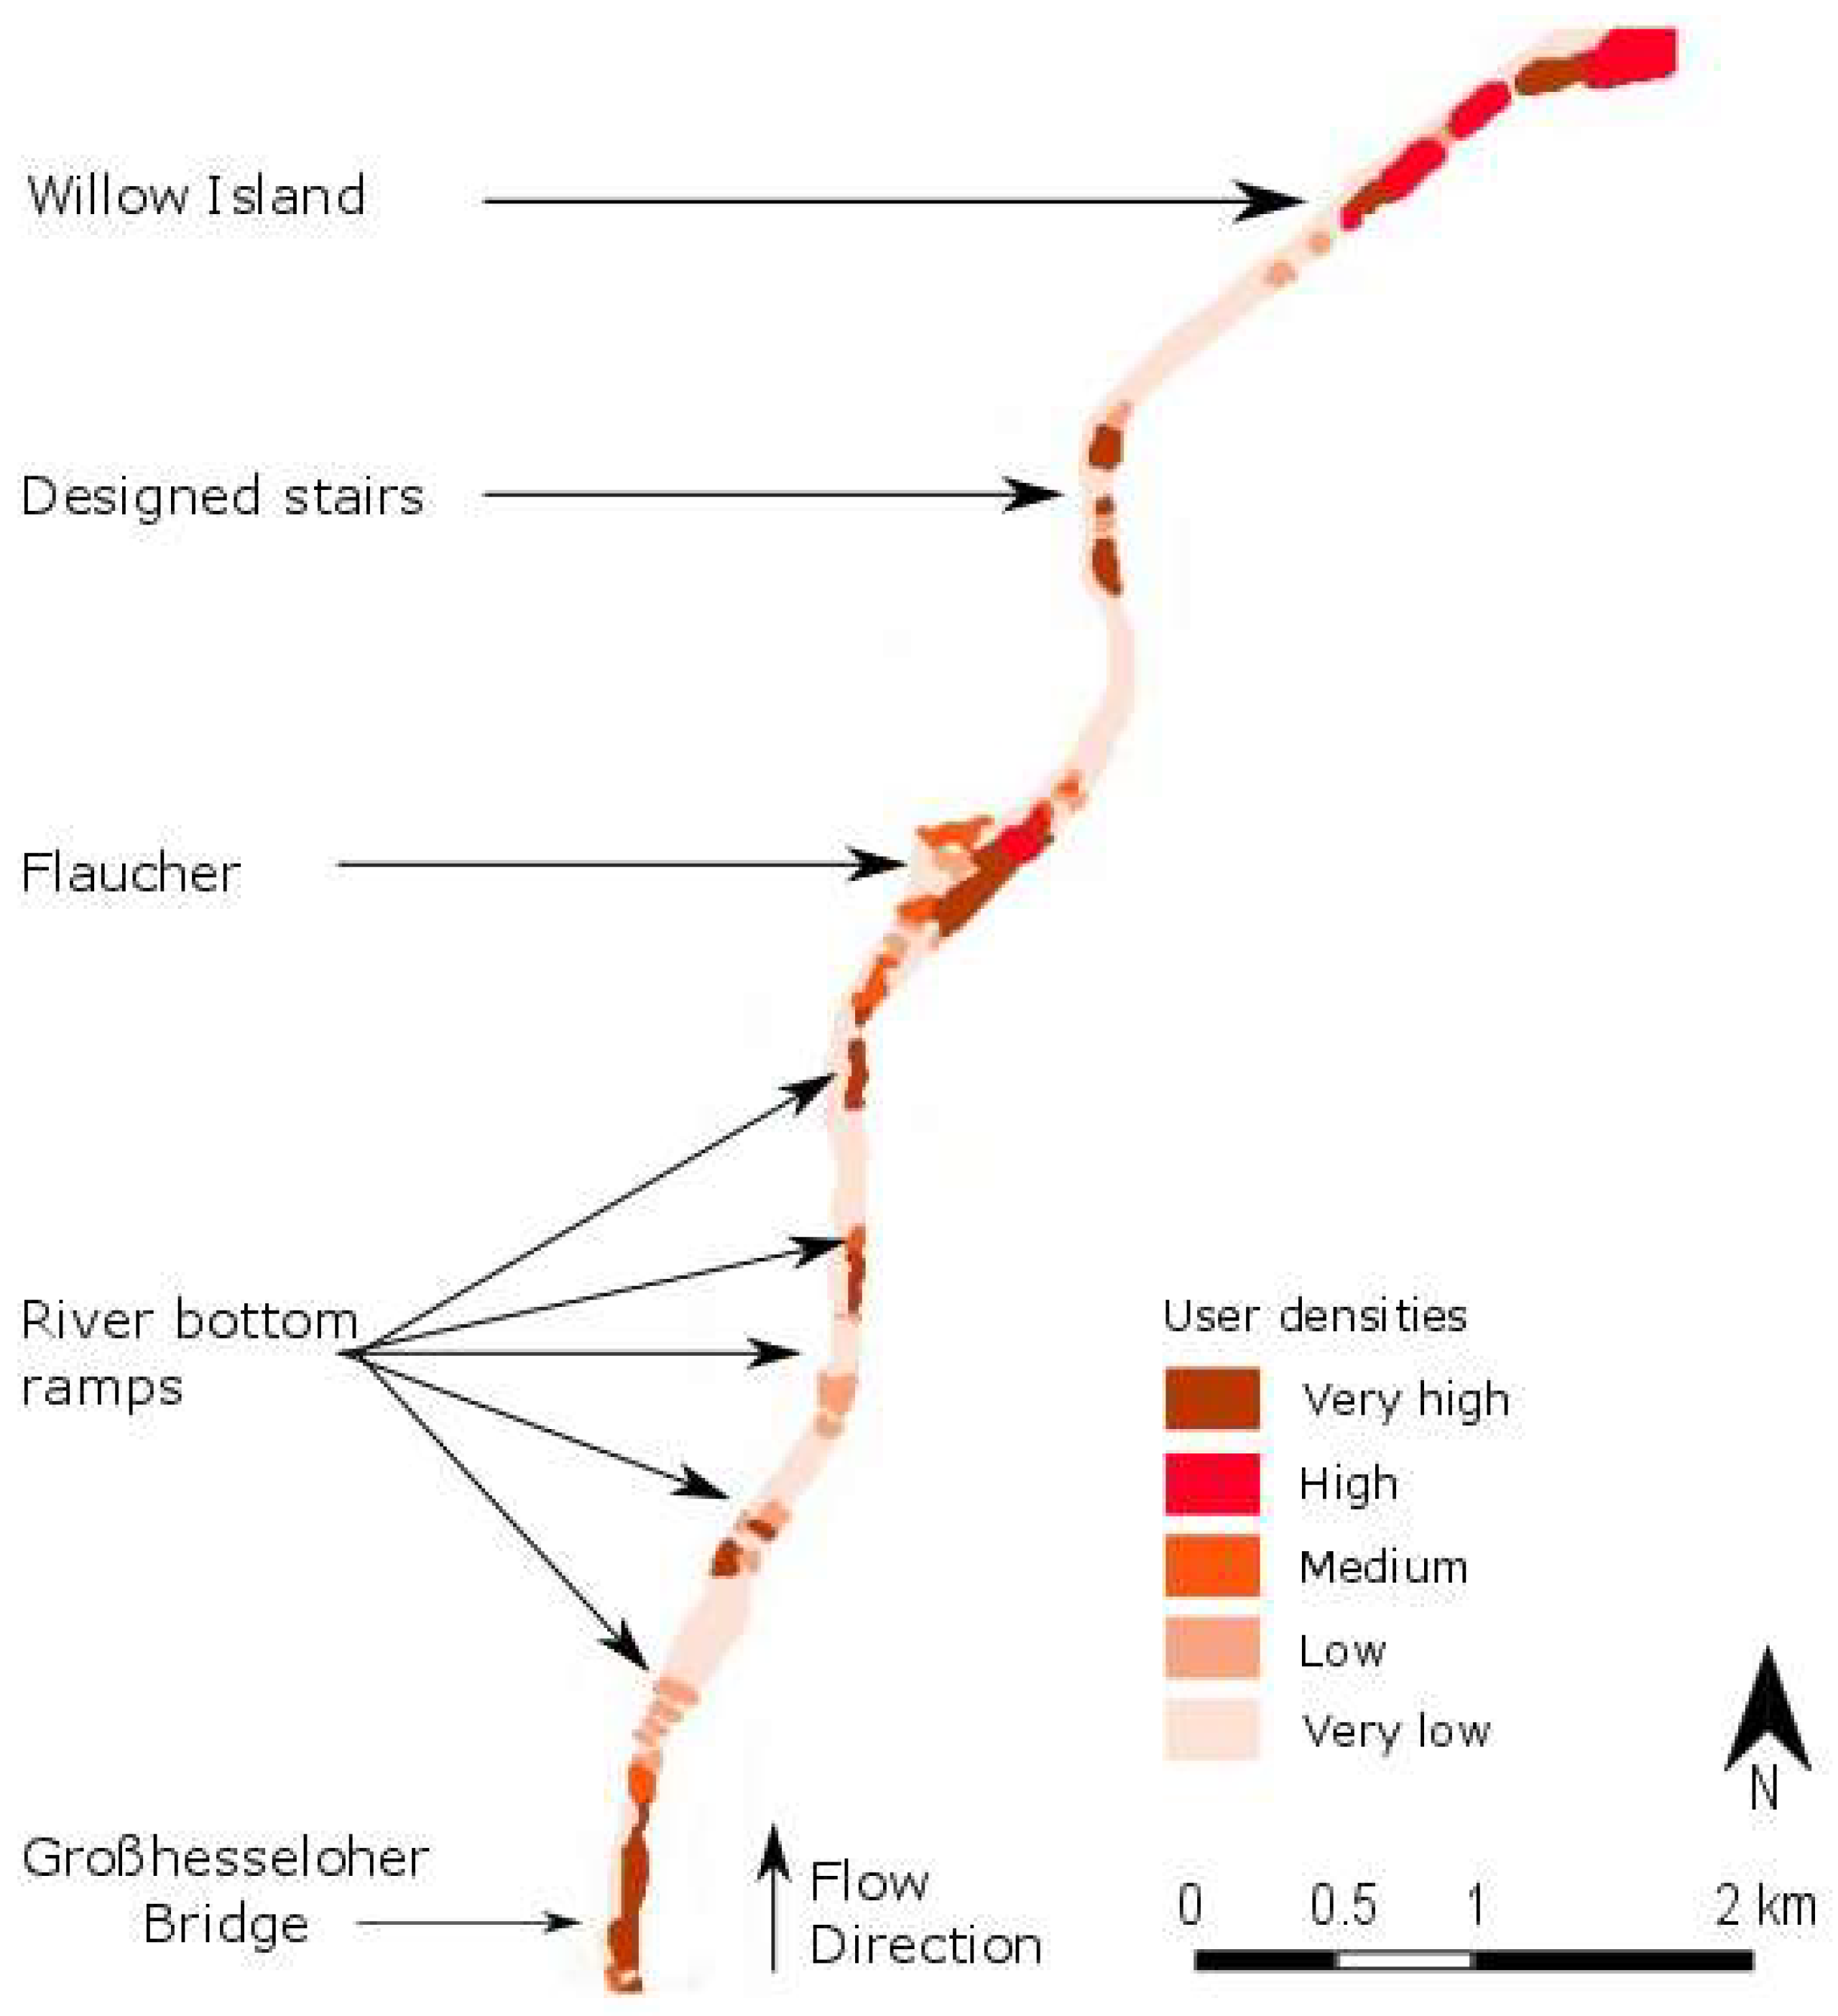
4.3. Spatial and Temporal Distribution of Recreational Pressure

The number of users inside the study area increased at the end of April and decreased at the end of summer (Figure 12). The mean number of users during the study period was 599 (standard deviation (sd) = 211) per daily observation, among whom 23 (sd = 20) were swimmers. The maximum value, which was observed on a June day, was 774 users, including 60 swimmers. In summer, namely late July and August, the number of users dropped mainly due to major rain and flood events.
User density varied inside the study area (Figure 13) (from 0 to 0.24 users per square meter). Most of the users were found on the eastern side (>90%). Recreational user pressure was high in five areas: (1) 600 m up- and downstream from Willow Island during the summer user density reached, on average, 0.12 users per square meter over the whole area. Single spots were found with 0.2 users per square meter, whereas the minimum value of 0.01 users per square meter was recorded in winter. Users mostly sat in small groups on the embankment close to the water and were present only on the eastern side of the river; (2) At the designed stairs, 0.18 (maximum) and 0.04 (minimum) users per square meter were found in summer and in winter, respectively; however, no swimmers were observed; (3) Around the Flaucher, user density in summer reached 0.24 users per square meter, and many users were found in the water (on average, N = 21); (4) On river-bottom ramps, user density locally increased to 0.12 users per square meter (maximum value); (5) From the Großhesseloher Bridge to 1000 m downstream, user density was lower (0.04 users per square meter on average), but a quarter of the users were swimmers. The western side of the river within the whole restored section was under low recreational user pressure.

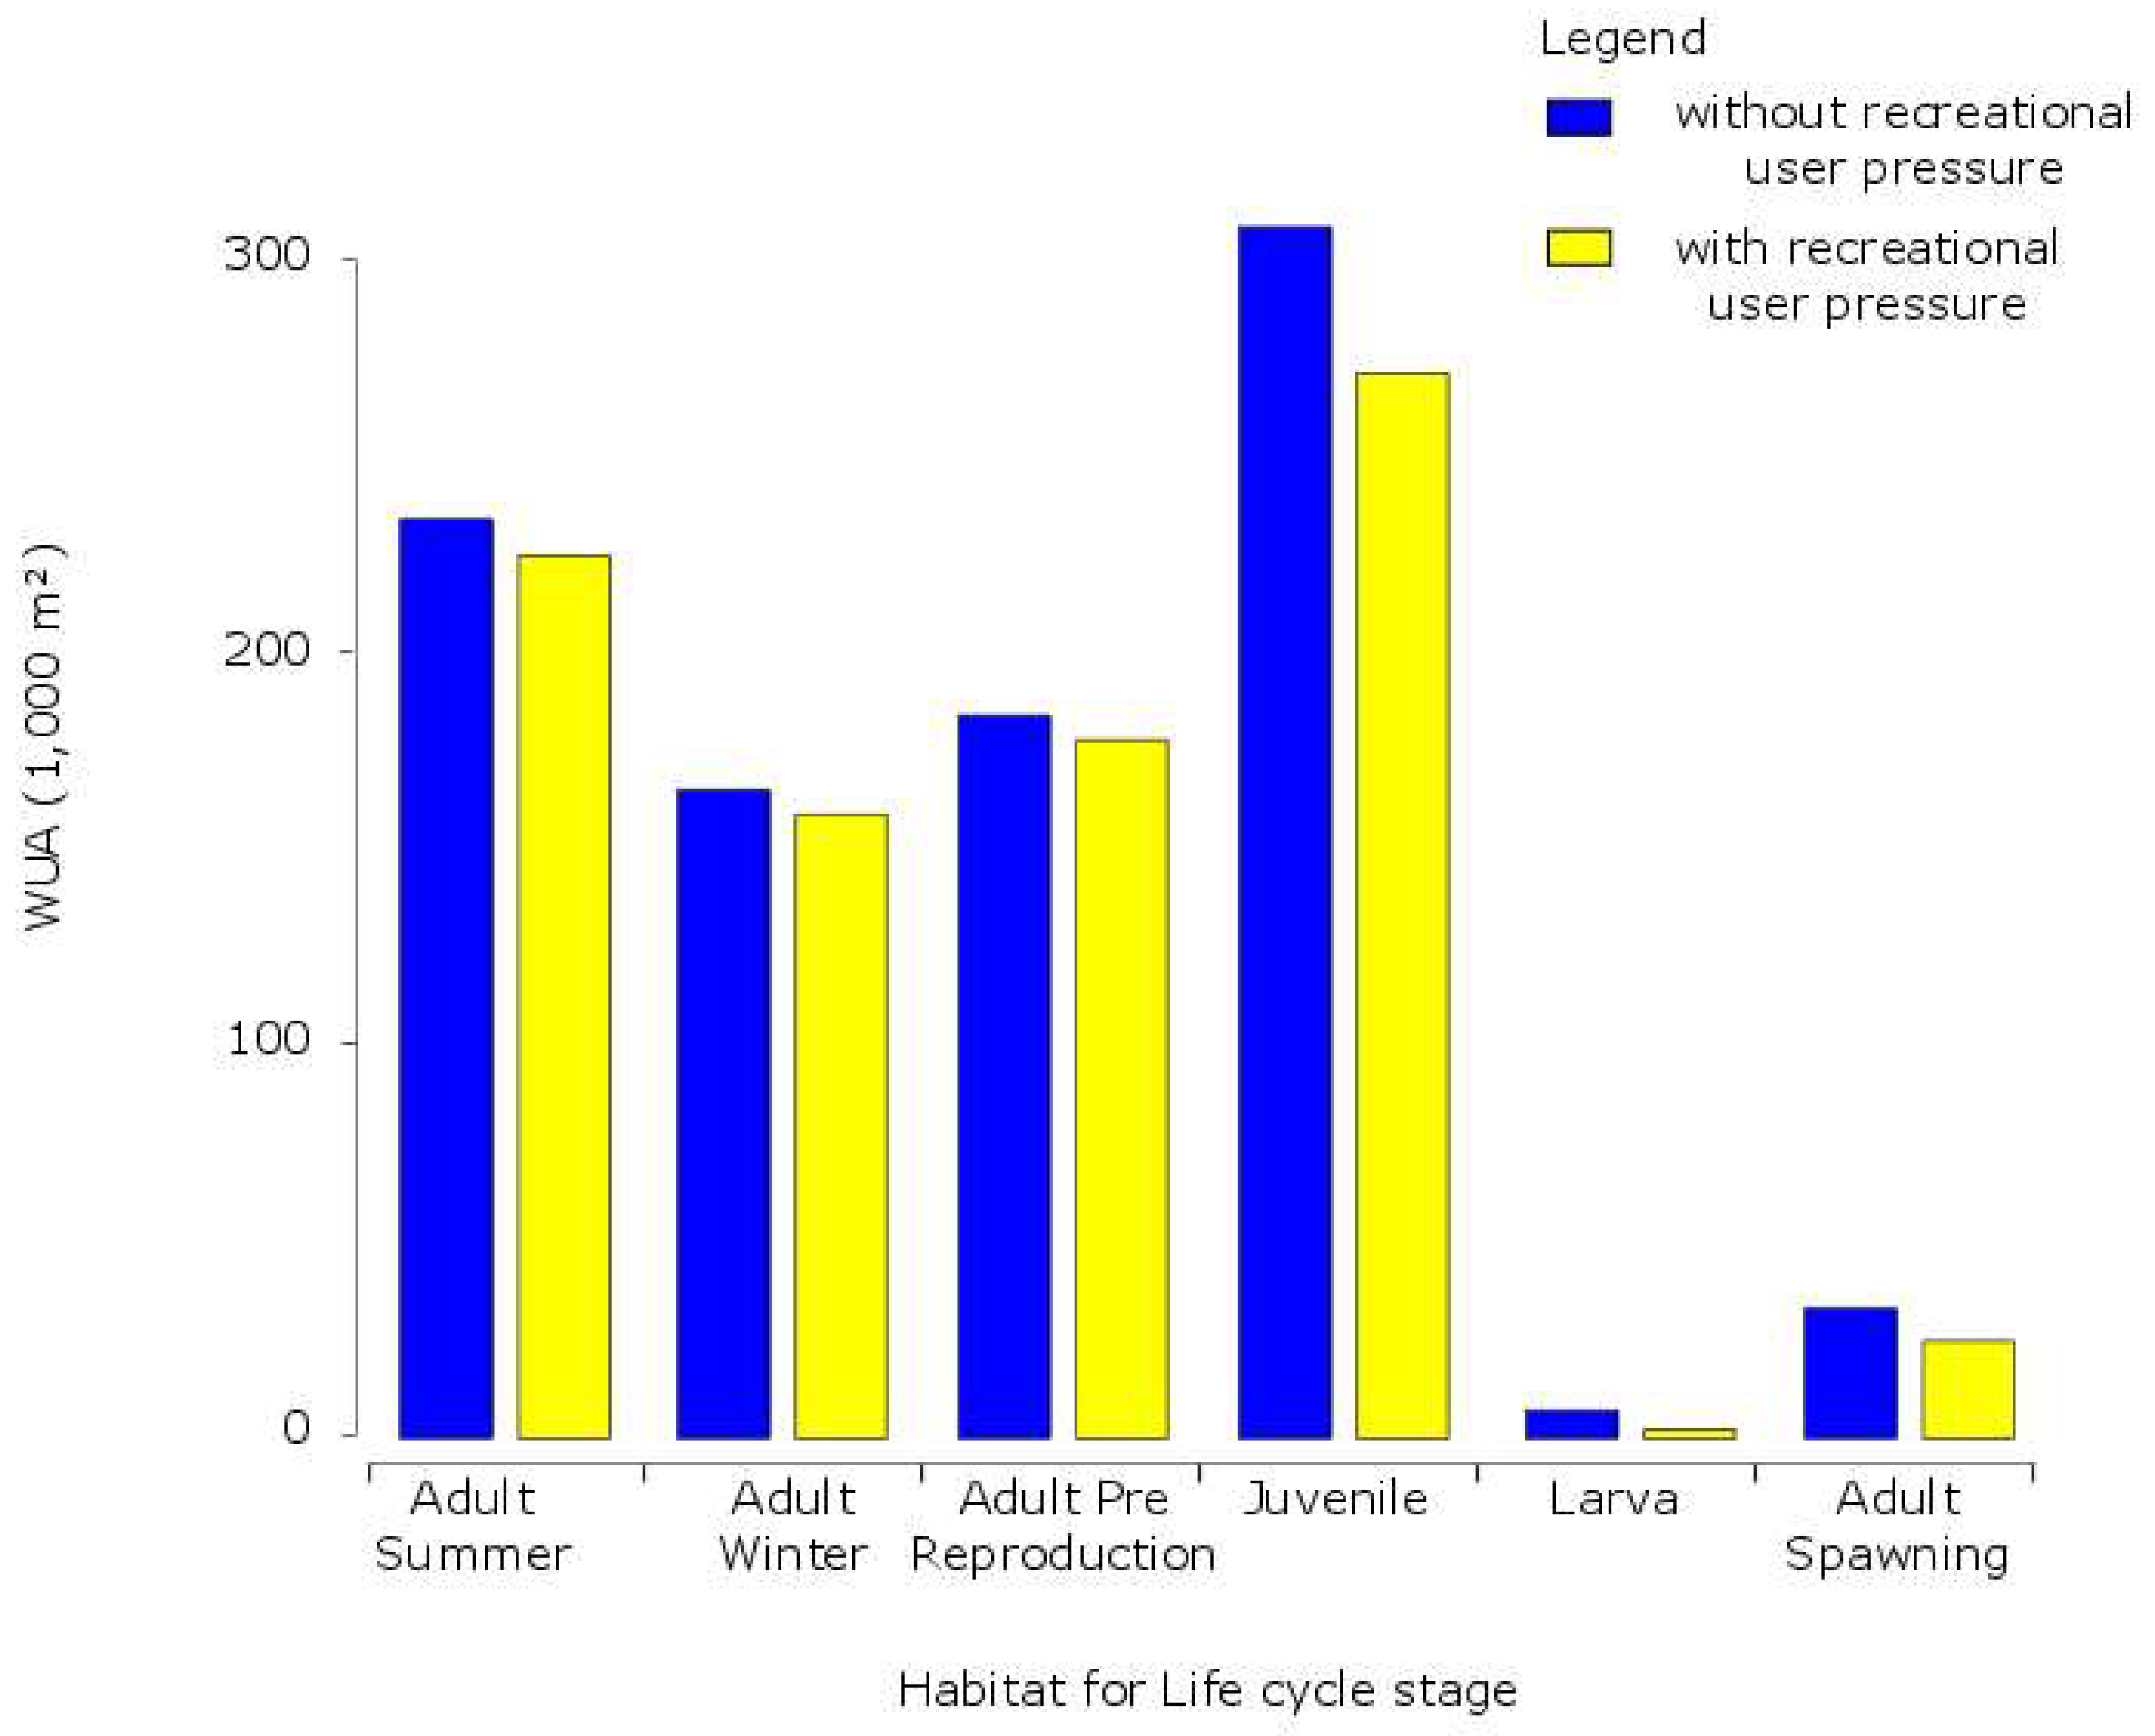
4.4. Influence of Recreational Users on Availability of Habitats for C. nasus

An overall comparison of the WUA values showed that, at MQ, 8% of highly suitable habitats for C. nasus may be lost owing to recreational pressure. Statistical analyses of the 200 randomly chosen points showed that the quantity of suitable habitats and the habitat quality of the restored river section for C. nasus decreased when recreational pressure was integrated into the evaluation procedure for juveniles, spawning adults, and larvae, but no significant differences were found for adults during summer, autumn, winter, and pre-reproduction periods (Figure 14). Potentially highly suitable habitats for juveniles, spawning activities, and larval development lost important parts of their surface areas due to recreational pressure (9%–15.5%, 20%–25%, and 71%–76%, respectively), whereas potentially highly suitable habitats for adults during summer, autumn, winter, and pre-reproduction periods lost only a small part of their surface areas due to recreational pressure (0%–9%, 0%–4%, and 0%–3%, respectively). The largest losses of potentially suitable habitats for juveniles owing to recreational pressure were found on the low-flow secondary arm flowing on the eastern side of Willow Island, on the eastern part of the Flaucher, and just downstream from the Großhesseloher Bridge (Figure 15). For example, the Flaucher site lost more than 60% of its highly suitable habitats for juveniles when recreational pressure was integrated into the model. All the relatively suitable habitats for spawning activities and larval development were located in areas with high user and swimmer densities.

5. Discussion

5.1. Physical Habitat Suitability

The modelling results show that the restored river section provides four out of six suitable physical habitats that C. nasus requires during the stages of its lifecycle, i.e., habitats for adult fish during summer, autumn, and winter, pre-reproduction periods as well as for juveniles. However, the results of the habitat suitability model also showed three major issues that may explain the nonrecovery of the species.
First, we found that the restored river section has very limited suitable habitats for spawning activities and larval development. However, the physical habitat model suggests that near-natural manmade elements, e.g., near natural river-bottom ramps with honeycomb-shaped structures, may have locally positive effects on physical habitat suitability for C. nasus, even if they did not succeed in recreating highly suitable habitats. River-bottom ramps result from the removal of linear low weirs and have honeycomb-shaped structures constructed with natural large rocks to disperse the hydraulic head over a short distance but with a gentle slope. These provide a high diversity of microhabitats with different velocities, depths, and substrata, e.g., for sensitive benthic invertebrates and fish in gravel bar rivers [89]. However, although slight improvements were found, the functionality of the created habitats remains to be proven for the nase. Cyprinidae species require recently deposited clean fine-gravel substratum for spawning and larval development, and further field research is needed to test if the sediments in the ramps are sufficiently clean to allow attachment of nase eggs. Another constraint for the re-establishment of the nase population in the Isar River is that tributaries that historically served as additional spawning sites are today dammed, canalized, and partly buried. Our findings suggest that the priority of the restoration/conservation strategy should be a long-term solution based on the improvement of both the migration potential (namely, the re-establishment of longitudinal and transverse connectivity between the main channel, secondary arms, and tributaries) and the restoration of physical habitats for spawning activities and larval development.
Second, the restored Isar River did not provide sufficient slow-flowing anabranches suitable for juvenile C. nasus during high-discharge events. According to the Isar River seasonal flow regime, major flood events may happen during reproduction or shortly afterward. Larvae and young fish are particularly sensitive to drift during flood events [65,70,72,73]. One anabranch has been recreated (Willow Island), but the goals of the restoration were set to maintain broad flat recreational grassland instead of meandering the riverbed and creating an undulating riverscape. As a consequence, the water velocity remains too high, and the sediment dynamics in the floodplain are too low to provide suitable habitats for recruitment. Even if the direct impact of the recreation is removed during the reproduction period and the early development stage of juveniles, the choice of the project goals, namely, to “provide flat grassland for recreational use”, results in a low suitability of the habitats for these critical life stages. As a consequence, the population of C. nasus in the Isar River is ageing [65].
Natural recruitment is the most promising option for conservation [77], as previous attempts of restocking C. nasus have failed [74]. Our findings suggest that the restoration/conservation strategy should include the improvement of both the migration potential (namely, the re-establishment of longitudinal and transverse connectivity between the main channel, secondary arms, and tributaries) and the restoration of physical habitats for spawning activities and larval development by permitting more sediment dynamics. We predict that if recovery occurs, the southern section will have higher densities than the northern one due to its higher habitat suitability values.

5.2. Conflicts between Wildlife and Recreational User Pressure

Our results suggest that different conflicts occur according to lifecycle–specific habitat types of C. nasus and the periodic preferences of recreational users. We found that the highest user densities partly occurred in suitable habitats for juvenile C. nasus, i.e., low-flow zones and the submerged tops of gravel bars. However, the modelled habitats for juveniles were rather widely distributed over the restored river stretch, and the overall impact of users may remain limited. User densities were also high in the rare potential spawning areas, e.g., river-bottom ramps, causing a significant decrease in the WUA. However, the spawning period (beginning of May) may occur shortly before the user density ranges from high to very high (May to October), but overlapping of the areas used by C. nasus and recreationists remains likely. Our results suggest that users have a low impact (a) on adult fish during winter, because user density is significantly lower and C. nasus inhabits deeper water than during summer and autumn [64,65,69]; (b) on adult fish during summer and autumn, because users observed in our study were mostly located on the eastern side and suitable physical habitats were on the western side; and (c) on adults during the pre-reproduction period, because fish biologists described C. nasus as less sensitive to disturbance at this time. We suggest that conflicts may be avoided if user distribution can be wisely influenced by the design of restoration and by adequate guidance of users.
Tools for managers attempting to mitigate recreation–wildlife interactions are regulations, public education, and a user-management plan. First, we generally advise against the formulation of regulations forbidding the recreational use of larger riverine areas within the city because positive public support for sustainable management and restoration projects is strongly driven by perception, communication, possibilities to participate, and the usefulness of the restoration outcomes. However, in case of great importance, e.g., last occurrence of a population, restrictions may be the only solution. Acceptance of this restriction is efficient if the abstinence of using a protected site becomes a collective activity of respect towards an acknowledged heritage. Second, informing and educating the public can be addressed by an attitude-change strategy. Urban river beaches are prime sites for creating encounter places of man and nature, which help to re-establish emotional linkages, create motivation, and change decisional values in favor of maintaining or restoring ecosystem integrity [2]. A study on the Danube showed that only 40% of recreational users were aware that wildlife is disturbed by recreational activities, e.g., off-trail walking [90]. Educational work to increase the awareness and knowledge of the public seems to be a sustainable tool for avoiding conflicts between users and wildlife. However, a strategy for attitudinal change may be ineffective. A study showed that only 5% of recreationists change their behavior after educational work. Furthermore, a study in the United States showed that people are becoming less supportive toward fish and restoration efforts targeting fish species. Accordingly, we consider that this strategy may be very useful to provide sites for environmental education in cities and enable attitude change even beyond the visited site. However, highly sensitive species may not be able to sustain the disturbances at highly frequented sites. The targets for restoration projects need to be well defined, explained, and chosen by the public [15]. Third, managing flows of visitors applying a user-management plan may relocate users and separate sections of the river between recreationists and ecological refuges for wildlife [91]. Studies have shown that user preferences for waterscapes are driven by both visual values [23,92,93,94,95], e.g., parameters of fascination, vividness, and naturalness [93,94,95], and usability [96]. In our case study, it may be relevant to create suitable habitats for wildlife on the western side of the river, which is almost inaccessible to citizens because of the topography of the area. However, user preferences are complex because every individual may perceive landscapes in a different way and may be differently affected by environmental and societal stimuli.
Interest in the prediction of user density and distribution for implementing a motivational management strategy that regulates users has grown considerably in recent years. User distribution maps or models should be integrated into habitat suitability models to create a predictive tool to help choose the best restoration design, to define refuges for species, and to investigate future scenarios (climate change, industrialization, increases in user density, etc., see next paragraph). However, this area of scientific inquiry involves a broad range of disciplines and their respective fields of knowledge. More studies on recreational user preferences and recreational impacts on wildlife remain to be carried out to provide a strong baseline for the design of user-management plans based on an integrated framework for coexistence between recreationists and biodiversity.

5.3. Benefits of Integrating User Pressure into the Physical Habitat Model

The modeling of fish habitats using CASiMiR provided significant results for evaluating the quality of the physical habitats for C. nasus in the studied river section. A novelty was the inclusion of recreational user pressure as a new parameter in the habitat-modeling procedure, which showed clear differences from the results of modeling physical habitats only. The modeling procedure helped to identify conflict areas and the lifecycle stage (juveniles) that may be most affected by users. However, the method still has some limitations. Considering the precision of the assessment of recreational pressures, we have to state that occasional observations have revealed much higher figures of riverbank-users than the results from a standardized procedure presented here. In order to reduce bias from the high fluctuation of users (driven by working time and weather conditions), user surveys should be more frequent and long term. We suggest the use of drones or aerial photographs to reduce cost. Another critical point is the evaluation of species tolerance limits, namely, tolerated user intensities and frequencies. In this study, the habitat preferences and impacts of recreationists were estimated by expert statements of fish biologists because little scientific literature was available concerning these points. Despite the fact that expert evaluations of ecological quality may be as trustworthy as assessments made by experimental field investigations [97], future research designed specifically to evaluate the impact of recreationists on wildlife would be helpful.
Our study has demonstrated the existence of habitats with suitable flow velocities, depths, and substrata for all lifecycle stages of C. nasus historically observed in this Isar River section, and it suggests that the reduction of adequate spawning and juvenile habitats by physical destruction and by user pressure (on the juvenile habitats) is responsible for the absence of recruitment. However, it does not explain fully the absence of C. nasus in the restored Isar River section. Other habitat variables such as temperature, food sources, and predators as well as habitat availability on the scale of the catchment could be taken into account to complete the picture.

6. Conclusions

This study delivered a model of the suitability of habitats for the indicator species Chondrostoma nasus (L.) on the restored Isar River in Munich (Germany), including, as a novel feature, the impact of recreational users as a supplementary parameter in the habitat suitability model. The findings of the study are threefold. First, the research showed that the restoration of the studied river section succeeded in providing physically suitable habitats for all lifecycle stages of the species in general. It also showed that the establishment of habitats for spawning and larval development, the creation of refuges for sensitive lifecycle stages during flood events, and the re-establishment of a wide diversity of habitats has not been achieved within the northern part of the restored river section. Second, the model showed that recreational users may cause decreases in highly suitable habitats for sensitive lifecycle stages of C. nasus in identified zones of conflict, especially during summer, when recreational user density is high. We suggest to combine two approaches: (a) providing sections of riverine beaches as encounter sites of man and nature in the sense of the River Culture Concept [2] with (b) a user-management plan directing flows of visitors out of highly sensitive sites by making them less or not accessible.. Third, the developed method enabled an integrative evaluation of habitat quality for the target species. The modeling approach, which combines hydro-morphological–biological modelling with user pressure, has been shown to be a useful tool for increasing the efficiency of ecological restoration design, defining the best location for the re-introduction of sensitive species, and supporting user-management plans in urban contexts. Further research about the behavior of fish facing recreational pressures, variables such as temperature and the food-web composition, and habitat availability on the catchment scale is needed to identify the ultimate causes for the failure to re-establish C. nasus. We argue that there is an urgent need for a shift in the design of restoration projects and their evaluation toward holistic and interdisciplinary approaches that embrace the principles of socioecological systems.

Supplementary Materials

The following are available online at https://www.mdpi.com/2071-1050/10/6/1747/s1. Table S1: Fuzzy sets and rules for the studied habitats, namely for adults (during the winter, the summer and autumn, during pre-reproduction, and spawning), larvae, and juveniles C. nasus at the Isar river (Germany) considering the input variables (i.e. velocity, water depth, Substratum, recreational pressure). Table S2: Wetted area and relative percent of the wetted area with not suitable (HSI<0.1), low suitability (HSI between 0.1 and 0.3), medium suitability (HSI between 0.3 and 0.6) and high suitability (HSI>0.6) at MQ. Table S2 presents all the scenarios. Table S3: Weighted Usable Area (WUA), Hydraulic Habitat Suitability index (HHS), and Mean Habitat Suitability Index (mean HSI) value for each habitat and all scenarios.

Author Contributions

A.Z.-H., K.M.W, S.P. and S.G. conceived and designed the experiments; A.Z.-H., M.N. and K.S. performed the experiments and analyzed the data; K.M.W., S.P. and S.G. contributed analysis tools, A.Z.-H., M.N., S.G., K.S., K.M.W. and S.P. wrote the paper, A.Z.-H., M.N., K.S. and K.M.W. revised the manuscript.

Funding

This research was funded by French Ministry of Research.

Acknowledgments

This study was published under the auspices of the UNESCO Chair “River Culture–Fleuves et Patrimoine”. We thank all the members of the Chairs and of the research groups for their inputs, and we thank the French Ministry of Research for providing research funding and the Technical University of Munich for technical and financial support. We thank the Chair of Hydraulic and Water Resources Engineering (Technical University of Munich) and the Institute for Modeling Hydraulic and Environmental Systems (University of Stuttgart) for their collaboration. We thank all the fish biologists who helped in designing the fish habitat suitability model, particularly the institute for fishery at the Bavarian regional office for agriculture (Bayerische Landesanstalt für Landwirtschaft), the Chair of Aquatic Systems Biology of the Department for Ecology and Ecosystem Management of the Technical University of Munich, and the NGO IsarFisher. We also thank Rupert Mayr and Stefan Schäfer for helping with the field survey and Spannring from SKI GmbH+ Co. KG for helping with the 2D hydro-morphological model. Special thanks go to Jürgen Geist and Joachim Pander.

Conflicts of Interest

The authors declare no conflict of interest. The founding sponsors had no role in the design of the study; in the collection, analyses, or interpretation of data; in the writing of the manuscript, and in the decision to publish the results.

References

  1. The SER International Primer on Ecological Restoration (SER). Tucson: Society for Ecological Restoration International. 2004. Available online: www.ser.org (accessed on 15 May 2014).
  2. Wantzen, K.M.; Ballouche, A.; Longuet, I.; Bao, I.; Bocoum, H.; Cissé, L.; Chauhan, M.; Girard, P.; Gopal, B.; Kane, A.; et al. River Culture: An eco-social approach to mitigate the biological and cultural diversity crisis in riverscapes. Ecohydrol. Hydrobiol. 2016, 16, 7–18. [Google Scholar] [CrossRef]
  3. Vörösmarty, C.J.; McIntyre, P.B.; Gessner, M.O.; Dudgeon, D.; Prusevich, A.; Green, P.; Glidden, S.; Bunn, S.E.; Sullivan, C.A.; Liermann, C.R.; et al. Global threats to human water security and river biodiversity. Nature 2010, 467, 555–561. [Google Scholar] [CrossRef] [PubMed]
  4. Millennium Ecosystem Assessment. Ecosystems and Human Well-Being: Current State and Trends; Island Press: Washington, DC, USA, 2005. [Google Scholar]
  5. Palmer, M.; Bernhardt, E.S. Hydroecology and river restoration: Ripe for research and synthesis. Water Resour. Res. 2006, 42, 1–4. [Google Scholar] [CrossRef]
  6. Bernhardt, E.S.; Palmer, M.A.; Allan, J.D.; Alexander, G.; Barnas, K.; Brooks, S.; Carr, J.; Clayton, S.; Dahm, C.; Follstad-Shah, J.; et al. Ecology-Synthesizing US river restoration efforts. Science 2005, 308, 636–637. [Google Scholar] [CrossRef] [PubMed]
  7. Brooks, S.S.; Lake, P.S. River restoration in Victoria, Australia: Change is in the wind, and none too soon. Restor. Ecol. 2007, 15, 584–591. [Google Scholar] [CrossRef]
  8. Nakamura, K.; Tockner, K.; Amano, K. River and wetland restoration: Lessons from Japan. Bioscience 2006, 56, 419–429. [Google Scholar] [CrossRef]
  9. Morandi, B.; Piégay, H.; Lamouroux, N.; Vaudor, L. How is success or failure in river restoration projects evaluated? Feedback from French restoration projects. J. Environ. Manag. 2014, 137, 178–188. [Google Scholar] [CrossRef] [PubMed]
  10. Leps, M.; Sundermann, A.; Tonkin, J.D.; Lorenz, A.W.; Haase, P. Time is no healer: Increasing restoration age does not lead to improved benthic invertebrate communities in restored river reaches. Sci. Total Environ. 2016, 557, 722–732. [Google Scholar] [CrossRef] [PubMed]
  11. Zingraff-Hamed, A.; Greulich, S.; Pauleit, S.; Wantzen, K.M. Urban and rural river restoration in France: A typology. Restor. Ecol. 2017, 25, 994–1004. [Google Scholar] [CrossRef]
  12. Haase, P.; Hering, D.; Jähnig, S.C.; Lorenz, A.W.; Sundermann, A. The impact of hydromorphological restoration on river ecological status: A comparison of fish, benthic invertebrates, and macrophytes. Hydrobiologia 2013, 704, 475–488. [Google Scholar] [CrossRef]
  13. Kail, J.; Brabec, K.; Poppe, M.; Januschke, K. The effect of river restoration on fish, macroinvertebrates and aquatic macrophytes: A meta-analysis. Ecol. Indic. 2015, 58, 311–321. [Google Scholar] [CrossRef]
  14. Lepori, F.; Palm, D.; Brännäs, E.; Malmqvist, B. Does restoration of structural heterogeneity in streams enhance fish and macroinvertebrate diversity? Ecol. Appl. 2005, 15, 2060–2071. [Google Scholar] [CrossRef]
  15. Woolsey, S.; Capelli, F.; Gonser, T.; Hoehn, E.; Hostmann, M.; Junker, B.; Paetzold, A.; Roulier, C.; schweizer, S.; Tiegs, S.D.; et al. A strategy to assess river restoration success. Freshw. Biol. 2007, 52, 752–769. [Google Scholar] [CrossRef]
  16. Meyer, J.L.; Paul, M.J.; Taulbee, W.K. Stream ecosystem function in urbanizing landscapes. J. N. Am. Benthol. Soc. 2005, 24, 602–612. [Google Scholar] [CrossRef]
  17. Fletcher, T.D.; Andrieu, H.; Hamel, P. Understanding, management and modeling of urban hydrology and its consequences for receiving waters: A state of the art. Adv. Water Resour. 2013, 51, 261–279. [Google Scholar] [CrossRef]
  18. Walsh, C.J.; Fletcher, T.D.; Ladson, A.R. Stream restoration in urban catchments through redesigning stormwater systems: Looking to the catchment to save the stream. J. N. Am. Benthol. Soc. 2005, 24, 690–705. [Google Scholar] [CrossRef]
  19. Kondolf, G.M.; Pinto, P.J. The social connectivity of urban rivers. Geomorphology 2016, 277, 182–196. [Google Scholar] [CrossRef]
  20. Zingraff-Hamed, A.; Greulich, S.; Wantzen, K.M.; Pauleit, S. Societal Drivers of European Water Governance: A Comparison of Urban River Restoration Practices in France and Germany. Water 2017, 9, 206. [Google Scholar] [CrossRef]
  21. Bernhardt, E.S.; Palmer, M.A. Restoring streams in an urbanizing world. Freshw. Biol. 2007, 52, 738–751. [Google Scholar] [CrossRef]
  22. Vermaat, J.E.; Wagtendonk, A.J.; Brouwer, R.; Sheremet, O.; Ansink, E.; Brockhoff, T.; Plug, M.; Hellsten, S.; Aroviita, J.; Tylec, L.; et al. Assessing the societal benefits of river restoration using the ecosystem services approach. Hydrobiologia 2016, 769, 121–135. [Google Scholar] [CrossRef]
  23. Junker, B.; Buchecker, M. Aesthetic preferences versus ecological objectives in river restorations. Landsc. Urban Plan. 2008, 85, 141–154. [Google Scholar] [CrossRef]
  24. Flather, C.H.; Ken Cordell, H. Outdoor Recreation: Historical and Anticipated Trends. In Wildlife and Recreationists: Coexistence through Management and Research; Knight, R.L., Gutzwiller, K.J., Eds.; Island Press: Washington, DC, USA, 1995; pp. 3–17. [Google Scholar]
  25. Bennett, V.J.; Quinn, V.S.; Zollner, P.A. Exploring the implications of recreational disturbance on an endangered butterfly using a novel modelling approach. Biodivers. Conserv. 2013, 22, 1783–1798. [Google Scholar] [CrossRef]
  26. Huhta, E.; Sulkava, P. The Impact of Nature-Based Tourism on Bird Communities: A Case Study in Pallas-Yllastunturi National Park. Environ. Manag. 2014, 53, 1005–1014. [Google Scholar] [CrossRef] [PubMed]
  27. Kangas, K.; Luoto, M.; Ihantola, A.; Tomppo, E.; Siikamaki, P. Recreation-induced changes in boreal bird communities in protected areas. Ecol. Appl. 2010, 20, 1775–1786. [Google Scholar] [CrossRef] [PubMed]
  28. Pineiro, A.; Barja, I.; Silvan, G.; Illera, J.C. Effects of tourist pressure and reproduction on physiological stress response in wildcats: Management implications for species conservation. Wildl. Res. 2012, 39, 532–539. [Google Scholar] [CrossRef]
  29. Sarah, P.; Zhevelev, H.M. Effect of visitors’ pressure on soil and vegetation in several different micro-environments in urban parks in Tel Aviv. Landsc. Urban Plan. 2007, 83, 284–293. [Google Scholar] [CrossRef]
  30. Olive, N.D.; Marion, J.L. The influence of use-related, environmental, and managerial factors on soil loss from recreational trails. J. Environ. Manag. 2009, 90, 1483–1493. [Google Scholar] [CrossRef] [PubMed]
  31. Wood, D. Resolving the conflicts of the impacts of recreation on a waterway. In IWA Technical Restoration Handbook; Trust, C.R., Ed.; Canal & River Trust: Milton Keynes, UK, 2015; p. 14. [Google Scholar]
  32. Aberg, E.U.; Tapsell, S. Revisiting the River Skerne: The long-term social benefits of river rehabilitation. Landsc. Urban Plan. 2013, 113, 94–103. [Google Scholar] [CrossRef]
  33. Bessa, F.; Scapini, F.; Cabrini, T.M.B.; Cardoso, R.S. Behavioural responses of talitrid amphipods to recreational pressures on oceanic tropical beaches with contrasting extension. J. Exp. Mar. Biol. Ecol. 2017, 486, 170–177. [Google Scholar] [CrossRef]
  34. Riera, R.; Menci, C.; Sanabria-Fernandez, J.A.; Becerro, M.A. Do recreational activities affect coastal biodiversity? Estuar. Coast. Shelf Sci. 2016, 178, 129–136. [Google Scholar] [CrossRef]
  35. Hayes, C.T.; Baumbach, D.S.; Juma, D.; Dunbar, S.G. Impacts of recreational diving on hawksbill sea turtle (Eretmochelys imbricata) behaviour in a marine protected area. J. Sustain. Tour. 2017, 25, 79–95. [Google Scholar] [CrossRef]
  36. Pander, J.; Geist, J. Ecological indicators for stream restoration success. Ecol. Indic. 2013, 30, 106–118. [Google Scholar] [CrossRef]
  37. Bouleau, G.; Pont, D. Did you say reference conditions? Ecological and socio-economic perspectives on the European Water Framework Directive. Environ. Sci. Policy 2015, 47, 32–41. [Google Scholar] [CrossRef]
  38. Friberg, N.; Bonada, N.; Bradley, D.C.; Dunbar, M.J.; Edwards, F.K.; Grey, J.; Hayes, R.B.; Hildrew, A.G.; Lamouroux, N.; Trimmer, M.; et al. Biomonitoring of Human Impacts in Freshwater Ecosystems: The Goof, the Bad and the Ugly; Woodward, G.: Amsterdam, The Netherlands, 2011. [Google Scholar]
  39. Niemi, G.J.; McDonald, M.E. Application of ecological indicators. Annu. Rev. Ecol. Evol. Syst. 2004, 35, 89–111. [Google Scholar] [CrossRef]
  40. Chiari, S.; Muhar, S.; Muhar, A. Linking ecological and social aspects of river restoration. In Proceedings of the 4th International River Restoration Conference of the European Centre for River Restoration (ECRR), Venice, Italy, 16–21 June 2008. [Google Scholar]
  41. Rogers, K.; Biggs, H. Integrating indicators, endpoints and value systems in strategic management of rivers of the Kruger National Park. Freshw. Biol. 1999, 41, 439–451. [Google Scholar] [CrossRef]
  42. Boavida, I.; Santos, J.M.; Ferreira, T.; Pinheiro, A. Barbel habitat alterations due to hydropeaking. J. Hydro-Environ. Res. 2015, 9, 237–247. [Google Scholar] [CrossRef]
  43. Pisaturo, G.R.; Righetti, M.; Dumbser, M.; Noack, M.; Schneider, M.; Cavedon, V. The role of 3D-hydraulics in habitat modelling of hydropeaking events. Sci. Total Environ. 2017, 575, 219–230. [Google Scholar] [CrossRef] [PubMed]
  44. Holzapfel, P.; Leitner, P.; Habersack, H.; Graf, W.; Hauer, C. Evaluation of hydropeaking impacts on the food web in alpine streams based on modelling of fish- and macroinvertebrate habitats. Sci. Total Environ. 2017, 575, 1489–1502. [Google Scholar] [CrossRef] [PubMed]
  45. Im, D.; Kang, H.; Kim, K.-H.; Choi, S.-U. Changes of river morphology and physical fish habitat following weir removal. Ecol. Eng. 2011, 37, 883–892. [Google Scholar] [CrossRef]
  46. Shih, S.-S.; Lee, H.-Y.; Chen, C.-C. Model-based evaluations of spur dikes for fish habitat improvement: A case study of endemic species Varicorhinus barbatulus (Cyprinidae) and Hemimyzon formosanum (Homalopteridae) in Lanyang River, Taiwan. Ecol. Eng. 2008, 34, 127–136. [Google Scholar] [CrossRef]
  47. Lange, C.; Schneider, M.; Mutz, M.; Haustein, M.; Halle, M.; Seidel, M.; Sieker, H.; Wolter, C.; Hinkelmann, R. Model-based design for restoration of a small urban river. J. Hydro-Environ. Res. 2015, 9, 226–236. [Google Scholar] [CrossRef]
  48. Bovee, K.D. A Guide to Stream Habitat Analysis Using the Instream Flow Invremental Methodology; National Technical Information Service: Springfield, VA, USA, 1982; Volume 273.
  49. Jorde, K.; Schneider, M.; Zoellner, F. Analysis of instream habitat quality—Preference functions and fuzzy models. In Stochastic Hydraulics; Wang, Z., Hu, S., Eds.; CRC Press: Rotterdam, The Netherland, 2000; pp. 671–680. [Google Scholar]
  50. Schneider, M. Habitat- und Abflussmodellierung für Fließgewässer mit unscharfen Berechnungsansätzen. In Hydraulic Engineering; University of Stuttgart: Stuttgart, Germany, 2001; p. 158. [Google Scholar]
  51. Adriaenssens, V.; Baets, B.D.; Goethals, P.L.M.; Pauw, N.D. Fuzzy rule-based models for decision support in ecosystem management. Sci. Total Environ. 2004, 319, 1–12. [Google Scholar] [CrossRef]
  52. Mouton, A.M.; De Baets, B.; Goethals, P.L.M. Knowledge-based versus data-driven fuzzy habitat suitability models for river management. Environ. Model. Softw. 2009, 24, 982–993. [Google Scholar] [CrossRef]
  53. Boavida, I.; Dias, V.; Ferreira, M.T.; Santos, J.M. Univariate functions versus fuzzy logic: Implications for fish habitat modeling. Ecol. Eng. 2014, 71, 533–538. [Google Scholar] [CrossRef]
  54. Birk, S.; Bonne, W.; Borja, A.; Brucet, S.; Courrat, A.; Poikane, S.; Solimini, A.; van de Bund, W.; Zampoukas, N.; Hering, D. Three hundred ways to assess Europe’s surface waters: An almost complete overview of biological methods to implement the Water Framework Directive. Ecol. Indic. 2012, 18, 31–41. [Google Scholar] [CrossRef]
  55. Feld, C.K.; da Silva, P.M.; Sousa, J.P.; de Bello, F.; Bugter, R.; Grandin, U.; Hering, D.; Lavorel, S.; Mountford, O.; Pardo, I.; et al. Indicators of biodiversity and ecosystem services: A synthesis across ecosystems and spatial scales. Oikos 2009, 118, 1862–1871. [Google Scholar] [CrossRef]
  56. Mouton, A.; Schneider, M.; Depestele, J.; Goethals, P.; DePauw, N. Fish habitat modelling as a tool for river management. Ecol. Eng. 2007, 29, 305–315. [Google Scholar] [CrossRef]
  57. Mouton, A.M.; Schneider, M.; Peter, A.; Holzer, G.; Müller, R.; Goethals, P.L.M.; De Pauw, N. Optimisation of a fuzzy physical habitat model for spawning European grayling (Thymallus thymallus L.) in the Aare river (Thun, Switzerland). Ecol. Model. 2008, 215, 122–132. [Google Scholar] [CrossRef]
  58. Bagocius, D. Piling underwater noise impact on migrating salmon fish during Lithuanian LNG terminal construction (Curonian Lagoon, Eastern Baltic Sea Coast). Mar. Pollut. Bull. 2015, 92, 45–51. [Google Scholar] [CrossRef] [PubMed]
  59. Holt, D.E.; Johnston, C.E. Traffic noise masks acoustic signals of freshwater stream fish. Biol. Conserv. 2015, 187, 27–33. [Google Scholar] [CrossRef]
  60. Roberts, L.; Cheesman, S.; Hawkins, A.D. Effects of Sound on the Behavior of Wild, Unrestrained Fish Schools. In Effects of Noise on Aquatic Life; Popper, A.N., Hawkins, A., Eds.; Springer: Berlin, Germnay, 2016; pp. 917–924. [Google Scholar]
  61. Nedelec, S.L.; Simpson, S.D.; Morley, E.L.; Nedelec, B.; Radford, A.N. Impacts of regular and random noise on the behaviour, growth and development of larval Atlantic cod (Gadus morhua). Proc. R. Soc. B Biol. Sci. 2015, 282, 7. [Google Scholar] [CrossRef] [PubMed]
  62. Laub, B.G.; Baker, D.W.; Bledsoe, B.P.; Palmer, M.A. Range of variability of channel complexity in urban, restored and forested reference streams. Freshw. Biol. 2012, 57, 1076–1095. [Google Scholar] [CrossRef]
  63. Pottgiesser, T.; Rehfeld-Klein, M. Gewässerentwicklungskonzept für ein urbanes Gewässer zur Zielerreichung der Wasserrahmenrichtlinie—Das Pilotprojekt Panke in Berlin. Limnol. Aktuell 2011, 13, 59–81. [Google Scholar]
  64. Kottelat, M.; Freyhof, J. Handbook of European Freshwater Fishes; Publications Kottelat, Cornol and Freyhof: Berlin, Germnay, 2007. [Google Scholar]
  65. Reinartz, R. Untersuchungen zur Gefährdungssituation der Fishart Nase (Chondrostoma nasus L.) in bayerischen gewäsern. In Institut für Tierwissenschaften; Technical University of Munich: Munich, Germnay, 1997; p. 379. [Google Scholar]
  66. Pander, J.; Mueller, M.; Geist, J. Succession of fish diversity after reconnecting a large floodplain to the upper Danube River. Ecol. Eng. 2015, 75, 41–50. [Google Scholar] [CrossRef]
  67. Bruslé, J.; Quignard, J.-P. Biologie des Poissons D’eau Douce Européens; Lavoisier Tec & Doc: Cachan, France, 2001. [Google Scholar]
  68. Hauer, C.; Unfer, G.; Schmutz, S.; Habersack, H. Morphodynamic effects on the habitat of juvenile cyprinids (Chondrostoma nasus) in a restored Austrian lowland river. Environ. Manag. 2008, 42, 279–296. [Google Scholar] [CrossRef] [PubMed]
  69. Hennel, R. Untersuchungen zur Bestandssituation der Fischfauna der Mittleren Isar; TU Munich: Munich, Germany, 1991; p. 222. [Google Scholar]
  70. Keckeis, H.; Winkler, G.; Flore, L.; Reckendorfer, W.; Schiemer, F. Spatial and seasonal characteristics of O+ fish nursery habitats of nase, Chondrostoma nasus in the River Danube, Austria. Folia Zool. 1997, 46, 133–150. [Google Scholar]
  71. Keith, P.; Persat, H.; Feunteun, E.; Allardi, J. Les Poissons D’eau Douce en France; Publication Scientifique du Musée: Paris, France, 2011. [Google Scholar]
  72. Lelek, A.; Peñáz, M. Spawning of Chondrostoma nasus (L.) in the Brumovka River. Folia Zool. 1963, 12, 121–134. [Google Scholar]
  73. Maier, K.J. On the nase, Chondrostoma nasus spawning area situation in Switzerland. Folia Zool. 1997, 46, 79–88. [Google Scholar]
  74. Żarski, D.; Targońska, K.; Ratajski, S.; Kaczkowski, Z.; Kucharczy, D. Reproduction of Nase, Chondrostoma Nasus (L.), Under Controlled Conditions. Arch. Pol. Fish. 2008, 16, 355–362. [Google Scholar]
  75. Freyhof, J. Chondrostoma nasus. In The IUCN Red List of Threatened Species 2011; IUCN: Gland VD, Switzerland, 2011. [Google Scholar]
  76. European Commission (EC). Convention on the Conservation of European Wildlife and Natural Habitats; European Commission (EC): Brussel, Belgium, 1979. [Google Scholar]
  77. Schubert, M.; Klein, M.; Leuner, E.; Kraus, G.; Wendt, P.; Born, O.; Hoch, J.; Ring, T.; Silkenat, W.; Speierl, T.; et al. Fischzustandsbericht 2012; LfL-Information: Freising, Germnay, 2012; Volume 54. [Google Scholar]
  78. Chovanec, A.; Schiemer, F.; Waidbacher, H.; Spolwind, R. Rehabilitation of a Heavily Modified River Section of the Danube in Vienna (Austria): Biological Assessment of Landscape Linkages on Different Scales. Int. Rev. Hydrobiol. 2002, 87, 183–195. [Google Scholar] [CrossRef]
  79. Dung, N.V.; Merz, B.; Bárdossy, A.; Thang, T.D.; Apel, H. Multi-objective automatic calibration of hydrodynamic models utilizing inundation maps and gauge data. Hydrol. Earth Syst. Sci. 2011, 15, 1339–1354. [Google Scholar] [CrossRef] [Green Version]
  80. Stalnaker, C.B.; Lamb, B.L.; Henriksen, J.; Bovee, K.; Bartholow, J. The Instream Flow Incremental Methodology: A Primer for IFIM; National Biological Service Midcontinent Ecological Science Center: Fort Collins, CO, USA, 1995; pp. 1–53.
  81. Lupp, G.; Förster, B.; Kantelberg, V.; Markmann, T.; Naumann, J.; Honert, C.; Koch, M.; Pauleit, S. Assessing the Recreation Value of Urban Woodland Using the Ecosystem Service Approach in Two Forests in the Munich Metropolitan Region. Sustainability 2016, 8, 1156. [Google Scholar] [CrossRef]
  82. Clivaz, C.; Rupf, R.; Siegrist, D. VISIMAN: Beiträge zu Besuchermonitoring und Besuchermanagement in Pärken und Naturnahen Erholungsgebieten; HSR Hochschule für Technik Rapperswil: Rapperswil, Switzerland, 2013. [Google Scholar]
  83. Rupf, R.; Wernli, M. Besuchermonitoring—Ein überblick über methoden und anwendungsbereiche. In VISIMAN. Beiträge zu Besuchermonitoring und Besuchermanagement in Pärken und Naturnahen Erholungsgebieten; Clivaz, C., Rupf, R., Siegrist, D., Eds.; HSR Hochschule für Technik Rapperswil: Rapperswil, Switzerland, 2013; pp. 27–36. [Google Scholar]
  84. Zingraff-Hamed, A. Comment articuler les enjeux écologiques et paysagers dans le projet urbain de réaménagement des zones fluviales urbaines ? Étude de cas Munich et Angers. In Éco-Ingénieurie des Zones Humides, Biodiversité et Bioindicateurs; Université d’Angers, Agrocampus Ouest, Fachhoschule Weihenstephan Triesdorf: Angers, France, 2011; p. 347. [Google Scholar]
  85. Eagles, P.F.; McCool, S.F. Tourism in National Parks and Protected Areas—Planning and Management; CABI Publishing: Oxon, NY, USA, 2002. [Google Scholar]
  86. Heggenes, J.; Traaen, T. Downstream migration and critical water velocities in stream channels for fry of four salmonid species. J. Fish. Biol. 1988, 32, 717–727. [Google Scholar] [CrossRef]
  87. Jorde, K. Ökologisch Begründete, Dynamische Mindestwasserregelungen bei Ausleitungskraftwerken; University of Stuttgart: Stuttgart, Germany, 1996. [Google Scholar]
  88. Salski, A. Fuzzy-Sets-Anwendungen in der Umweltforschung. In Fuzzy Logic: Theorie und Praxis, 3. Dortmunder Fuzzy-Tage Dortmund, 7–9 Juni 1993; Reusch, B., Ed.; Springer: Berlin/Heidelberg, Germany, 1993; pp. 13–21. [Google Scholar]
  89. Goeller, B.; Wolter, C. Performance of bottom ramps to mitigate gravel habitat bottlenecks in a channelized lowland river. Restor. Ecol. 2015, 23, 595–606. [Google Scholar] [CrossRef]
  90. Sterl, P.; Brandenburg, C.; Arnberger, A. Visitors’ awareness and assessment of recreational disturbance of wildlife in the Donau-Auen National Park. J. Nat. Conserv. 2008, 16, 135–145. [Google Scholar] [CrossRef]
  91. Manfredo, M.J.; Vaske, J.J.; Decker, D.J. Human Dimensions of Wildlife Management: Basic Concepts. In Wildlife and Recreationists: Coexistence through Management and Research; Knight, R.L., Gutzwiller, K.J., Eds.; Island Press: Washington, DC, USA, 1995; pp. 17–33. [Google Scholar]
  92. Cottet, M.; Piégay, H.; Bornette, G. Does human perception of wetland aesthetics and healthiness relate to ecological functioning? J. Environ. Manag. 2013, 128, 1012–1022. [Google Scholar] [CrossRef] [PubMed]
  93. Bulut, Z.; Karahan, F.; Sezen, I. Determining visual beauties of natural waterscapes: A case study for Tortum Valley (Erzurum/Turkey). Sci. Res. Essays 2010, 5, 170–182. [Google Scholar]
  94. Bulut, Z.; Yilmaz, H. Determination of landscape beauties through visual quality assessment method: A case study for Kemaliye (Erzincan/Turkey). Environ. Monit. Assess. 2008, 141, 121–129. [Google Scholar] [CrossRef] [PubMed]
  95. Bulut, Z.; Yilmaz, H. Determination of waterscape beauties through visual quality assessment method. Environ. Monit. Assess. 2009, 154, 459–468. [Google Scholar] [CrossRef] [PubMed]
  96. Morgan, M.; Messenger, B. Using an Activity and Place-Based Typology to Explain Visitor Motivations. J. For. 2009, 107, 44–49. [Google Scholar]
  97. Feio, M.J.; Calapez, A.R.; Elias, C.L.; Cortes, R.M.V.; Grata, M.A.S.; Pinto, P.; Almeida, S.F.P. The paradox of expert judgment in rivers ecological monitoring. J. Environ. Manag. 2016, 184, 609–616. [Google Scholar] [CrossRef] [PubMed]
Figure 1. Locations of Munich, of the study area, and of the reference site for the habitat suitability model.
Sustainability 10 01747 g001
Figure 2. Discharges of the Isar River in Munich recorded at the gauging station inside the study area (a) in 1999 and (b) between 1999 and 2006 by the Bavarian Water Agency. HQ100, HQ10, and HQ1: 100-, 10-year, and 1-year maximum discharge; MQ: mean discharge; NQ: minimum discharge.
Sustainability 10 01747 g002
Figure 3. Photograph of the restored Isar River section in Munich (Aude Zingraff-Hamed in August 2015).
Sustainability 10 01747 g003
Figure 4. Localization and photograph of the cited site of importance at the restored Isar River section in Munich (Photograph took by Aude Zingraff-Hamed in March 2013).
Sustainability 10 01747 g004
Figure 5. Lifecycle of Chondrostoma nasus L. and related habitats.
Sustainability 10 01747 g005
Figure 6. Grid design used for the substratum and user surveys.
Sustainability 10 01747 g006
Figure 7. Mapping of the (a) Velocity and of the (b) Water Depth at mean annual discharge (displaying 3.5 kilometers of the 8 kilometers of the restored river section including the Flaucher).
Sustainability 10 01747 g007
Figure 8. User numbers on two emerged gravel bars (100-m long and 20-m wide) during a sunny nonworking day in June at two sites: (A) in the north of the study area (48°7′37.85″ N, 11°34′40.15″ E) and (B) in the south of the study area (48°4′45.07″ N, 11°32′29.25″ E).
Sustainability 10 01747 g008
Figure 9. Habitat suitability map of the Reference site for (a) adults during summer, (b) adults during winter, (c) juveniles, (d) adults during the pre-reproduction period, (e) larvae, and (f) spawning adults at mean annual discharge.
Sustainability 10 01747 g009
Figure 10. WUAs: (a) for spawning adults, (b) for larvae, (c) for juveniles, (d) for adults during winter, (e) for adults during the pre-reproduction period, and (f) for adults during summer and autumn. Flow acronyms defined in Section 3.3.2.
Sustainability 10 01747 g010
Figure 11. Habitat suitability map of the Flaucher site for (a) adults during summer, (b) adults during winter, (c) juveniles, (d) adults during the pre-reproduction period, (e) larvae, and (f) spawning adults at annual mean discharge.
Sustainability 10 01747 g011
Figure 12. Plot of user numbers inside the whole study area on the 10 investigated days highlighting the number of swimmers.
Sustainability 10 01747 g012
Figure 13. User density map of the Isar River in Munich indicating on the eastern side spots with high to very high user densities separated by long stretches with very low user densities, and on the western side, mostly very low user densities (categories are as defined in Table 2).
Sustainability 10 01747 g013
Figure 14. Weighted usable area (WUA) in square meters of the restored river stretch at annual mean discharge for the six habitats of Chondrostoma nasus L. with and without the inclusion of recreational pressure.
Sustainability 10 01747 g014
Figure 15. Habitat suitability map for juveniles of Chondrostoma nasus at mean annual discharge considering or ignoring recreational pressure in the case of (a) the Flaucher area, (b) Willow Island, and (c) the area near the Großhesseloher Bridge (HSI = Habitat Suitability Index).
Sustainability 10 01747 g015
Table 1. List of habitats associated with lifecycle stages of Chondrostoma nasus (L.) described in terms of their physical characteristics.
Habitat NumberLifecycle StageSeasonWater Velocity
(in m/s)
Water Depth
(in cm)
Substratum
1Adults spawningSpringHigh
(1.0 to 1.5)
Moderate
(20 to 40)
Gravel bars
2LarvaeSpringLow
(0.5 to 0.7)
Low
(5 to 10)
Fine-grained substratum
3JuvenilesAllVery low
(under 0.6)
Low
(5 to 20)
Coarse substratum
4AdultsWinterHigh
(1.0 to 1.5)
High
(100 to 200)
Variable substratum
5Adults
(pre-reproduction)
SpringLow to very low
(less than 0.7)
Moderate
(20 to 40)
Medium gravel to large stones
6Adults Summer and AutumnModerate to high
(0.7 to 1.5)
Moderate
(20 to 50)
Rock to gravel
Table 2. List of variables used for the fuzzy sets.
VariableLinguistic CategoryQuantitative Fuzzy Meaning of the Physical Property
Water depthvery low0 to 0.1 m (±5 cm)
low0.1 m (±5 cm) to 0.2 m (±5 cm)
medium0.2 m ±5 cm) to 0.5 m (±10 cm)
high0.5 m (±10 cm) to 1.15 m (±25 cm)
very highAbove 1.25 m (±25 cm)
Velocityvery low0 to 0.4 m/s (±0.1 m/s)
low0.5 m/s (±0.1 m/s) to 0.7 m/s (±0.1 m/s)
medium0.75 m/s (±0.1 m/s) to 0.9 m/s (±0.1 m/s)
high1 m/s (±0.15 m/s) to 1.5 m/s (±0.25 m/s)
very highAbove 1.75 m/s (±0.25 m/s)
Substratum grain sizelowOrganic material, detritus, silt, clay, loam, sand (<6 mm)
mediumGravel from 6 mm to 12 cm
highLarge stones (12–20 cm)
very highBoulders (>20 cm), rock
User pressure
(per 10-m long section)
very lowNo users
lowOne user on the riverbank and no users in/on the water
mediumTwo or more users on the riverbank or one user in/on the water
highOne user in/on the water and >1 users on the riverbank
very highMore than two users in the water and more than two users on the riverbank
HSIVery low<0.1
Low[0.1 to 0.3]
Medium[0.3 to 0.6]
High[0.6 to 0.9]
Very high>0.9
Table 3. Example of a fuzzy rule set describing the habitat requirements of Chondrostoma nasus (L.) for adult fish in the Isar River during summer. (Full Table S1).
VelocityDepthSubstrateRecreational User PressureHabitat Suitability Index (HSI)Example
VHVHVHVHVLRule 1: IF all input variables “Very high” THEN HSI “Very low”
VHHLMHRule 2: IF velocity “Very high” AND depth “High” AND substratum “Low” AND recreational pressure “Medium” THEN HSI “High”
HHLLVHRule 3: IF velocity “High” AND depth “High” AND substratum “Low” AND recreational pressure “Low” THEN HSI “Very high”
VLMVHMLRule 4: IF velocity “Very low” AND depth “Medium” AND substratum “Very high” AND recreational pressure “Medium” THEN HSI “Low”
VL = very low; L = low; M = medium; H = high; and VH = very high.
Table 4. Wetted area and relative percent of the wetted area with not suitable (HIS < 0.1), low suitability (HSI between 0.1 and 0.3), medium suitability (HSI between 0.3 and 0.6), and high suitability (HIS > 0.6) at mean annual discharge. Table S2 presents all the scenarios.
Lifecycle StageIndicatorsSuitability
Not SuitableLowMediumHigh
Adults SpawningWetted area (m²)559,100697513,35016,000
% of the wetted area94123
LarvaeWetted area (m²)481,40020,55086,3507125
% of the wetted area813141
JuvenilesWetted area (m²)245,425412520,300325,575
% of the wetted area411355
Adults in WinterWetted area (m²)506,35016,72536,42535,925
% of the wetted area85366
Adults (pre-reproduction)Wetted area (m²)354,12512,22521,350207,725
% of the wetted area592435
Adults in Summer and AutumnWetted area (m²)412,37528,15083,87571,025
% of the wetted area6951412
Table 5. Weighted Usable Area (WUA), Hydraulic Habitat Suitability index (HHS), and Mean Habitat Suitability Index (mean HSI) value for each habitat and scenarios MNQ (mean low discharge), MQ (mean annual discharge), and HQ (Annual mean maximum discharge), with and without users. Table S3 presents all the scenarios.
DischargesScenarios
Without UserWith User
NQMQHQNQMQHQ
Adults spawningWUA (1000 m²)273218212412
HHS0.030.030.010.030.030.01
Mean HSI0.00.00.00.00.10.0
LarvaeWUA (1000 m²)593326513031
HHS0.070.040.020.060.030.02
Mean HSI0.00.10.00.10.10.0
JuvenilesWUA (1000 m²)330269145291232167
HHS0.410.280.100.360.240.12
Mean HSI0.50.50.20.40.30.2
Adults in WinterWUA (1000 m²)10018319994170176
HHS0.120.190.140.120.180.13
Mean HSI0.30.40.30.10.20.2
Adults Pre-reproductionWUA (1000 m²)248178145243176183
HHS0.300.190.110.300.190.13
Mean HSI0.40.30.20.20.20.1
Adults in Summer and AutumnWUA (1000 m²)167238195156217173
HHS0.210.250.140.190.220.13
Mean HSI0.30.30.20.20.40.3

