Article

Exploring the Interactive Development between Population Urbanization and Land Urbanization: Evidence from Chongqing, China (1998–2016)

School of Construction Management and Real Estate, Chongqing University, Chongqing 400045, China
*
Author to whom correspondence should be addressed.
Sustainability 2018, 10(6), 1741; https://doi.org/10.3390/su10061741
Submission received: 2 April 2018 / Revised: 6 May 2018 / Accepted: 24 May 2018 / Published: 25 May 2018
(This article belongs to the Section Sustainable Urban and Rural Development)

Abstract

:
To promote regional sustainable urbanization strategies, this paper selected the population and land resources in the urbanization system, and used the time series-based econometric analysis method and the coordinated development degree model to empirically study the interactive relationship between population urbanization (PU) and land urbanization (LU) in Chongqing, China, from 1998 to 2016. The research results showed that: (1) The development of urbanization in Chongqing was relatively rapid, but the level of development was relatively insufficient. The phenomenon of population outflow during urban development was more serious, and the structure of land use irrational; (2) There was a long-term cointegration relationship between PU and LU; PU is the Granger cause of LU. A PU increase of 1% in the short-term will promote LU by 3.29%, and in the long-term will promote 2.28%; the contribution of population agglomeration to urbanization is more than 80%, while land expansion is only about 20%, and the urban development model, which relies on urban land expansion is not applicable; (3) LU was faster than PU, but the improvement of PU development’s quality level was greater than that of LU. The development quality of both systems increased year by year, and gradually developed into a coordinated state. It is recommended that the government strengthen land planning, delineate urban growth boundaries, and increase the level of land intensive use; furthermore, through the reformation of the land finance and the household registration systems, a system for linking population, finance, and construction land should be established to promote the coordinated development of the two systems.

1. Introduction

Urbanization has received increasing attention from governments worldwide, as it is a crucial prerequisite to global economic development, the eradication of extreme poverty, reversal of unsustainable growth, and protection of the natural environment [1,2,3,4,5]. Since the reform and opening up, along with an acceleration in the process of industrialization, China’s urbanization has experienced a low and rapid development process. By the end of 2016, the permanent population in urban areas increased from 170 million in 1978 to 790 million, and the urbanization rate increased from 17.9% to 57.4%—an average annual increase of 1.04%; the number of cities increased from 193 to 659, and the number of established towns increased from 2173 to 20,883 [6]. According to Northam’s three-stage theory of urbanization [7], China is currently in a stage of rapid urbanization [8]. The development of urbanization is the result of the flow and agglomeration of factors, of which the flow of population is the core [9]. A large number of rural populations have flowed into the cities, which has brought sufficient labor for the industrialization of the city, and also increased the burden on urban construction land. The problem of extensive land use and low efficiency in the current urbanization drive in China is prominent [10], and the contradiction between the growing demand for construction land and the scarcity of land resources will be the main contradiction to constrain the sustainable development of cities in the future [11]. If the new era is to achieve a steady improvement in the level and quality of urbanization in China, which is a more optimized urbanization pattern [12], and promote a win–win situation of urbanization and sustainability [13], then a comprehensive and profound understanding of the interactive development relationship between population urbanization (PU) and land urbanization (LU) is needed.
Focusing on sustainable urbanization, scholars at home and abroad have undertaken much research. In the area of PU, research has mainly been focused on the driving factors of urbanization [14,15,16], the mode of development [17,18], the difference of spatial distribution [19,20], and the influence of rapid urbanization on the environment [21,22,23]. In the area of LU, it has mainly been focused on the study of the urban spatial expansion mechanism, including the driving factors of urban expansion [24,25,26], the type of expansion [27,28], measurements, and policy regulation [29,30,31], etc. For example, Li et al. [32] constructed binary logistic regression and combined multitemporal images to study the drivers of urban expansion, where their studies showed that physical, socioeconomic, and neighborhood factors worked simultaneously, and that physical and neighborhood factors decreased with increasing urbanization, and socioeconomic factors increased with increasing urbanization. In addition, the influence of LU, which is the main form of urban sprawl on land ecological function and environment [33,34], on land use [35,36,37] has also been widely studied by scholars. Therefore, the concept of sustainable urbanization [4,5,38,39,40] has been put forward, and study into the relationship between PU and LU has become the focus of academia.
With regard to the study on PU and LU, scholars at home and abroad have mainly focused on the development coordination between PU and LU. In the comparison of the development speed [41,42,43,44] and the evaluation of coordination [45,46], remote sensing images, geographic information system technology, and coupled coordination analysis have been widely used in the research methods. For example, Min and Hu built a coordination degree model to evaluate the relationship between PU and LU in Hubei Province from 1998 to 2008, where the results showed that the development of population–land integration in Hubei Province was poor, and the degree of coordination showed a downward trend with significant fluctuation characteristics [46]. Lin et al. used the data of 656 cities in China for the past ten years to construct the conceptual framework and calculation method for the number and speed of LU processes, and the results showed that LU was faster than PU [43]. This was consistent with the conclusions reported in the National New Urbanization Plan (2014–2020) [12], released by the State Council Development and Reform Commission.
To sum up, the research progress of PU and LU in comprehensive development, domestic and foreign scholars have achieved fruitful results, but the existing research content is still insufficient. This is mainly reflected in the research on the interactive development relationship between PU and LU. The two systems play a common role in promoting sustainable urbanization, and the interaction between them will have an effect of 1 + 1 > 2. The study of both should be carried out in a higher system dimension. We should not only pay attention to the speed and coordination of the development of the system, but also explore the mutual influence mechanism and the cause of the imbalance. Furthermore, the existing research has mainly focused on the whole national level, less at the provincial level, especially the provinces or cities in Western China.
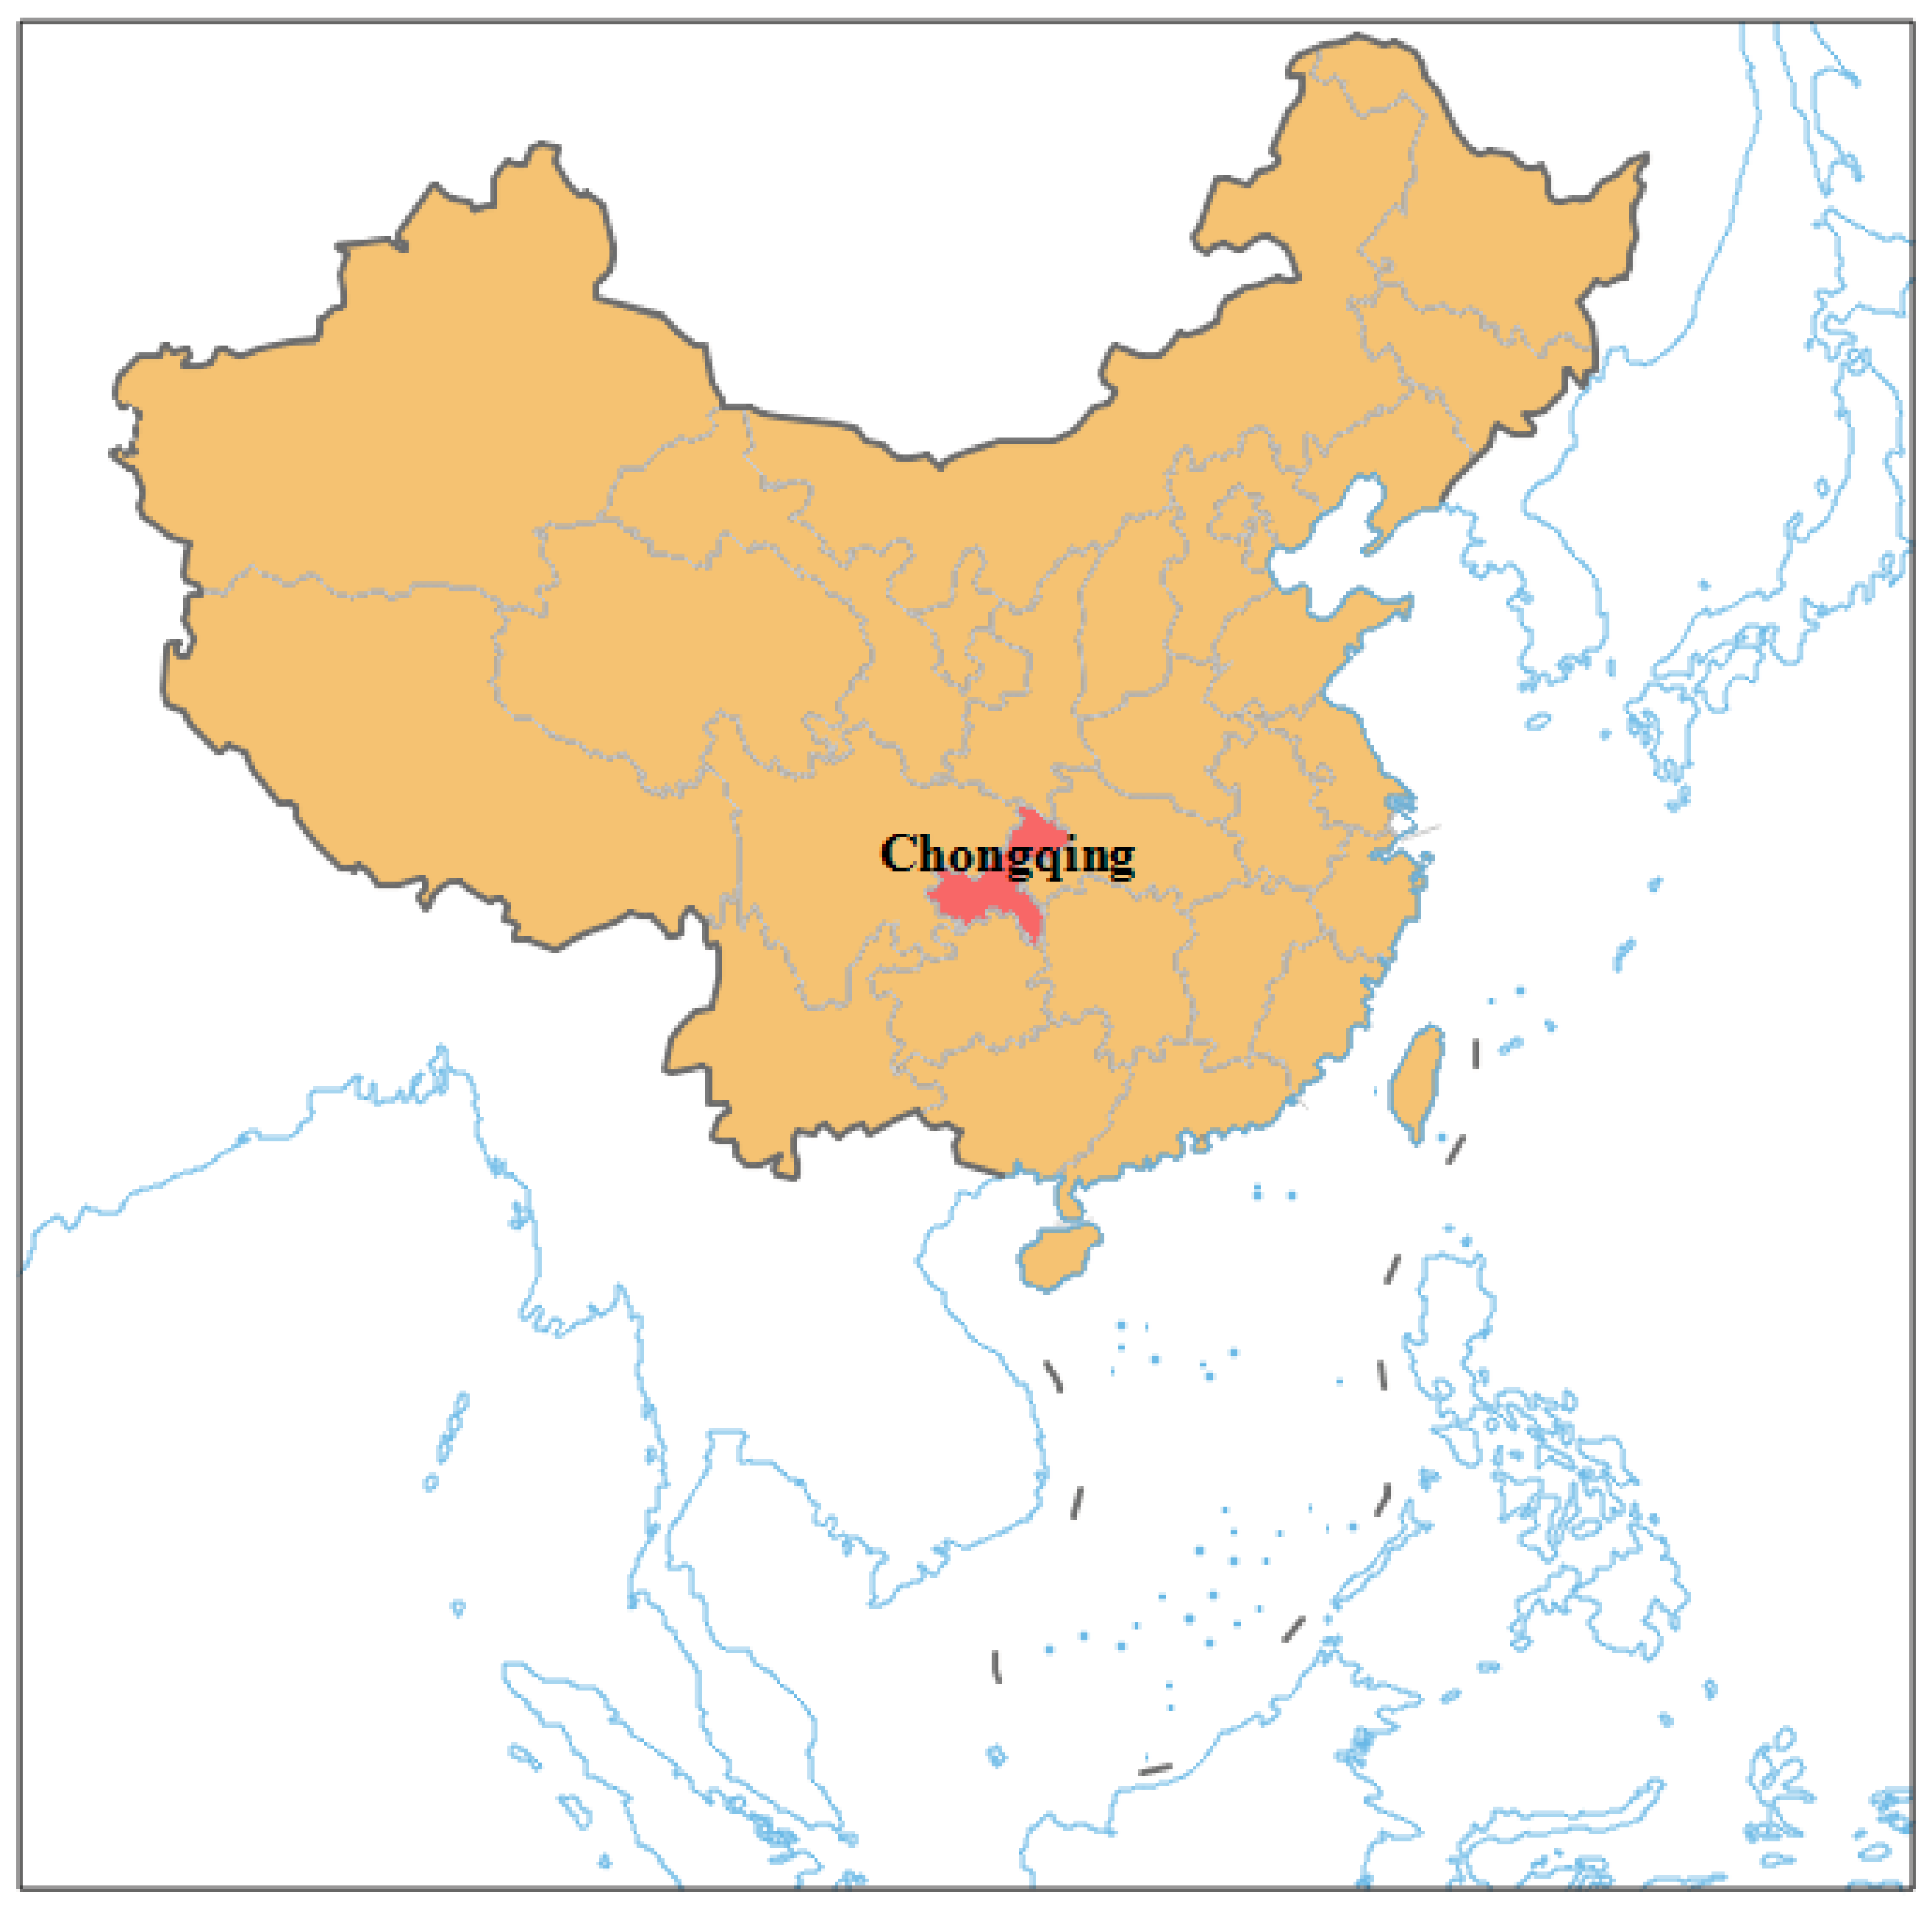
Chongqing is located in Southwest China (Figure 1), and is the youngest municipality in China. As a typical mountain city, the mountainous area of Chongqing’s main urban area is 2250 km2, accounting for 41.09%; the hilly area is 2739 km2, accounting for 50.03%; flatland area is 368 km2, accounting for only 6.7%. Furthermore, under the rigid constraints of the country’s three basic systems (land in the cities is owned by the state and land in the rural area is owned by rural collective; land-use regulation system; land annual planning system), Chongqing’s construction land and agricultural land are particularly valuable. Based on the phenomenon of the prominent characteristics of urban–rural dual structure and the coexistence of “big cities and large rural areas”, the state set up the pilot area of integrated urban and rural comprehensive reform in 2007, and actively supported the special reform in Chongqing. With an important strategic position, Chongqing has gradually emerged as a distinctive “Chongqing model” under the backdrop of more people and less land. In terms of land use, the “Land Ticket Model” (2008) was adopted to reclamation idle construction land in rural areas into arable land and generated land indicators for urban construction [47]. As of May 2016, 118 km2 of land has been traded since the implementation of the “Land Ticket System”, which increased the supply of land to Chongqing by 14% each year, fundamentally solving the problem of insufficient urban construction land. In order to promote PU, Chongqing has given priority to the reform of household registration (2010) and gradually relaxed the restriction of rural population to settle in cities. Based on the difference of regional economic development level, resource endowment, and population carrying capacity, Chongqing divided the city into urban functional core area, urban functional expansion area, urban development new zone, northeast Chongqing ecological conservation development zone, southeast Chongqing ecological protection development area, five functional areas in 2013, for differential development of various functional areas to promote the development and construction of Chongqing metropolitan area. The unique development model promoted rapid economic growth in Chongqing. From 2002 onwards, Chongqing’s GDP growth has remained above 10%. The urban development model of Chongqing has aroused the attention of more and more scholars [48,49]. This paper used Chongqing as an example to analyze the interaction between PU and LU on the basis of analyzing the progress of urbanization, since its direct jurisdiction. It further analyzed and evaluated the interactive relationship between the two from the aspects of development speed and quality coordination. Corresponding policy suggestions were put forward for the coordinated development of population and land in the process of the sustainable urbanization of Chongqing.
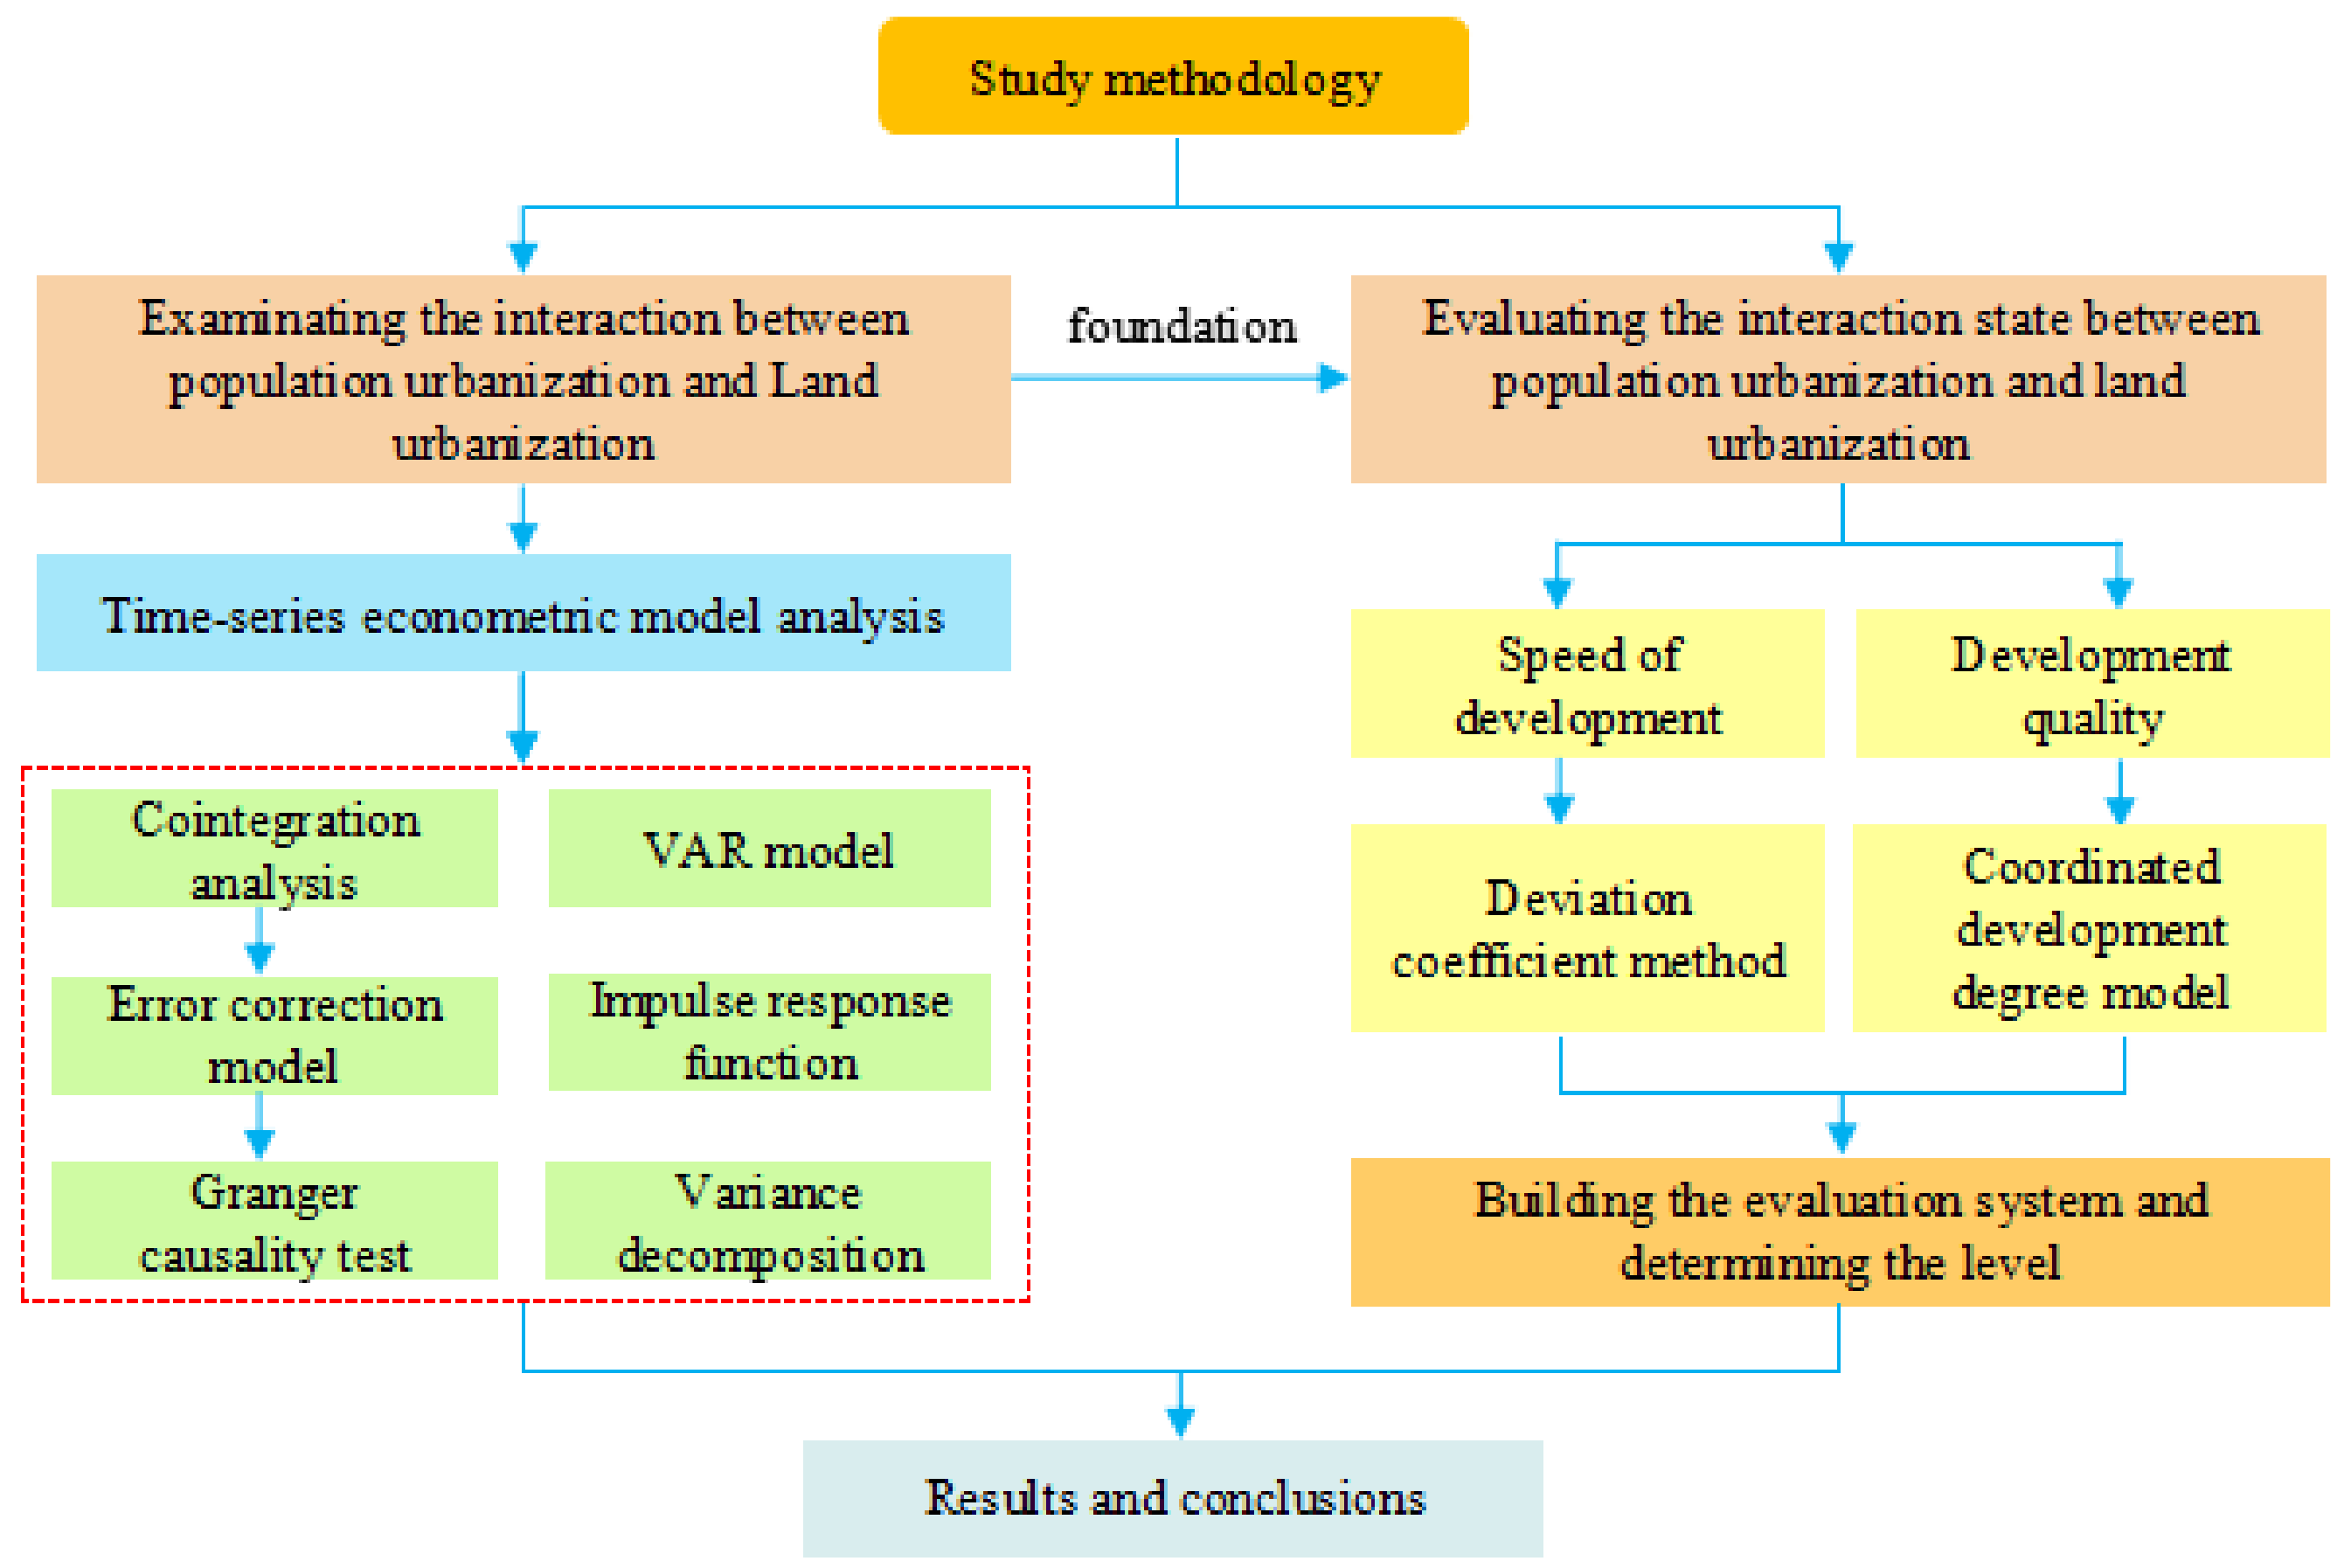
The rest of the paper is organized as follows. Section 2 is the definition of the basic concept and the construction of the theoretical model of the PU and LU interactive relationship. Section 3 introduces the present situation of the research area first, then introduces the research methods, variable selection, and the data sources of empirical research. Section 4 shows the results of the time series econometric model and interactive state evaluation; and Section 5 is the discussion and analysis of the research results. Section 6 introduces the research conclusions of this paper, puts forward the corresponding policy suggestion, and points out the next challenge and the brief thought of further research.

2. Concept Definition and Theoretical Model Construction

2.1. Concept Definition

Population urbanization (PU): PU is the process that rural people gather in cities and live, work, and integrate in cities. In terms of quantity, it shows that the proportion of urban population is rising, which is expressed as an urbanization rate [50]; while in terms of quality, it shows the changes in the structure of the population’s employment, and the process of improving the population quality and living standards [51].
Land urbanization (LU): LU is the transformation of rural construction land and agricultural land into urban construction land in the process of urbanization [52]. In terms of quantity, it refers mainly to the expansion of urban space scale, which is represented by the urban built-up area [53]; while in terms of quality, it covers more intensive land use, higher levels of land input, increased output [54,55], and continued use of land.

2.2. Theoretical Model Construction

Population and land are the two subsystems of urbanization. Urbanization development is the result of the coordination and exchange of material energy between and within the various subsystems. From a quantitative perspective, the role of LU in promoting PU is mainly through two approaches. First, the city expands to the periphery around the urban area to increase the construction land. Specific methods include setting up development zones [56], redrawing or reorganizing administrative boundaries to expand urban boundaries [57]; second, the original rural settlements continue to expand into towns [58]. Through these two approaches, the nature of the land changes from rural collective land to urban construction land. The original villagers on the corresponding land also transform from the rural residents into urban residents. The PU’s effect on LU mainly reflects the rapid industrialization accompanied by the rapid growth of urban population [59]; when the scale of the existing land in the city makes it difficult to meet its bearing capacity, the city expands on the periphery to obtain land for urban development [60].
From the perspective of quality, changes in the structure and level of land use would result in the loss of traditional livelihoods of indigenous farmers [60], which may change the structure of the population’s employment. The level of land input and output reflects the value of the city to a certain extent, which will indirectly affect the urban population size and population structure. In turn, due to the growth of the urban population, the increased demand for new people in terms of living and production has put forward new requirements for the use and scale of urban land [61,62]. This requires the use of land to increase the level of intensive use of all types of land to accommodate more urban population, making urban land use more reasonable [51,52]. The differences in population structure and living standards also make people have differences in the level of land input, output, and land use structure.
In a word, PU and LU are closely related. The research of the interaction between the two is not only from the quantitative point of view, but also from the perspective of quality in the context of sustainable urbanization. Only the coordinated development of the two can promote the sustainable development of urban economy, society and environment, and then promote the level of urbanization.

3. Methodology

3.1. Current Situation of the Study Area

3.1.1. The Current Situation of PU

With the increase of the total population in Chongqing, its PU has also rapidly advanced (Figure 2). The urbanization rate of the resident population increased from 32.6% at the start of the municipality to 62.6% in 2016, an increase of 30%. Meanwhile, the urbanization rate of the whole country increased by 27%. Judging from the trend of urbanization rate, the growth rate of urbanization in the early period of the municipality directly under the Central Government was relatively large. It was relatively stable in the later period, and the growth rate of urbanization slowed down. According to Northam’s three-stage theory of urbanization development [7], Chongqing is currently in a period of rapid urbanization.
In the process of rapid PU, Chongqing also embodies the following distinctive features: (1) From the level of urbanization, the urbanization rate of the Chongqing resident population was 62.6% in 2016, while the population of household registration was only 47.62%. When horizontally compared to other municipalities, the urbanization rate of Tianjin’s permanent population was 82.93%, while in Beijing, it was 86.5%, and 87.9% in Shanghai, which showed that the level of urbanization in Chongqing was relatively low; (2) Since Chongqing municipality was directly under the Central Government, the number of household registrations in each calendar year has become greater than the permanent population, and the population outflow was greater than the population inflow, but the outflow of population had a decreasing trend; (3) Judging by the employment structure, Chongqing still shows that the proportion of employment in the primary industry is too large, and that the secondary and tertiary industries do not adequately absorb the labor force. This is also the main reason for restricting the PU of Chongqing.

3.1.2. The Current Situation of LU

The rapid development of the Chongqing economy has led to the demand of land resources and the change of urban space during the research period. The urban built-up area has rapidly increased from 406.89 km2 in 1998 to 1494.47 km2 in 2016, which is an increase of 2.67 times in 19 years. While the area of urban built-up areas has increased, the land use efficiency has also gradually increased. In 1998, the GDP per unit area of output was 393.81 yuan/m2, which increased to 1174.85 yuan/m2 in 2016 (Figure 3).
While the area of urban built-up areas has expanded, the structure of land use in Chongqing has also changed. In 2016, residential land accounted for the largest proportion, accounting for 32%, followed by industrial land (20%), while land for public management and facility use and commercial service facilities was obviously insufficient. This also reflects the fact that Chongqing has played a major role in the process of urbanization in secondary industries. The development of secondary industries took up a large amount of cultivated land and promoted the expansion of urban construction land; at the same time as land expansion, there was still the problem of secondary utilization, which accelerated the process of urbanization to some extent.

3.2. Methods

To empirically test the interactive development relationship between Chongqing’s PU and LU and to evaluate the interaction between the two, first, the time series econometric model was used to analyze the relationship between land use and population development in the short- and long-term, and the influence degree. The methods included cointegration analysis, error correction model (ECM), the Granger causality test, and impulse response function and variance decomposition based on the vector autoregression model ( V A R ). The above methods are often used in macroeconomic analysis to examine the relationship between variables. Its limitation is only from the time dimension, but ignores the effect of space factor.
Second, to evaluate the interaction between PU and LU, this paper used the deviation coefficient method to evaluate the development speed coordination of the two. The indicator system was further constructed, and the entropy weight method was used to evaluate the quality of the two, while the coordination development degree model was used to evaluate the coordination of the development between the PU system and the LU system during the research period (Figure 4).

3.2.1. Time Series Econometric Model

  • Cointegration analysis
The cointegration test determines whether there is a long-term stable equilibrium relationship between two variables. The main definition is as follows: if time series Y 1 t , Y 2 t , , Y n t are all d-order, i.e., I ( d ) , vector = ( 1 , 2 , , n ) makes Y t ~ I ( d b ) , of which d b 0 . The sequence Y 1 t , Y 2 t , , Y n t is called the ( d , b ) -order cointegration, recorded as Y t ~ C I ( d , b ) , of which is the co-integer vector. The tests of cointegration mainly include the Engle–Granger (E–G) [63] two-step cointegration test and the Johansen [64] cointegration test. Among them, the Johansen test is applicable to the inspection of more than two time series. Therefore, this paper adopted the E–G two-step method to test the cointegration relationship.
  • Error correction model (ECM)
The error correction model [65] is mainly used to study the short-term dynamic relationship between non-stationary time series with a cointegration relationship.
Δ Y t = β 1 Δ X t λ e c m t 1 + μ t t = 1 , 2 , , T
where e c m t 1 is the error correction term reflecting the short-term equilibrium relationship between variables, and the coefficient λ reflects the speed at which the variables are adjusted to the equilibrium state when they deviate from the long-term equilibrium. From this, we can see that the short-term variation of the variable Δ Y t is affected by two aspects: one is the short-term effect of the independent variable, the other is affected by the error correction e c m t 1 , that is, the influence of the variable deviating from its long-term equilibrium relationship in the short-term fluctuation. In the realization of the model, this paper used the direct estimation method.
  • Granger causality test
The Granger causality test can be used to determine whether there is a causal relationship between economic variables and the direction of influence. Here, the causal relationship was not the traditional logical sense of causality, but the order of variables. The Granger causality test was to verify that the lag variables of a variable were affected by the lag of other variables, and if they were affected, they had a Granger causal relationship.
  • Vector autoregression model (VAR)
The vector autoregression model, referred to as the V A R model, was proposed by Sims [66] in 1980. The V A R model does not have any constraints. It returns the variables of the current variable and the variable, and then estimates the dynamic relationship between the variables. In addition, the model does not impose zero constraints on the parameters. Compared with the simultaneous equation model, the V A R model does not include any current variables in the explanatory variables. The mathematical expression of the V A R ( p ) model is as follows:
y t = Φ 1 y t 1 + + Φ p y t p + H x t + ε t t = 1 , 2 , , T ,
where y t represents the k-dimensional endogenous variable, x t represents an exogenous variable, p represents the lag order, and T represents the number of samples. k × k dimensional matrix Φ 1 , , Φ p and k × d dimensional matrix H are the coefficient matrices to be estimated. ε t is a k-dimensional perturbation column vector that can be correlated with others for the same period, but is not related to its own lag value, and is not related to the variable to the right of the equation.
  • Impulse response function and variance decomposition
The impulse response function is a measure of the response and duration of a variable when a new information impact is derived from the random error term of each equation. It is mainly used to analyze the impact of endogenous variables on other variables. Assuming that the random error term of a certain equation changes in the t phase and then restores calm, then the impulse response measurement represents the response of the variable to the shock when each ( t , t + 1 , t + 2 , ) is interpreted.
Variance decomposition is used to analyze the contribution of each structural impact to the variation of endogenous variables. Based on this, the relative importance of innovations to endogenous variables is judged. The main idea of variance decomposition is to decompose the fluctuation (k-step prediction mean square error) of each endogenous variable (a total of m) in the system into m components, associated with the innovation of each equation.

3.2.2. Interaction Status Evaluation

  • Deviation coefficient method
The coordinating relationship between PU and LU refers to maintaining a fitting relationship between urban population growth and urban space growth. This paper used the coefficient of dispersion C v to measure the deviation between the two systems. The expression of the coefficient of dispersion C v is
C v = S X ¯ ,
where S is the standard deviation, and X ¯ is the average of X . The above formula can also be expressed as
C v = 1 2 [ ( p p + l 2 ) 2 + ( L p + l 2 ) 2 ] | p + l 2 | = | p l p + l | ,
where p denotes the growth rate of the urban population, and l denotes the growth rate of the urban built-up area.
The coefficient of variance represents the degree of difference between the two variables. The smaller the value, the more consistent the rate of development, and the opposite for the imbalance between the two. Based on existing research [67], the coordination level of urban population–land urbanization was divided into the following categories (Table 1):
  • Coordinated development degree model
Coordinated development is the phenomenon where the systems promote each other and are enhanced together in the process of development. Drawing on the research of relevant scholars [45,68] a coordinated development degree model was used to measure the coupling of land–population urbanization systems.
Development index model: based on the evaluation of population–earth urbanization in the previous section, the population and land urbanization quality index was determined.
Quality   Index   of   PU :   f ( x )   =   w i x i t ,
Quality   Index   of   LU :   g ( y )   =   w i y i t ,
where w i is the weight coefficient of the index, which is determined using the entropy weight method. It mainly uses entropy to calculate the weight of the index according to the degree of variation of each index value to obtain a more objective evaluation result. The main process is:
(1)
Calculate the proportion of the index value of the i-th item under the j-th index p i j = r i j / i = 1 m r i j ;
(2)
Calculate the entropy of the j-th indicator e i j = k i = 1 m p i j ln p i j , of which k = 1 / ln m ;
(3)
Calculate weights w j = ( 1 e i j ) / j = 1 m ( 1 e i j ) .
The coordination degree of urbanization quality and the quality of LU is
C = { f ( x ) g ( y ) / [ f ( x ) + g ( y ) 2 ] 2 } k ,
where k is the adjusting coefficient. As this paper mainly studied the coordinated development between the two systems of PU and LU, here k = 2 , 0 ≤ C ≤ 1, of which, the closer the C is to 1, the greater the coordination between the two.
The coordination between the two can only reflect the coordination of the two systems, but cannot represent the development of the two systems, as it is possible that both systems are of low-level coordination, and cannot be identified by the coordination degree model. In this paper, the coordinated development degree model was introduced to characterize whether the two systems were in an advanced coordination state or low-level coordination state.
Coordinated   development   degree   model :   D   =   C T   T =   α f ( x )   +   β g ( y ) ,
where T is the degree of development, and represents the comprehensive index of the development of the two systems in the process of urbanization. D is the degree of coordinated development, and α and β are weight coefficients. This paper considered that PU was as important as the LU system, so was set at 0.5 here.
In addition, to characterize the changing trend of the coordinated development of the two systems, the coordinated development situation was introduced to the following expression:
L = D ( T + 1 ) / D ( T ) .
If L > 1 , then this indicated that the degree of coordinated development of the system is increased, and vice versa. This paper referred to the evaluation criteria [69] described by Li et al. for coordinated development, and classified the coordinated development types into three types of ten intervals, as shown in the following table (Table 2).

3.3. Variable Collection

3.3.1. Variables Selection in the Test of Interactive Relationship

In measuring the process of PU, there are currently two main methods: (1) to proceed from the connotation of PU, that is, from the perspective of population capacity, quality, employment structure, and quality of life, construct a comprehensive evaluation index system to measure PU; and (2) to select a single indicator such as the urbanization rate. The urbanization rate was divided into the urbanization rate of the permanent population, and the urbanization rate of the registered population [12]. Due to the mobility of the household registration population, this paper selected the urbanization rate of the permanent population, which objectively reflected the process and aggregation of the population into the city. In the process of LU, there are two main types of measurement methods: one is to use the construction land area to express, and the other is to use the built-up area to express. Urban construction land area places more emphasis on the artificial planning control attribute, and the urban built-up area emphasizes the already built area. This paper believed that using the built-up area to express was more in line with the connotation of LU.

3.3.2. Variable Selection for Interaction Status Evaluation

When selecting the index system of PU and LU, it is required that it fully reflects the current status of both, and it must be able to reflect the connotation of both. According to the principles of systematicness, representativeness, maneuverability, and dynamics, this paper, based on the analysis and summary of the existing research [51,58,70], given the availability of data, chose six indicators to measure the urbanization level of population from three aspects: population composition, population quality, and urban living standard. From the four aspects of land input intensity, land use degree, land output effect, and land sustainable use status, 11 indicators were selected to measure the quality of LU, and finally, an evaluation index of the population–land urbanization quality coordinated development system is constructed (Table 3).

3.4. Data Sources

The empirical data in this paper came from the “Chongqing Statistical Yearbook” (1999–2017). The average land use index was calculated based on the land area of the urban built-up area. In order to eliminate heteroskedasticity, the original data of the built-up area and urbanization rate were taken as natural logarithms, and further differentials were used to express the growth rate, which could better represent the speed of urbanization (for raw data, see Appendix A). Taking into consideration that price changes impact on GDP values during the study period, this study utilized the comparable values of GDP and total investment in fixed assets in the data collection. In order to eliminate the dimension of the data, we first standardized the data.

4. Results

4.1. Time Series Econometric Model Results

4.1.1. Outputs of Stability Test

Before analyzing the interactive relationship between Chongqing’s PU development and LU, we needed to test the stability of the data, that is, determine whether there were unit roots, and the phenomenon of the erratic regression of unstable data will affect the evaluation of the later period. This paper used the Augmented Dickey-Fuller (ADF) method to test the stability of the data. The relevant test results are shown in Table 4. From the test results, the urbanization development ( ln U R B A N ) and land expansion ( ln L A N D ) test values failed to pass the 5% significance test, indicating that both ln U R B A N and ln L A N D were non-stationary data; based on this, the first-order difference was performed, and then the ADF test was performed. The results showed that the ln U R B A N and ln U R B A N values after the first-order difference were all less than the critical value of 5% of the significant level, indicating that the data after the first-order difference were stable. Therefore, at the 5% level of significance, ln U R B A N and ln U R B A N were all first order monosequences.

4.1.2. Outputs of Cointegration Test

Although both PU and LU indicators are a non-stationary time series, their first-order differentials were followed by stationary sequences. According to the cointegration theory [63], if two or more time series were monotonous in the same order, there may be a long-term equilibrium relationship between them, that is, there was a cointegration relationship. The E–G two-step method was used to examine the cointegration relationship between PU and LU. First, the following equation was obtained using the Ordinary Least Square (OLS) estimation:
ln L A N D = 2.0393 + 2.2769 ln U R B A N ( 8.2996 ) ( 35.7565 ) R 2 = 0.9868 D W = 1.056 F = 1278.527 .
Next, an ADF unit root test was performed on the residual ε of the above regression equation to determine whether ε was a stationary sequence.
Equation (12) shows that the long-term urbanization level of the population will promote the level of LU, and an increase of the PU level of 1% will cause a land expansion of 2.28%. The ADF unit root test results (Table 5) showed that the residual sequence was a stationary sequence with no constant term and time trend, denoted as ε ^ ~ I ( 0 ) . Moreover, the ADF value of the residual term of the equation was less than the critical value of the significant level 0.01, so there was a long-term cointegration relationship between PU and LU, which could further establish the short-term development relationship between the variables with the error correction model.

4.1.3. Outputs of Error Correction Model

By using the general least squares method (OLS) to estimate the parameters of the error correction model, the following regression equations were obtained:
Δ ln L A N D t = 1.7853 + 3.2862 Δ ln U R B A N t 0.656 ln L A N D t 1 + 1.5988 ln U R B A N t 1 t = ( 3.12 ) ( 1.92 ) ( 2.98 ) ( 3.20 ) R 2 = 0.55 F = 5.81 L o g l i k e l i h o o d = 32.17 L M ( 1 ) = 0.2083 L M ( 2 ) = 2.5158 .
Equation (13) can also be expressed as
Δ ln L A N D t = 3.2862 Δ ln U R B A N t 0.656 ( ln L A N D t 1 + 2.7215 2.4372 ln U R B A N t 1 ) .
The part in the bracket of Equation (14) was the error correction term, which could be further expressed as
Δ ln L A N D t = 3.2862 Δ ln U R B A N t 0.656 e c m t 1 .
The coefficient of the right variable of the equation showed the short-term elasticity between PU and LU, that is, if the urbanization increased by 1%, the urban expansion would be 3.2862% in the short-term, and the elasticity coefficient in the short-term was greater than the long-term elasticity coefficient. The error correction coefficient in the regression equation was not zero, which shows that in order to maintain the long-term equilibrium relationship between PU and urban land expansion, the unbalanced state between land use and urbanization in the previous period would be adjusted by 65.6% (the error correction coefficient was negative, and consistent with the reverse correction mechanism), and pulled back into a long, balanced state.

4.1.4. Outputs of Granger Causality Analysis

As the Granger causality test depends on the length of the lag period in the test regression model, this paper selected the lag phase of 1–3 periods. The test results are shown in Table 6.
According to the Granger causality test results shown in Table 6, there was a one-way Granger causality between urban land expansion and PU. In the 1–2 period of the lag period, the second hypothesis rejected the original hypothesis at the level of 5% significance, that is, the development of PU was the Granger cause of LU. LU is not a Granger cause of PU during the period of 1–3 lags, which showed that the PU in the process of urbanization in Chongqing promoted the urbanization of land by the demand for construction land and urban space. However, the urbanization development of land is not the main reason of population agglomeration.

4.1.5. Outputs of the V A R Model

Before examining the impulse response function and variance decomposition, we had to first establish a V A R model of two variables. According to AIS, SC, and Hannan-Quinn (HQ) rules, and considering the degree of freedom, a lagging third-order V A R model of population-land urbanization was established. The overall model test results (Table 7) showed that the model fit ideally. The unit root test of the V A R model showed that the V A R model was stable (Figure 5).
[ ln L A N D ln U R B A N ] t = [ 0.18 4.13 0.02 1.19 ] [ ln L A N D ln U R B A N ] t 1 + [ 1.13 4.60 0.05 1.04 ] [ ln L A N D ln U R B A N ] t 2 [ 0.002 2.61 0.013 0.65 ] [ ln L A N D ln U R B A N ] t 3 + [ 1.75 0.47 ]

4.1.6. Outputs of Impulse Response Function

Using the Cholesky DOF-decomposed decomposition method [71], the number of tracking periods was selected as 10, and the following impulse response graph was generated (Figure 6). In the figure, the horizontal axis indicates the number of periods, the vertical axis indicates the magnitude of the impulse response function, and the orange broken line indicates the standard deviation band (±2 SE) of plus or minus two times.
The urbanization of land showed a sustained positive impact on the expansion of land. It quickly reached its peak in the first period. The 2–3 periods continued to decline, reaching a trough in the third period, then showing slight positive fluctuations. When it was hit by the PU, LU lagged behind by one period, then quickly responded, peaking in the second period. Afterwards, it was in a weakened state until the fourth period, and reached the bottom in the fourth period, showing a negative response. Since then, it slightly increased, and has remained stable from the positive direction. After the impact of land expansion, PU continued to respond positively with a peak in the third period, followed by fluctuations around 0.002. PU also showed a continuous positive response after being impacted by itself. The response intensity of the previous period was greater than the impact of land expansion. The response for the first phase was 0.0045, the second phase reached a peak of 0.0054, and so on, thereafter until the fourth phase was weakened. The fourth phase reached a trough of 0.0008, and thereafter, fluctuated around 0.002. However, when compared to the LU, the response of the PU to impulses was very weak.

4.1.7. Outputs of Variance Decomposition

The study conducted a 10-period variance decomposition on ln U R B A N and ln L A N D , and the results are shown in Table 8. Column SE in the table is the standard error of prediction for the two variables. The data in ln U R B A N and ln L A N D represent the contribution of the innovation of equations with ln U R B A N and ln L A N D as the dependent variables for the standard error of prediction in each period, respectively, and the sum of the two values for each row was 100.
According to Table 8, the variance of LU can be explained by 84.32% of the first phase of land expansion, and 15.68% by PU. In the second period, the explanatory power of land expansion rapidly decreased by 13.3%, while the urbanization of the population increased. Subsequently, the impact of land expansion gradually weakened to 67%, and the impact of PU stabilized at 33%. The variance of PU was only affected by the urbanization rate in the first period, and then the impact of the urbanization rate quickly weakened and eventually stabilized at around 80%. Among them, the most drastic changes were 2–4 periods. During this period, the impact of land expansion increased by 20%. Since then, it has at stabilized around 20%.

4.2. Outputs of Interactive Status Evaluation

Based on the above research on the interaction between PU and LU, this section separately measured the speed and quality of the two systems in terms of coordination and continuous interactive development and analyzed the state of interaction between the two.

4.2.1. Coordination Situation of the Development Speed between PU and LU

The coordinated nature of population–land urbanization development speed is that the relationship between the speed of PU and the speed of LU maintains dynamic and balanced growth. That is, the speed of population agglomeration coincides with the speed of accumulation of capital elements attached to the land. This paper adopted the urban population growth rate and built-up area growth rate to measure the relationship between PU and LU development, and the degree of coordination (Table 9).
During the research period, Chongqing’s urban population and urban built-up areas have expanded rapidly. The population has increased by 1.04 times, with an average annual growth of 4.1%. The highest growth year had a growth rate of 6.14% in 2002, and the lowest was a growth rate of urban population of 2.9% in 2014. At the same time, the area of urban built-up areas increased by 2.68 times, with an average annual increase of 7.52%; however, the area of built-up areas fluctuated relatively, with the slowest growth in 2016 being negative growth of 2.27%, and the highest in 2002, reaching 23.86%. From the perspective of maladjustment, only two years were in the phase of coordinated development. Seven years showed a mild misalignment, and seven years had moderate maladjustment. Among them, two systems were in extreme misalignment for three years. Overall, there was an imbalance in PU and LU in Chongqing. In addition to the individual years, the overall trend of LU was faster than the speed of PU (Figure 7).

4.2.2. Coordinated Evaluation of Quality Development between PU and LU

The urbanization of population not only includes the transformation of peasant identity to urban identity, but also the change of lifestyle and thinking. Similarly, the urbanization of land is not only the expansion of the urban built-up area, but also the improvement of land use quality and the rationalization of land use structure. The optimization of land structure is characterized by the decrease of land use ratio, the increase of public facilities and green space. This part attempted to establish an evaluation index system from the angle of PU, and the quality intention of the LU development, to evaluate the quality level of the population system and land use system development in the process of urbanization development. The coordinated development degree model was used to evaluate the coordinated development of the two systems during the research period. The evaluation results are shown in Table 10.
On the whole, Chongqing’s PU and LU quality levels are increasing year by year, and the urbanization quality index of population is increasing faster than the quality of LU. The population was lagging before 2001, and land lagged after 2001 (Figure 8). It can be seen that when compared to LU, the economic development had an even more pronounced effect on the quality of PU.

4.2.3. Evaluation on Coordinated Development of Population–Land Urbanization

As shown in Figure 9, the coordinated development of the urban population quality level and LU quality level showed an overall upward trend from 1998 to 2016, from 0.2 in 1999 to 0.96 in 2016. The coordinated development of the two systems gradually shifted from an uncoordinated state to a state of high-quality coordination. From the situation index of coordinated development, with the exception of 2002, the development trend of each year was more than 1, which indicated that the coordination degree of the system was higher.

5. Discussion

With regard to the examination of the interactive relationship between Chongqing’s PU and LU, and the evaluation of its development speed and quality coordination, several important discussion points have emerged from the results of this study.

5.1. The Mechanism of PU Promoting LU

This paper constructed an econometric model of time series, and the results showed that PU could promote LU in Chongqing. Among them, the cointegration test and error correction model explored the interaction relationship from the perspective of long-term and short-term, respectively. The Granger causality test further examined the order of the two variables to determine the causal relationship between the two variables, and the conclusions obtained were consistent. The role of PU in the development of LU was mainly achieved by increasing the demand for construction land and changing the structure of land use. First, the increase in demand for construction land. The development and prosperity of the city is based on the flow of social factors, where the flow of population is the core. Compared with rural areas, cities attract a large number of rural laborers due to good job opportunities and convenient living conditions. A large number of population inflows have set new requirements for the provision of urban public services, their jobs, residences, and transportation based on the occupation of urban land resources. Therefore, the most direct impact of the influx of people into the city is the increase in demand for construction land. Second, the change in the structure of land use. The influx of rural surplus labor has brought about a relatively low labor force for the industrialization of the city. Under the guidance of agglomeration economies, companies have the impulse to expand their production scale and gain economies of scale. At the same time, to promote economic development, employment promotion, and bright performance, the government also has a strong desire to expand production, so the scale of industrial land will naturally increase. The increase in the scale of industrial land has also led to an increase in the corresponding residential land and public facilities, thus changing the land use structure.

5.2. The Interaction between PU and LU

The impulse response function and variance decomposition based on the VAR model revealed the respective responses of the two variables after impact. Figure 5 shows that LU responded quickly when it was impacted by itself, and the response to LU quickly subsided due to the lack of self-strengthening mechanisms. Therefore, in the process of urbanization development, it cannot rely entirely upon the urbanization of the amount of land. When affected by PU, LU lagged behind, and then the response was larger and decreased with time. This shows that the development of PU in the short-term will affect the land use demand, increase the demand for land in the short-term, and pay more attention to excavating the land potential in the late periods, and the demand for land will be relatively reduced. Variance decomposition further showed that the expansion of construction land use continued to reduce the ability to explain LU, and population aggregation led to LU more clearly, indicating that the driving force for urbanization started with government-led behavior, the leading behavior originated from the local government’s dependence on the land finance to develop the economy, and the role of population agglomeration in the later period was gradually highlighted. The impact of PU on itself, and the expansion of land, showed a continuous positive response, but the response changes were weak; the result of variance decomposition further showed that the effect of population agglomeration on PU was far greater than that of land expansion. Obviously, continuous expanding urban construction land does not significantly attract the flow of population and enhance the attractiveness of the city. This also demonstrates the inefficiency of the current mode of development of a pancake-style city.

5.3. The Coordination of Development between PU and LU

Research on the coordination of PU and LU development rate using the deviation coefficient method showed that during the research period, the population of urban areas and construction land has rapidly expanded in Chongqing, but the pace of expansion of the two is inconsistent. The overall performance shows that the speed of land expansion is greater than the speed of urban population agglomeration. This conclusion is consistent with the overall situation in China [12]. This also explains the reasons for the shortage of land for urban and rural construction, low land use efficiency, and high vacancy rates in the development process. By contrast, if the speed of PU is faster than LU, then urban crowding will also cause agglomeration to be uneconomical, thus limiting the further development of the city. For the unbalanced pace of development of population–land urbanization, this paper proposed two main reasons. First, the dual household registration system. The system divides the population from the legal sense into agricultural population and non-agricultural population. Constrained by this system, the transformation of the agricultural household registration population into urban household registration population requires a three-dimensional transformation of regions, occupations, and identities. However, there are thresholds for these three changes. In particular, the change in status depends on the local settlement policy. In addition, “different rewards and equal rights for the same workers” make the city government enjoy cheap labor while saving financial expenditure on social welfare. Therefore, the policy has been continued. Second, the government’s reliance on land finances. The reform of the tax distribution system [72] in 1994 and the reform of the housing system [73] in 1998 contributed to local land finance. Local governments have not adequately budgeted for land finance compensation [74], and as a result, land finance has relied on the path of “land acquisition–land sale–tax collection–mortgage–requisition”. The local government monopolizes land development in the primary market, collects land at low prices, and sells at high prices to obtain excess profits. Therefore, continuously expanding land for urban construction in various regions has led to rapid LU that has exceeded the speed of PU. According to the statistics of the China Economic Weekly in 2014, Chongqing’s land reliance was ranked fifth in the 23 provinces and cities it counted, which was 50.89%.

6. Conclusions and Policy Implications

6.1. Conclusions

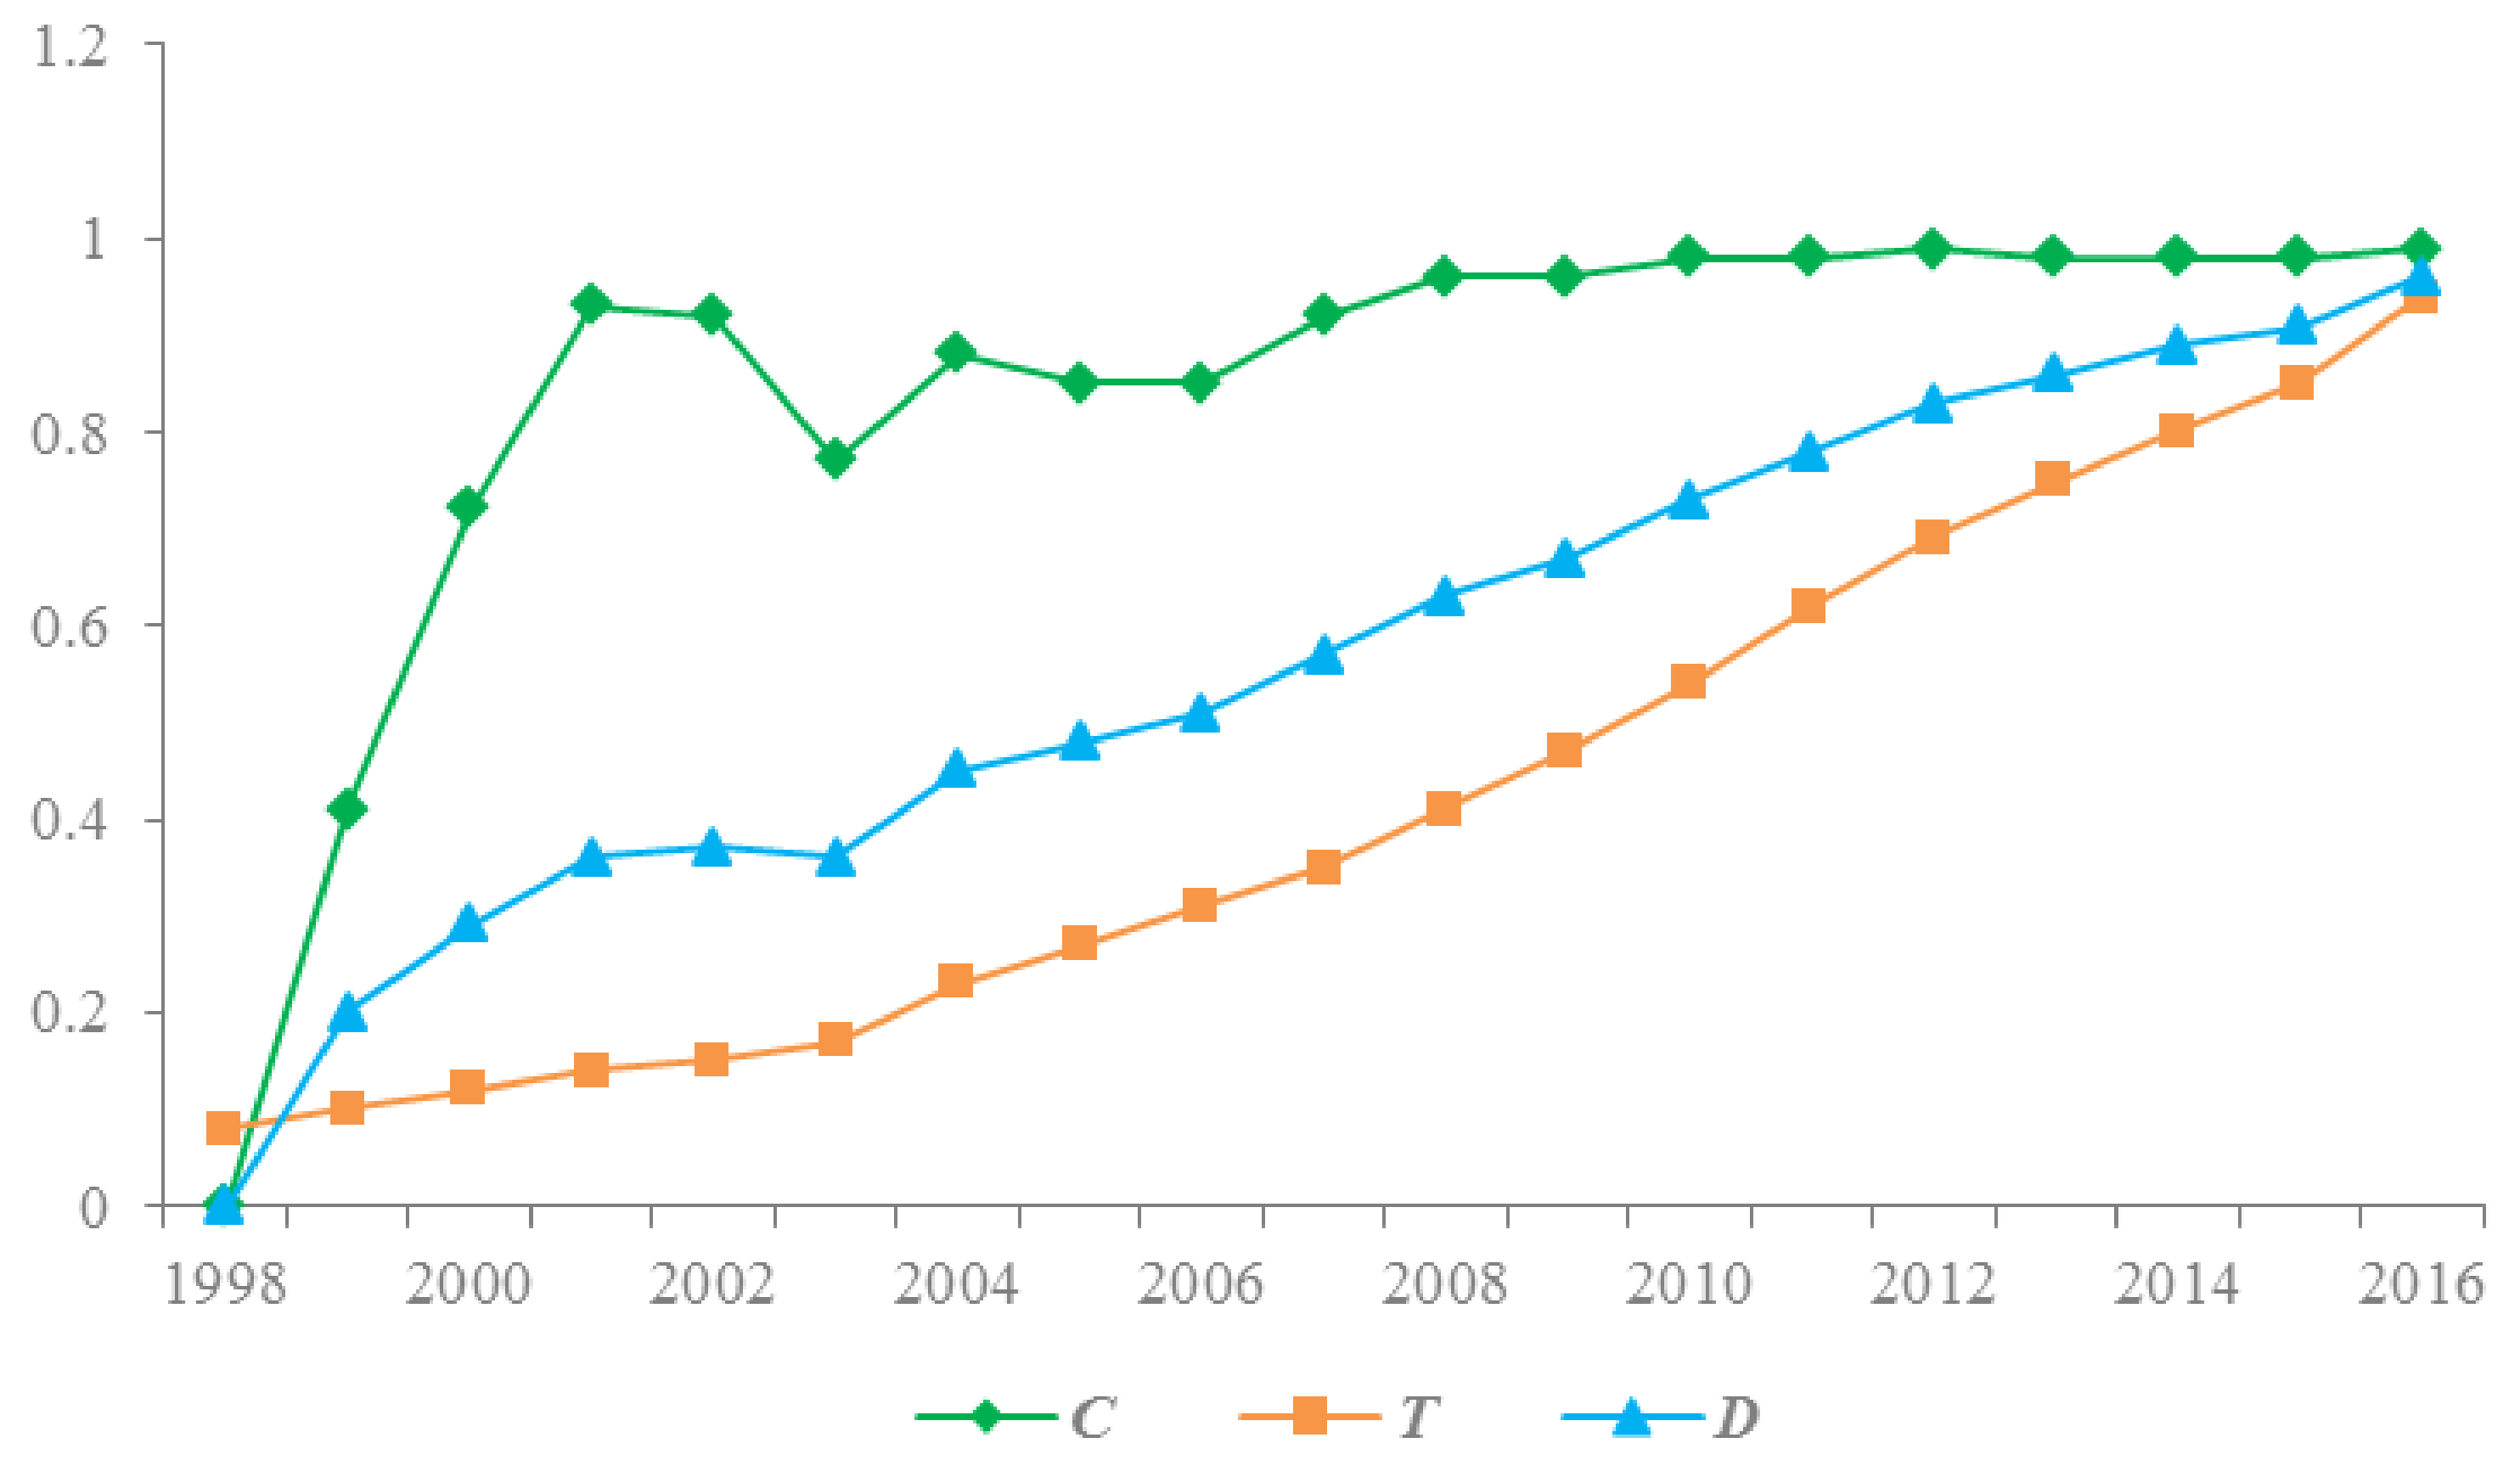
This paper used Chongqing as an example, constructed an econometric model of time series to study the interaction between PU and LU in Chongqing and used the coordinated development degree model to analyze and appraise the interactive relationship between the development speed and the quality coordination. The following conclusions can be made:
(1)
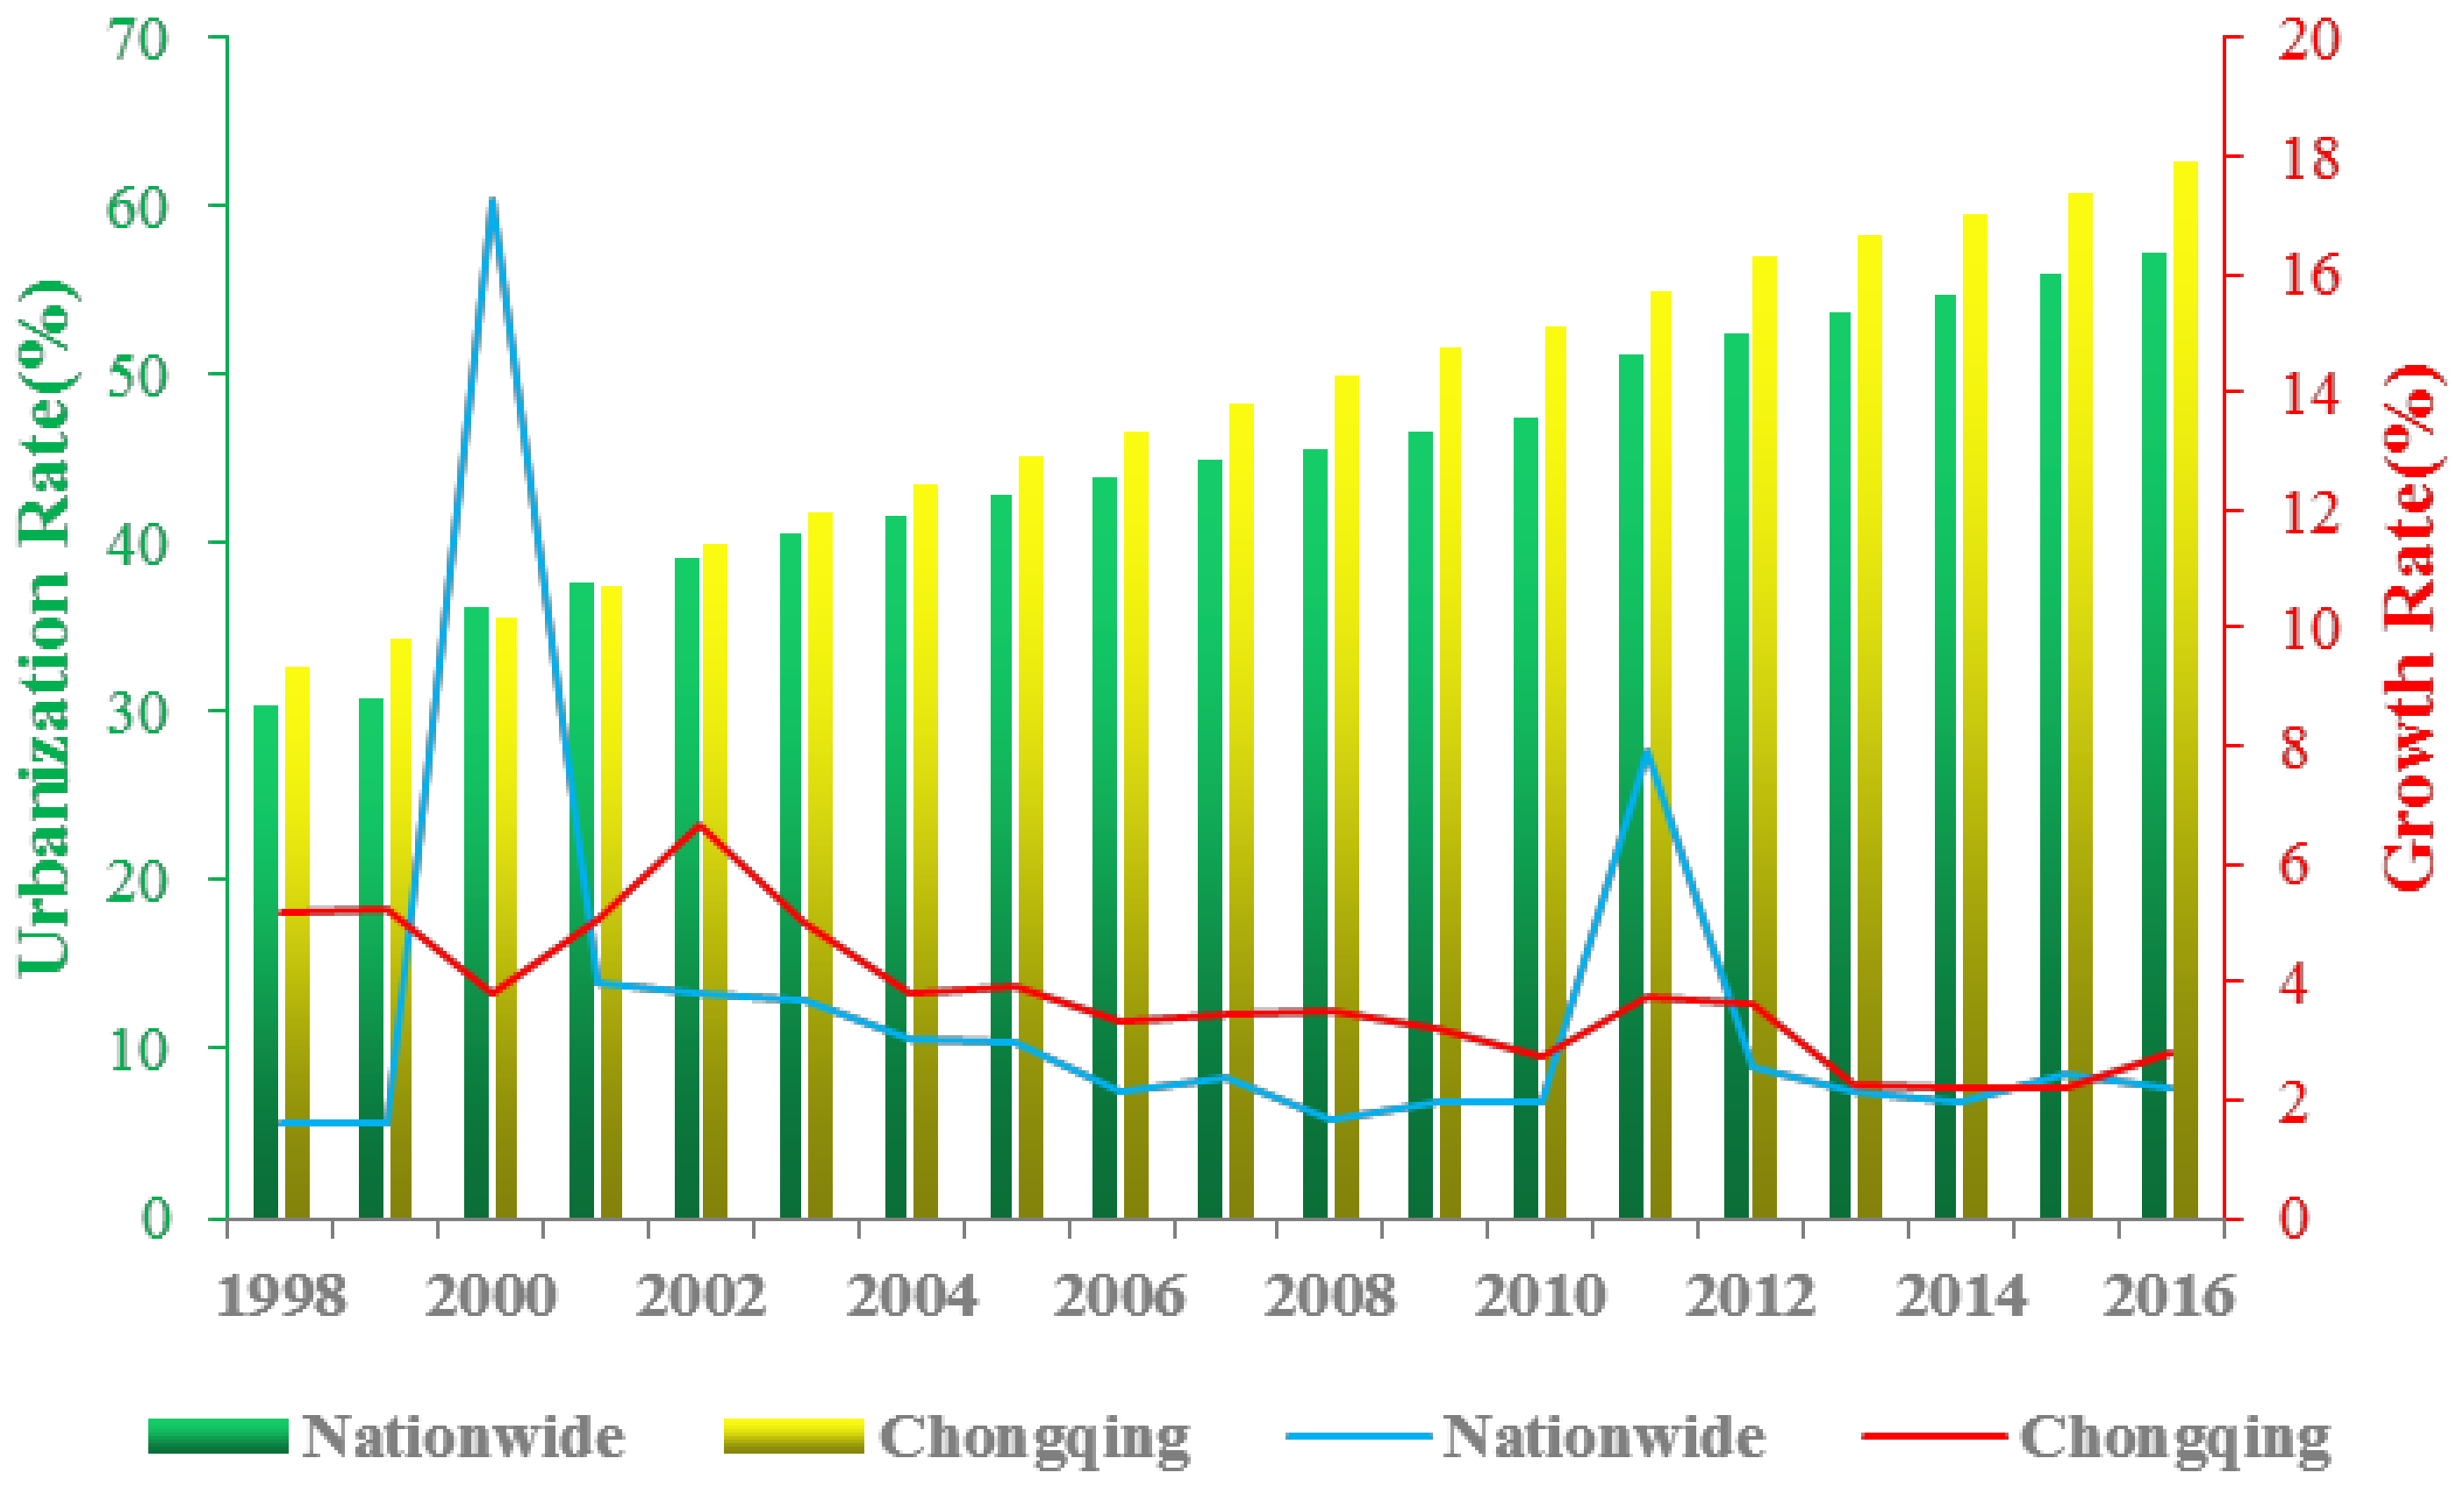
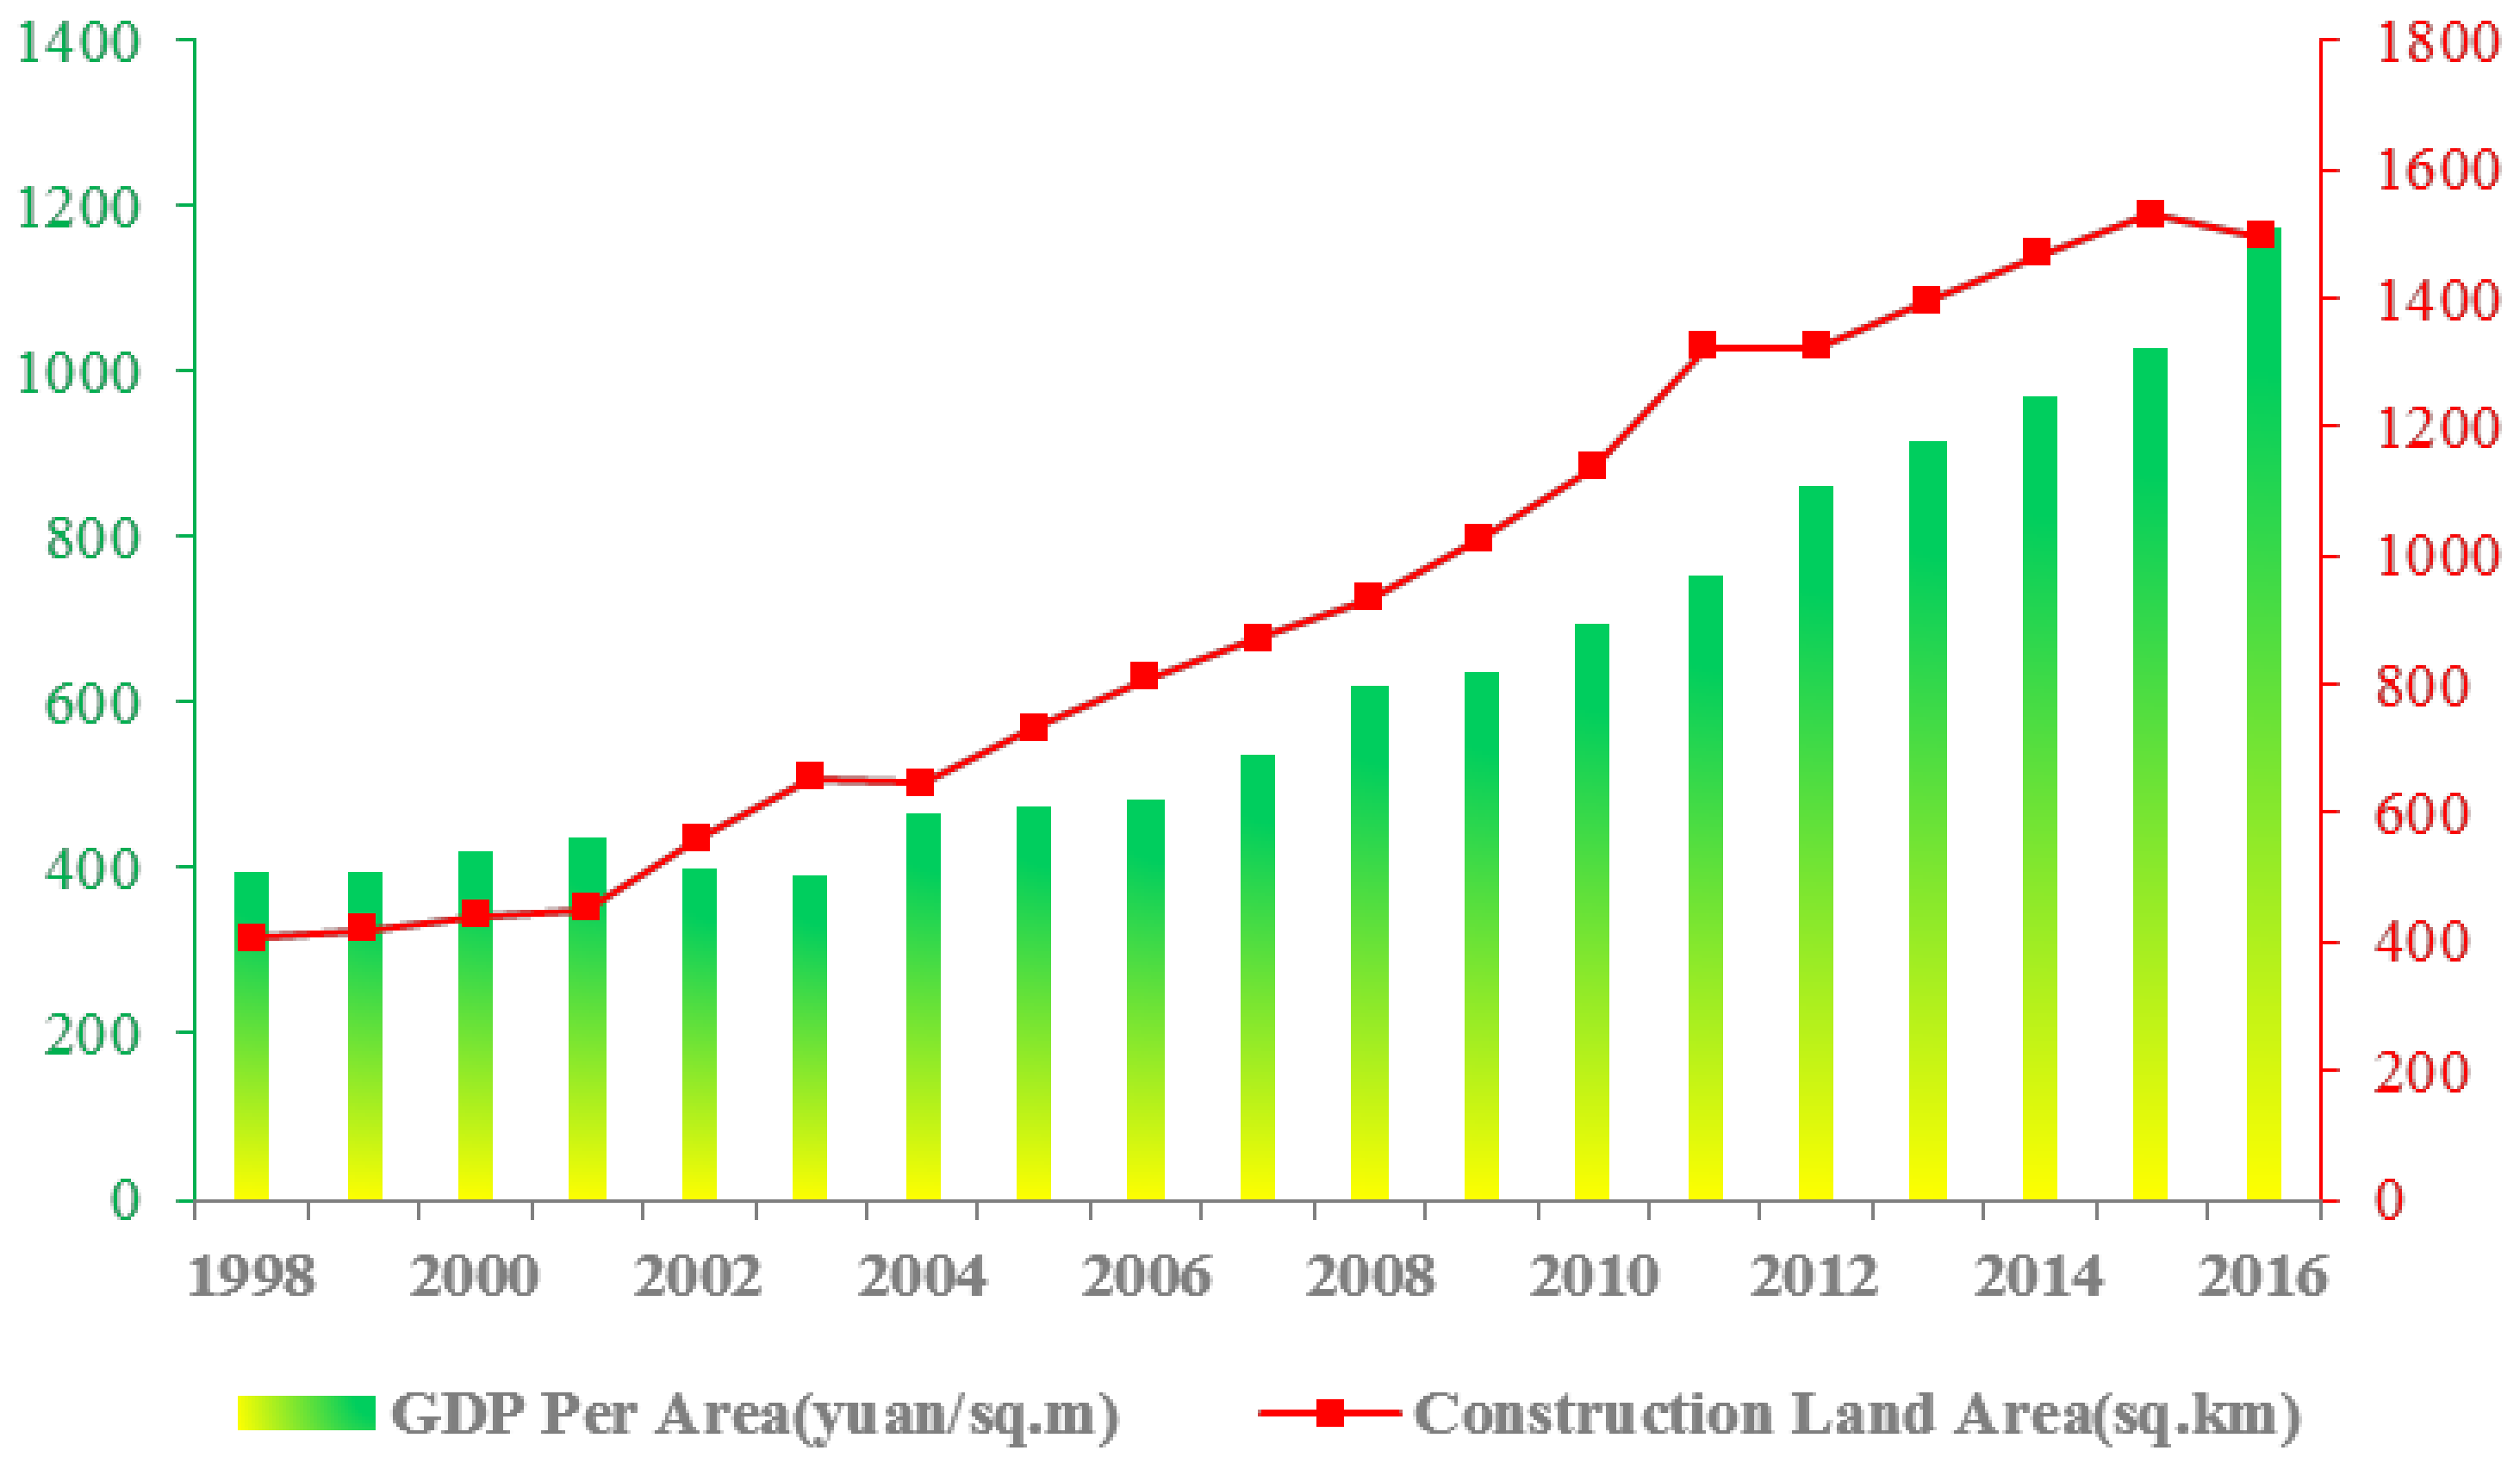
The horizontal comparison showed that the development level of urbanization in Chongqing was relatively insufficient, and the structure of land use irrational. The development of urbanization in Chongqing has been relatively rapid, but the current level of urbanization is still insufficient when compared with other municipalities. The proportion of urban population is small; the level of real urbanization is low, and there is a big gap between the urbanization rate of household registration population and the urbanization rate of resident population. The phenomenon of population outflow during the process of urban development is more serious, but there has been a gradual easing trend in recent years. In terms of urban land structure, the prominent problem is that industrial land accounts for a relatively large proportion, and land used for public management and facilities, as well as commercial service facilities, is obviously inadequate, which also leads to the weak capacity of Chongqing to absorb the labor force.
(2)
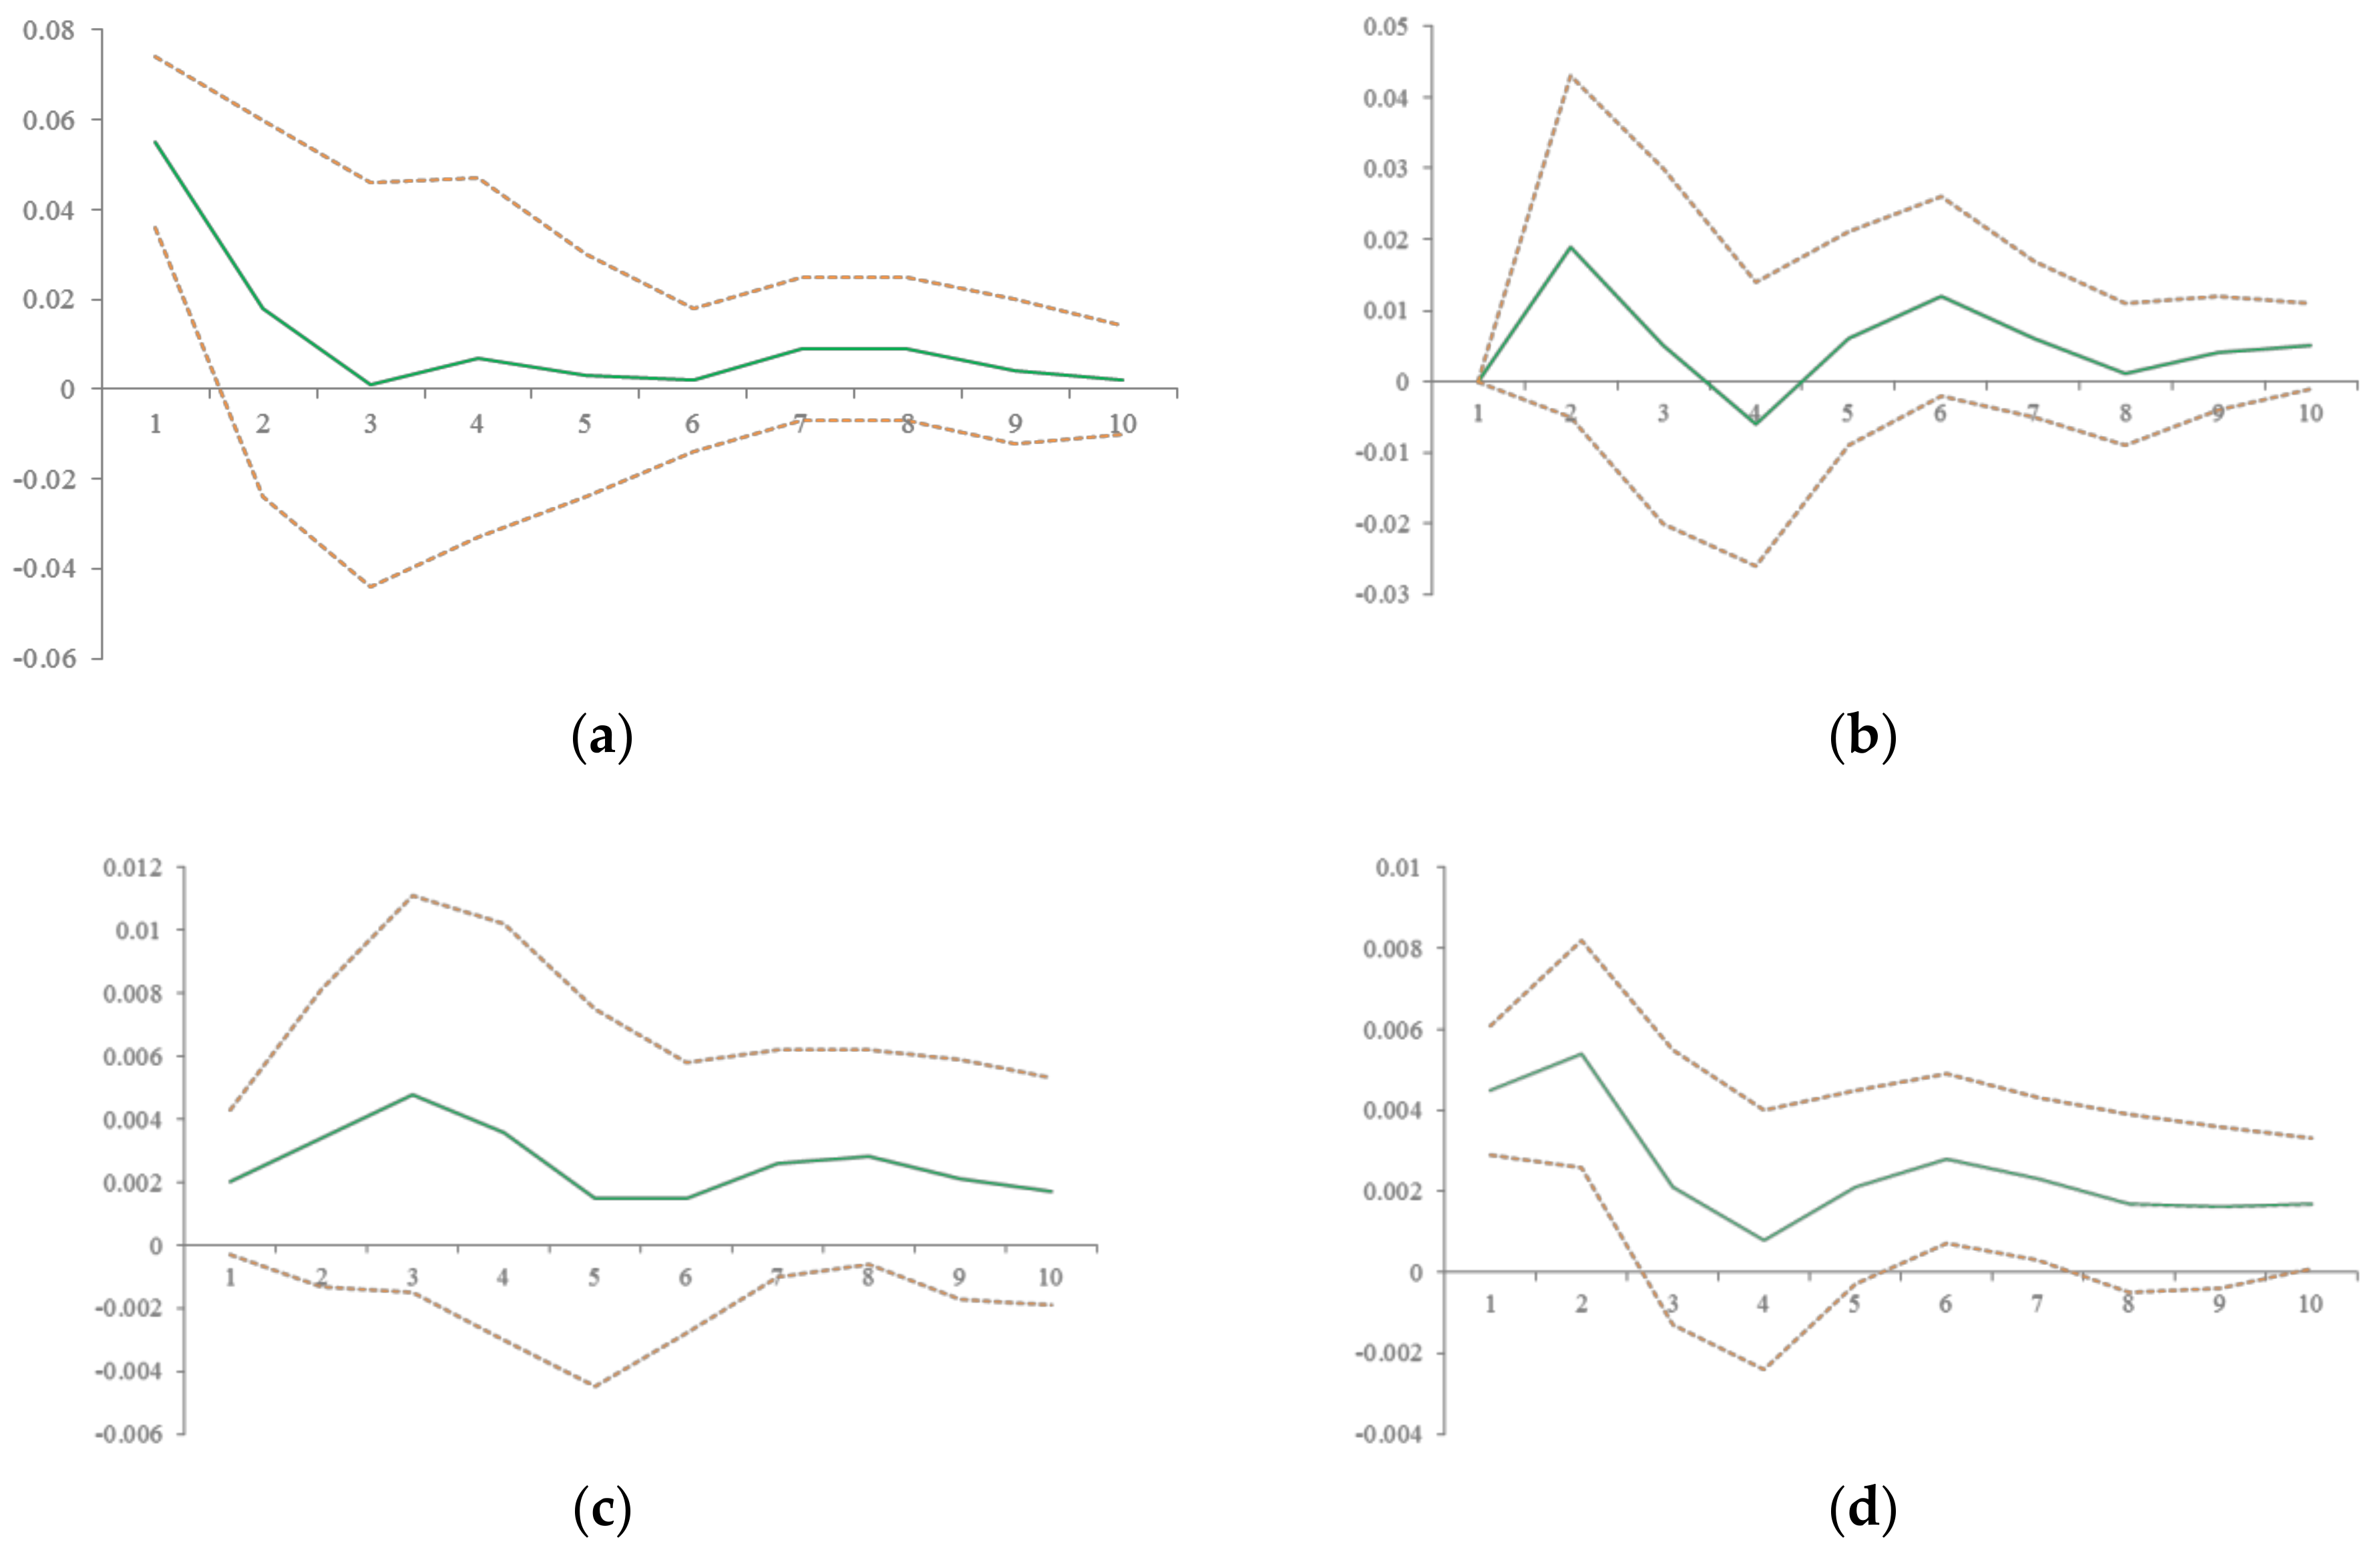
There is a long-term cointegration relationship between PU and LU. PU is the Granger cause of LU, and population agglomeration contributes significantly to the development of urbanization as urban development models that rely on land expansion do not apply. A 1% increase in PU will promote the LU by 3.29% in the short-term, and will promote it by 2.28% in the long-term. Its role is mainly achieved through the increase in demand for construction land and the transformation of land use structure. In addition, in the short-term after the deviation occurs, LU will adjust the unbalanced state between PU and LU of the previous period and PU by 65.6% to pull it back into a state of long-term equilibrium; In the process of urbanization, the role of land expansion is mainly in the initial stage, and later in the development of the connotation of land resources. The current “spreading cake” urban development model does not apply.
(3)
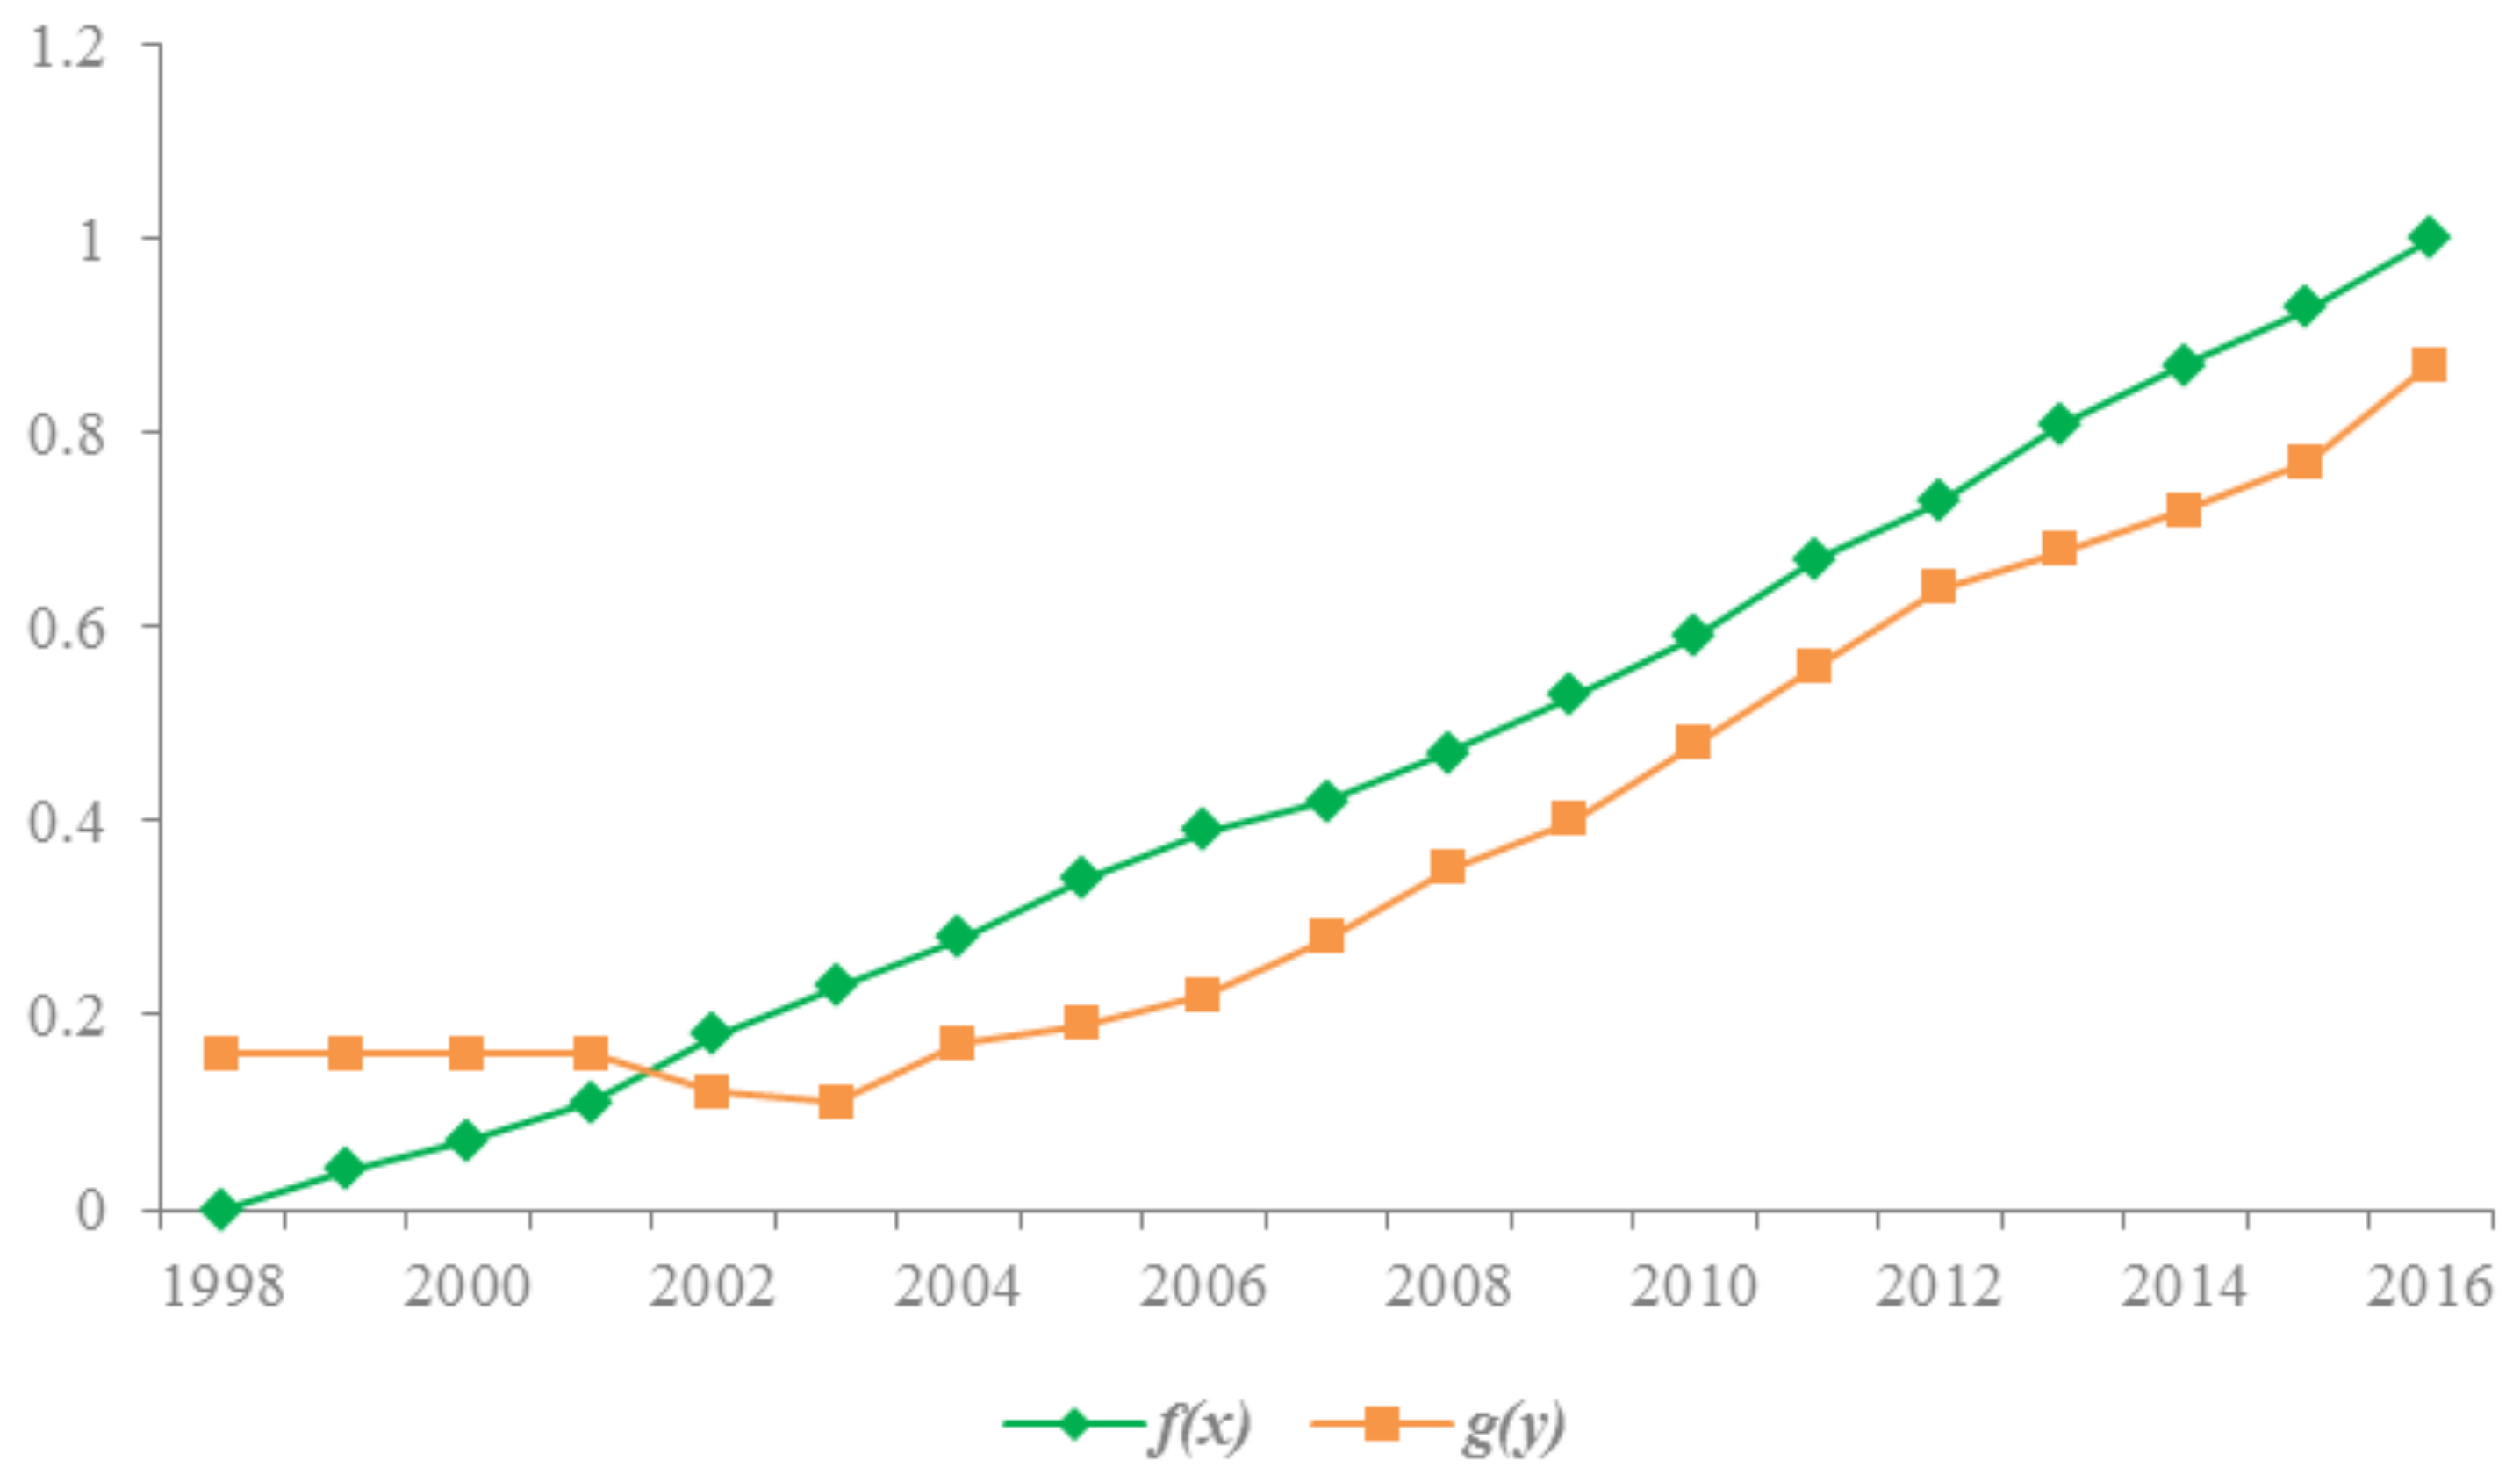
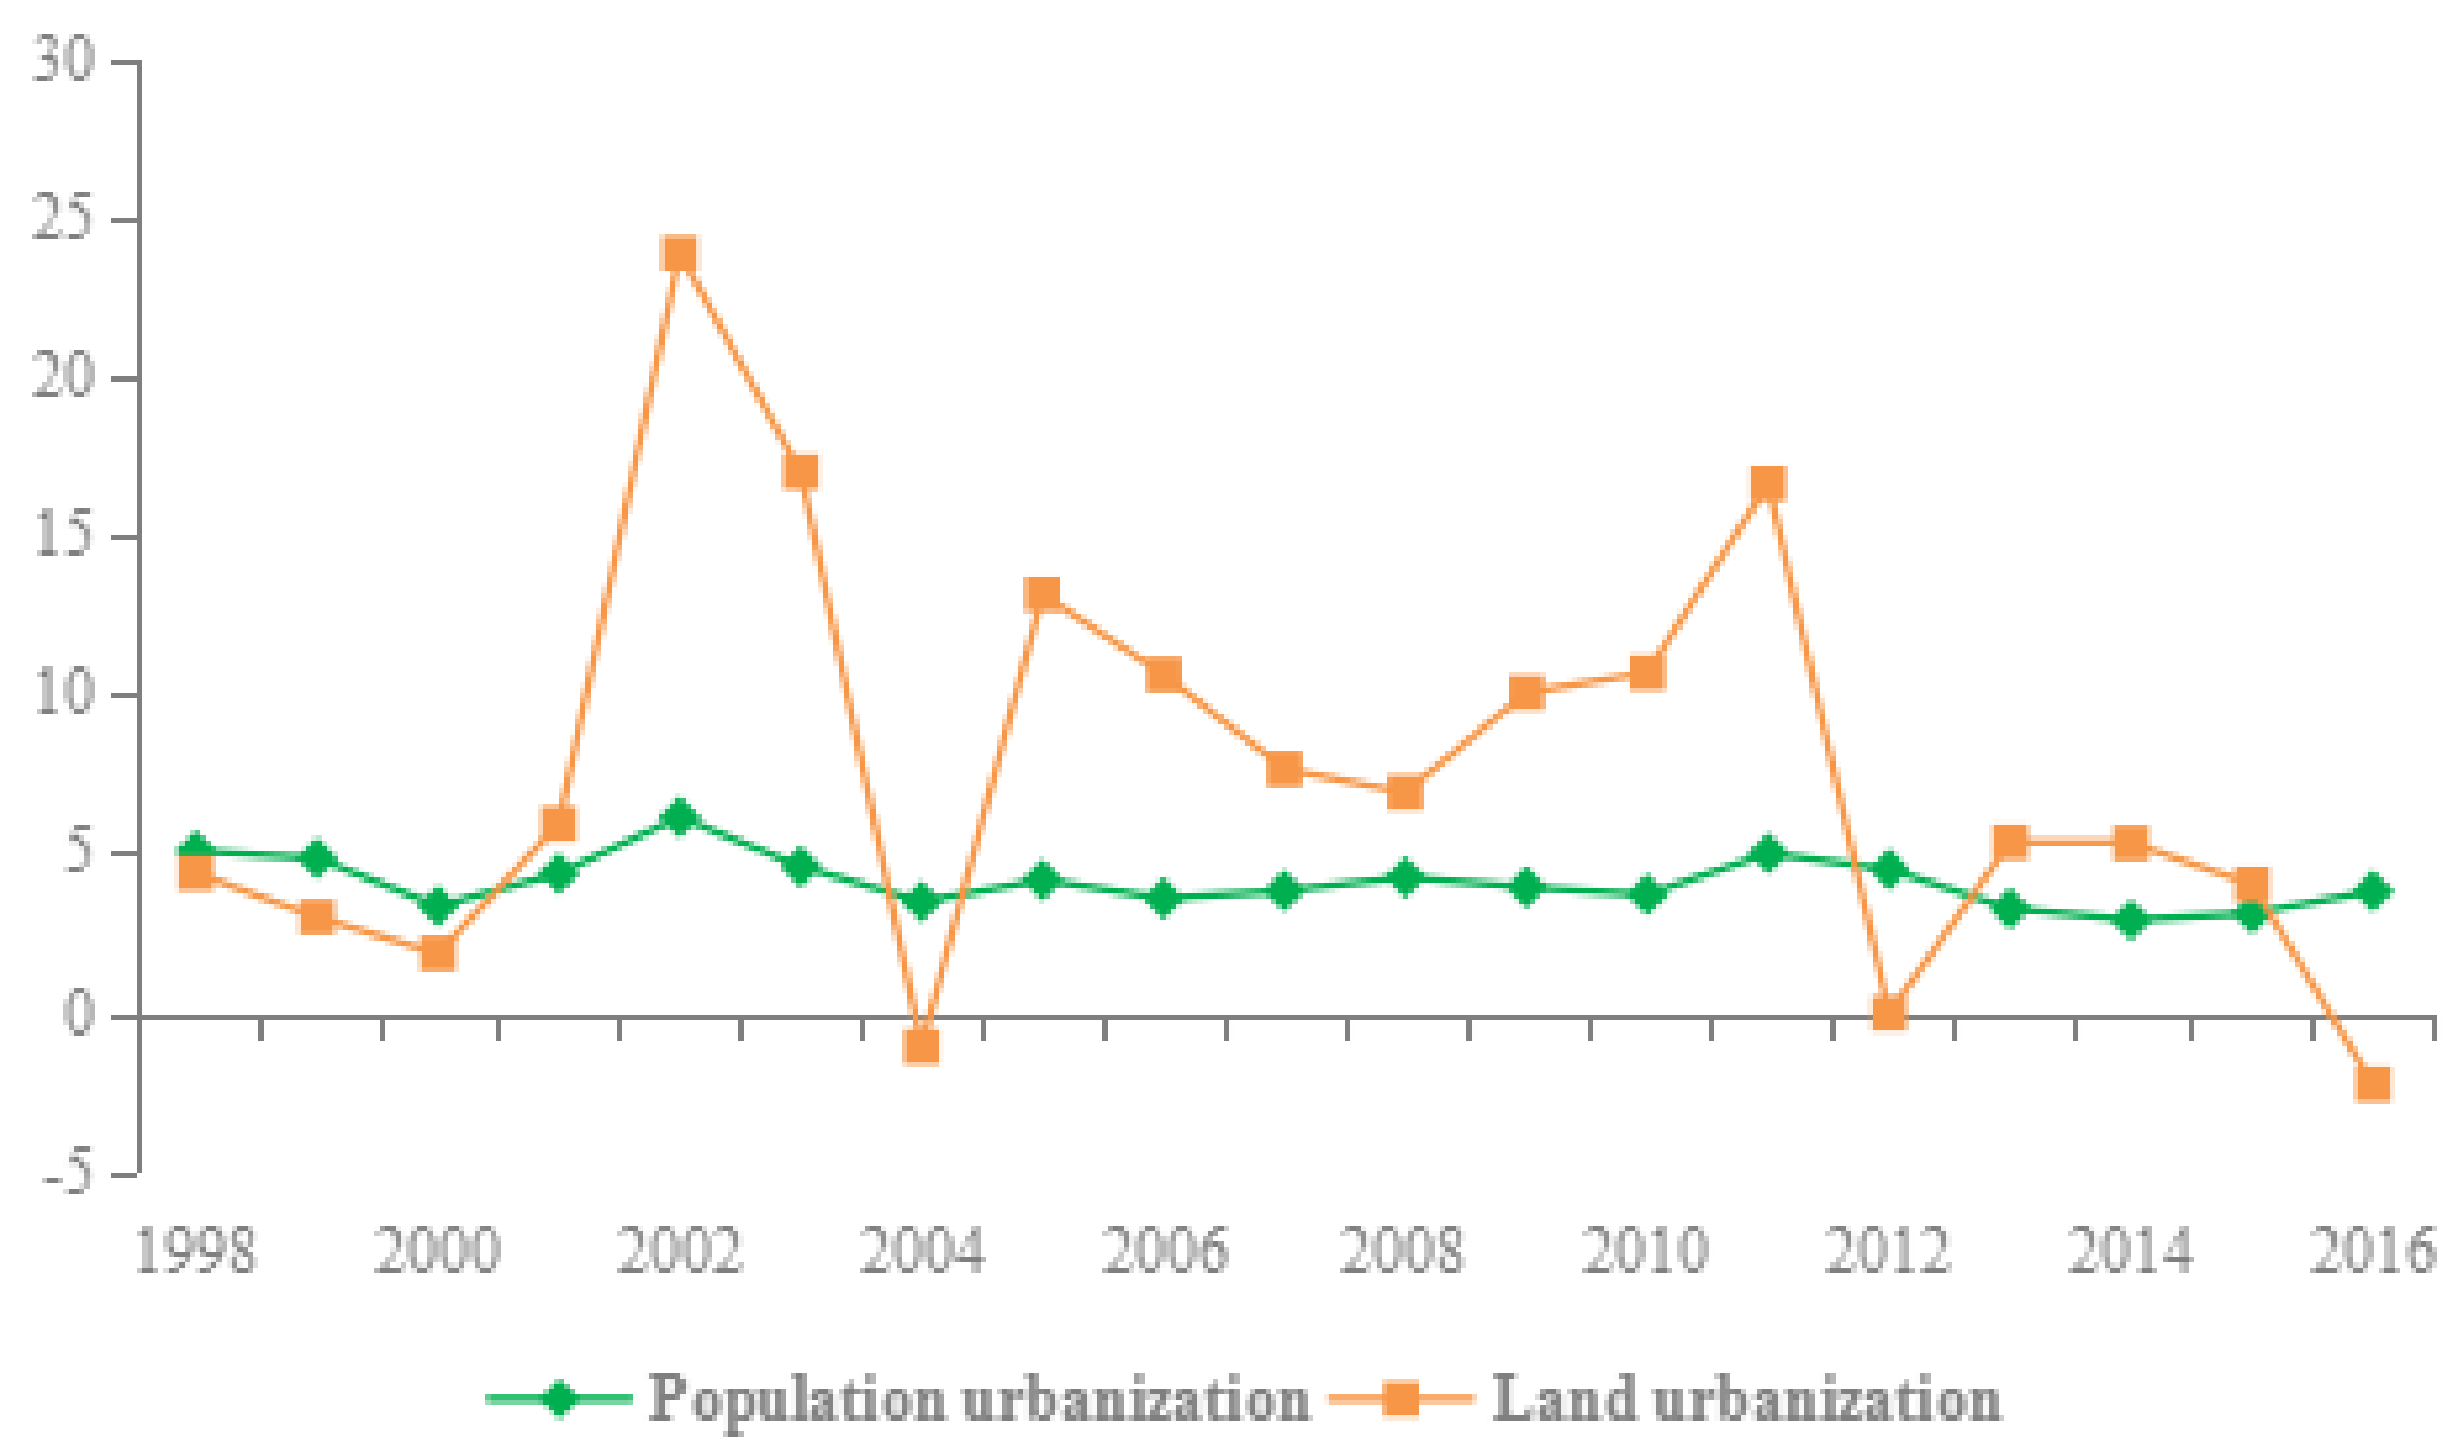
The speed of PU and LU are in an imbalanced state, and the coordination of development quality is increasing year by year, until it gradually develops into a coordinated state. LU is faster than PU, and the underlying cause is the objective restriction of the dualistic household registration system on PU and urban land expansion based on land finance dependence. The harmonization of the development quality of the two systems has been increasing year by year, and the increase in the quality level of PU is greater than that of LU, and gradually shows the lagged quality of land development. In general, the two systems are gradually shifting to a coordinated state.

6.2. Policy Implications

First of all, in view of the problem of the unbalanced land use structure, extensive land use, and high population outflow in Chongqing, we should start with land use management and population development management. In terms of land use management, on the one hand, the scientificity, rationality, and guidance of land planning should be strengthened. The overall planning of land use and the overall urban planning should be led by a department by strengthening the communication and demonstration with relevant departments and try to establish a plan for public participation. As a mountainous city, Chongqing strengthened the scientificity of land planning and adopted a “multi-cluster” planning model in space, which is of typical significance to the rational use of space in other cities in China. On the other hand, the research conclusions (3) showed that the inefficiency of the “spread-cake” model of urban growth and the quality of land development was lagging. Therefore, the level of land intensive utilization should be increased, and the quality of urbanization should be emphasized. The government can delineate the boundaries of urban growth, prevent the disorderly and sprawling growth of urban space, and at the same time, strengthen the development and utilization of the stock of land, continue to increase the intensity of land consolidation, and reasonably guide the adjustment of the industrial structure.
In the management of population development, the government should focus on promoting the flow and agglomeration of population factors. With reference to the classic theory of population flow push–pull [75], in terms of pulling force, it is necessary to actively improve the employment environment in cities and enhance the attractiveness of the city’s employment. This can be achieved through investment promotion, upgrading of industrial structure, and fostering innovation and entrepreneurship. In terms of thrust, we must increase the level of agricultural modernization, increase agricultural production capacity and sustainable development capacity, and release the rural labor force; at the same time, more job skills training for farmers should be intensified, as well as smoothing employment information sharing mechanisms and improving the competitiveness of rural migrant workers. The practice of Chongqing can be used for reference to the coordinated development of the industries and cities in many agricultural provinces in China.
Second, in light of the problem that LU occurs faster than the urbanization of population, consideration should be given to the regulation of land fiscal reform and household registration system reform. Based on the shortcomings of the mismatch between financial power and authority of the local government exposed during the operation of the tax sharing system, it is recommended to clarify the division of revenue responsibilities, division of expenditure responsibilities, and transfer payments between the central and local governments. From the source of finance, it can be ensured through the levy of real estate tax, and the promotion of land fiscal transformation can be gradually promoted on the basis of a pilot study. To promote the transformation of land finance, it can be gradually promoted on the basis of a pilot study. The above research conclusions can help China’s real estate tax implementation as soon as possible.
In terms of the reform of the household registration system, the equalization of basic public services [76] is the key to the current realization of PU. The government should explore the inclusion of the floating population in the social security system to ensure “equal pay for work of equal value”, and gradually abolish the restrictions on household registration [77], except for controlling the size of megacities. In addition, the current fiscal allocation and land use policy should be adjusted to establish a population–finance-building land linking system. Based on the characteristics of the population’s mobility, the indicators for construction land use and fiscal transfer payments are dynamically adjusted to stimulate the enthusiasm of local governments to attract population, so as to promote the coordinated development of PU and LU.
As a kind of exploration, this paper aims at the test and evaluation of the interaction between PU and LU, and obtains some results by using the econometric method of time series data and the coordination development degree model. However, in order to further improve the study, the next step should be studied from the following two perspectives: (1) refine the research object to the county level and explore whether differences in different regions can lead to different conclusions; and (2) consider the spatial interaction between counties, as subsequent studies may attempt to construct a spatial econometric model to more objectively evaluate the interaction of population–land urbanization.

Author Contributions

Z.M. conceptualized the framework of this study. Y.Lin contributed to the methodology, data collection, data calculation, and results analysis. Y.Li revised the original manuscript. All authors read, revised and approved the final version of the original manuscript. Moreover, several native English speakers contributed to paper revision before the submission this time.

Funding

The study was supported by the Fundamental Research Funds for the Central Universities of PR China (2017CDJSK03YJ05).

Acknowledgments

We appreciate the important advice from Minda Ma. We also appreciate Weiyan Hu and Ke Zhao for their valuable suggestions during the revision phase of the paper.

Conflicts of Interest

The authors declare no conflict of interest.

Appendix A. Raw Data

Table A1. Population Urbanization Raw Data
YearUrbanization Rate (%)Secondary and Tertiary Industry Workers’ Proportion (%)Regular Institutions of Higher Education per 10,000 PersonsEngel’s Coefficient (%)Per Capita Annual Disposable Income (yuan)Per Capita Annual Living Expenditure for Consumption (yuan)
199832.642.730.2845.65442.844977.26
199934.343.535.5242.85828.435444.23
200035.644.646.5142.26176.35569.84
200137.446.160.0940.86572.35873.69
200239.948.475.04387238.076360.2
200341.950.591.06388093.677118.06
200443.552.2108.837.89220.967973.05
200545.253.4127.9236.410,243.998623.29
200646.754.3144.2736.311,569.749398.69
200748.355.2158.313712,590.789890.31
20085056.3170.8439.114,367.5511,146.8
200951.657.8183.0337.215,748.6712,144.06
20105359.7196.1737.517,532.4313,335.02
20115561.9210.0138.520,249.714,974.49
20125763.7227.5641.522,968.1416,573.14
201358.365.5238.253523,05817,813.86
201459.667.3247.5534.525,14718,279
201560.9469.2254.333.627,23919,742
201662.671.1253.7532.729,609.9621,030.94
Table A2. Land Urbanization Raw Data.
YearBuild-Up Area (km2)Per Land Investment in Fixed Assets (yuan/m2)Area of Paved Roads per Capita (m2/person)Number of Employed Persons per Land (10,000 persons/km2)Inner Expenditure of R&D Funds per Land (yuan/m2)Population Density (persons/km2)Land for Urban Construction per Capita (m2/person)Per Capita GDP (yuan/m2)Total Retail Sales of Consumer Goods per Land (yuan/m2)Per Land Government Revenue (yuan/m2)Per Capita Green Covered Area (m2/person)Percentage of Greenery Coverage (%)
1998406.89122.432.581.81.3348.3813.87393.81152.2317.480.8819.97
1999419.04134.322.751.761.55347.1214.03396.91159.1818.311.0120.13
2000439.22153.683.021.732.37345.7114.27419.69168.7120.441.0418.34
2001452.03177.383.31.652.21343.3314.9437.33173.0723.481.417.25
2002559.89177.834.621.342.25341.5917.47398.8152.4628.22.316.5
2003654.95193.8161.162.66340.1819.64390.22142.7124.673.1216.6
2004647.78250.386.331.183.66338.9819.9468.46164.9230.974.0920.9
2005732.87273.766.631.064.37339.5525.21473.17167.5335.044.9321.6
2006810.71302.438.580.974.55340.7627.72481.95176.5839.196.5922.94
2007872.7362.278.420.935.39341.7330.28535.82196.0750.736.9729.97
2008933.04433.568.940.96.45344.5231.42620.94230.1261.98.9134.1
20091026.84517.899.290.857.73346.9534.5635.93244.9363.810.5736.76
20101136.53610.179.090.818.83350.0637.84697.35268.4683.7712.7239.48
20111325.44579.879.970.749.69354.2341.45755.32285.36112.2917.0140.28
20121324.94707.9610.40.7913.32357.3937.75861.14332.32128.5717.4142.34
20131396.86802.7310.890.7914.46360.4239.81915.8362.2121.317.141.28
20141470.12899.511.250.7813.78363.0241.72970.17388.45130.7416.5440.55
20151529.151012.3511.50.7416.16366.0743.141027.84420.1140.9216.140.04
20161494.471161.6911.810.7622.22369.9442.991174.85486.55149.0816.1840.78

References

  1. Shen, L.; Ochoa, J.J.; Shah, M.N.; Zhang, X. The application of urban sustainability indicators—A comparison between various practices. Habitat Int. 2011, 35, 17–29. [Google Scholar] [CrossRef]
  2. Shen, L.; Peng, Y.; Zhang, X.; Wu, Y. An alternative model for evaluating sustainable urbanization. Cities 2012, 29, 32–39. [Google Scholar] [CrossRef]
  3. Tan, Y.; Shuai, C.; Jiao, L.; Shen, L. An adaptive neuro-fuzzy inference system (ANFIS) approach for measuring country sustainability performance. Environ. Impact Assess. Rev. 2017, 65, 29–40. [Google Scholar] [CrossRef]
  4. UN DESA. World Urbanization Prospects: The 2014 Revision; United Nations Department of Economics and Social Affairs, Population Division: New York, NY, USA, 2015. [Google Scholar]
  5. UN Habitat. World Cities Report 2016, Urbanization and Development, Emerging Futures; UN Habitat: Nairobi, Kenya, 2016. [Google Scholar]
  6. National Bureau of Statistics of China. China Statistical Yearbook; China Statistics Press: Beijing, China, 2017. (In Chinese)
  7. Northam, R.M. Urban Geography; Wiley: New York, NY, USA, 1975. [Google Scholar]
  8. Chen, M.; Liu, W.; Tao, X. Evolution and assessment on China’s urbanization 1960–2010: Under-urbanization or over-urbanization? Habitat Int. 2013, 38, 25–33. [Google Scholar] [CrossRef]
  9. Zhang, K.H.; Song, S.F. Rural-urban migration and urbanization in China: Evidence from time-series and cross-section analyses. China Econ. Rev. 2003, 14, 386–400. [Google Scholar] [CrossRef]
  10. Chen, M.; Liu, W.; Lu, D. Challenges and the way forward in China’s new-type urbanization. Land Use Policy 2016, 55, 334–339. [Google Scholar] [CrossRef]
  11. Wang, L.; Zhang, L.; Chen, X.; Gao, X.; Huang, Q. Evaluation on the Efficiency of Smart Land Use under Rational Urbanization. In Proceedings of the 2016 Fifth International Conference on Agro-Geoinformatics, Tianjin, China, 18–20 July 2016; pp. 334–339. [Google Scholar]
  12. Commission, National Development and Reform. National New Urbanization Planning (2014–2020); National Development and Reform Commission: Beijing, China, 2014. (In Chinese)
  13. Yang, D.; Yin, C.; Long, Y. Urbanization and sustainability in China: An analysis based on the urbanization Kuznets-curve. Plan. Theory 2013, 12, 391–405. [Google Scholar]
  14. Lin, G.C.S. Peri-urbanism in globalizing China: A study of new urbanism in Dongguan. Eurasian Geogr. Econ. 2006, 47, 28–53. [Google Scholar] [CrossRef]
  15. Henderson, J.V.; Storeygard, A.; Deichmann, U. Has climate change driven urbanization in Africa? J. Dev. Econ. 2017, 124, 60–82. [Google Scholar] [CrossRef] [PubMed]
  16. Fan, P.; Chen, J.; John, R. Urbanization and environmental change during the economic transition on the Mongolian Plateau: Hohhot and Ulaanbaatar. Environ. Res. 2016, 144, 96–112. [Google Scholar] [CrossRef] [PubMed]
  17. Cohen, B. Urbanization in developing countries: Current trends, future projections, and key challenges for sustainability. Technol. Soc. 2006, 28, 63–80. [Google Scholar] [CrossRef]
  18. Liu, Z.; He, C.; Wu, J. General Spatiotemporal Patterns of Urbanization: An Examination of 16 World Cities. Sustainability 2016, 8, 41. [Google Scholar] [CrossRef]
  19. Liu, Y.; Chen, C.; Li, Y. Differentiation regularity of urban-rural equalized development at prefecture-level city in China. J. Geogr. Sci. 2015, 25, 1075–1088. [Google Scholar] [CrossRef]
  20. Chauvin, J.P.; Glaeser, E.; Ma, Y.; Tobio, K. What is different about urbanization in rich and poor countries? Cities in Brazil, China, India and the United States. J. Urban Econ. 2017, 98, 17–49. [Google Scholar] [CrossRef]
  21. Miller, M.D. The impacts of Atlanta’s urban sprawl on forest cover and fragmentation. Appl. Geogr. 2012, 34, 171–179. [Google Scholar] [CrossRef]
  22. Shen, L.; Shuai, C.; Jiao, L.; Tan, Y.; Song, X. A Global Perspective on the Sustainable Performance of Urbanization. Sustainability 2016, 8, 783. [Google Scholar] [CrossRef]
  23. Zhang, L.; Gao, S.; Wei, B.; Li, Y.; Li, H.; Wang, L.; Ye, B. Effects of Urbanization on Rural Drinking Water Quality in Beijing, China. Sustainability 2017, 9, 461. [Google Scholar] [CrossRef]
  24. Jiang, L.; Deng, X.; Seto, K.C. Multi-level modeling of urban expansion and cultivated land conversion for urban hotspot counties in China. Landsc. Urban Plan. 2012, 108, 131–139. [Google Scholar] [CrossRef]
  25. Li, H.; Wei, Y.H.D.; Huang, Z. Urban Land Expansion and Spatial Dynamics in Globalizing Shanghai. Sustainability 2014, 6, 8856–8875. [Google Scholar] [CrossRef]
  26. Shu, B.; Zhang, H.; Li, Y.; Qu, Y.; Chen, L. Spatiotemporal variation analysis of driving forces of urban land spatial expansion using logistic regression: A case study of port towns in Taicang City, China. Habitat Int. 2014, 43, 181–190. [Google Scholar] [CrossRef]
  27. Camagni, R.; Gibelli, M.C.; Rigamonti, P. Urban mobility and urban form: The social and environmental costs of different patterns of urban expansion. Ecol. Econ. 2002, 40, 199–216. [Google Scholar] [CrossRef]
  28. Zheng, Q.; Wang, K.; Huang, L.; Zheng, Q.; Abubakar, G.A. Monitoring the Different Types of Urban Construction Land Expansion (UCLE) in China’s Port City: A Case Study of Ningbo’s Central City. Sustainability 2017, 9, 2374. [Google Scholar] [CrossRef]
  29. Li, J.; Deng, J.; Wang, K.; Li, J.; Huang, T.; Lin, Y.; Yu, H. Spatiotemporal Patterns of Urbanization in a Developed Region of Eastern Coastal China. Sustainability 2014, 6, 4042–4058. [Google Scholar] [CrossRef]
  30. Zitti, M.; Ferrara, C.; Perini, L.; Carlucci, M.; Salvati, L. Long-Term Urban Growth and Land Use Efficiency in Southern Europe: Implications for Sustainable Land Management. Sustainability 2015, 7, 3359–3385. [Google Scholar] [CrossRef]
  31. Zhou, R.; Zhang, H.; Ye, X.; Wang, X.; Su, H. The Delimitation of Urban Growth Boundaries Using the CLUE-S Land-Use Change Model: Study on Xinzhuang Town, Changshu City, China. Sustainability 2016, 8, 1182. [Google Scholar] [CrossRef]
  32. Li, X.; Zhou, W.; Ouyang, Z. Forty years of urban expansion in Beijing: What is the relative importance of physical, socioeconomic, and neighborhood factors? Appl. Geogr. 2013, 38, 1–10. [Google Scholar] [CrossRef]
  33. Liu, Y.; Huang, X.; Yang, H.; Zhong, T. Environmental effects of land-use/cover change caused by urbanization and policies in Southwest China Karst area A case study of Guiyang. Habitat Int. 2014, 44, 339–348. [Google Scholar] [CrossRef]
  34. Tao, W.; Liu, J.; Ban-Weiss, G.A.; Hauglustaine, D.A.; Zhang, L.; Zhang, Q.; Cheng, Y.; Yu, Y.; Tao, S. Effects of urban land expansion on the regional meteorology and air quality of eastern China. Atmos. Chem. Phys. 2015, 15, 8597–8614. [Google Scholar] [CrossRef]
  35. Long, H.; Tang, G.; Li, X.; Heilig, G.K. Socio-economic driving forces of land-use change in Kunshan, the Yangtze River Delta economic area of China. J. Environ. Manag. 2007, 83, 351–364. [Google Scholar] [CrossRef] [PubMed]
  36. Wu, K.; Zhang, H. Land use dynamics, built-up land expansion patterns, and driving forces analysis of the fast-growing Hangzhou metropolitan area, eastern China (1978–2008). Appl. Geogr. 2012, 34, 137–145. [Google Scholar] [CrossRef]
  37. Deng, X.; Huang, J.; Rozelle, S.; Zhang, J.; Li, Z. Impact of urbanization on cultivated land changes in China. Land Use Policy 2015, 45, 1–7. [Google Scholar] [CrossRef]
  38. Gao, J.; Wei, Y.D.; Chen, W.; Yenneti, K. Urban Land Expansion and Structural Change in the Yangtze River Delta, China. Sustainability 2015, 7, 10281–10307. [Google Scholar] [CrossRef]
  39. Chen, T.; Peng, L.; Wang, Q.; Liu, S. Measuring the Coordinated Development of Ecological and Economic Systems in Hengduan Mountain Area. Sustainability 2017, 9, 1270. [Google Scholar] [CrossRef]
  40. Yang, B.; Xu, T.; Shi, L. Analysis on sustainable urban development levels and trends in China’s cities. J. Clean. Prod. 2017, 141, 868–880. [Google Scholar] [CrossRef]
  41. Shoshany, M.; Goldshleger, N. Land-use and population density changes in Israel—1950 to 1990: Analysis of regional and local trends. Land Use Policy 2002, 19, 123–133. [Google Scholar] [CrossRef]
  42. Deng, J.S.; Wang, K.; Hong, Y.; Qi, J.G. Spatio-temporal dynamics and evolution of land use change and landscape pattern in response to rapid urbanization. Landsc. Urban Plan. 2009, 92, 187–198. [Google Scholar] [CrossRef]
  43. Lin, X.; Wang, Y.; Wang, S.; Wang, D. Spatial differences and driving forces of land urbanization in China. J. Geogr. Sci. 2015, 25, 545–558. [Google Scholar] [CrossRef]
  44. Wang, C.; Liu, Y.; Kong, X.; Li, J. Spatiotemporal Decoupling between Population and Construction Land in Urban and Rural Hubei Province. Sustainability 2017, 9, 1258. [Google Scholar] [CrossRef]
  45. Li, Y.; Li, Y.; Zhou, Y.; Shi, Y.; Zhu, X. Investigation of a coupling model of coordination between urbanization and the environment. J. Environ. Manag. 2012, 98, 127–133. [Google Scholar] [CrossRef] [PubMed]
  46. Min, M.; Hu, T. Analysis on Coordination Development between Population Urbanization and Land Urbanization in Hubei Province. In Proceedings of the Second International Conference on Agro-Geoinformatics, Fairfax, VA, USA, 12–16 August 2013; pp. 378–381. [Google Scholar]
  47. Fang, J. Study on Functional Mechanism and Effectiveness of Land Ticket System in the Process of New-Type Urbanization. In Proceedings of the 20th International Symposium on Advancement of Construction Management and Real Estate; Wu, Y., Zheng, S., Luo, J., Wang, W., Mo, Z., Shan, L., Eds.; Springer: Singapore, 2017; pp. 11–20. [Google Scholar]
  48. Ye, X.; Ma, L.; Ye, K.; Chen, J.; Xie, Q. Analysis of Regional Inequality from Sectoral Structure, Spatial Policy and Economic Development: A Case Study of Chongqing, China. Sustainability 2017, 9, 633. [Google Scholar] [CrossRef]
  49. Zhang, X.; Wu, Y.; Skitmore, M.; Jiang, S. Sustainable infrastructure projects in balancing urban-rural development: Towards the goal of efficiency and equity. J. Clean. Prod. 2015, 107, 445–454. [Google Scholar] [CrossRef]
  50. Hu, W.; Zhang, A. Causality between Urbanization and Farmland Conversion: A Case of Hubei Province. China Land Sci. 2008, 6, 30–35. (In Chinese) [Google Scholar]
  51. Lv, T.; Wu, C.; Li, H.; You, H.; Cai, X. The Coordination and Its Optimization About Population and Land of Urbanization:A Case Study of Nanchang City. Sci. Geogr. Sin. 2016, 36, 239–246. (In Chinese) [Google Scholar]
  52. Zhang, P.; Yang, D.; Li, E.; Li, Y. The Coupled Coordination Relationship between Land Urbanization and Population Urbanization—A Case Study of the Central Plains Economic Region. Econ. Geogr. 2017, 37, 145–154. (In Chinese) [Google Scholar]
  53. Li, Y.; Shu, B.; Wu, Q. Real Estate Price and Land Urbanization: Transmission Mechanism and Empirical Study. China Land Sci. 2013, 27, 52–58. (In Chinese) [Google Scholar]
  54. Chen, F.; Zhang, H.; Wu, Q.; Chen, W. A Study on Coordinate Development Between Population Urbanization and Land Urbanization in China. Hum. Geogr. 2010, 5, 53–58. (In Chinese) [Google Scholar]
  55. Cui, X. Population Urbanization and Land Urbanization in Ethnic Minority Areas: Disequilibrium and Spatial Heterogeneity. China Popul. Resour. Environ. 2014, 24, 63–72. (In Chinese) [Google Scholar]
  56. Deng, F.F.; Huang, Y. Uneven land reform and urban sprawl in China: The case of Beijing. Prog. Plan. 2004, 61, 211–236. [Google Scholar] [CrossRef]
  57. Yew, C.P. Pseudo-Urbanization? Competitive government behavior and urban sprawl in China. J. Contemp. China 2012, 21, 281–298. [Google Scholar] [CrossRef]
  58. Guo, F.; Li, C.; Chen, C.; Gan, J. Spatial-Temporal Coupling Characteristics of Population Urbanization and Land Urbanization in Northeast China. Econ. Geogr. 2015, 35, 49–56. (In Chinese) [Google Scholar]
  59. Dadi, D.; Azadi, H.; Senbeta, F.; Abebe, K.; Taheri, F.; Stellmacher, T. Urban sprawl and its impacts on land use change in Central Ethiopia. Urban For. Urban Green. 2016, 16, 132–141. [Google Scholar] [CrossRef]
  60. Cobbinah, P.B.; Amoako, C. Urban Sprawl and the Loss of Peri Urban Land in Kumasi, Ghana. Int. J. Soc. Hum. Sci. 2012, 6, e397. [Google Scholar]
  61. Peerzado, M.B.; Magsi, H.; Sheikh, M.J. Land use conflicts and urban sprawl: Conversion of agriculture lands into urbanization in Hyderabad, Pakistan. J. Saudi Soc. Agric. Sci. 2018. [Google Scholar] [CrossRef]
  62. Mohan, M.; Pathan, S.K.; Narendrareddy, K.; Kandya, A.; Pandey, S. Dynamics of Urbanization and Its Impact on Land-Use Land-Cover: A Case Study of Megacity Delhi. J. Environ. Prot. 2011, 2, 1274. [Google Scholar] [CrossRef]
  63. Engle, R.F.; Granger, C. Cointegration and Error Correction—Representation, Estimation, and Testing. Econometrica 1987, 55, 251–276. [Google Scholar] [CrossRef]
  64. Johansen, S.; Juselius, K. Maximum-Likelihood-Estimation and Inference on Cointegration—With Applications to the Demand for Money. Oxf. Bull. Econ. Stat. 1990, 52, 169–210. [Google Scholar] [CrossRef]
  65. Davidson, J.; Hendry, D.F.; Srba, F.; Yeo, S. Econometric Modeling of the Aggregate Time-Series Relationship between Consumers Expenditure and Income in the United-Kingdom. Econ. J. 1978, 88, 661–692. [Google Scholar] [CrossRef]
  66. Sims, C.A. Macroeconomics and Reality. Econometrica 1980, 48, 1–48. [Google Scholar] [CrossRef]
  67. Yin, H.; Xu, T. The Mismatch between Population Urbanization and Land Urbanization in China. Urban Plan. Forum 2013, 2, 10–15. (In Chinese) [Google Scholar]
  68. Wu, W.; Niu, S. Evolutional analysis of coupling between population and resource-environment in China. Procedia Environ. Sci. 2012, 12, 793–801. [Google Scholar] [CrossRef]
  69. Li, Y.; Wang, J.; Liu, Y.; Long, H. Problem regions and regional problems of socioeconomic development in China: A perspective from the coordinated development of industrialization, informatization, urbanization and agricultural modernization. J. Geogr. Sci. 2014, 24, 1115–1130. [Google Scholar] [CrossRef]
  70. Sun, P.; Song, W.; Xiu, C.; Liang, Z. Non-coordination in China’s Urbanization: Assessment and Affecting Factors. Chin. Geogr. Sci. 2013, 23, 729–739. [Google Scholar] [CrossRef]
  71. Granger, C. Some Properties of Time-Series Data and Their Use in Econometric-model Specification. J. Econom. 1981, 16, 121–130. [Google Scholar] [CrossRef]
  72. Communique of the State Council. Decision of the State Council on Implementing the Tax-Sharing System of Financial Management System; Communique of the State Council: Beijing, China, 1467; pp. 1462–1467. (In Chinese)
  73. Communique of the State Council. Notice on Further Deepening the Reform of Urban Housing System and Accelerating Housing Construction; Gazette of the State Council of the People’s Republic of China: Beijing, China, 1998. (In Chinese)
  74. Zheng, H.; Wang, X.; Cao, S. The land finance model jeopardizes China’s sustainable development. Habitat Int. 2014, 44, 130–136. [Google Scholar] [CrossRef]
  75. Lee, E.S. Theory of Migration. Demography 1966, 3, 47–57. [Google Scholar] [CrossRef]
  76. Rapp, L. Public service or universal service? Telecommun. Policy 1996, 20, 391–397. [Google Scholar] [CrossRef]
  77. Chan, K.W.; Wan, G. The size distribution and growth pattern of cities in China, 1982–2010: Analysis and policy implications. J. Asia Pac. Econ. 2017, 22, 136–155. [Google Scholar] [CrossRef]
Figure 1. Location of Chongqing in China. Data sources: National Mapping and Geographic Information Bureau Standard Map Service official website.
Sustainability 10 01741 g001
Figure 2. Population urbanization in Chongqing. Data sources: China Statistical Yearbook and Chongqing Statistical Yearbook (1999–2017). Note: the bar chart shows the urbanization rate, while the line chart shows the growth rate.
Sustainability 10 01741 g002
Figure 3. Land urbanization in Chongqing. Data sources: Chongqing Statistical Yearbook (1999–2017).
Sustainability 10 01741 g003
Figure 4. Research technical route.
Sustainability 10 01741 g004
Figure 5. Inverse roots of AR characteristic polynomial.
Sustainability 10 01741 g005
Figure 6. The impulse response of PU and LU. (a) Response of lnLand to lnLand; (b) Response of lnLand to lnUrban; (c) Response of lnUrban to lnLand; (d) Response of lnUrban to lnUrban.
Sustainability 10 01741 g006
Figure 7. Population growth rate and urban growth rate (%).
Sustainability 10 01741 g007
Figure 8. Population–land urbanization quality change trend. Note: f(x)—quality index of PU; g(x)—quality index of LU.
Sustainability 10 01741 g008
Figure 9. Coordinated development of population and land urbanization quality. Note: C—the coordination degree; T—the development degree; D—the coordinated development degree.
Sustainability 10 01741 g009
Table 1. Urban population–land urbanization grade classification.
Coordination DegreeExtremely ImbalancedSerious ImbalanceHighly ImbalancedModerately ImbalancedMild CoordinationCoordinated
Sc.(1,+∞)(0.8–1)(0.6–0.8)(0.4–0.6)(0.2–0.4)(0–0.2)
Table 2. The quality of population urbanization (PU) and land urbanization (LU) quality coordinated development evaluation criteria.
Coordination IntervalCoordinated Development DegreeType of Coordination Development
Disorderly recession interval0.00–0.09Extremely imbalanced
0.10–0.19Serious imbalance
0.20–0.29Moderately imbalanced
0.30–0.39Mild coordination
Transitional harmonic interval0.40–0.49Endangered disorders
0.50–0.59Barely coordinated
Coordinated development interval0.60–0.69Primary coordination
0.70–0.79Moderate coordination
0.80–0.89Good coordination
0.90–0.99High-quality coordination
Comment: According to the comparison of the PU quality index f ( x ) and the LU quality index g ( x ) the following was further divided: When f ( x ) > g ( x ) it was a land lag type; when f ( x ) = g ( x ) it was a synchronous development type; when f ( x ) < g ( x ) it was a population lag type.
Table 3. Population–land urbanization evaluation system.
System EvaluationFactor EvaluationIndicator EvaluationUnitIndex Weights
PU qualityPopulation compositionUrbanization rate%0.137
Secondary and tertiary industry workers’ proportion%0.158
Population qualityRegular institutions of higher education per 10,000 personsperson/10,000 person0.159
Living standardEngel’s Coefficient%0.076
Per capita annual disposable incomeyuan/person0.244
Per capita annual living expenditure for consumptionyuan/person0.226
LU qualityLand input levelPer land investment in fixed assetsyuan/m20.093
Area of paved roads per capitam2/person0.054
Number of employed persons per landperson/m20.119
Inner expenditure of R&D funds per landyuan/m20.094
Land utilization levelPopulation densityperson/km20.087
Land for urban construction per capitam2/person0.072
Land output levelPer capita GDPyuan/m20.111
Total retail sales of consumer goods per landyuan/m20.104
Per land government revenueyuan/m20.101
Level of land sustainable utilizationPer capita green covered aream2/person0.084
Percentage of greenery%0.080
Table 4. Results of unit root test.
VariableADF Test ValuesTest Typep-ValueVerdict
lnURBAN−0.970504(C,T,2)0.2174Instability
ΔURBAN−4.851012(C,T,1)0.0073Stability
lnLAND−0.970504(C,T,1)0.9232Instability
ΔlnLAND−3.595641(C,0,1)0.0177Stability
Comment: Δ indicates the first-order difference; (C,T,K) indicates whether the test equation includes a constant term, a time trend term, and a lag period, where the determination of the lag period is based on the comprehensive determination of Akaike information criterion (AIC) and Schwarz criterion (SC) criteria.
Table 5. ADF test for residual series.
VariableADF Test ValuesTest Typep-ValueVerdict
ε −4.326720(0,0,1)0.0042Stability
Table 6. Granger test results with multiple delay lengths.
Lag Intervals for EndogenousNull HypothesisF-Statisticp-ValueVerdict
1lnLAND does not Granger cause lnURBAN0.823340.3786Accept
lnURBAN does not Granger cause lnLAND9.546070.0075Reject
2lnLAND does not Granger cause lnURBAN0.649720.5396Accept
lnURBAN does not Granger cause lnLAND4.217700.0410Reject
3lnLAND does not Granger cause lnURBAN0.720750.5644Reject
lnURBAN does not Granger cause lnLAND2.071610.1744Reject
Table 7. Results of integer test on vector autoregression model.
EstimatorValue
Determinant resid covariance (dof adj.)6.19 × 10⁻⁸
Determinant resid covariance1.96 × 10−8
Log likelihood96.58378
Akaike information criterion (AIC)−10.32297
Schwarz criterion (SC)−9.646957
Table 8. Results of variance decomposition of lnLAND and lnURBAN (%).
PeriodVariance Decomposition of lnLANDVariance Decomposition of lnURBAN
SElnLANDlnURBANSElnLANDlnURBAN
10.05480565784.3190384915.680961510.0049431320100
20.06069540271.0721078628.927892140.0080712011.47339669898.5266033
30.06090200870.6033711629.396628840.00964404115.1259366784.87406333
40.06161751671.1138698728.886130130.01033630421.7764470178.22355299
50.06195953470.3313458629.668654140.01065042120.7461736979.25382631
60.06320798167.8889842932.111015710.01112185819.0696009580.93039905
70.06405633666.9305935433.069406460.01165993219.0608388480.93916116
80.06474830867.0629535632.937046440.01211025120.023323379.9766767
90.0649507266.7410873133.258912690.01239641520.1292976279.87070238
100.06519849266.2349493933.765050610.01262542419.8909331180.10906689
Cholesky Ordering: lnURBAN lnLAND.
Table 9. Coordinated evaluation of population and land development in Chongqing city.
YearUrban PopulationGrowth Rate (%)Build-Up AreaGrowth Rate (%)Coefficient of DispersionType of Coordination Development
1998935.865.07406.894.370.07A
1999981.114.84419.042.990.24B
20001013.883.34426.741.840.29B
20011058.124.36452.035.930.15B
20021123.126.14559.8923.860.59C
20031174.554.58654.9516.980.58C
20041215.423.48647.78−1.091.91D
20051265.954.16732.8713.140.52C
20061311.293.58810.7110.620.50C
20071361.353.82872.707.650.33B
20081419.094.24933.046.910.24B
20091474.923.931026.8410.050.44C
20101529.553.701136.5310.680.49C
20111605.965.001325.4416.620.54C
20121678.114.491324.94−0.041.02D
20131732.763.261395.865.350.24B
20141783.012.901470.125.320.29B
20151838.413.111529.154.020.13A
20161908.453.811494.47−2.273.95D
Note: A—coordinated growth; B—mild disorders; C—moderate disorders; D—extreme imbalance.
Table 10. The coordinated development of PU and LU in Chongqing city.
Yearf(x)g(y)CTDLType of Coordination Development
199800.1600.08
19990.040.160.410.10.21.45Moderately unbalanced population lags
20000.070.160.720.120.291.24Moderately unbalanced population lags
20010.110.160.930.140.361.03Mild coordination population lags
20020.180.120.920.150.370.97Mild coordination land lags
20030.230.110.770.170.361.25Mild coordination land lags
20040.280.170.880.230.451.07Endangered disorders land lags
20050.340.190.850.270.481.06Endangered disorders land lags
20060.390.220.850.310.511.12Barely coordinated land lags
20070.420.280.920.350.571.11Barely coordinated land lags
20080.470.350.960.410.631.06Primary coordination land lags
20090.530.40.960.470.671.09Primary coordination land lags
20100.590.480.980.540.731.07Moderate coordination land lags
20110.670.560.980.620.781.06Moderate coordination land lags
20120.730.640.990.690.831.04Good coordination land lags
20130.810.680.980.750.861.03Good coordination land lags
20140.870.720.980.80.891.02Good coordination land lags
20150.930.770.980.850.911.05High-quality coordination land lags
201610.870.990.940.96 High-quality coordination land lags
Note:f(x)—quality index of PU; g(y)—quality index of LU; C—the coordination degree; T—the development degree; D—the coordinated development degree; L—the coordinated development situation.

