Article

Energy Efficiency in Logistics: An Interactive Approach to Capacity Utilisation

Department of Technology Management and Economics, Chalmers University of Technology, 41296 Gothenburg, Sweden
Sustainability 2018, 10(6), 1727; https://doi.org/10.3390/su10061727
Submission received: 30 April 2018 / Revised: 20 May 2018 / Accepted: 23 May 2018 / Published: 25 May 2018
(This article belongs to the Special Issue Sustainable Freight Transport)

Abstract

:
Logistics operations are energy-consuming and impact the environment negatively. Improving energy efficiency in logistics is crucial for environmental sustainability and can be achieved by increasing the utilisation of capacity. This paper takes an interactive approach to capacity utilisation, to contribute to sustainable freight transport and logistics, by identifying its causes and mitigations. From literature, a conceptual framework was developed to highlight different system levels in the logistics system, in which the energy efficiency improvement potential can be found and that are summarised in the categories activities, actors, and areas. Through semi-structured interviews with representatives of nine companies, empirical data was collected to validate the framework of the causes of the unutilised capacity and proposed mitigations. The results suggest that activities, such as inflexibilities and limited information sharing as well as actors’ over-delivery of logistics services, incorrect price setting, and sales campaigns can cause unutilised capacity, and that problem areas include i.a. poor integration of reversed logistics and the last mile. The paper contributes by categorising causes of unutilised capacity and linking them to mitigations in a framework, providing a critical view towards fill rates, highlighting the need for a standardised approach to measure environmental impact that enables comparison between companies and underlining that costs are not an appropriate indicator for measuring environmental impact.

1. Introduction

Actors in logistics and freight transport face increased pressure to reduce the climate impact of their operations and to become more environmentally sustainable. According to the European Commission [1], road transport alone accounts for 70 percent of all greenhouse gas (GHG) emissions from transport. To tackle the problem, EU member countries committed to reducing GHG emissions in the transport sector by at least 60 percent by 2050 compared to 1990. In 2013, transport alone consumed 63 percent of the world’s oil [2]. A significant objective to increase environmental sustainability is the reduction of energy consumption in the freight transport sector [2]. A key challenge for managers is to respond to the increase in transport volume [3], which stems from consumers’ desire for more products as well as longer transport distances because of global supply chains and international production [4,5,6]. One way to foster sustainable development in freight transport is to focus on increasing the energy efficiency [7]. Here, energy-efficient freight transport needs to be approached in its wider system that is, the logistics system. To radically decrease the energy consumption from transport, technological advances alone will not be enough; the task also requires changes in behaviour and structure of the logistics system [8,9], as well as inclusion of the end-consumer in a wider and extended system [10].
Logistics systems can become more energy-efficient through behavioural changes among end-consumers, shippers, and logistics service providers (LSPs). One area of potential improvements is to consider unutilised capacity [11,12]. The current literature has a strong focus on reducing the energy consumption in freight transport by increasing the load factor [12,13], that is, offering a narrow view of transport capacity.
This paper extends the view on capacity utilisation in freight transport by considering the larger system in which it operates. The need to view freight transport in its wider system when enhancing sustainability has been recognised in the current body of knowledge, such as in the sustainability framework by Turki, et al. [14], who have approached transport in connection to manufacturing, remanufacturing, and warehousing. Accordingly, this research not only considers the capacity utilisation in freight transport, but also in the adjacent logistics activities. By applying a systems perspective, the interactive nature of the different components of capacity in the logistics systems becomes more apparent, which implies that capacity utilisation is related to the different levels of the logistics system. Accordingly, this paper builds upon the notion that energy efficiency in every logistics activity can be increased if the capacity is used to its full potential. This may, for example, be the case through supply-chain-related initiatives, such as collaboration and supplier education, as a means to address energy efficiency [15]. Capacity as an interactive concept within the overall logistics system, and especially between the actors in the supply chain, has not been studied in detail. Viewing capacity from a systems perspective is necessary in order to identify all of the improvement potential. This research tries to shed light on the following research questions, namely: (1) Where in the logistics system is unutilised capacity available that will improve energy efficiency? (2) How can this unutilised capacity be mitigated? Against this background, the purpose of this paper is to take an interactive approach to capacity utilisation so as to contribute to sustainable freight transport and logistics, by identifying the causes and mitigations of unutilised capacity.
By taking an interactive approach to capacity utilisation, this paper contributes insights to the literature on sustainable logistics and road freight transport, most practically by developing a framework of capacity utilisation to increase the energy efficiency in logistics. At the same time, by highlighting where the unused capacity in logistics systems can be found and proposing mitigations, the paper offers important implications for the transport industry, by broadening the understanding of capacity utilisation.
In what follows, literature is reviewed and presented in a frame of reference in the next section. In addition, a conceptual framework is proposed, which stems from the literature. The following section explains the method, including the sampling, data collection and analysis, and research quality. The findings from the interviews are presented in ‘Results’. After that, a discussion of the findings is presented, and the framework is developed. Lastly, the paper concludes with managerial implications and theoretical contributions and proposes directions for future research.

2. Frame of Reference

To illustrate the role of capacity utilisation in logistics and road freight transport, a conceptual framework was developed. The framework’s building blocks were derived from a review of the literature on freight transport, logistics, and supply chain management (SCM), with a focus on the logistics-energy domain and environmental sustainability. A combination of keywords (logistics, energy logistics, sustainable logistics, supply chain, supply chain management, freight transport, energy efficiency, energy, and sustainability) were used, and depending on the type of journal, the keywords were searched for alone or in combination. For this, the top-ten ranked journals of logistics and SCM in the Nordic countries [16], one journal focusing on sustainability, and two journals focusing on the energy domain were chosen, namely: the European Journal of Purchasing and Supply Management, International Journal of Logistics Management, International Journal of Logistics: Research and Applications, International Journal of Physical Distribution and Logistics Management, International Journal of Retail & Distribution Management, Journal of Business Logistics, Journal of Supply Chain Management, Supply Chain Management: An International Journal, Logistics Management and Supply Chain Management Review, and Sustainability, Energy and Journal of Cleaner Production. Further papers were added through ‘snowballing’, that is., searching more openly based on references and keywords from the articles that were identified in the structured part of the review. Abstracts and papers were read to identify those that were related to the research. In a further step, this literature was read and analysed regarding how it addressed ‘capacity utilisation’ in connection with ‘energy efficiency/consumption’.

2.1. Energy Efficiency in Logistics and Road Freight Transport

Energy is a source of power that is needed to operate logistics activities [17]. Although road freight transport can be powered with different energy sources (e.g., fossil fuels, bio fuels, electricity from nuclear, or alternative energy), fossil fuels are still the most common form of energy source and can be traced back to the era when fossil fuels were considered inexpensive and plentiful [18].
Halldórsson and Kovács [19] point out that energy efficiency plays an important role in logistics and SCM. A positive research trend on the topic has been highlighted by Centobelli, et al. [7]. The European Parliament and the Council of the European Union [20] has defined energy efficiency as “the ratio of output of performance, service, goods or energy, to input of energy” and energy efficiency improvement as “an increase in energy efficiency as a result of technological, behavioral and/or economic changes”. By extension, achieving a high level of energy efficiency means reducing the total energy consumption given a particular level of output [21]. The logistics literature mainly addresses energy efficiency in three broad terms, namely: the interplay of activities that influence energy efficiency (what), the inclusion of all actors (who), and the consideration of system boundaries (where) to measure energy efficiency.
Firstly, the literature focuses on the interplay of different activities that increase the energy efficiency in logistics. Aronsson and Huge-Brodin [8] have identified consolidation, standardisation, information flow, and virtual warehousing as drivers of efficiency and environmental performance. Later, Wolf and Seuring [22] identified collaboration (i.e., integration, cooperation, and information sharing) as the most important component for the successful management of supply chains. More specifically, Pfohl and Zöllner [23] described efficiency in logistics as the result of factors, such as environmental relations, product lines, production, technology, and the size of organisations, while Piecyk and McKinnon [24] described energy efficiency as being influenced by the weight of goods, empty running, and average vehicle energy consumption, among other factors. In contrast, Kalenoja, et al. [25] identified energy consumption, delivery times, transport speed, flexibility, reliability, and vehicle load as influential components in energy efficiency. According to Plambeck [15], efficiency can be increased by the harmonisation and coordination of the different operations in supply chains. More recently, Bottani, et al. [26] outlined an integrated approach for achieving efficiency that involves the pooled management of packaging, procurement, warehousing, and transport activities.
Secondly, when discussing the actors’ involvement in energy efficiency in logistics and road freight transport, the literature focused foremost on the logistics service providers (LSPs) and shippers [15,22,23] and the harmonisation, coordination, and collaboration between them (e.g., know-how transfer to suppliers and long-term commitment) [15] and the supplier selection [27]. Energy efficiency also depends on information exchange between the actors; Yuan, et al. [28] developed a model to study the effect of the carbon emission information asymmetry between different actors on the supply chain performance from carbon trading. However, the impact of the end-consumer on energy efficiency in logistics and road freight transport, especially in connection to the last-mile deliveries and consumer transport, has been attracting more interest in literature over the years [10,29,30]. Since different actors have different impacts on energy efficiency, it is important to examine who takes what action.
Thirdly, clear system boundaries have to be defined, and indicators for measurement must be chosen [25] so as to determine where in the system the energy efficiency is measured and the activities are taken. Kalenoja, et al. [25] suggested different settings of system boundaries; for example, a narrower definition of system boundaries that includes only inbound and outbound logistics or a broader view including several suppliers and reverse logistics. The literature further suggests an expansion of system boundaries through the inclusion of, for example, top-management as enabler for environmental-friendly purchasing of transport services [31], reverse logistics [32], transport during the last mile [30] and, in particular, consumer transport [10,29,33,34], and other suppliers in the network [15,22]. Browne, et al. [10], who assessed the energy consumption of different product supply chains, found that the energy consumption that was used to transport goods during the last mile to the point of consumption was greater than that of all of the upstream transport activities combined. Rizet, et al. [35] and Brown and Guiffrida [34] identified the potential of saving energy in the last mile. The reason for such inefficiency in private transport during the last mile was unutilised capacity in private vehicles. Aronsson and Huge-Brodin [8] emphasised the complexity of logistics systems and therefore a macro-perspective to view the supply chain.
Guided by the aim and the research questions of the study to analyse where the unutilised capacity can be found in the logistics system and how it can improve energy efficiency, several themes have emerged from the literature review. The literature was set in relation to the capacity utilisation. An overview of themes that emerged from literature is provided in a review of the literature regarding energy efficiency (Table 1).
The literature was reviewed to address the energy efficiency in the logistics system starting in road freight transport and considering the adjacent logistics activities. The selected literature was then analysed regarding the capacity utilisation, which has been discussed in the following section.

2.2. Capacity Utilisation in Logistics and Road Freight Transport

Often, the capacity is associated with the loading capacity (i.e., the load factor), which is the physical ability of a vehicle to carry a freight for a certain length of time [40]. In that view, trucks are key units of capacity in road freight transport. However, capacity captures more than what the simple description outlines. Hayes, et al. [41] described capacity as a complex interaction of different components, including physical space, equipment, operating rates, human resources, system capabilities, company policies, and the rate and dependability of the suppliers. According to the literature, the concept of capacity developed from an understanding of the physical space [9,10] and only later became an indicator of the energy efficiency [25] and a factor in the logistics systems [34].
Wu and Pagell [42] found that different initiatives, including reducing the number of trips, activating an efficient information system, and pursuing collaboration, could increase the capacity utilisation and reduce the impact of energy use on the environment. Chapman [9] highlights the combining loads of different operators as a way to increase the capacity utilisation. Furthermore, Liimatainen and Pöllänen [36] discuss the components that are closely connected to capacity utilisation, including the average load on laden trips, empty running, and average vehicle energy consumption, which helps to improve energy efficiency in logistics. Rizet, et al. [35] pinpoint the time that is taken for activities, costs, service levels, and polices as factors influencing the capacity utilisation, and with that, energy consumption. Brown and Guiffrida [34] highlight that the particular capacity in private vehicles is not used to its full capacity. Furthermore, just-in-time delivery, with its small loads in rapid time, is responsible for unutilised capacity [9,39,43]. Vehicle loading, empty running, vehicle time utilisation, and deviation from schedule, are proposed by McKinnon and Ge [38] as key performance indicators (KPIs) in order to evaluate capacity utilisation.
The literature addresses the capacity utilisation as a narrow concept and only views it on one system level at a time. This research extends this view and proposes a system perspective on the capacity utilisation.

2.3. Systems Perspective on Capacity

A systems perspective on capacity entails diverse components and acknowledges their complexity and interactivity, which, in turn, can help illuminate the interactive nature of capacity utilisation. Supply chains, as well as environments, consist of various, complex subsystems [33] whose management can be difficult. This is based on the assumption that the systems are open [44]. The supply chain actors have to cooperate and share information as well as risk. Systems thinking enables individual actors to plan their logistics operations (e.g., transport, inventory, and purchasing) more efficiently and effectively. To acknowledge humans’ roles and purposes in supply chains, this approach belongs to the school of soft systems thinking [44].
Using the systems perspective can also clarify the interconnection of energy efficiency and capacity utilisation in the logistics system, starting with road freight transport. In short, capacity utilisation leads directly to energy efficiency and fosters sustainable development. To interlink different components that set the conditions for capacity utilisation and understand its systemic nature, the research addresses the causes and mitigations at various levels of the logistics system.
The literature was reviewed to address the energy efficiency in the logistics system and was then analysed regarding the capacity utilisation as a means to energy efficiency. The concept of the capacity was chosen to highlight the improvement potential, following the structure of the activities (what), actors (who), and areas in the logistics system, where improvement is possible (Figure 1). This conceptual framework has served as the basis for constructing the interview guide and collecting data. The factors that set the conditions for capacity utilisation within the categories of activities, actors, and areas in the logistics system were derived from the empirical data.

3. Method

To validate and develop the conceptual framework, qualitative data in the form of semi-structured interviews were collected. The data generation aimed to investigate the causes of unutilised capacity on different system levels, by taking an interactive approach to capacity utilisation. From the empirical data, the causes of the unused capacity in logistics and mitigations were derived, which were linked to each other.

3.1. Sampling

To access different perspectives on the logistics system, a multi-actor approach was used, with a sample of LSPs, their customers (i.e., shippers), and a consultant, who worked to improve energy efficiency by implementing lean management, an approach that seeks to reduce waste and improve services. By interviewing different LSPs and their direct customers, different product supply chains with cooperating actors could be reconstructed, which in turn facilitated an investigation into the interactive nature of capacity, with energy efficiency positioned at the intersections between the LSPs and their customers.
In total, 17 semi-structured interviews, with representatives of nine different companies, were conducted (Table 2). All of the interviewees, except for the consultant on lean management, had worked as logistics or supply chain managers with high-level managerial responsibility in their respective organisations. Holding such a position was a selection criterion, thereby ensuring a profound knowledge of the company’s logistics activities. The consultant was added to the sample so as to gather an additional perspective and to provide ideas on utilising capacity in the logistics system.
The first company was chosen out of convenience [45]. Other companies were added to encompass the desired range for a multi-actor approach, until theoretical saturation was reached (i.e., when the interviews had provided no further new information) [46]. Table 2 provides a brief overview of the size and scope of participation of all of the sample companies.
The interviews focussed on the transport into and within urban areas, which was regarded as the energy-intensive part of the supply chain, for example [10], and the focus was set on the road freight transport and its adjacent logistics operations.

3.2. Data Collection and Analysis

Each of the interviews lasted 60 to 90 min, were semi-structured and involved open-ended questions that encouraged the interviewees to elaborate upon their experiences regarding capacity utilisation. The interview guide was led by the aim of the study, the previous review of the literature, and the conceptual framework. During the interviews, comprehensive notes were taken; only one interview was audio recorded and transcribed, because all of the other interviewees indicated that they would feel more comfortable if the interview was not audio recorded.
The data that were collected during the interviews were analysed with the qualitative data analysis software NVivo, which involved coding the interview transcription and notes into nodes. As a start, the themes that emerged from the literature review (Table 1) were used as nodes, and other nodes were added during the analysis process, when necessary. The data were repeatedly analysed and sorted under the nodes. Then, the nodes were further reduced and could be summarised in the three categories from the conceptual framework, namely, the actors, activities, and areas in the logistics system. The categories explained who (i.e., actors) and what (i.e., activities) created the unutilised capacity and where (i.e., areas in the logistics system) it was created. This reduction of nodes helped to provide a better overview of the problematic areas [47]. Moreover, the framework could be validated by starting out with the themes from the literature and developing them further, which again resulted in the system levels from the conceptual framework.
The data were analysed, and both the causes and mitigations were derived following the idea behind the framework by Lee, et al. [48] on causes and counteractions. Their framework was used, given its similarities between the specific problems that were investigated. The causes of the unutilised capacity derived from the interview data and were grouped into the three categories, which simplified the subsequent process of identifying the mitigations. Alongside the causes, excerpts were extracted from the data as examples. The presented data clearly showed which result was extracted from which interview. These excerpts were reduced during an iterative process that involved repeatedly reviewing the data. In another step, the causes, which were derived from the data, were linked to the corresponding mitigations. During the data analysis, the literature was used as a reference so as to generate a deeper understanding of the specific issues that were investigated, as well as to determine whether the suggested mitigations had already been proposed in previous research.

3.3. Research Quality

To ensure a high quality of research, the design of the study was constructed carefully. The literature review not only provided an overview of the topic and insights into the systems thinking, but it also informed the analytical framework, based on Lee, et al. [48].
Since the basis for the interview guide emerged from the literature, a high relevance of the interview questions, relative to the studied topic, was ensured. Since the empirical data was to map the different perceptions of the actors in logistics, the qualitative criteria—trustworthiness and its four dimensions of credibility, transferability, dependability, and confirmability [49]—were used to evaluate the quality of research. Firstly, to ensure credibility, the research findings were validated with the study’s participants by submitting the findings to the participants, so as to ensure correction of the understood world. Secondly, transferability, or the general applicability of the findings, was ensured by generating a sufficient richness of detail, by repeating the interviews with four of the nine participants. Thirdly, dependability was ensured by keeping records of all of the phases of the research process and documenting all of the method-related decisions. Furthermore, the author’s peers viewed and discussed those materials with the author. Fourthly, and finally, confirmability was ensured by confirming that the findings were free of bias by comparing the data that were gathered with the data in the related literature.

4. Results

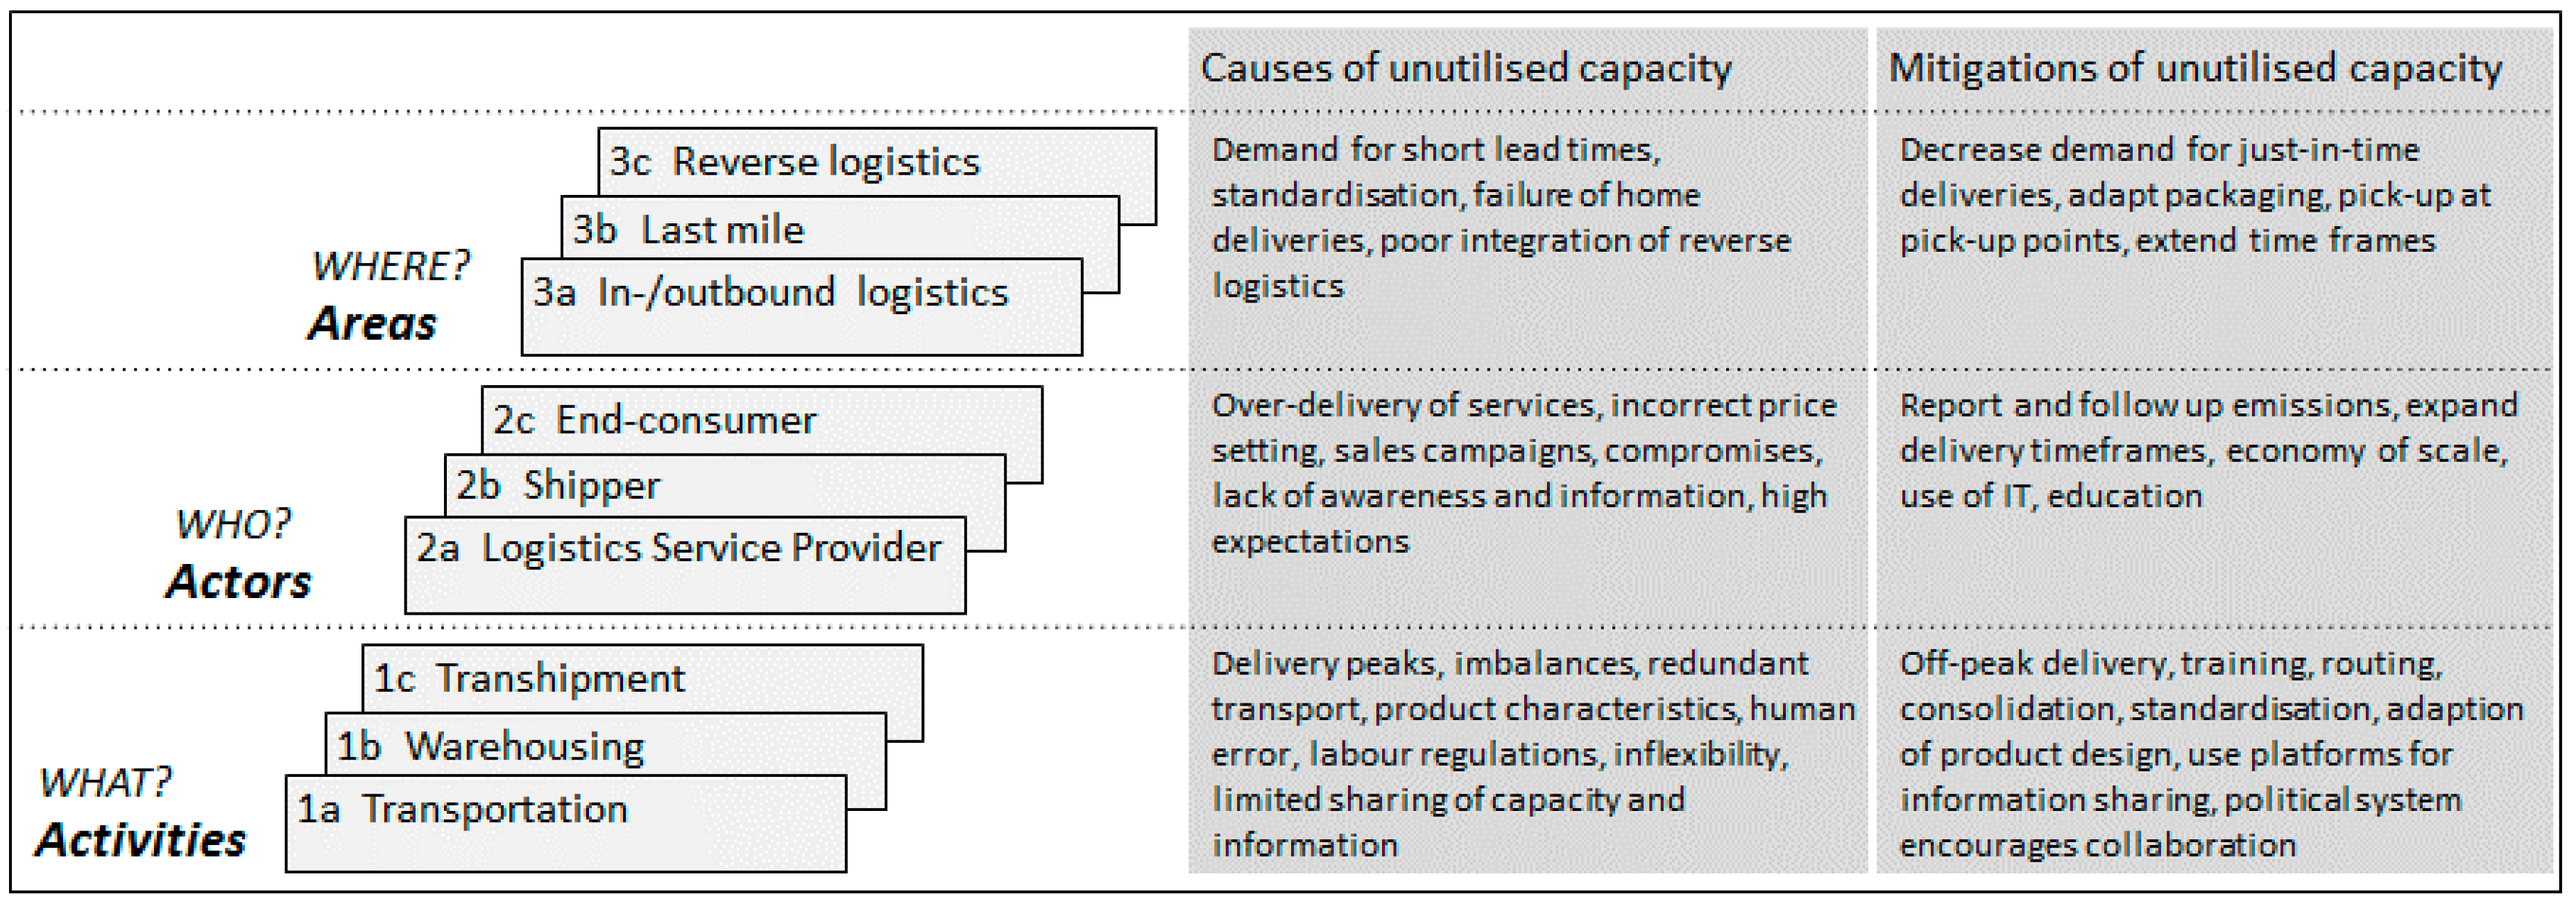
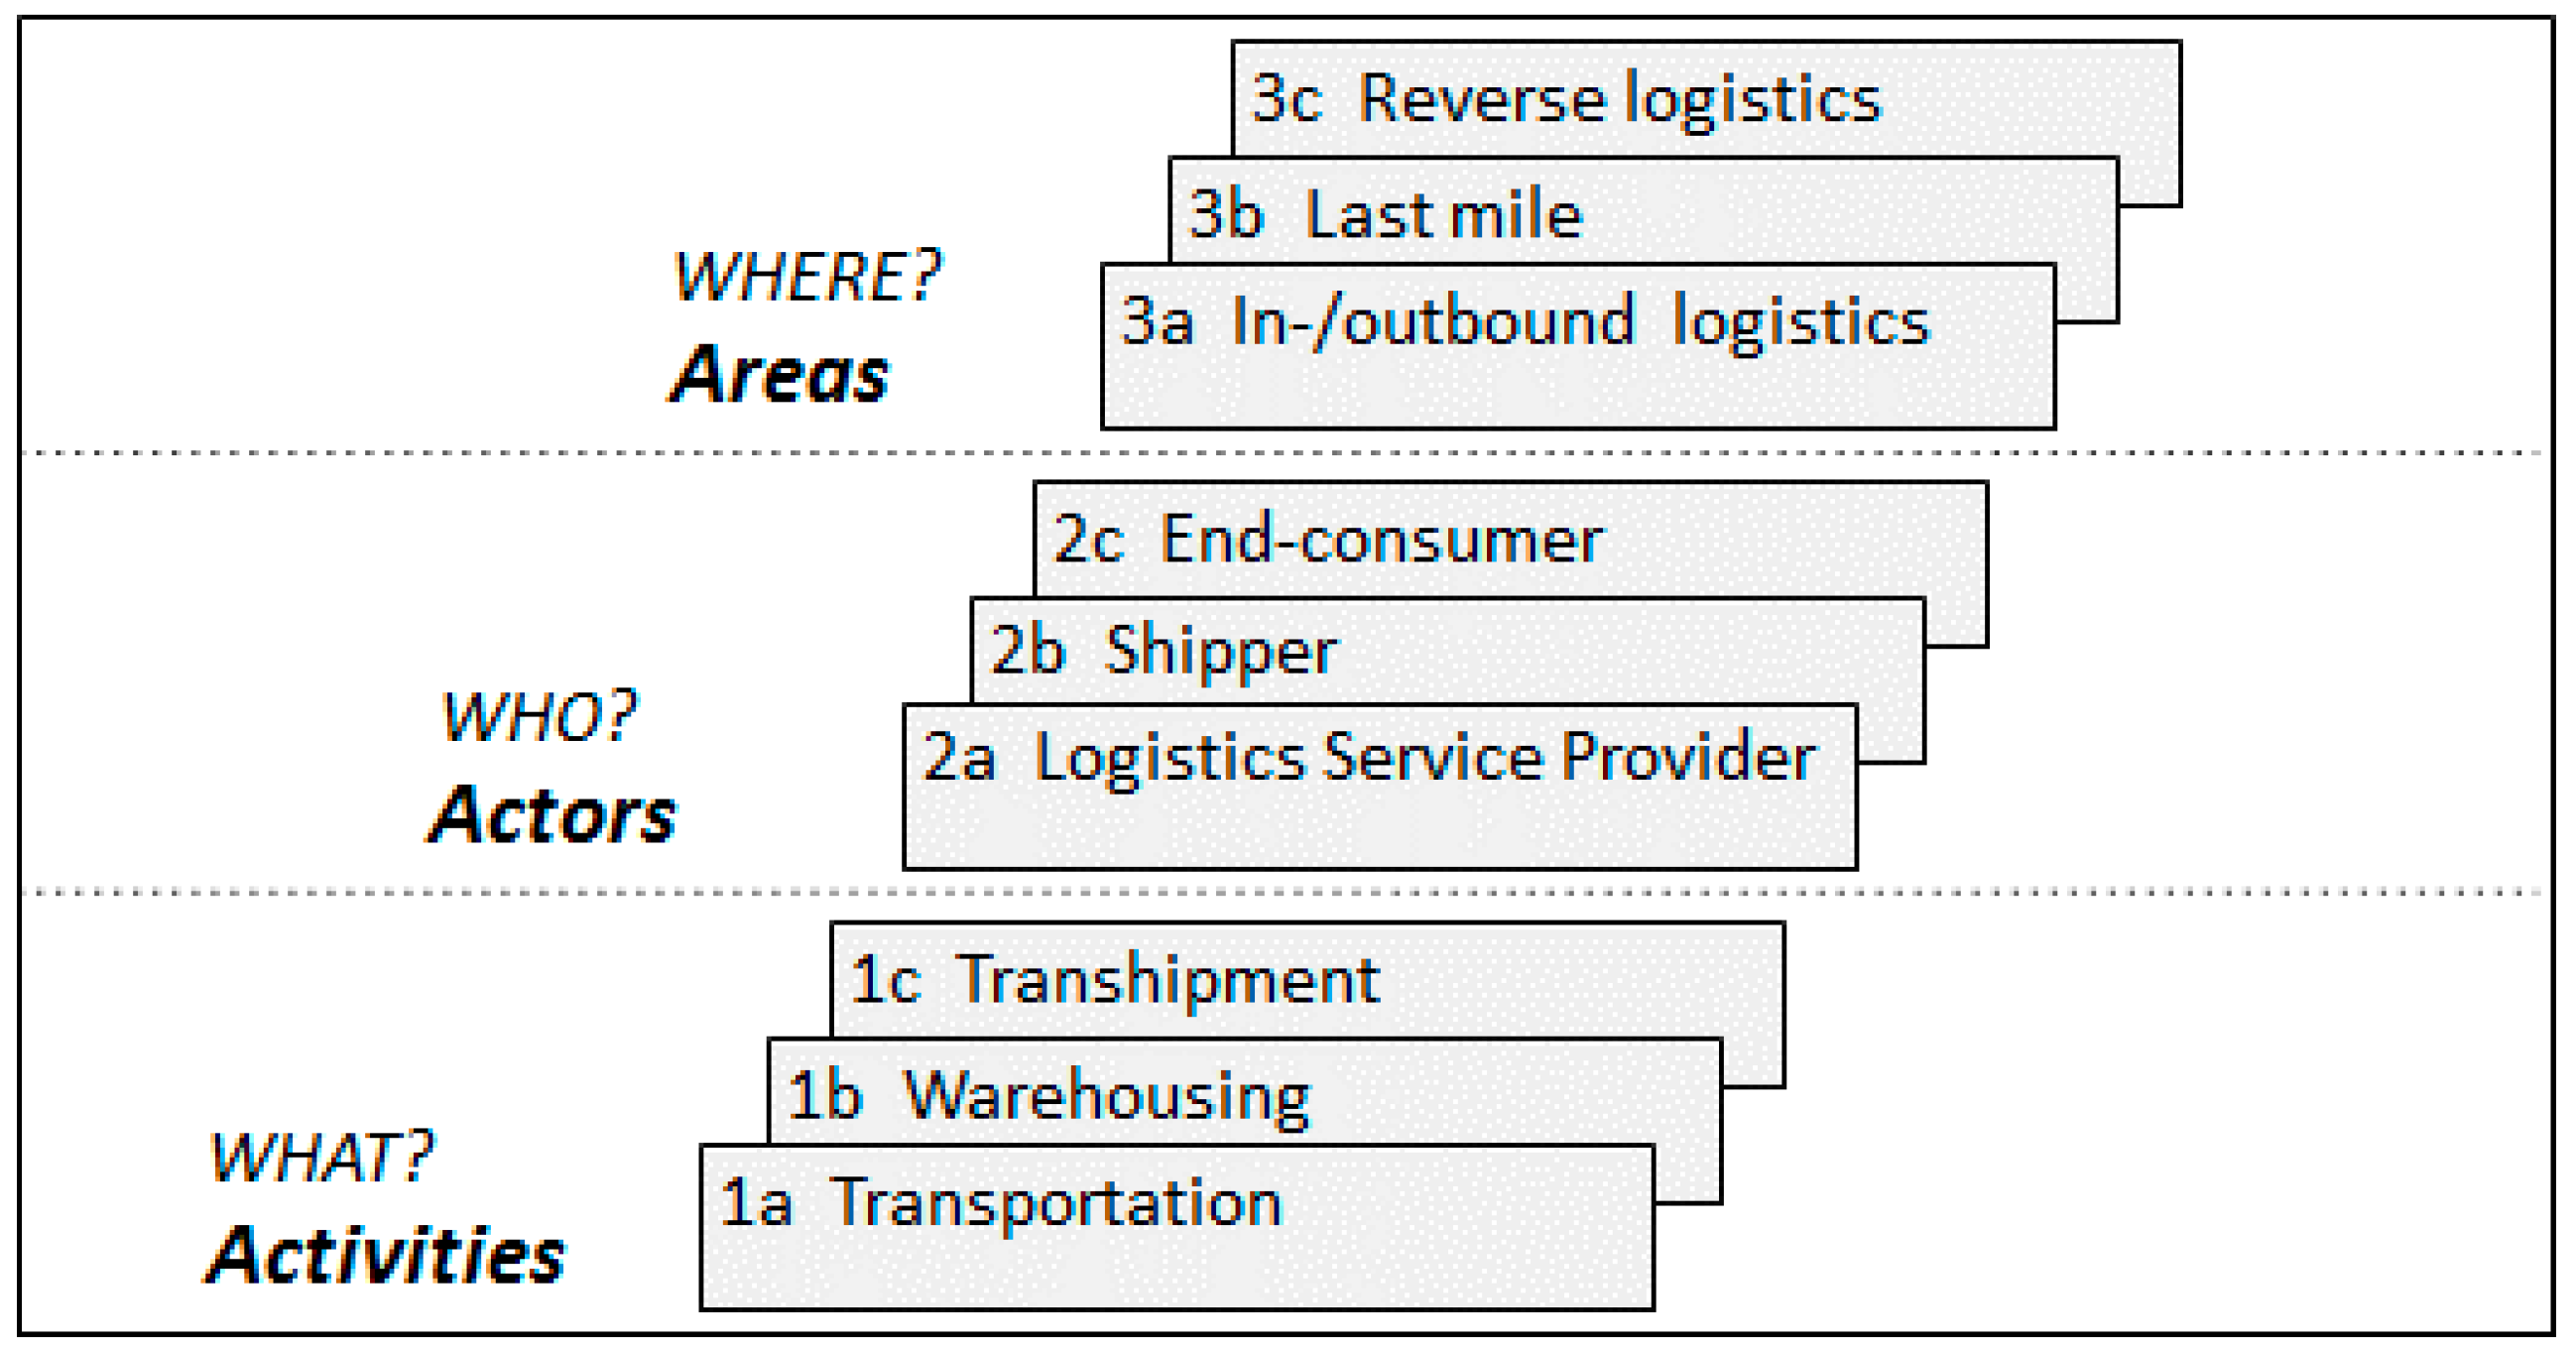
The data from interviews were structured around three categories, namely, the activities, actors, and areas in the logistics system, so as to identify the causes of the unutilised capacity and corresponding mitigations.

4.1. Causes of Unutilised Capacity

To identify and conceptualise the causes of the unutilised capacity in the logistics system that created inefficiencies, the data were structured around the categories and system levels.

4.1.1. Activities

The activities refer to what causes unutilised capacity in the logistics system and thus increases the energy consumption. In general, unutilised capacity stems from how parcels and other shipments are handled during transport, in the warehouse, and during transhipment (see Table 3).
Transport: The way in which the trucks are loaded is crucial to energy efficiency in transport, and is mostly limited by the goods and their characteristics, as it was explicitly stated by the representatives of companies D and F. Another restriction was that the goods may not be stacked above shoulder height because of the labour regulations (evidence came from company D, F, G, and H). Other causes of unutilised capacity that were discussed during the interviews were the empty running, hanging garments, and idle loading units at the wrong places (such as by companies D, F, and G). The most popular pickup times are during the mornings and the delivery times are during the afternoons, which overlaps with rush hours, and the drivers are already exposed to constant pressure to meet deadlines. Companies E, F, and G mentioned that the constant pressure of time and traffic congestion could decrease the capacity utilisation. Last-minute changes in routing because of, for instance, additional express deliveries, were explicitly mentioned by companies F and G as the cause of inefficiencies. Additionally, the ability to load shipments depended on the departure and arrival times. If times had to be strictly kept, then a unit might not have been loaded on a truck in time. In that case, a shipment might have to wait an entire day at a terminal until it was distributed, thereby creating unutilised capacity in the truck, which would have to leave without it. Company F pointed out that a high volume of parcels and groupage which are needed to fill the logistics system, because the margins for single shipments are so low that only large volumes make the logistics business profitable, lead to further problems. Filling one system with a sufficient volume of shipments often meant that the shipments were transferred from other systems. For instance, filling a truck might require taking products from a more energy-efficient system (e.g., rail), which would leave behind unutilised capacity. Moreover, over-ordering products increases the return trips. Imbalances in the volume flow and empty running were additional causes of unutilised capacity (from companies B, F, G, and H).
Warehousing: During the picking process in the warehouse, human errors could occur, as stated by companies D and E. Large volumes that suddenly need handling, incorrectly implemented automation, and dysfunctional information technology (IT) could also generate inflexibility and unutilised capacities in warehouses, as could the instances when standardisation was impossible (explicitly mentioned by companies B and D). However, the interviewees from companies F, G, and H indicated exactly the contrary—that, in some cases, the standardised processes were responsible for unutilised capacity.
Transhipment: The interviewees from companies F and H revealed that the consolidation of goods was often criticised by the shippers, who did not want to share the distribution capacity that is, after all, a factor of their competitiveness. Furthermore, information was often not sufficiently shared in either internal communications or communications among the different actors, as stressed by the interviewees from companies A and B. In particular, the information flow often lacked the details that were necessary for all of the actors and departments to meet their various interests, the result of which was unutilised capacity. The relationships among the different actors rarely occurred on an equal footing. As the interviews with companies F and G showed, collaboration often involved rules that were dictated by stronger, larger actors, whereas the weaker actors had no choice but to follow the lead. For example, a shipper might demand certain routes, loading specifications, and delivery times, which prompted unutilised capacities for the transport provider. The interviewees from companies F and D also revealed that the so-called ‘big players’ in logistics cannot collaborate because of the laws against cartelisation, which prevented the LSPs from forging a unified strategy with an environmental-friendly agenda and reducing energy consumption.

4.1.2. Actors

The system levels under the category of Actors encompassed the causes that were directly because of the LSPs, shippers, or end-consumers, if not a combination of those parties. These causes are referred to as ‘who’ is responsible for the unutilised capacity in logistics and, in particular, road freight transport (Table 4).
Logistic service provider: LSPs continuously expand their service offerings and often provide an over-delivery of services, as stressed by the companies F and G. For example, the LSPs delivered the products in express deliveries when the express deliveries were unnecessary, offered services at unprofitable prices, and pursued volumes that they needed to fill the system, all to maintain or strengthen their market share. However, an interviewee from company F emphasised that, since the prices do not often reflect the real costs, the services are often offered in excess of the customer demands, meaning that unnecessary capacities are created. In short, the LSPs’ top priority was often to fulfil the customers’ demands regardless of the energy consumption and its consequences (evidence from companies F, G, and H). For example, whereas small shippers contracted standardised services, larger ones wanted to influence the logistics process by, for instance, specifying certain routes. In response, LSPs had to adapt their own logistics processes and resources, which often produced inefficient solutions. Companies F and G mentioned that large LSPs tend to offer a broad range of services, but cannot compete in terms of the price and efficiency with the smaller actors that offer niche services, but by trying to keep their dominant market share unutilised capacity is generated. When an LSP outsourced transport to a transport provider, it also delegated all of the responsibility for the fill rates and fuel consumption to the transport provider (evidence came from companies A, B, F, and G). Eschewing responsibility, being inflexible in making changes in transported volumes, and being unable or unwilling to mix groupage and parcels in the same vehicles (as mentioned by companies B and F) created further unutilised capacity in the system.
Shipper: Among the actors, the shippers cause unutilised capacity because of the imposing requirements (as mentioned by companies F, G, and D), for example, for delivery and pickup timeframes that LSPs and transport providers could not meet during rush hours or because of congestion. If delivery timeframes were not met, then the LSPs often had to return to the point of delivery after agreeing to a new delivery time. Another cause, which was mentioned by the same three companies, was inflexible delivery timeframes among the different shippers at the same location. For example, although the different shops in a mall all received goods from the same LSP, because some shops wanted to receive deliveries one hour before opening and others during business hours, the LSP had to make several trips to the same address. Moreover, unutilised capacity was created, as mentioned by four of the companies (D, E, F, and G), since the customers preferred to receive goods as early as possible and to post the deliveries as late as possible. This made it impossible to deliver and collect the parcels at once. Furthermore, shippers, as commented on by companies B and F, often over-ordered to ensure enough capacity in the case of high demand; however, it often remained unutilised.
End-consumer: The behaviour of the end-consumers drives the energy consumption in transport, although the end-consumers are often unaware or dismissive of their impact on fuel consumption, as mentioned by companies F and G. Furthermore, the same interviewees explained that, although products might contain information about their organic origins, they do not contain information about their GHG footprint that is related to transport. The end-consumers are often unaware of the consequences of their product choices, relative to GHG emissions. Furthermore, the sales campaigns that offered ‘free’ home deliveries, shipments without declared surcharges for delivery, and packages including retour papers, encouraged end-consumers to order and return more goods (evidence from companies D, E, and F). The interviewees from companies D and F explained that, because of the increased demand for express deliveries and the increased expectations about the exact delivery times, as well as a high failure rate of unattended home deliveries, the end-consumers were responsible for a great deal of energy consumption in the last mile of the supply chain. Almost all nine of the interviewees highlighted that end-consumers almost always preferred the fastest, most-convenient logistics solution.

4.1.3. Areas in Logistics System

The areas in the logistics system describe where the unused capacity originated, particularly in the context of in- and out-bound logistics, last-mile distribution, and reverse logistics (see Table 5).
Inbound and outbound logistics: A major cause of unutilised capacity in the supply chain, as stated by companies A, B, C, D, and F, is the steady demand for short lead times and just-in-time deliveries. The interviewees mentioned that the end-consumers increasingly requested express deliveries, which affects the whole supply chain. Furthermore, companies D and G mentioned that shippers therefore had to order smaller batches and could not fill truck loads, which precluded any economy of scale. The just-in-time deliveries are fuel intensive, given the high number of small shipments that are involved, and the vehicles often cannot be loaded to their full capacity. Such just-in-time deliveries originated from the existence of smaller warehouses and the inability or unwillingness of shippers tie up capital in products.
Last mile: With e-commerce, many small parcels were sent to end-consumers’ homes instead of in full pallets to the retailers (evidence from C, D, F, and G). The steady growth in the abundance of such parcels has increased demands for transport and, in turn, the total fuel consumption and traffic congestion in the last mile. In e-commerce, the standardised boxes that are used for packaging were often unnecessarily large and thus generated unutilised capacity, as explained by the interviewee from company G. Another cause occurred when big trucks delivered goods to the point of consumption. Even with high fill rates, the chain imbalances caused the vehicles to be not fully utilised once they dropped off shipments during milk rounds. Narrow delivery timeframes also increased the unutilised capacities and increased the failure rates of the home deliveries even further, as pointed out by companies D, E, and G.
Reverse logistics: The return of unwanted or damaged products, and the recycling of products at the end of their lifetimes, required additional transport and handling of goods. Often, reverse flows were poorly integrated with flows towards the end-consumers, as explained by companies D and H. Furthermore, the interviewees from companies D and F pointed out that with e-commerce, in particular, the returns represented unprofitable business, for they were often free of charge for the end-consumers and were exploited by the end-consumers who merely wanted to test products. Even when the returns posed a small fee for the end-consumers, they rarely covered the real cost for the retailers. In short, return policies that favoured the end-consumers tended to create redundant transport and unutilised capacity.

4.1.4. Additional Cause

Cost was seen as an overlapping cause across all of the three categories. During the interviews, two insights were highlighted (first and foremost stressed by companies D, F, G, and H), as follows: that energy was not the crucial cost driver when it came to transport, and that the LSPs often did not correctly calculate prices, which is an unprofitable practice that ultimately harms them and encouraged the customers to over-order and use transport in excess. Interviewees generally indicated that, given the low cost of fossil fuels, energy was not the crucial factor when trying to keep the total costs low. Instead, the costs are driven by time, administration fees, salaries, the handling of goods, and the range of product assortments. As a result, detours and low fill rates are widely tolerated. At the same time, company F pointed out that LSPs offer round prices, which means that average prices are applied across Sweden, although the remote areas are more expensive to reach. Normally, the deliveries to urban areas are balanced against the prices for remote areas. However, if an LSP was chosen only for deliveries to remote locations and not to urban areas, while the deliveries in urban areas were performed by niche actors that offered lower prices than the LSP, then the LSP would have lost business and profit. The pricing model of LSPs, therefore, did not reflect the real costs. Additionally, the end-consumers did not see the costs of transport, which were often hidden in the product prices and appeared to them as being free of charge, despite the reality. As a result, the end-consumers over-ordered products and transport services and thus created unutilised capacity.

4.2. Mitigations of Unutilised Capacity

The mitigations of unutilised capacity were derived from the empirical data. Linking the causes of unutilised capacity with mitigations can increase the energy efficiency and reduce the GHG emissions from road freight transport and logistics, as detailed in the following subsections.

4.2.1. Activities

Table 6 summarises the mitigations concerning the activities in the logistics system, meaning what could be done to utilise capacity.
Transport: The interviewees from companies F and G suggested delivering products during periods with less traffic congestion, such as during off-peak delivery times, a behaviour which could be encouraged through incentives. Additionally, companies E, F, and G mentioned that routing could easily be calculated with the right software, and real-time tracking could show the available capacity in vehicles. Also, consolidation, which was explicitly mentioned by companies B, F, and G, should be encouraged by retailers, for consolidation, in addition to saving energy, can reduce the number of trucks arriving at terminals and, thus, congestion. By combining heavy and light goods on trucks, better fill rates and better prices could be secured for the LSPs. The interviewee from company F gave the example that, in a best case, 80 percent of the weight, but only 20 percent of the volume should be placed on the bottom, whereas 20 percent of the weight but 80 percent of volume should be placed on top. The product designs and sizes could be altered to better fit on pallets. As such, pallets should be high enough—for example, double-stacked pallets directly fitted into one truck—and thus use the entire height (a suggestion from companies B, C, D, F, and G).
Warehousing: The interviewees mentioned several mitigations for handling and loading. Firstly, it was recommended to work with standardised, foldable, stackable boxes for delivering products from the distribution centres to stores, where the boxes could be folded and stacked so as to minimise the use of space until they were returned (suggested by companies F and D). Secondly, companies D and G mentioned that to expedite handling, products should be labelled with prices and packed in store-ready batches before their delivery to the distribution centres. Thirdly, alternatives for hanging garments that prevent wrinkling and use less space, should be considered (advice from company D). Fourthly, company E suggested that human error when picking orders could be reduced or even eliminated with systems such as the picking-by-bag system, which is controlled via an IT component, and further training. The system adds product sizes and weights and can thus tell the pickers which products fit together in a given number of bags. Above all, the mission of maximising the capacity utilisation should span the entire product flow, from developing products that fil the standardised boxes exactly to ensuring a good pallet fit (suggested by companies B, D, and H).
Transhipment: It is important that the shippers would not over-order unnecessary volumes, as mentioned by companies D and F. Regarding the improved information flow, interviewees from companies B, E, and F suggested using platforms and IT, which could help both the internal and external information flow. Additionally, company B recommended improving the internal information flow by concentrating logistics-related knowledge at the shippers in one division instead of spreading it across several divisions. That way, one division is responsible for sourcing the transport work and contract management, which helps concentrate all of the knowledge and discover the synergies. Collaboration is another way to utilise the untapped capacity. For example, the interviewees from companies F and H suggested that the unutilised capacity in trucks could be sold to other companies in an online marketplace. Companies D and F also suggested that the political system should encourage collaboration, which it has mainly hindered to date. That way, companies could create common strategies with environmental-friendly agendas.

4.2.2. Actors

Table 7 summarises the results regarding the mitigations that the various actors could implement to take advantage of unutilised capacity.
Logistics service provider: The transport was outsourced from the retailers to the LSPs, who could deliver products more energy-efficiently than the retailers could with their own solutions (suggested by companies D, F, G, and H). Economies of scale could be achieved, which were mentioned by company F and G, when one transport operator served several shippers, especially in a given region. Company G recommended that IT systems should be implemented to facilitate the booking process. Another suggestion to decrease the emissions directly involved using electric cars for parcel and mail distribution in urban areas (suggested by companies D, E, F, and G).
Shipper: Since the GHG emissions are of great concern to the market, keeping them low is a critical objective. Companies F, D, and G proposed that, in order to raise awareness of and gauge the extent to which the emissions targets are met, all of the emissions from transport during the year should be reported to the shippers, and followed up, and the decreased emissions should be rewarded. As the interviews with companies F and G revealed, the shippers should allow a greater flexibility in terms of the time slots and delivery timeframes, and be more willing to discuss and develop environmental-friendly solutions together. Companies B and D said that in order to ensure the fulfilment of the emissions targets, clear criteria for the LSP should be set in the tendering process, concerning fuel consumption, quality, product safety, and employee safety, so the LSP has clear performance expectations.
End-consumer: The interviewees from companies E, D, F, and G stated that the end-consumers must be made aware of how their behaviour affected the environment; they suggested educating end-consumers about their behaviour’s impact and making information of the CO2 footprint from transport available to the end-consumers. Furthermore, they also proposed educating the end-consumers on the hidden cost of transport, by making that cost visible. For example, although home deliveries were often free for the end-consumers, they needed to recognise that last-mile transport has its price.

4.2.3. Areas in Logistics System

As summarised in Table 8, this category presents where in the logistics system certain mitigations could be implemented in order to utilise unutilised capacity.
In- and out-bound logistics: Capacity utilisation can be improved by decreasing the demands on the short lead times and on the high speeds in the supply chain, that is, reducing the just-in-time deliveries (suggested by companies B, D, F, and G). Speed is often triggered by an increased demand for express deliveries from the end-consumers. They need to become aware that express deliveries are costly and created unutilised capacity, and they should pay a higher price for them.
Last mile: The interviewees from companies D and G noted that standard-sized packaging, although typically appreciated, often includes too much air and should be replaced in certain cases with customised packaging that wraps items as tightly as possible. Additionally, an interviewee from company F suggested disconnecting delivery from the end-consumers by not having deliverers and end-consumers meet at points of reception, but instead delivering goods to pickup points. By relocating the points of reception from the front door to the pickup points, large commercial vehicles do not have to drive the extra leg, and energy consumption could be reduced. Additionally, tracking systems and apps, as mentioned by companies E and G, could make delivery arrivals visible to the end-consumers so as to minimise unsuccessful home deliveries. Company E suggested that the delivery timeframes should depend on the proximity to the distribution centre and increase with distance. For example, one-hour delivery timeframes could be allowed only in city centres and close to distribution centres, two-hour timeframes farther away from city centres, and three-hour deliveries could be allowed if the consumer lives even beyond a certain point. Furthermore, redundant transport could be decreased by avoiding one hub in the supply chain, as proposed by company F.
Reverse logistics: In order to avoid redundant transport from returns in e-commerce, interviewees from companies D, F, and G proposed that end-consumers should have to pay for the service so as to discourage their overuse. Companies G and H recommended that returned products from e-commerce should not be returned to the manufacturers; instead, the LSPs should relabel and re-shelve them for direct sale.

4.2.4. Additional Mitigation

Another important mitigation that was mentioned by all of the interviewees, which stretched across all of the categories, was the adaption of the cost structure of the LSPs. Since fuel prices do not reflect the damage that is caused to the environment, the prices for transport should be revaluated. In addition, because LSPs often offer unprofitable prices, a new cost structure that better reflects the real costs should be devised.

5. Discussion

In the following section, the conceptual framework is further developed and summarises the causes and mitigations of unutilised capacity. Additionally, four key contributions are discussed.

5.1. Framework of Causes and Mitigations of Unutilised Capacity

The results from the interview data have been summarised and added to the origin conceptual framework (Figure 2). Herein, capacity utilisation is viewed in a larger logistics system, on different system levels, and an interactive approach to capacity utilisation was taken.
Activities that caused unutilised capacity are delivery during peak hours, imbalances in the flow, redundant transport, product characteristics, human error in the warehouse, labour regulations, inflexibility, and limited sharing of capacity and information. The mitigations include i.a. off-peak delivery, training, efficient routing, standardisation (although exceptions were mentioned), and a change in the political environment.
The causes that were because of actors are, for example, over-delivery of services, incorrect price setting, sales campaigns, compromises, lack of awareness and information, and too-high expectations. However, regular follow-up on emissions, expanded delivery timeframes, economies of scale, use of IT, and education can counter these causes.
Additionally, unutilised capacity arose, for example, through the demand for short lead times, standardisation, high failure rates of home deliveries, and poor integration of reverse logistics. This can be mitigated by decreasing the demand for short lead times, adaption of packaging, disconnecting deliverers and end-consumers, and extension of time frames.
The capacity is conceptualised as an interactive concept in an open system. This was exemplified by the interviewee from company D, who pointed out that the company’s freight transport operation illustrated the interplay of the components. Briefly, products were designed to fill boxes completely, and the boxes were designed for a good fit on the pallets and were arranged so that the double-stacked pallets filled exactly one truck’s height, with three pallets next to each other across the width of the truck. The utilisation of the capacity has to be followed up throughout each system level and needs to begin as early as possible.
As the interviews clarified, unutilised capacity was especially apparent at the intersections and overlapped between different components and actors. As such, the responsibility for energy consumption was often passed on to other actors; consequently, the actual problems of energy overconsumption and emissions have remained unsolved. Therefore, a broad approach that addresses the different causes and changes at every level of the logistics system [8,36], as well as between the actors, was necessary. Many causes, such as inflexibilities, limited information sharing, and compromises, which lead to inefficiencies for at least one actor, resulted from the relationship between the actors. Sallnäs [50] described those dependencies between the LSPs and the shippers, and stated that if both parties had high environmental ambitions for their relationship, then the coordination of their environmental practises became more likely. This was confirmed through the interviews, however, the responsibilities were too-often eschewed and forwarded to another actor.
The framework has presented the causes and mitigations for unutilised capacity at different system levels through a holistic picture. The borders between the different causes or mitigations at each system level were often difficult to draw, because the system levels could meld together. The framework is limited in illustrating that the causes can affect each other and the mitigations can also influence the causes on a different system level.

5.2. Key Contributions

Returning to the purpose of taking an interactive approach to examine capacity utilisation to contribute to sustainable freight transport and logistics, this paper developed a conceptual framework from the literature and expanded it with empirical data so as to identify the causes and mitigations. Four key contributions have been suggested here.
Firstly, by categorising the causes of the unutilised capacity in three categories—the actors, activities, and areas in logistics systems—and on nine system levels, this paper has provided a simple but comprehensive framework to identify the causes of unutilised capacity. The identification of the causes was crucial to mitigate them and work towards sustainable freight transport and logistics. As shown in the frame of reference, the categories were identified from the literature, but the body of knowledge had not linked them together. This paper moved beyond a simple description of energy-efficient approaches in logistics. In contrast, its findings conceptualised ways to approach the problem of high energy consumption and GHG emissions in freight transport and logistics, by addressing one of its major symptoms, namely, unutilised capacity. The causes of unutilised capacity are countered with the improvement efforts that were derived from the empirical data.
Secondly, this paper provided a critical view towards the fill rates. High fill rates are often sought in the pursuit of increased capacity utilisation and energy efficiency, but if this means that products are taken from a more energy-efficient system (e.g., rail) or that the fill rates result in higher return rates, they should be avoided.
The third contribution highlighted the need for a standardised approach so as to measure the environmental impact from freight transport and logistics, and to make the data comparable between companies. The interviews revealed that the companies lacked sufficient knowledge about calculating the exact impact of their operations, largely because of the difficulty of measuring energy efficiency, which is of importance to improve the logistics operations [25,38]. This was because of the individual difficulties of collecting appropriate data, working with various indicators, and defining the system boundaries. For one, the collected numbers were often assumed and standard values were applied. Moreover, difficulties arose because of the variety of fuel types and numerous possibilities that were used to calculate the fill rates. This paper suggests applying system-wide measurements. Individual measurement components are redundant; they do not consider the impact raised by the entire system.
Fourthly, this paper underscored that the costs are not an appropriate indicator for measuring environmental impact, although they were often used by companies to track the energy consumption and thus energy efficiency, often with the belief that the reduced costs for freight transport are accompanied by lower emissions [8]. Several difficulties occurred when the costs were used as an indicator for energy efficiency; for example, LSPs often set round prices for their logistics services, and the end-consumers remained unaware of the actual costs of transport. However, although the LSP’s objective is to operate with the lowest costs possible, saving energy does not always suit that objective. Typically human resources and time, not energy, were crucial cost drivers in road freight transport, given the low market price for oil worldwide. Several interviewees suggested that higher taxes on fuel would help to reduce energy consumption. Indeed, carbon taxes have been suggested in the literature as a disincentive to generating emissions [5].

6. Conclusions

In recent years, energy efficiency has gained attention in the literature on logistics and supply chain management [7,19,51]. Other than identifying the different drivers for the energy-efficient management of the supply chain, including collaboration [22], consolidation and standardisation [8], the weight of goods, and empty running [24], this paper contributes to the understanding of how energy efficiency in logistics, starting with in road freight transport, can be achieved in a broad system, by identifying and countering the causes of unutilised capacity. By identifying the three categories, namely, actors, activities, and areas in the logistics system, and highlighting the various system levels, the origin of unutilised capacity could be identified.
This paper has two significant managerial implications. Firstly, it offers the logistics managers, from the shippers and LSPs, an overview of the problem of low energy efficiency in logistics, which elucidates how responsibilities cannot simply be forwarded to other actors, but that a holistic approach is needed. Secondly, it conceptualises capacity and presents it in a simple framework, highlighting the system levels. By providing those three categories, the causes can be conceptualised, which can help the logistics managers to identify where improvements are possible and to go beyond the obvious fill rates of vehicles to increase capacity utilisation. In addition, the paper shows how minor changes in the logistics system can affect the system’s overall energy consumption.
The theoretical contributions are twofold. Firstly, by approaching capacity as an interactive concept, the paper elucidates the importance of each component in an interlinked system. It suggests that the components can be horizontally aligned—for example, the fit of the products in a box, the fit of boxes on pallets, and the fit of pallets in trucks—and vertically aligned, as in collaboration among actors. Secondly, by investigating both the LSPs and shippers, the paper has been able to view the problem from multiple perspectives. At the intersection of the LSPs and their customers lies great improvement potential for energy efficiency, when the actors collaborate in a long-term commitment on equal footing and work together towards environmental sustainability [50]. Following suit, this paper contributes to the body of knowledge by taking an interactive approach to capacity utilisation and presenting multiple interpretations of energy efficiency.
Limitations arose during the interviews regarding the use of the term energy, which the interviewees emphasised could have been interpreted differently. Whereas this paper addresses energy efficiency in freight transport, the operational term that was used during the interviews should have been the input (i.e., fuel) or the output (i.e., CO2 emissions). However, the broadness of the term energy encouraged the interviewees to talk more freely during the interviews. A further limitation was the exclusion of the end-consumers from the data collection. Although a multi-actor approach was implemented, only shippers and LSPs were interviewed, owing to the difficulty of collecting data from private consumers.
The role of the end-consumer regarding energy efficiency in logistics is underdeveloped and calls for future research, such as the investigation of different distribution options in the last mile and the impacts on the supply chain that are triggered by the end-consumers’ behaviour. Furthermore, the need for a common approach to measure the environmental impact that enables the comparison between companies, calls for future research.

Acknowledgments

This work was supported by the Swedish Energy Agency and the Logistik och Transportstiftelsen (LTS). The support is gratefully acknowledged.

Conflicts of Interest

The author declares no conflict of interest. The founding sponsors had no role in the design of the study; in the collection, analyses, or interpretation of data, in the writing of the manuscript, and in the decision to publish the results.

References

  1. European Commission. A European Strategy for Low-Emission Mobility; Communication, Ed.; European Commission: Brussels, Belgium, 2016. [Google Scholar]
  2. Organization for Economic Cooperation and Development; International Energy Agency. Key World Energy Statistics; International Energy Agency: Paris, France, 2015; pp. 1–77. [Google Scholar]
  3. Organization for Economic Cooperation and Development; International Energy Agency. Transport, Energy and CO2: Moving Towards Sustainability; International Energy Agency: Paris, France, 2009; pp. 1–414. [Google Scholar]
  4. Creazza, A.; Dallari, F.; Melacini, M. Evaluating logistics network configurations for a global supply chain. Supply Chain Manag. Int. J. 2010, 15, 154–164. [Google Scholar] [CrossRef]
  5. Gurtu, A.; Searcy, C.; Jaber, M.Y. Emissions from international transport in global supply chains. Manag. Res. Rev. 2017, 40, 53–74. [Google Scholar] [CrossRef]
  6. Zhang, S.; Wang, J.; Zheng, W. Decomposition analysis of energy-related CO2 emissions and decoupling status in china’s logistics industry. Sustainability 2018, 10, 1340. [Google Scholar] [CrossRef]
  7. Centobelli, P.; Cerchione, R.; Esposito, E. Environmental sustainability and energy-efficient supply chain management: A review of research trends and proposed guidelines. Energies 2018, 11, 275. [Google Scholar] [CrossRef]
  8. Aronsson, H.; Huge-Brodin, M. The environmental impact of changing logistics structures. Int. J. Log. Manag. 2006, 17, 394–415. [Google Scholar] [CrossRef]
  9. Chapman, L. Transport and climate change: A review. J. Transp. Geogr. 2007, 15, 354–367. [Google Scholar] [CrossRef]
  10. Browne, M.; Allen, J.; Rizet, C. Assessing transport energy consumption in two product supply chains. Int. J. Log. Res. Appl. 2006, 9, 237–252. [Google Scholar] [CrossRef]
  11. McKinnon, A.; Ge, Y. The potential for reducing empty running by trucks: A retrospective analysis. Int. J. Phys. Distrib. Log. Manag. 2006, 36, 391–410. [Google Scholar] [CrossRef]
  12. Rizet, C.; Cruz, C.; Mbacke, M. Reducing freight transport CO2 emissions by increasing the load factor. Proced. Soc. Behav. Sci. 2012, 48, 184–195. [Google Scholar] [CrossRef]
  13. Rogerson, S.; Santén, V. Shippers’ opportunities to increase load factor: Managing imbalances between required and available capacity. Int. J. Log. Res. Appl. 2017, 20, 1–23. [Google Scholar] [CrossRef]
  14. Turki, S.; Didukh, S.; Sauvey, C.; Rezg, N. Optimization and analysis of a manufacturing–remanufacturing–transport–warehousing system within a closed-loop supply chain. Sustainability 2017, 9, 561. [Google Scholar] [CrossRef]
  15. Plambeck, E.L. Reducing greenhouse gas emissions through operations and supply chain management. Energy Econ. 2012, 34, 64–74. [Google Scholar] [CrossRef]
  16. Kovács, G.; Spens, K.M.; Vellenga, D.B. Academic publishing in the nordic countries—A survey of logistics and supply chain related journal rankings. Int. J. Log. Res. Appl. 2008, 11, 313–329. [Google Scholar] [CrossRef]
  17. Halldórsson, Á.; Svanberg, M. Energy resources: Trajectories for supply chain management. Supply Chain Manag. Int. J. 2013, 18, 66–73. [Google Scholar] [CrossRef]
  18. Rogers, Z.; Kelly, T.G.; Rogers, D.S.; Carter, C.R. Alternative fuels: Are they achievable? Int. J. Log. Res. Appl. 2007, 10, 269–282. [Google Scholar] [CrossRef]
  19. Halldórsson, Á.; Kovács, G. The sustainable agenda and energy efficiency: Logistics solutions and supply chains in time of climate change. Int. J. Phys. Distrib. Log. Manag. 2010, 40, 5–13. [Google Scholar] [CrossRef]
  20. European Parliament and Council of the European Union. Directive 2012/27/EU of the European Parliament and of the Council of 25 October 2012 on Energy Efficiency, Amending Directives 2009/125/EC and 2010/30/EU and Repealing Directives 2004/8/EC and 2006/32/EC; European Parliament and Council of the European Union: Brussels, Belgium, 2012; Volume 4, p. 56. [Google Scholar]
  21. Cullen, J.M.; Allwood, J.M.; Borgstein, E.H. Reducing energy demand: What are the practical limits? Environ. Sci. Technol. 2011, 45, 1711–1718. [Google Scholar] [CrossRef] [PubMed]
  22. Wolf, C.; Seuring, S. Environmental impacts as buying criteria for third party logistical services. Int. J. Phys. Distrib. Log. Manag. 2010, 40, 84–102. [Google Scholar] [CrossRef]
  23. Pfohl, H.C.; Zöllner, W. Organization for logistics: The contingency approach. Int. J. Phys. Distrib. Log. Manag. 1997, 27, 306–320. [Google Scholar] [CrossRef]
  24. Piecyk, M.I.; McKinnon, A.C. Forecasting the carbon footprint of road freight transport in 2020. Int. J. Prod.Econ. 2010, 128, 31–42. [Google Scholar] [CrossRef]
  25. Kalenoja, H.; Kallionpaa, E.; Rantala, J. Indicators of energy efficiency of supply chains. Int. J. Log. Res.Appl. 2011, 14, 77–95. [Google Scholar] [CrossRef]
  26. Bottani, E.; Rizzi, A.; Vignali, G. Improving logistics efficiency of industrial districts: A framework and case study in the food sector. Int. J. Log. Res. Appl. 2014, 18, 1–22. [Google Scholar] [CrossRef]
  27. He, X.; Zhang, J. Supplier selection study under the respective of low-carbon supply chain: A hybrid evaluation model based on FA-DEA-AHP. Sustainability 2018, 10, 564. [Google Scholar] [CrossRef]
  28. Yuan, B.; Gu, B.; Guo, J.; Xia, L.; Xu, C. The optimal decisions for a sustainable supply chain with carbon information asymmetry under cap-and-trade. Sustainability 2018, 10, 1002. [Google Scholar] [CrossRef]
  29. Browne, M.; Rizet, C.; Anderson, S.; Allen, J.; Keïta, B. Life cycle assessment in the supply chain: A review and case study. Transp. Rev. 2005, 25, 761–782. [Google Scholar] [CrossRef]
  30. Kin, B.; Ambra, T.; Verlinde, S.; Macharis, C. Tackling fragmented last mile deliveries to nanostores by utilizing spare transportation capacity—A simulation study. Sustainability 2018, 10, 653. [Google Scholar] [CrossRef]
  31. Björklund, M. Influence from the business environment on environmental purchasing—Drivers and hinders of purchasing green transportation services. J. Purch. Supply Manag. 2011, 17, 11–22. [Google Scholar] [CrossRef]
  32. Wu, H.J.; Dunn, S.C. Environmentally responsible logistics systems. Int. J. Phys. Distrib. Log. Manag. 1995, 25, 20–38. [Google Scholar] [CrossRef]
  33. Abbasi, M.; Nilsson, F. Themes and challenges in making supply chains environmentally sustainable. Supply Chain Manag. Int. J. 2012, 17, 517–530. [Google Scholar] [CrossRef]
  34. Brown, J.R.; Guiffrida, A.L. Carbon emissions comparison of last mile delivery versus customer pickup. Int. J. Log.Res. Appl. 2014, 17, 503–521. [Google Scholar] [CrossRef]
  35. Rizet, C.; Browne, M.; Cornelis, E.; Leonardi, J. Assessing carbon footprint and energy efficiency in competing supply chains: Review—Case studies and benchmarking. Transp. Res. Part D Transp. Environ. 2012, 17, 293–300. [Google Scholar] [CrossRef]
  36. Liimatainen, H.; Pöllänen, M. Trends of energy efficiency in finnish road freight transport 1995–2009 and forecast to 2016. Energy Policy 2010, 38, 7676–7686. [Google Scholar] [CrossRef]
  37. Liimatainen, H.; Hovi, I.B.; Arvidsson, N.; Nykanen, L. Driving forces of road freight co2 in 2030. Int. J. Phys. Distrib. Log. Manag. 2015, 45, 260–285. [Google Scholar] [CrossRef]
  38. McKinnon, A.; Ge, Y. Use of a synchronised vehicle audit to determine opportunities for improving transport efficiency in a supply chain. Int. J. Log. Res. Appl. 2004, 7, 219–238. [Google Scholar] [CrossRef]
  39. McKinnon, A. Freight transport deceleration: Its possible contribution to the decarbonisation of logistics. Transp. Rev. 2016, 36, 419–436. [Google Scholar] [CrossRef]
  40. Konings, R.; Priemus, H.; Nijkamp, P. The Future of Intermodal Freight Transport: Operations, Design and Policy; Edward Elgar Publishing Limited: Cheltenham, UK, 2008; Volume 9. [Google Scholar]
  41. Hayes, R.; Pisano, G.; Upton, D.; Wheelwright, S. Operations, Strategy, and Technology: Pursuing the Competitive Edge; John Wiley & Sons: Hoboken, NJ, USA, 2005; p. 344. [Google Scholar]
  42. Wu, Z.; Pagell, M. Balancing priorities: Decision-making in sustainable supply chain management. J. Oper. Manag. 2011, 29, 577–590. [Google Scholar] [CrossRef]
  43. Perboli, G.; Musso, S.; Rosano, M.; Tadei, R.; Godel, M. Synchro-modality and slow steaming: New business perspectives in freight transportation. Sustainability 2017, 9, 1843. [Google Scholar] [CrossRef]
  44. Lindskog, M. Systems theory: Myth or mainstream? Log. Res. 2012, 4, 63–81. [Google Scholar] [CrossRef]
  45. Flick, U. An Introduction to Qualitative Research, 5rd ed.; SAGE: London, UK, 2014. [Google Scholar]
  46. Bryman, A.; Bell, E. Business Research Method, 3rd ed.; Oxford University Press: Oxford, UK, 2011. [Google Scholar]
  47. Ellram, L.; Tate, W.L. Redefining supply management’s contribution in services sourcing. J. Purch. Supply Manag. 2015, 21, 64–78. [Google Scholar] [CrossRef]
  48. Lee, H.L.; Padmanabhan, V.; Whang, S. The bullwhip effect in supply chains. Sloan Manag. Rev. 1997, 38, 93–102. [Google Scholar] [CrossRef]
  49. Halldórsson, Á.; Aastrup, J. Quality criteria for qualitative inquiries in logistics. Eur. J. Oper. Res. 2003, 144, 321–332. [Google Scholar] [CrossRef]
  50. Sallnäs, U. Coordination to manage dependencies between logistics service providers and shippers. Int. J. Phys. Distrib. Log. Manag. 2016, 46, 316–340. [Google Scholar] [CrossRef]
  51. Marchi, B.; Zanoni, S. Supply chain management for improved energy efficiency: Review and opportunities. Energies 2017, 10, 1618. [Google Scholar] [CrossRef]
Figure 1. System levels and categories in the logistics system.
Sustainability 10 01727 g001
Figure 2. Framework of the causes and mitigations of unutilised capacity.
Sustainability 10 01727 g002
Table 1. Review of literature regarding energy efficiency.
Emergent ThemesRelevant LiteratureDimensions of Energy EfficiencyRelation to Capacity Utilisation
Measuring energy efficiency and goal-settingCentobelli, et al. [7], Kalenoja, et al. [25], Liimatainen and Pöllänen [36], Liimatainen, et al. [37], McKinnon and Ge [38], Wu and Dunn [32]Measuring energy efficiency, setting goalsDefining system boundaries, taking a broad approach
Measuring energy consumptionBrowne, et al. [10], Browne, et al. [29], Piecyk and McKinnon [24]Measuring energy consumption, reducing fuel and energy consumption, positioning energy as an essential cost driverVehicle load factor, empty running and transport distance, weight of goods influence capacity utilisation, interplay of different components
Collabo-ration between actorsBjörklund [31], Bottani, et al. [26], He and Zhang [27], Plambeck [15], Wolf and Seuring [22], Yuan, et al. [28]Discussing collaboration and information sharing. connecting collaboration and energy efficiencyCollaboration enables the use of unutilised capacity
End-consumerBrown and Guiffrida [34], Browne, et al. [10]Identifying the end-consumer’s role, raising end-consumers’ awareness of their implications on energy consumptionEnd-consumers’ behaviour creates unutilised capacity. need to include consumer transport when viewing supply chain
Logistics systemAronsson and Huge-Brodin [8], Kalenoja, et al. [25], McKinnon [39], Pfohl and Zöllner [23]Establishing responsibilities for the environment and transported products, just-in-time deliveries, returns Taking macro-perspective of supply chain, slowing down the supply chain
Last mileBrown and Guiffrida [34], Kin, et al. [30], Rizet, et al. [35]Discussing e-commerce Handling last-mile deliveryTransport in the last mile is not used to its full capacity
Table 2. Sample of companies interviewed.
CompanyDescriptionSize *Number of Interviews Conducted
AManufacture of machine elements and logistics service providerLarge1
BManufacturer of packaging, processing, and provider of distribution solutionsLarge1
CManufacturer of paper and tissuesLarge1
DGarment retailer with physical stores and e-commerce presenceMedium3 (+ visit to distribution centre)
EE-grocery retailer and delivererSmall1 (+ visit to distribution centre)
FWorld-leading logistics service providerLarge4
GNordic logistics service providerLarge2
HNordic logistics service providerMedium1
ILean energy consultancySmall3
* Small: <1000 employees; medium: 1000–9999; large: >10,000 employees.
Table 3. Activities that cause unutilised capacity.
LevelsCauses
TransportProduct characteristics and fit in vehicle
Labour regulations
Redundant transport of air and shipping hanging garments lead to low fill rates
Delivery peaks during mornings and afternoons (i.e., rush hours)
Last-minute changes in routing due to express deliveries
High volumes of parcels are needed to fill the system and are taken from more energy-efficient systems
Imbalances in volume flow and empty running
WarehousingHuman error during order picking
Automation and standardisation leads to inflexibility
Dysfunctional information technology
TranshipmentDifficulty sharing distribution capacity among shippers
Limited internal and external information sharing
Rules set by stronger actors and divergent interests
Prohibited collaboration of larger logistics service providers (LSPs) (i.e., anti-competition law)
Table 4. Actors that cause unutilised capacity.
LevelsCauses
LSPOver-delivery of services
Incorrect price setting and pricing model unaligned with real costs (e.g., round prices, ‘free’ home deliveries)
Priorities to fulfil customer demands lead to compromises and adaption of own logistics processes
Offer a broad range of services that is uncompetitive with niche actors responsibilities for fill rates delegated to the transport provider
Inflexibility with mixing certain shipments
ShipperNarrow delivery and pickup timeframes for LSPs
Requirements, inflexibility, and lack of compromises
Demands to receive goods early and post late
Over-ordering capacity
End-consumerLack of awareness of consequences of own behavior
Lack of information on transport’s GHG footprint
Sales campaigns with free shipping and sending along retour papers
Increasing demand for express deliveries and increasing returns of goods
High expectations for narrow timeframes for home deliveries
Table 5. Areas in logistics system from where unutilised capacity originates.
LevelsCauses
In- and out-bound logisticsIncreased demand for short lead times (i.e., just-in-time)
High energy consumption because of many small shipments (i.e., no economies of scale)
Last mileIncreased number of small shipments instead of full pallets
Standardised boxes often larger than necessary
High failure rate of home deliveries
Reverse logisticsReverse logistics poorly integrated in flow to end-consumers
Unprofitable returns
Table 6. Suggested mitigations within the category of activities.
LevelsSuggested Mitigations
TransportAvoid peak deliveries (e.g., incentivise delivery during off-peak times)
Ensure efficient routing
Track real-time need for transport
Consolidate and combine heavy products but little volume with voluminous but light products
Receive fewer but fuller trucks
Utilise the whole height of a truck (e.g., double-stack pallets)
WarehousingStandardise foldable and stackable boxes
Label and pack products arriving at distribution centres in advance
Devise alternatives to hanging garments
Reduce picking errors
Change product designs and sizes to better fit pallets
TranshipmentOrder necessary volumes only
Use platform and information technology to support internal and external information flows
Concentrate all logistics-related knowledge in one division instead of spreading it over several divisions
Use an online marketplace to sell or buy free capacity
Encourage collaboration (e.g., petition the political system)
Table 7. Suggested mitigations within the category of actors.
LevelsSuggested Mitigations
LSPOutsource transport from retailers to LSPs
Use the same transport operator for several shippers (i.e., economies of scale)
Handle bookings electronically
Use electric cars for distribution in urban areas
ShipperReport all emissions and follow up
Expand flexibility in delivery timeframes
Set clear requirements early on (i.e., in tendering process)
End-consumerEducate end-consumers on the consequences of their behaviour
Communicate CO2 footprint of transport to end-consumers
Make transport costs visible to end-consumers
Table 8. Suggested mitigations within the category of areas in the logistics system.
LevelsSuggested Mitigations
In- and outbound logisticsDecrease demand for short lead times and high speeds
Only deliver just-in-time when truly necessary
Last mileUse better-fitting packaging to avoid air transport
Disconnect deliverers and end-consumers
Use tracking systems for end-consumers
Extend timeframes depending on proximity to distribution centres
Avoid one hub in the supply chain
Reverse logisticsPrices should better reflect costs
Re-shelve returned products from e-commerce instead of returning them to manufacturers

