Article

Evaluating Gravity-Flow Irrigation with Lessons from Yuma, Arizona, USA

1
Department of Agricultural & Resource Economics, University of Arizona, Tucson, AZ 85721, USA
2
Department of Soil, Water, and Environmental Sciences, Maricopa Agricultural Center, The University of Arizona, Maricopa, AZ 85138, USA
3
U.S. Department of Agriculture, Natural Resources Conservation Service, Beltsville, MD 20705, USA
4
Water Resources Research Center and the Department of Soil, Water and Environmental Science, University of Arizona, Tucson, AZ 85721, USA
5
Department of Soil, Water, and Environmental Science, University of Arizona, Tucson, AZ 85721, USA
*
Author to whom correspondence should be addressed.
Sustainability 2018, 10(5), 1548; https://doi.org/10.3390/su10051548
Submission received: 12 March 2018 / Revised: 1 May 2018 / Accepted: 7 May 2018 / Published: 14 May 2018
(This article belongs to the Special Issue Sustainable Agriculture: The State of the Great Debates)

Abstract

:
Many consider gravity-flow irrigation inefficient and deride its use. Yet, there are cases where gravity-flow irrigation can play an important role in highly productive and profitable agriculture. This perspective article reviews the literature on the profitability and efficiency of gravity systems. It then reviews the history of water management in Yuma, Arizona, which is one of the most productive agricultural areas in the United States. Through extensive changes in irrigation technologies, changes in production practices, and investments in irrigation infrastructure, Yuma agriculture dramatically shifted from perennial and summer-centric crop production to winter-centric, multi-crop systems that are focused on high-value vegetable crops. These innovations have led to improvement in various irrigation efficiency measures and overall water conservation. Return flows from the system, which were once characterized as an indicator of inefficiency, provide valuable environmental services to the Colorado River Delta ecosystem. Yuma’s history illustrates that innovative gravity-flow systems can be productive and water-conserving, and that a system-wide perspective is critical in evaluating irrigation systems.

1. Introduction

Gravity-flow (or flood) irrigation is often characterized as “wasteful”, “primitive”, or “inefficient” [1,2,3,4,5,6]. Despite this characterization, gravity flow remains the most prevalent mode of irrigation worldwide, largely because of the low energy requirements relative to alternatives [7]. It remains the dominant mode of irrigation, even among developed countries in regions such as southern Europe and the western United States [7,8]. It is true that pressurized irrigation systems (such as sprinkler or drip) can achieve higher levels of on-farm application efficiency than traditional gravity systems. Yet, there are also counter-examples throughout the world of farming systems that have achieved high levels of on-farm application efficiency [7,9,10,11]. The management of gravity systems is not static. Farmers support and experiment with quite sophisticated systems, such as ones relying on computerization, automation, and real-time optimization [7,9,10,11,12,13,14,15,16]. Further, simple measures of on-farm application efficiency ignore more comprehensive aspects of basin-wide efficiency or the environmental benefits that are provided from return flows leaving gravity irrigated fields. The appropriateness of gravity-flow irrigation—in agronomic, economic and ecological terms—depends on local context.

Aims and Scope

This article examines the role of gravity-flow irrigation systems in modern, high-value production systems. We first discuss gravity-flow irrigation more generally, then turn our attention to the southwestern United States (here, California and Arizona). We then examine more specifically the history of water management in the Yuma, Arizona area, which is one of the most productive and profitable agricultural regions in the United States. We begin with a brief overview of the characteristics of gravity and pressurized irrigation systems. Agricultural economists have recognized that the engineering features of irrigation systems affect their efficiency and profitability [17]. Yet, other social scientists may be unaware of the nature and role of these factors. Section 3 reviews the economics literature on irrigation technology adoption, considering circumstances where gravity-flow irrigation can be more profitable than pressurized systems. Section 4 considers the measurement of on-farm irrigation efficiency. Many (e.g., Lehr; Radhakrishna; Lal; O’Mahony et al.; Owen [2,3,4,5,6]) have advocated for policies to encourage the adoption of “improved” irrigation technologies to address water scarcity. Yet, improving on-farm efficiency does not necessarily reduce consumptive water use on a system-wide scale. “Water conserving” technologies may not in fact conserve water. Section 5 examines irrigation practices in the southwestern United States (primarily Arizona and California). Section 6 examines the history of water management around Yuma County, Arizona, which became a national center of vegetable production. Yuma’s shift in cropping patterns contributed to significant improvements in irrigation technology, practices, and infrastructure. It also illustrates how gravity-flow systems can achieve high levels of efficiency, and how improved gravity irrigation can serve an important role in highly productive and profitable agricultural systems. The case study of Yuma complements recent case studies in southern Europe [7], which contrasted the current performance of gravity systems with hypothetical improvements. That analysis discussed various pre-conditions for success and barriers to improvements. Here, the Yuma historical study illustrates how many of those very same pre-conditions were met, and barriers were overcome.

2. Gravity-Flow and Pressurized Irrigation Technologies

There are many different irrigation technologies, driven by soils, slope, field size and shape, water availability, crops grown, labor, energy and management costs, and financial constraints. These technologies are variants of three basic water delivery mechanisms: gravity, sprinklers, and drip/low-flow [18].

2.1. Gravity-Flow Irrigation Methods

Systems that rely on gravity instead of pressurization have the lowest energy input to move water. Gravity technologies may be characterized by two elements: the way that water is controlled in the field and the way that water is delivered to the field.
Water Control. In gravity systems, water is delivered to the highest elevation end of a sloped field or to the edge of a level field, and released. This allows gravity to distribute the water down or across the field. In a field that is not perfectly level, water is either controlled by running the water down furrows in the field, between borders, or is not controlled at all (which is rarely seen except in mountain meadows). Basin irrigation is possible in level fields, where water is delivered to the edge of the basin and allowed to spread across the basin area. In a level basin, there are no furrows or borders to direct the water, but the basin itself is contained by a border.
The most common water delivery systems are as follows.
In Open Ditch Systems, the water supply runs across the upper end of the field. The ditch can be unlined or lined. Water is transferred to furrows or borders using gates or siphon tubes. A gated ditch has “gates” or “valves” installed in the side of the ditch, which are opened to release water from the ditch into furrows or into a border. Siphon tubes are short tubes that are usually made of aluminum or plastic and are used to “siphon” water from an open ditch into furrows or borders. This system is difficult to precisely manage, and it requires the most labor to avoid breaks in the ditch and to manually reset the gates or siphon tubes.
A Gated Pipe System is a surface pipe that is usually polyvinyl chloride (PVC) or aluminum fitted with spaced closeable gates or holes permitting the water to flow into furrows, borders, or basins. The regulating gates are usually controlled manually, but can be automated. When soil conditions permit, gated pipe systems may be modified to improve irrigation efficiency by delivering water in either one initial surge (cablegation) or multiple smaller surges (surge control). These systems can be modified so that a surge control valve alternates water delivery through two sets of gated pipe to provide water to the furrows in timed surges.
Cablegation is a modified gated pipe system using a moving plug attached by a cable inside the pipe to deliver water sequentially to furrows, starting with a large initial surge of water that then declines in volume.
Poly Tubing is a thin-walled, flexible plastic tube that has holes punched to permit water to flow into furrows, borders, or basins. Poly tubing is usually used only one year, because the walls are so thin that the retrieval process destroys the tubing.
Underground pipe delivery has the advantage of being underneath regular farming operations and able to push water uphill with pressure. Underground pipe can be steel, concrete, or PVC, and can be pressurized. Risers are spaced at regular intervals to bring water to the surface where it can be channeled into furrows, borders, or basins. Gated pipe systems can be attached to the risers to provide the delivery to the field. Using surface pipe for the final distribution enables better water management and reduces the number of risers in the field.

2.2. Pressurized Irrigation Systems

Sprinkler Systems are pressure-driven, spraying irrigation water in the air above the crop canopy or below the crop canopy to mimic precipitation. Sprinkler systems are subject to wind drift and high evaporation in windy, hot climates. Sprinklers require pressure, which is usually supplied with pumps. They can be used with surface water systems, but pumps are needed to pressurize the system. Many variations of the basic technology redesign existing systems to reduce the pressure requirements and energy needed for pumping.
A Center Pivot System is a self-propelled electronic or hydraulic continuously moving sprinkler or spray nozzle system that travels around a center pivot point; the land is irrigated in a circular pattern. The system may have lower pressure requirements, as the propulsion system is not water-driven. Some soils require larger spread patterns of the water, necessitating higher pressure.
A Linear Move Tower System is a self-propelled continuous move side-roll system on a tower; it is a center pivot system adapted to move in a line and designed for use on square fields. Water is supplied to the unit by a flexible rubber hose.
A Solid-Set or Permanent System is set in place and not moved through the irrigation season. In the case of a solid-set, a hand-move system is placed in the field at the start of the irrigation season and left in place throughout the season. Permanent systems rely on buried pipes with only the risers and sprinklers above ground.
A Side-Roll, Wheel-Move System is a wheel-move lateral line that is designed for use on rectangular or square fields and low-growing crops (three to four feet high or less). The unit is moved by a small gasoline engine that rotates the distribution pipe (axle) with six to eight-foot wheels. The unit is moved a fixed distance based on the revolutions and wheel diameter. Water is supplied via a supply line at one end and it is disconnected, moved, and reconnected across the field.
A Big Gun or Self-Propelled Traveler System is a large single water gun mounted on a trailer or cart that projects water through a single nozzle up to 200 feet. They may be moved in fixed increments, self-propelled by a separate engine, or hydraulically continuously moved. Water is supplied through a flexible rubber hose. These systems often require grass to support the trailer.
A Hand-Move System consists of a portable aluminum pipe with risers and sprinklers attached that is moved by hand one or more times per day to meet crop irrigation requirements.
Another pressurized irrigation system is the Low-Flow Technologies-Drip, Trickle, or Micro-sprinkler, which supplies water through emitters/nozzles attached to a supply pipe or porous tubing. The system is designed to be operated daily or frequently to apply only a small amount of water. Water applications may be managed to meet crop needs with the potential for near-zero loss. The technology is associated with high-valued crops (such as orchards, vineyards, and vegetables) because of substantial installation costs.

3. Economics and Adoption of Gravity-Flow Irrigation

Caswell and Zilberman [17] developed the seminal theoretical framework to evaluate the economics of irrigation technology choice. Their approach highlighted the land quality-augmenting properties of irrigation technologies, along with the engineering features affecting irrigation cost. These factors were introduced into a farm-level economic model to examine how (among other things) the relative profitability of gravity-flow irrigation, sprinkler irrigation, and drip irrigation varied with land quality and water prices. They argued that sprinkler and drip irrigation were “land-augmenting” technologies, substituting for land quality. Their model suggested sprinkler and drip systems would be relatively more profitable (and more widely adopted) in areas with low land quality and more expensive water. Gravity-flow irrigation would be relatively more profitable (and more widely adopted) in areas with heavy and leveled soils, and where water was less expensive. The advantage of sprinkler and drip irrigation is that they both augment the water-holding capacity of soils that lack this capacity more naturally or have greater slopes. Water costs are generally higher in areas relying on well water (as opposed to surface water), and higher still in areas where well depths are greater. Conversely, water costs (and the advantage of gravity-flow) would be greater in areas relying on surface water.
Results from empirical studies are largely consistent with this theoretical framework. Caswell and Zilberman [19] found higher rates of adoption of gravity-flow irrigation among farms with lower water costs and those using surface water (although results were only marginally significant). In a study of irrigation technology choice (sprinkler versus gravity-flow) across more than 5000 United States (U.S.) farms, Negri and Brooks [20] found that the adoption of gravity-flow systems was negatively associated with water price and soil slope, and positively associated with reliance on surface water. Adoption of gravity-flow systems was associated positively with clay soils and negatively with sandy soils. Negri and Brooks [20] noted, “Traditional gravity systems [that are] applied to land with high water-holding capacity due to high clay content and level slopes can achieve application efficiencies comparable to sprinkler irrigation. Conversely, lands with porous soils or steep slopes are unsuitable for gravity irrigation because of excessive deep percolation or runoff (p. 214)”.
A study of citrus groves in Israel and Gaza found that the adoption of gravity systems was greater in groves facing lower water costs [21]. Using both farm-level and field-level data from the San Joaquin Valley of California, Dinar et al. [22] found that the adoption of gravity-flow irrigation was greater where surface and groundwater costs were lower, where slopes were lower, and where fields had a greater water-retention capacity. Green et al. [23] also found evidence that the probability of a farm adopting gravity irrigation (relative to sprinkler irrigation) was higher on farms facing lower water costs, with lower soil permeability, and with less slope. Consistent with Negri and Brooks [20], they found the effects of soil characteristics to be greater than those of water price. Examining U.S. county-level data, Mendelsohn and Dinar [24] found that a longer slope length (which indicates flatter land) encouraged gravity system use. The greater water-holding capacity of soils increased the use of all irrigation technologies, but had a greater marginal effect for gravity systems. Counter to other studies, they found a greater access to surface water increasing the use of sprinkler irrigation. Frisvold and Deva [25] examined irrigation choice among growers in 17 U.S. western states from the 2008 U.S. Department of Agriculture (USDA) Farm and Ranch Irrigation Survey (FRIS). They found higher rates of gravity-flow adoption among smaller farms (in terms of sales) and farms that had a greater reliance on surface water and lower water costs (accounting for the combination of paid prices and pumping costs). Irrigation choice was also significantly affected by an index of sheet and rill erosion, which captured the effects of rainfall, field slope, and soil water-holding capacity. This index increases with field slope and decreases with water holding capacity. As one might expect from Caswell and Zilberman [17], the adoption of sprinkler irrigation was increasing (and gravity-flow irrigation decreasing) with this index. A follow-up [25] found similar results: gravity-flow adoption was greater in areas where soils had a lower erodibility index and farmers relied on surface water, had lower overall water costs, and had lower sales [26]. In another multi-state study of western U.S. agriculture, Olen et al. [27] found that, for vegetables, having a groundwater supply increased the probability of adopting sprinklers by 21% and decreased the probability of adopting gravity systems by 16%. They argued that pumping groundwater requires pressurization, which is conducive to sprinkler and drip systems that require pressure to distribute water to crops, in contrast to gravity systems. In a study of Arkansas farms, Huang et al. [28] found that higher soil permeability was associated with a greater probability of using sprinkler systems and a lower probability of using gravity-flow systems.
Some of the studies cited above also considered the effects of climate on choices of irrigation technology. Studies that focus on small geographic areas often have too little cross-sectional variation in climate variables to have any statistical power (e.g., Dinar et al., 1993 [22]). Yet, studies over broader areas have found that climate has significant effects on irrigation technology. Negri and Brooks [20] and Mendelsohn and Dinar [24] found higher rates of sprinkler adoption in areas with greater rainfall. Negri and Brooks [20] argued that sprinkler use would be greater in high rainfall areas, because growers there face greater risks of crop damage from unexpected rainfall following flood irrigation. In hot, arid regions, in contrast, evaporation losses can be large with sprinkler technology, reaching levels close to 50% under extreme conditions in Arizona or Southern California, according to one study [29]. According to Negri and Hanchar [30], “Farmers in hot or windy regions are more likely to adopt gravity, since a large fraction of water applied with sprinkler systems evaporates under these climate conditions” (p. 9). Olen et al. [27] argued that, above critical temperature thresholds, high evaporative losses negate the efficiency advantages of sprinklers. This can make them less economical compared to gravity or drip systems. Mendelsohn and Dinar [24] also noted problems of large evaporation losses and that “sprinkler systems are more frequently adopted in cooler locations with a lot more rainfall” (p. 338). Negri and Brooks [20] found gravity adoption was greater in areas with more frost-free days and longer grower seasons, suggesting that sprinklers were better suited for frost protection. In contrast, longer growing seasons were associated with warmer climates where sprinkler evaporation losses are greater. Olen et al. [27] cited several studies reporting the frost-protection advantages of sprinkler irrigation over other systems. Mendelsohn and Dinar [24] also pointed out that sprinkler adoption rates were inversely related to temperature. Other studies also found higher rates of gravity-flow adoption with warmer summer temperatures and warmer fall/winter temperatures [25,26]. Mendelsohn and Dinar [24] stated, “Farmers currently use gravity systems to adapt to high temperatures”.
Both theoretical modeling and empirical findings suggest that gravity-flow irrigation is relatively more profitable and more likely to be used in areas with (a) low irrigation costs (which is often also associated with reliance on surface water); (b) land with less slope; (c) land with lower soil permeability; and (d) areas with longer growing seasons and higher temperatures.

4. Irrigation Efficiency and Water Use

Improving irrigation efficiency is frequently cited as a promising response to climate change or water scarcity in general [24,31,32,33,34,35,36]. It can allow irrigators to lower water costs and improve yields, thus increasing profits. There have been frequent arguments made by academics, non-governmental organizations, and governmental agencies that water may be conserved by encouraging the adoption of more “efficient” irrigation technologies, with gravity-flow irrigation held out as an example of inefficiency [1,2,3,4,5,6,37,38,39]. Meanwhile, several developed countries have expanded subsidy programs to encourage the adoption of these technologies [40,41].
Claims of water conservation are often based on the farm-level measures of irrigation efficiency, which is also known as the amount of diverted water taken up by the crop. Based on their theoretical model, Caswell and Zilberman [17] noted, “The impact of the new technology on aggregate water demand is not clear cut … for example, it may reduce water use on the farms that switch to the new technology; but, on the other hand, more land will be placed in production, which will tend to increase water demand” (p. 810).
Increasing the share of water used by the crop means less water is available to recharge aquifers or serve as return flows for downstream uses [42]. Increasing this measure of water-use efficiency can actually reduce other metrics of efficiency. The following data from New Mexico (Table 1) illustrates this point [42]. Table 1 compares three measures of water-use efficiency between flood and drip irrigation for 13 crops. The first is irrigation efficiency (measured by evapotranspiration (ET)) per volume of water applied. The second is water-use efficiency (crop yield divided by water consumptive use (ET) per acre [43]. The third is the blue water footprint [44]. This is the inverse of water-use efficiency (i.e., water consumptive use (ET) per acre divided by yield). The first indicator measures the share of applied water used by the crop. The second measures the amount of crop produced for a given volume of water consumed. The third measures the volume of water that is needed to produce a given amount of a crop.
For flood irrigation, 42–56% of the water applied is taken up by the crop (ET/water applied) for the 13 crops considered, with a median of 44% (Table 1). The remainder of the water “in excess of ET is not lost because it returns into the basin from which it was withdrawn via surface runoff or deep percolation. This water can be available to other users at other times in other locations” (p. 18,215 [42]). For drip irrigation, water reaching aquifers through deep percolation or river basins through surface runoff will be “reduced, possibly to nearly 0, through drip technology” (p. 18,216 [42]). Even though the full 100% of drip irrigation applications will not be taken up by the crop, remaining volumes may still be unable to reach aquifers or basins in a usable form. Since more water is used by the crop, yields are usually higher under drip irrigation. While water-use efficiency is higher (and the blue water footprint is lower) for five of the 13 crops, for the other cases, drip does not provide superior water-use efficiency. Notably, drip irrigation is more water consuming (per amount of crop produced) for lettuce and wheat.
Despite the widely-held belief that increasing on-farm irrigation efficiency through improved technology (i.e., technologies with higher ET/application ratios) will conserve water at a system-wide level, research findings supporting this belief is decidedly mixed. Numerous studies have shown under which conditions the adoption of these supposed water-conserving technologies do not lower, and can actually increase, water use [45,46,47,48,49,50,51,52,53,54,55]. These have largely been theoretical, mathematical programming, or simulation model studies.
The possibility that improving efficiency can actually increase resource use dates to at least Jevons’s [56] 19th century observations about demand for coal. The large number of studies cited above suggest this Jevons Paradox [57] could well hold for water. Aside from modeling results, there is empirical evidence that improving on-farm irrigation efficiency need not conserve water. Studies from the U.S. Great Plains suggest the switch from flood irrigation to center pivot-irrigated induced farmers to plant more acres and shift cropping patterns, negating water conservation potential and increasing groundwater extraction [58,59]. Despite extensive U.S. agricultural technology adoption subsidy programs intended to promote water conservation, there is little evidence that the subsidies have met stated goals. During a period of large program expansion (2003–2008), absolute volumes of water applied and water applied per acre increased over the Lower Colorado Basin, Upper Colorado Basin, Pacific Northwest, and the Great Basin regions. While absolute water use declined in California, this was due entirely to reductions in irrigated acreage. The volume of water applied per acre in California increased [60]. Another study of U.S. irrigation technology adoption subsidies found that while there was some evidence that payments may have reduced the amount of water applied per acre, they may have also encouraged an expansion of irrigated acreage, increasing net water applications [61].
Reducing return flows can also have negative effects on third parties. Increased on-farm irrigation efficiency means that the crop—rather than its surrounding soil—takes up a greater share of the water that is applied. However, this also means that less water returns to the system (as groundwater recharge or surface-water return flow). Other downstream irrigators often count on this return flow or recharge for their water supplies. Similarly, reducing the water lost through the conveyance system results in lower return flows or recharge that is no longer available to other irrigators, urban water users, or ecosystems. The ecosystem services of such return flows can be important for maintaining riparian species. Many riparian systems now depend on these return flows, which are subject to changes in managed, hydrological systems that have been altered to accommodate human water uses [7,62,63,64,65,66,67]. Thus, what may seem a rational response to water scarcity by irrigators at the farm level may exacerbate water scarcity problems at the basin scale. Policies to increase irrigation efficiency with the hope of freeing up water for other uses may fail to conserve water. Consequently, the scope and limits of conserving water simply through technological fixes have undergone greater critical scrutiny.

5. Irrigation in the U.S. Southwest

All three base technologies (gravity, sprinkler, and drip) are used in the U.S. Southwest (Table 2). The USDA Farm and Ranch Irrigation Survey (FRIS) for 2013 [68] reports 4380 irrigated farms in Arizona irrigating 851,407 acres, and 44,347 farms in California irrigating 7,543,928 acres. Farms use more than one type of irrigation technology on about 20% of the acreage. About two-thirds of Arizona farms rely on gravity irrigation to distribute water on about 88% of irrigated acres. Fewer California farms (about one-third) rely on gravity technology, but it is used on over 60% of the irrigated acres.
The FRIS reports farms and acres that control water in gravity systems by using rows or furrows, borders, or basins, or do not control water (Table 3). For both Arizona and California, about 10% of farms apply more than one type of control method. In Arizona, most farms rely on border/basin control, but most of the acres are irrigated down rows of furrow. In California, most farms and acres rely on border/basin gravity water control. The selection of row/furrow or border/basin is largely a function of the crops grown. For example, cotton or corn silage are better suited for row/furrow, while alfalfa, orchards, and wheat are better suited for border/basin water control.
In Arizona, most farms and acres rely on lined ditches for on-farm delivery. That is consistent with well-established surface water supply systems and surface irrigation, which are both present in Arizona. Respondents in California surprisingly reported unlined ditches as serving the most acres, but most of the farms relied on underground pipe. It is possible that water is piped to the field, and then unlined ditches are utilized in the field.
Sprinklers are not a primary irrigation technology in most areas of Arizona and California. Between 30–40% of these farms utilize sprinklers, but on less than 30% of the acres. On the sprinkler-irrigated areas in Arizona, more farms rely on hand-move systems, but more acres are irrigated with center pivots (Table 4). The hand-move systems are typically used on small holdings, small fields, or vegetable or other high-value crops. Center pivots are typically found on groundwater-supplied, larger fields with forage or grain crops. California sprinkler irrigation relies more on solid-set and permanent systems. About 40% of the farms and acres with sprinkler irrigation rely on this relatively capital-intensive, but lower labor technology. Over half of the irrigated farms in California have low-flow technology on about 37% of the irrigated acreage. The technology is less prevalent in Arizona, with 11% of farms using low-flow technology on about 6% of the state’s irrigated acres.
Finally, whatever the technology, someone must decide to start and stop the water to the crop. While technologies represent the potential for an efficient irrigation system, the operator of that system still must make informed decisions on water-application flow and timing to translate the technology’s potential into reality. A well-managed gravity system may be more efficient than a poorly-managed pressurized system. The 2013 FRIS also asked producers what they considered when making irrigation decisions. Almost 75% of farmers look at their crop when making an irrigation decision (Table 5). The only surprise with that value is that it is not higher. What is surprising is that about 15% of the farms in Arizona and 12% of the farms in California have no control over scheduling irrigations because they are scheduled by the water district. This makes it difficult to change to lower-volume, more frequent irrigations, which can attain greater efficiency. About 20% of the farms in Arizona gather information from more advanced technologies or techniques when making irrigation decisions. The irrigation decisions may not be much different than those relying solely on crop condition, but the confidence in the decision should be greater. In California, 42% of farms rely on advanced technologies and techniques for improving their irrigation decisions.

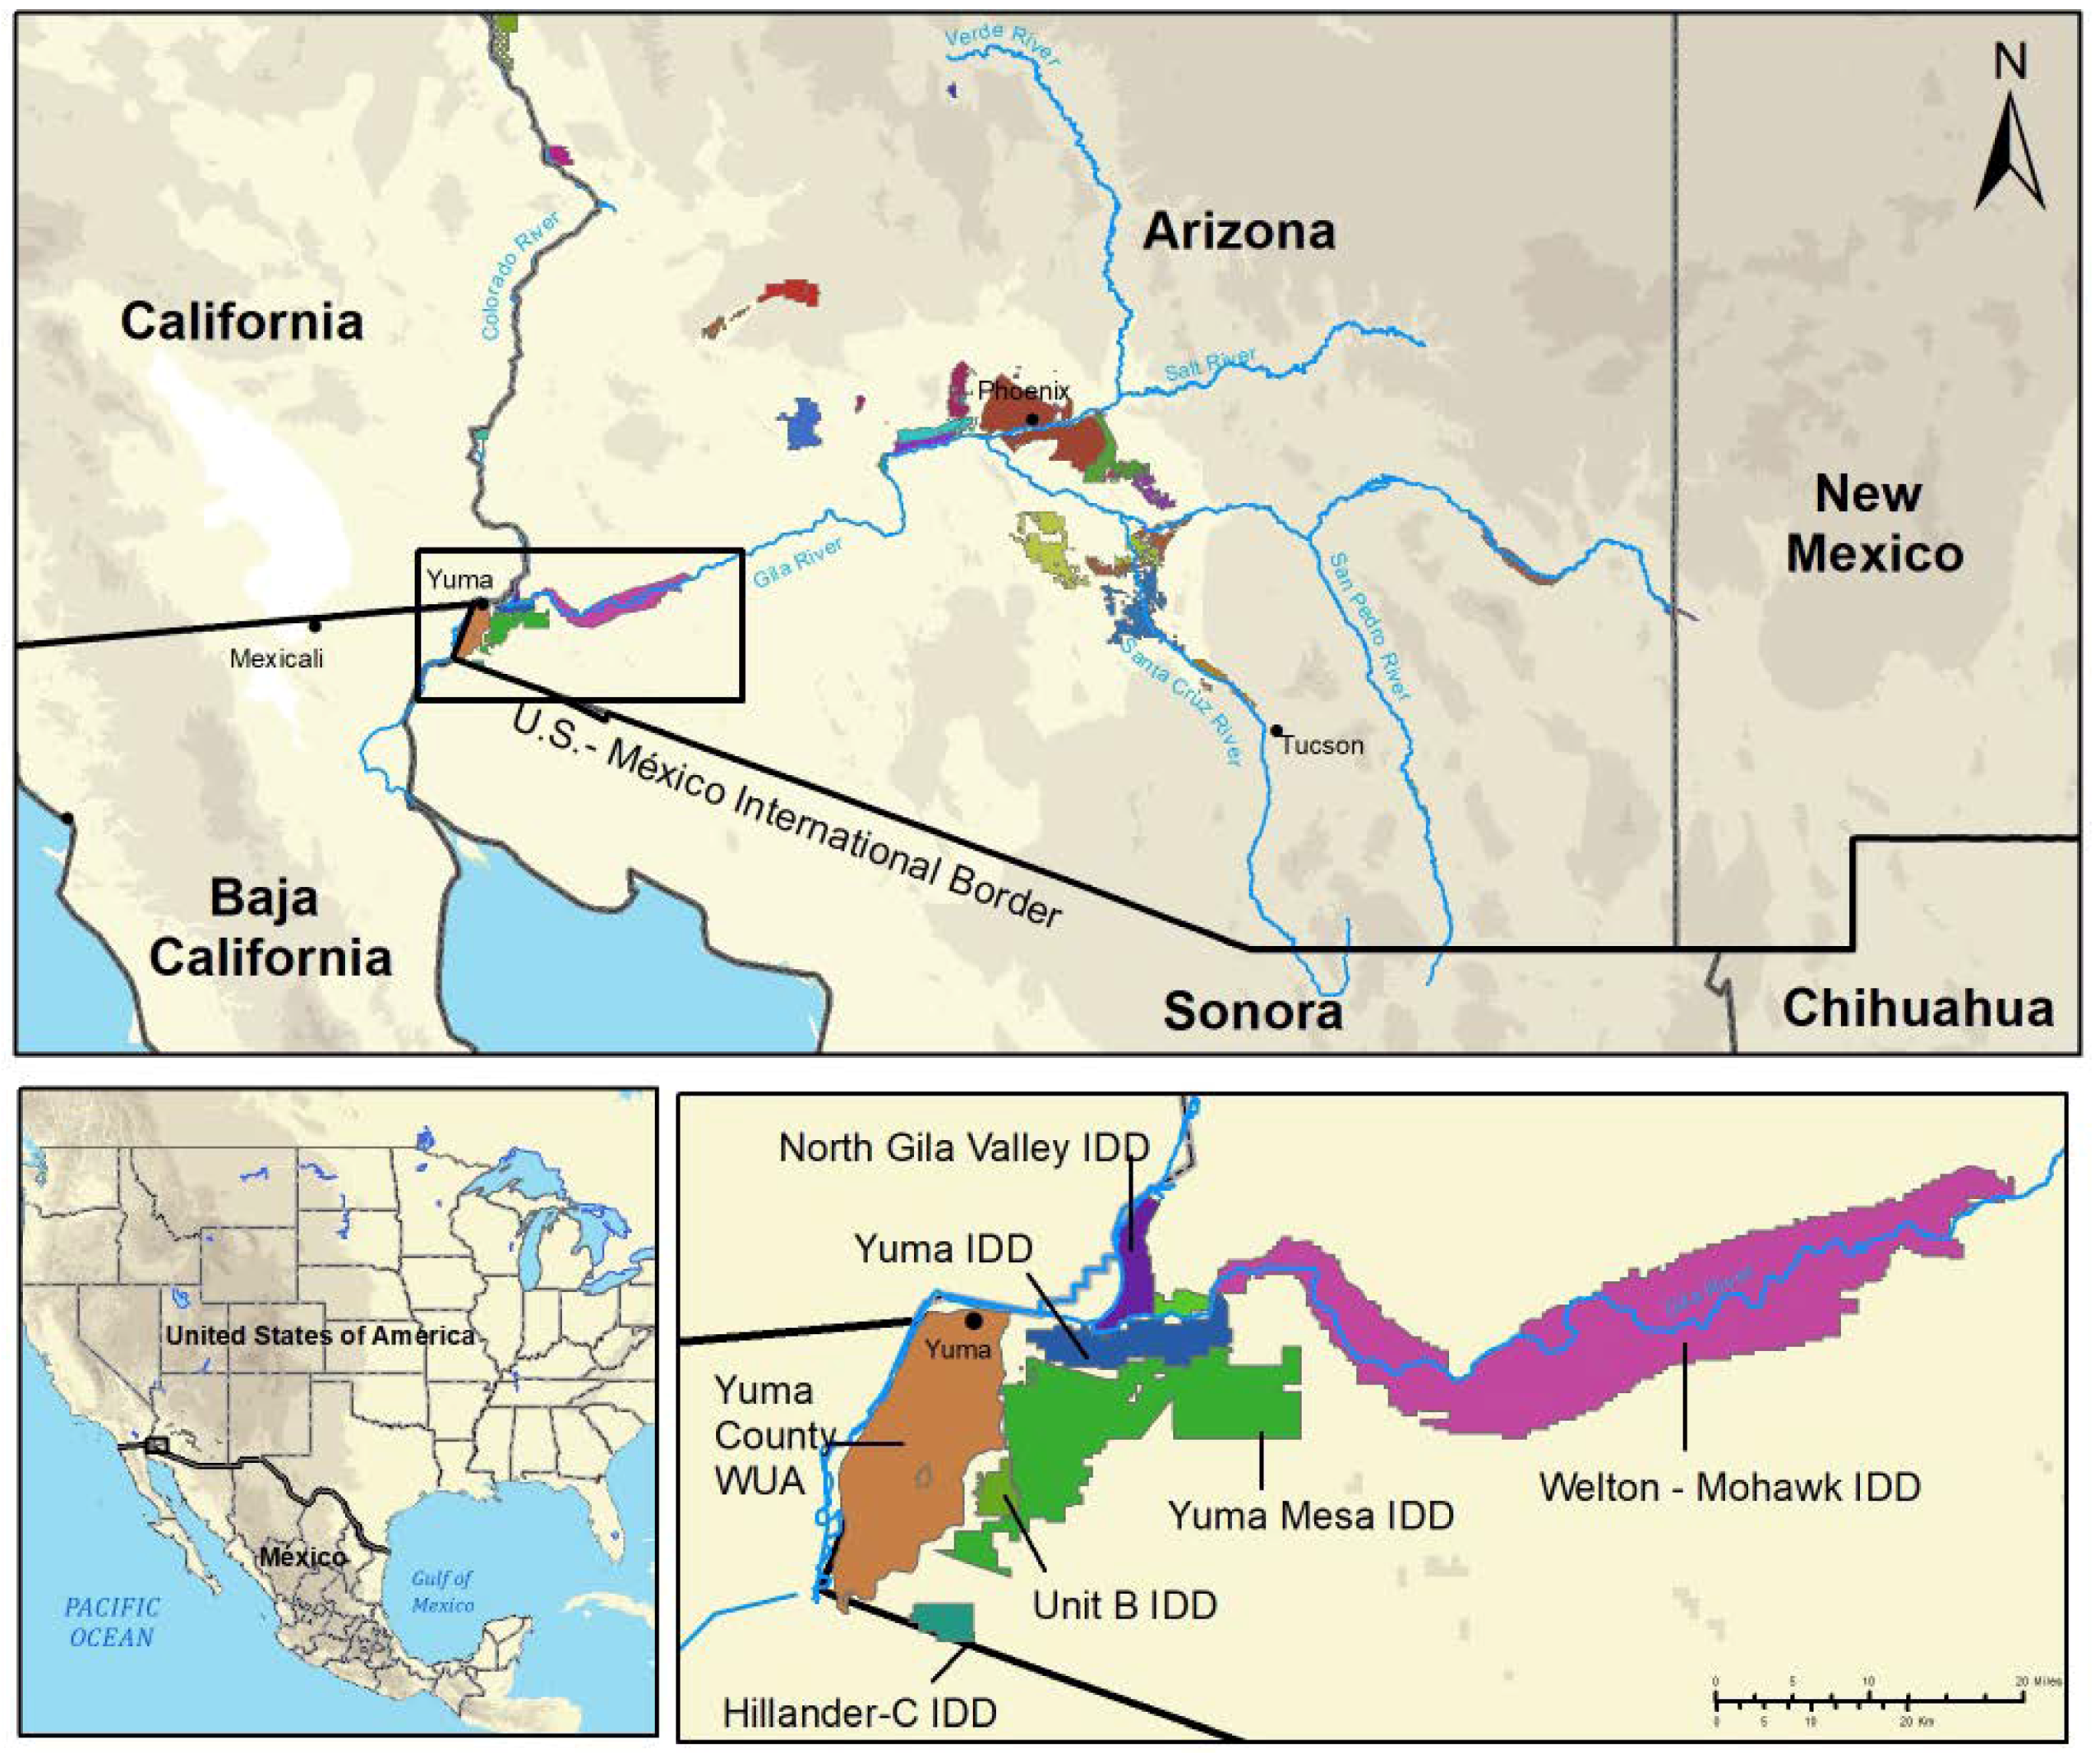
6. A Yuma Case Study

The Yuma Project of the U.S. Bureau of Reclamation (USBR), which was authorized by the U.S. Secretary of Interior in 1904, provides water from the Colorado River to irrigate about 68,000 acres near the towns of Yuma, Somerton, and Gadsden (all in Yuma County, Arizona) as well as Bard and Winterhaven, California. The project is comprised of a Reservation Division in California and a Valley Division in Arizona. For this case study, the term Yuma may apply to the entire project area and not just Yuma County, Arizona. Figure 1 [69] shows the study area.
Irrigated crop production in Yuma was initiated in the late 1800s and has flourished for more than 100 years in part because of a long, nearly frost-free growing season, fertile soils, and the dependable availability and quality of irrigation water. Over the past 40 years, crop production systems changed dramatically as the area developed into a primary location for U.S. winter vegetable production. Yuma County ranks fourth among 2802 U.S. counties with vegetable sales (including melons and potatoes) and ranks second in lettuce acreage among 1049 U.S. counties [70]. This change entailed a shift from perennial and summer-centric crop production to winter-centric, multi-crop systems focused on producing high-value vegetable crops. Growers quickly realized that traditional approaches to crop irrigation had to be modified in order to address the challenges of irrigating large acreages of shallow-rooted vegetables. Consequently, growers adopted a number of improved irrigation practices that collectively have resulted in a significant decrease in the amount of water used for irrigation.

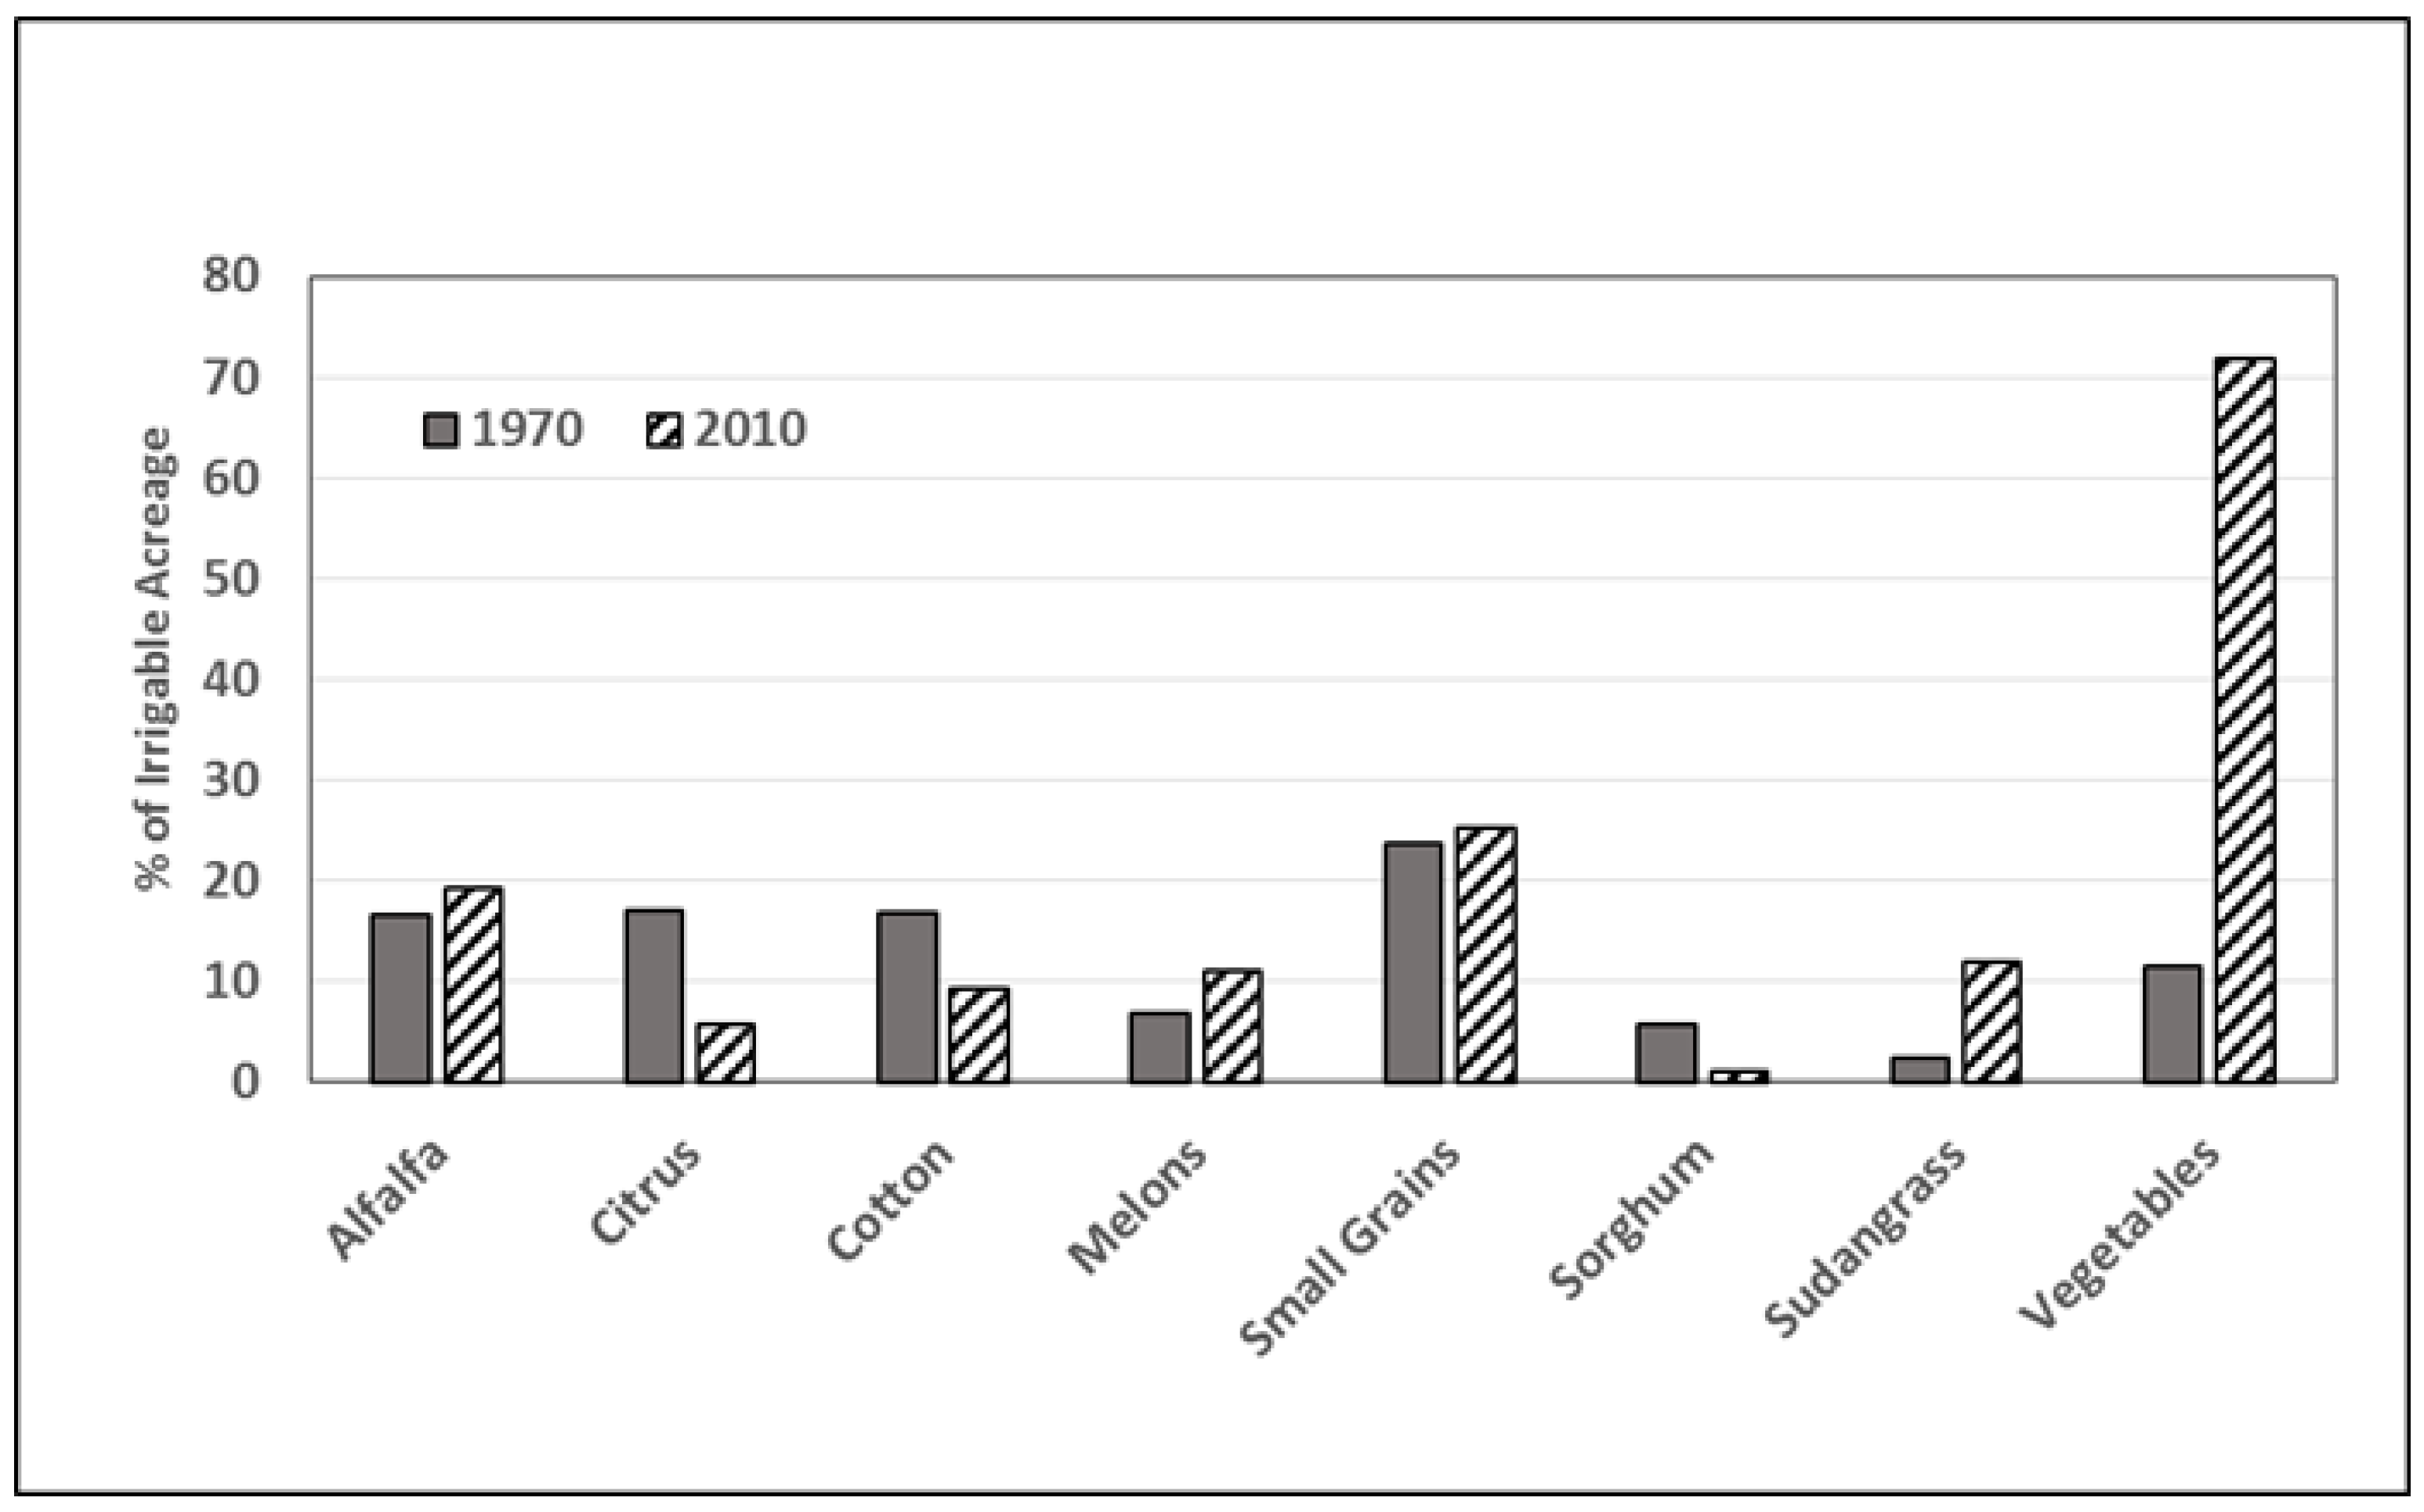
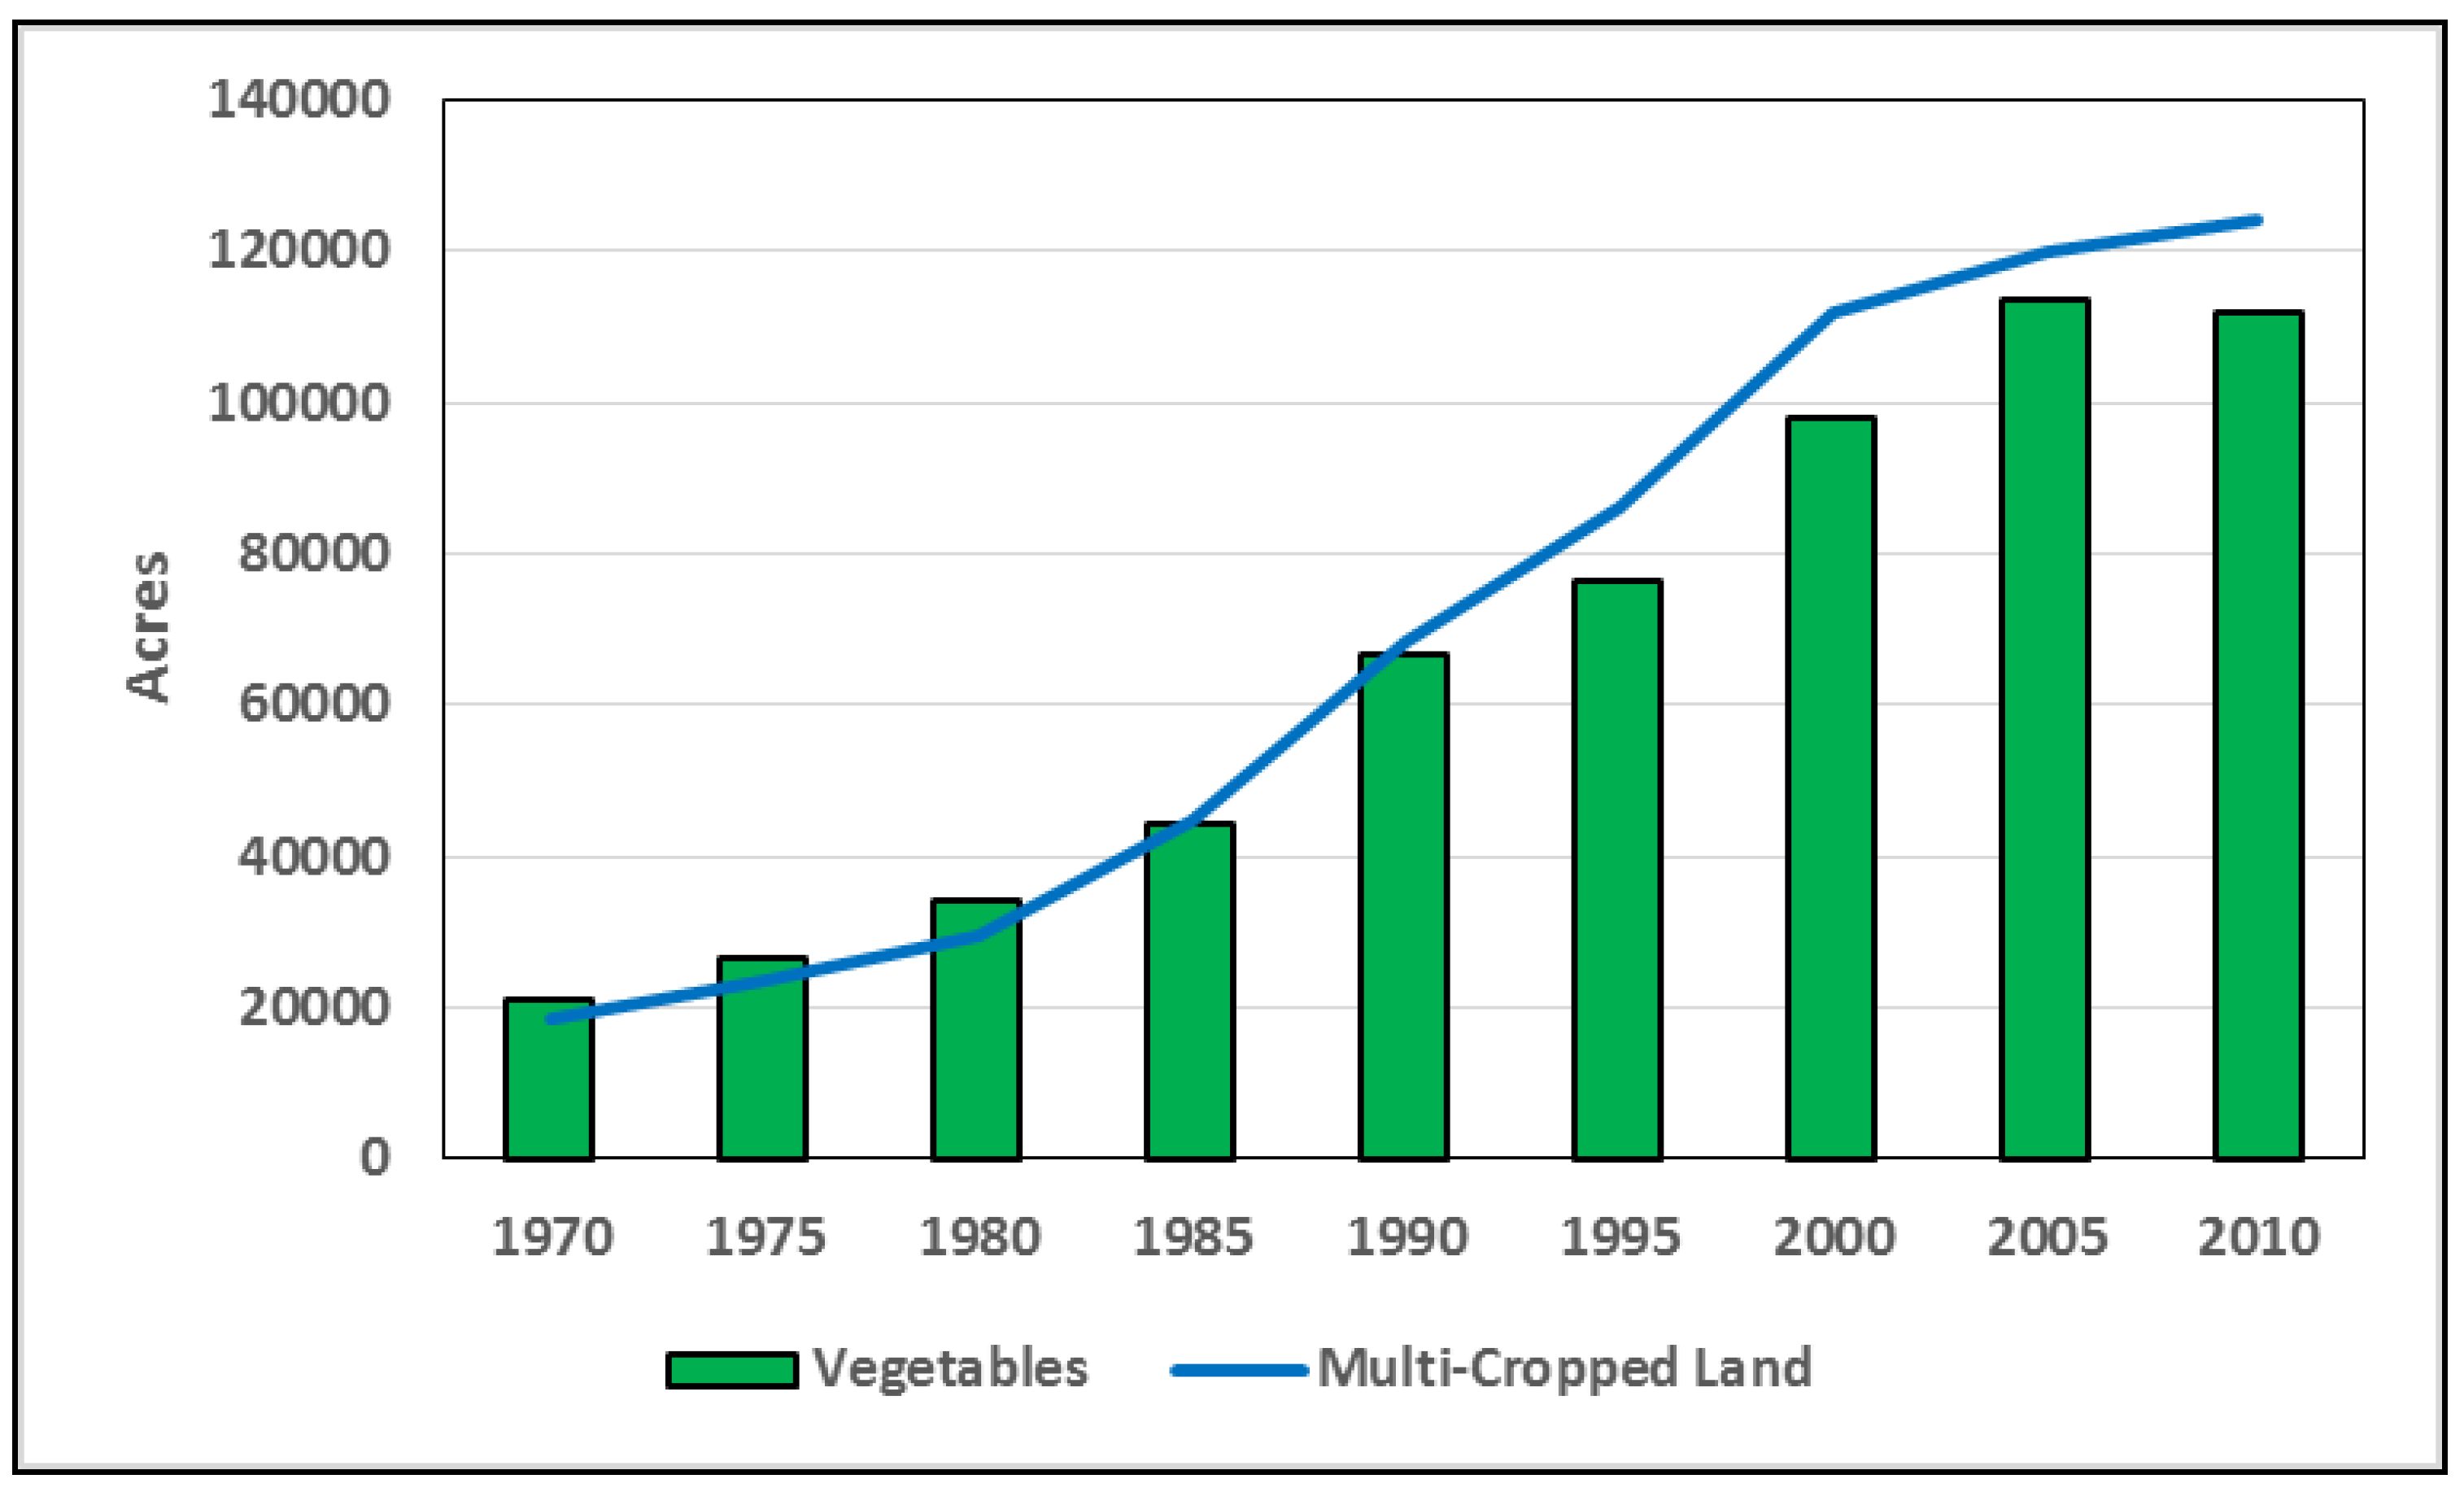
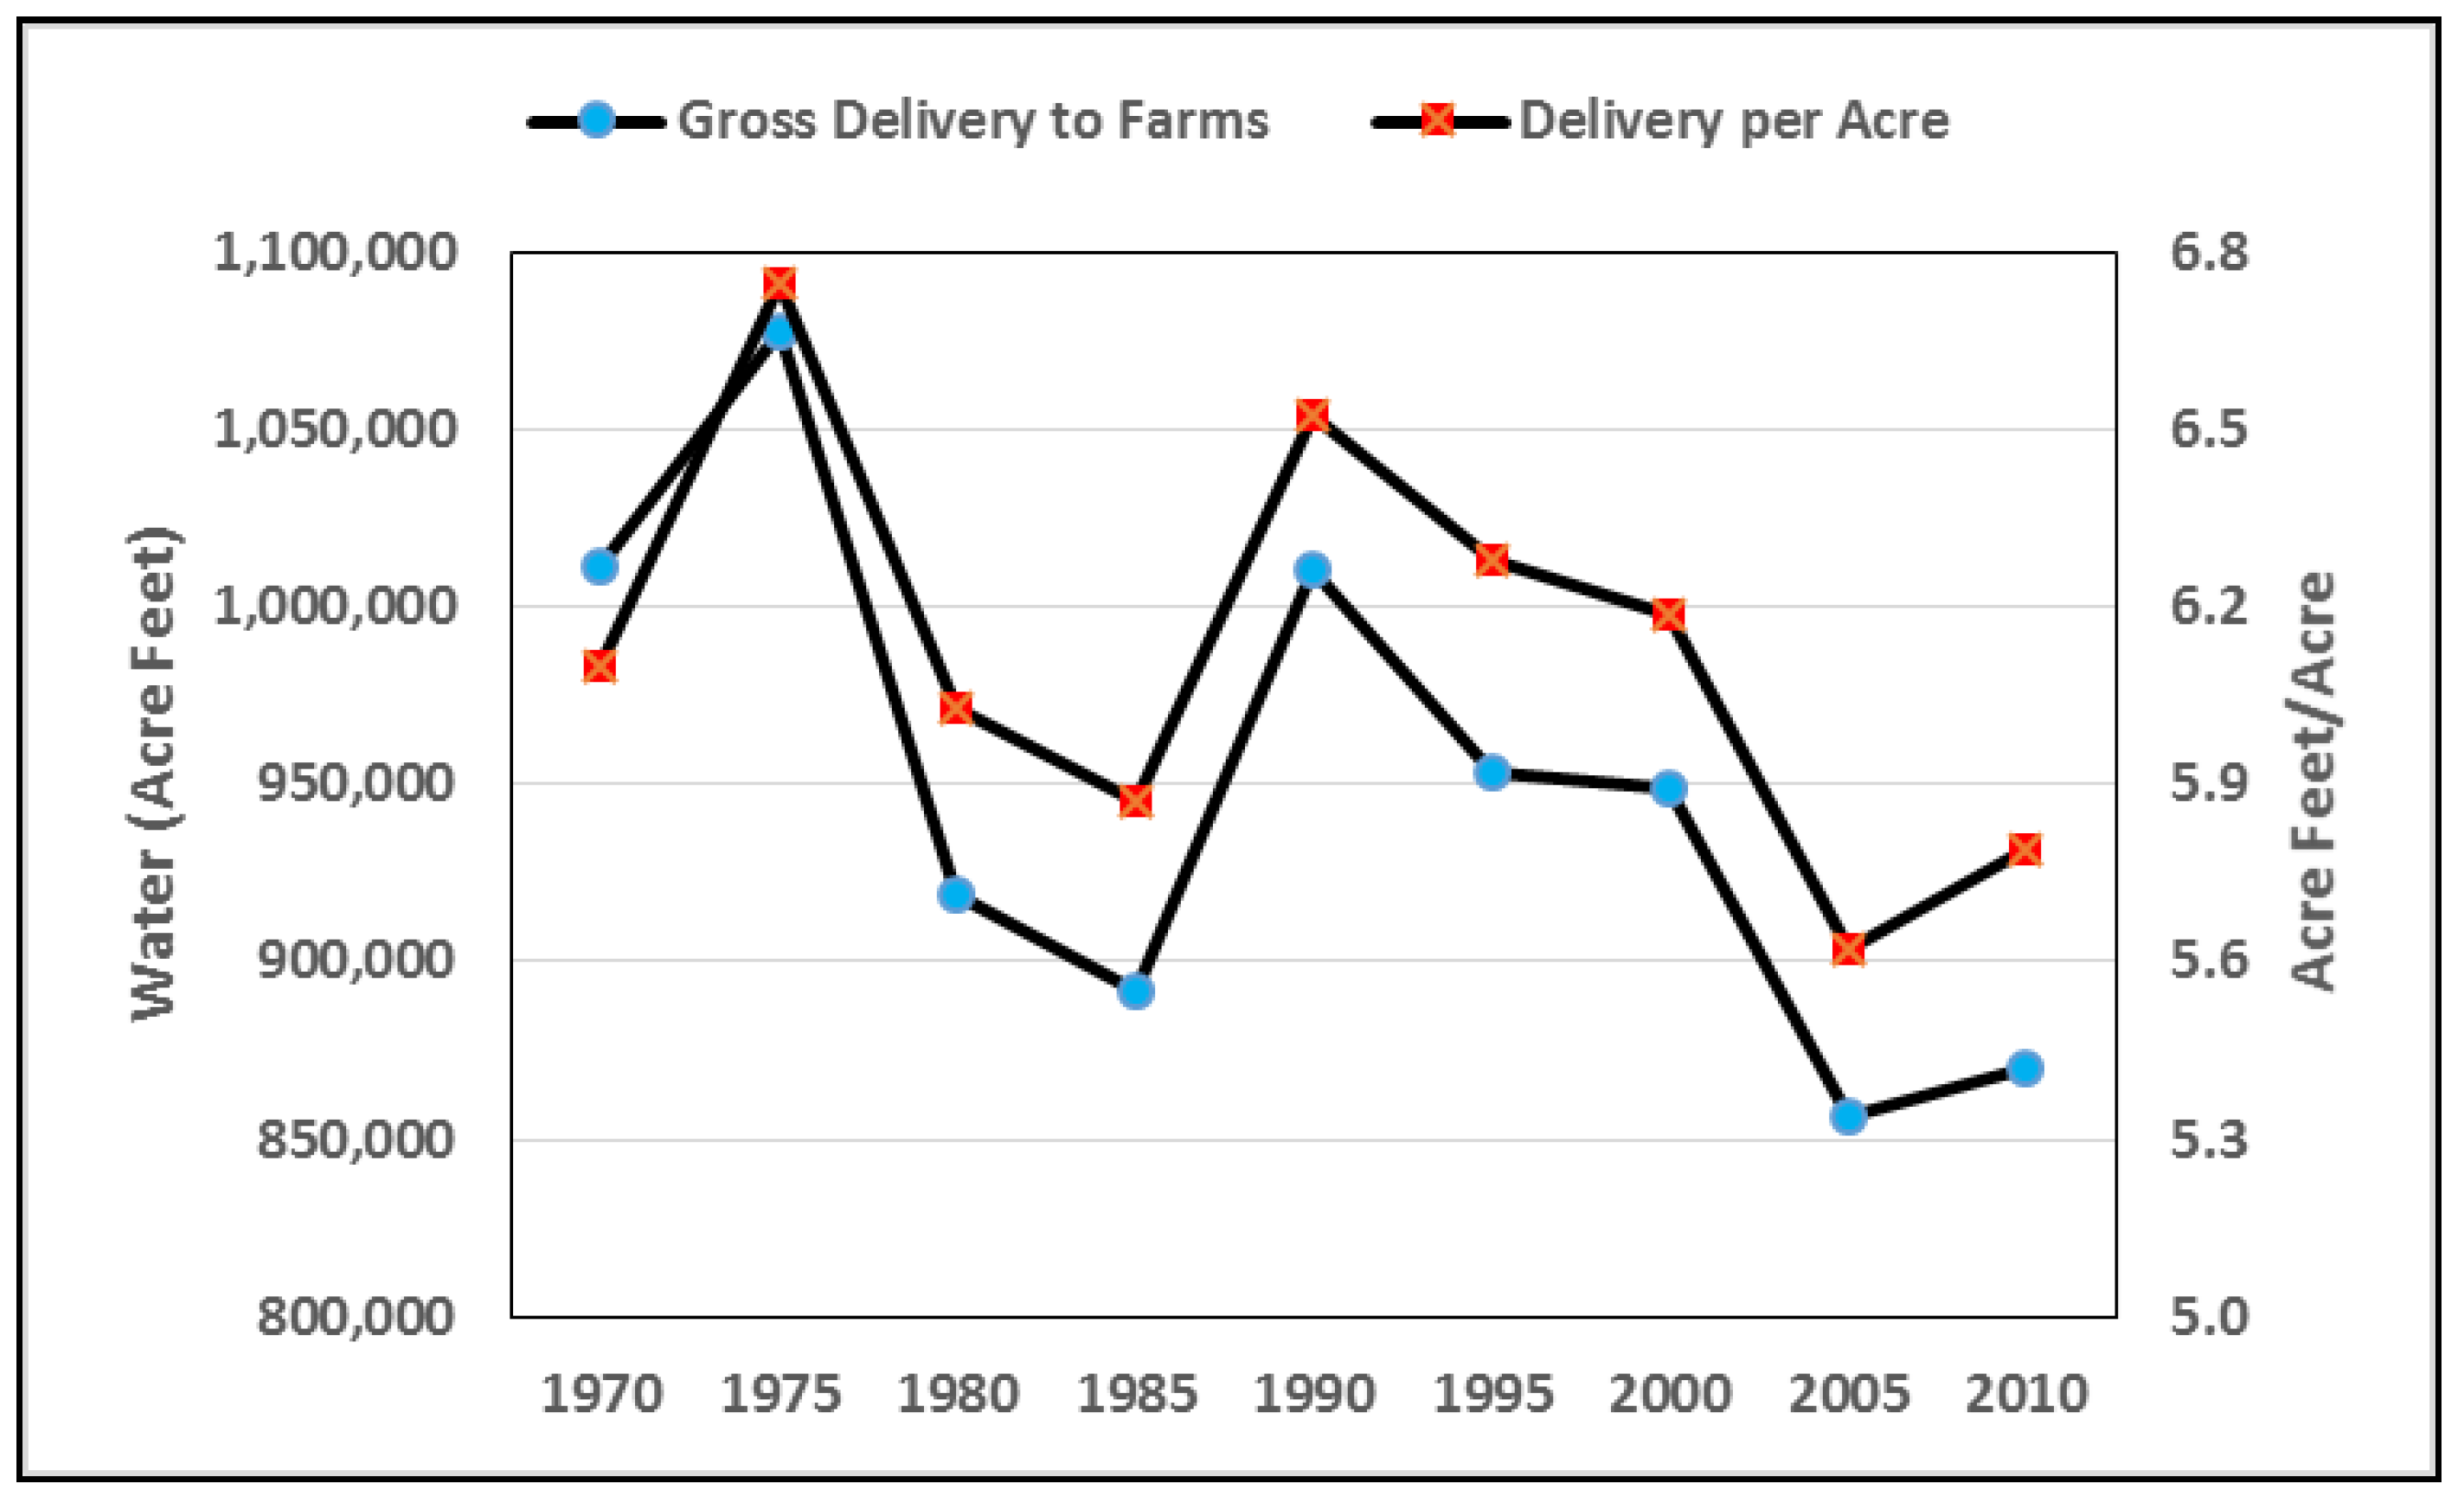
6.1. Yuma Area Agriculture: 1970 versus 2010

Yuma agriculture is exceptionally productive compared with the rest of the United States. In 2012, Yuma County gross crop revenues per acre of cropland averaged $3595 per acre, compared with a national average of $589 per acre [71,72]. The climate is conducive to year-round crop production, allowing production of a wide range of cool and warm-season crops. The alluvial soils along the Colorado and Lower Gila rivers produce exceptionally high yields provided that irrigation water is readily available. Crop yields in Yuma County are typically higher than yields for equivalent crops in the rest of Arizona and are nearly always higher than the national average [71].
Agricultural production has changed significantly in Yuma over the past four decades. The production systems of the 1970s focused on perennial crops (e.g., alfalfa and citrus), or warm season crops (e.g., cotton and sorghum) (Figure 2). The dominant winter crop was wheat, which served as the transition crop for growers rotating from cotton to alfalfa, or the second crop in multi-crop production systems that included vegetables or melons. Less than 17% of the irrigable land was planted to vegetables in 1970, and just 10% of the land was planted to multi-crop production systems.
The nearly six-fold increase in vegetable production since 1970 has led to a rapid increase in multi-cropped acreage and reduced perennial and full summer crop production (Figure 3). Vegetable acreage is now three times greater than any other crop. More than 70% of irrigable acres now support multi-crop production systems. Land planted to citrus, cotton, and sorghum decreased by 70%, 50%, and 85% while the seasons for summer annual forages (sudangrass) and cotton were shortened to ease the transition of land back to fall and winter vegetable production. Land dedicated to traditional crops (alfalfa, cotton, citrus, and sorghum) has decreased 43% since 1970. Alfalfa production has remained relatively stable (15–20% of irrigable acres) over the past 40 years, which has been due largely to regional population growth and demand for dairy products. Wheat serves as an excellent rotation crop with vegetables, remaining the second largest acreage crop in Yuma County.

6.2. Field-Level Agricultural Water Use and Irrigation Management

Water deliveries to Yuma farms reflect changes in Colorado River management and the changing dynamics of Yuma agriculture (Figure 4). Farm deliveries declined from 1975–1985, in response to the Colorado Basin Salinity Control Act of 1974. This led to two changes affecting water deliveries in the Wellton-Mohawk Irrigation and Drainage District (WMIDD). The first was retirement of 10,000 acres with sandy, high infiltration-rate soils. The second was a program to improve irrigation management that involved leveling 44,000 acres, lining 263 miles of farm canals, and constructing 10,600 on-farm water control structures [74]. In addition, the USBR Irrigation Management Services Program provided irrigation scheduling assistance to growers. The Salinity Control Act requirements led to reduced WMIDD on-farm water deliveries of about 145,000 acre-feet (AF) annually from 1975–1985 and increased district-wide irrigation efficiencies from 56% to 72% [74].
Water deliveries to Yuma farms increased by 120,000 AF in the late 1980s (Figure 4). Much of this increase occurred in valley districts where vegetable acreage rapidly increased. Then, it was standard to germinate newly planted vegetable fields using subbing—filling furrows with water for seven to 10 days to facilitate uniform germination and early season crop development. While subbing was an effective way of germinating vegetable crops, the technique greatly increased water demand for vegetable crop establishment between September and November. Considerable water was lost to percolation below the root zone, reducing irrigation efficiencies, and leading to problems with high water tables. Since 1990, water deliveries to Yuma farms have declined, and are now at their lowest levels since 1970 (Figure 4). Several factors contributed to this 15% decline. One is urbanization, reducing irrigable acres by about 3%. About 46% of the acreage reduction occurred on the Yuma Mesa, with the remaining 54% in valley districts. However, a 3% irrigable acreage reduction alone cannot account for a 15% reduction in water use. Farm water deliveries per acre also declined by about 0.8 AF per acre since 1990 (Figure 4).
The growth in Yuma vegetable production reduced water use through its impact on crop production seasons. Water requirements of multi-crop systems are often less than those for perennial and full-season production systems. Crop evapotranspiration (ETc) rates of leafy green vegetables, broccoli, and cauliflower typically range from 12 to 18 inches. When combined with ETc from the second crop—durum wheat (ETc 20′′), spring melons (ETc 19′′), sudangrass (ETc 36′′), or short season cotton (ETc 34′′)—the combined ETc of multi-cropped systems is often less than the traditional cropping systems of the 1970s (Figure 5). Multi-cropped systems use less water because the crop following vegetables matures in late spring (wheat and melons) or midsummer (cotton and sudangrass), eliminating the need to irrigate during the latter half of the summer, when evaporative demand is high. This impact is evident comparing monthly farm water deliveries in the 1970s to those during the most recent decade (Figure 6). Farm water deliveries in valley districts supporting vegetable production have decreased substantially between July and September. During the past decade, only from October to December—the establishment months for winter vegetables—have water deliveries increased (relative to the 1970s).
Improved irrigation management also reduced water use. Growth in vegetable acreage is notable, considering vegetable crops are shallow rooted. Irrigation water that infiltrates more than 12 to 18 inches below the surface cannot be accessed by the crop and moves to the water table, where it is returned to the Colorado River. Crop yield and quality considerations provide economic incentives for improved irrigation management. Vegetable crops are sensitive to water management. Over-irrigation as much as under-irrigation reduces crop yield and quality. Over-irrigation adversely affects root respiration and plant energetics, makes mobile nutrients such as nitrogen difficult to manage, and increases disease incidence.
Yuma producers have adopted a number of technologies and cultural practices to improve irrigation management and efficiency. Before discussing these practices, we must define concepts. There are several ways to examine the efficiency of water use in irrigated agriculture.
Irrigation Efficiency (IE) is often defined as water used by the crop consumptively (ETc) relative to that applied to the crop. This expression can have local (field-level) or global (district-wide) ramifications. More recently, “water used beneficially” has replaced ETc in the definition of IE.
Water-Conveyance Efficiency (WCE) is the ratio of water reaching the farm to water diverted from its source. This water may or may not be accounted for in a district-wide assessment of irrigation efficiency, but would be excluded from estimates of farm-level efficiency.
Application Efficiency (Ea) refers to the depth of water required relative to the amount of water applied in a single irrigation event. The required depth is typically the amount of water that is required to offset soil water depletion resulting from ETc, but may include a leaching fraction for salt management. Ea usually needs to be discussed concurrently with distribution uniformity. This refers to how uniformly water is applied to a field. For example, field-wide Ea may be high, but if distribution uniformity is low, parts of the field will be under-irrigated and/or over-irrigated.
Water-Use Efficiency (WUE) is defined as marketable yield relative to ETc [43].
Economic Water Productivity (EWP) is defined by the United Nations (UN) Food and Agriculture Organization as the monetary value generated from each unit of water consumed [75]. It is the monetary value of production divided by ETc. While monetary values of crops are readily available by agricultural statistical agencies reported at regional or national scales, data at the same scales are rarely available for ETc. It is more common for water “use” to be reported as the volume of water applied to farms or the volume of water diverted from a source for irrigation.
There are beneficial uses of water that may or may not be imbedded into these expressions of efficiency. For example, land that is fallowed for part of the summer is frequently pre-irrigated before the produce season to leach salts that accumulate during the summer. Atmospheric evaporative demand is high in summer, and water moves by capillarity from the underlying moist soil to the dry soil surface in the fine textured soils of the valley. Water evaporating from the surface leaves behind soluble salts that must be leached below the crop root zone to preclude salt damage to sensitive vegetable crops such as lettuce. Pre-irrigation also hastens residue decomposition (e.g., wheat or cotton stubble), providing moisture for seed-bed preparation. Pre-irrigation water would be considered in measures of district-wide efficiency, but would generally not be considered in measures of individual crop WUE.
Another beneficial use is water that is used for microclimate modification. Thermodormancy inhibits the germination of lettuce and other vegetables. Appreciable amounts of water are often used during stand establishment to moisten seed beds and reduce near-surface soil temperatures to combat thermodormancy during late summer and early fall. Water used this way might reduce water-use efficiency relative to ETc, but is required for successful stand establishment. Water is also occasionally used for frost control. Irrigating immediately before a forecasted frost increases the heat capacity and thermal conductivity of near-surface soils and increases the dew point within the crop canopy, providing some protection from frost damage.
Recognition that not all water beneficially used is ETc prompted Burt et al. to define irrigation efficiency as the ratio of water beneficially used to the volume of irrigation water applied [76]. Beneficial uses include salt removal (leaching), climate control, soil preparation, and water harvested in the crop (e.g., water contained in harvested melons, produce, etc.). Burt et al. identified another performance indicator, irrigation sagacity, which he defined as the water used for both beneficial and reasonable uses relative to water applied. Examples of reasonable uses include sprinkler and reservoir evaporation and percolation losses due to irrigation non-uniformity [76].
Discussion of improved irrigation management in the Yuma area must consider on-farm infrastructure used for the delivery of irrigation water. The volume of system losses to evaporation, seepage, and phreatophytes in main canals, laterals, and ditches are highly dependent on whether structures are lined or unlined or within closed conduits. Within the Yuma area, over 70% of the main canal miles are lined, nearly 90% of the laterals are lined, and over 80% of the on-farm ditches are lined.
Efficient water application requires predictable, constant, and manageable inlet flows. High-flow concrete turnouts have been installed in many areas, allowing large volumes of water to be applied to basin and border irrigated field crops. The more quickly water can be transported downstream across fields, the less time water has to infiltrate below the root zone toward the inlet end of the fields. Along with high-flow turnouts, border width is often manipulated to optimize inlet flow per unit border width, reducing irrigation time and losses due to water infiltrating below the root zone.
Yuma growers have also embraced laser leveling. The efficient overland flow of water depends on land grade, and smooth grades reduce friction or hydraulic resistance. Laser leveling was introduced into the region over three decades ago, and currently, all the fields used for crop production are laser leveled at least once a year. All the vegetable crops in the Yuma area use impounded level furrows with zero slope and do not allow for runoff [77], and most field crops use impounded level basins. Level furrow and level basin systems represent the most efficient means of surface irrigation, with application efficiencies averaging 80–85% [78]. While some subtle slope is desirable in some cases, excess slope results in poor water distribution uniformity caused by water ponding at the downstream end, and insufficient time for infiltration at the inlet end of the field [79].
Furrow geometry also improves water management. During the first cultivation after stand establishment, growers press the furrows into a tight trapezoidal configuration using an implement known as a press wheel or bola. The trapezoidal configuration reduces friction, enabling the rapid movement of water down furrows. Field length along the irrigation run also affects water application efficiency and uniformity. Accordingly, over the past 30 years, irrigation runs have been reduced. While irrigation runs of 0.25–0.5 miles were not uncommon in the past, current irrigation runs for vegetable crops seldom exceed 600 feet (0.125 miles less the ditches and field roads). Short runs coupled with zero slope and proper inlet flows allow for highly efficient distribution uniformities and application efficiencies (Figure 7).
Clean cultivation is a cultural practice that has improved irrigation application efficiencies in citrus groves located on the Yuma Mesa. In the past, most citrus groves were routinely disked to control weeds. Over time, increased friction and hydraulic resistance from these roughened surface soils increased the time required to move water across the field, lowering application efficiency. Weeds are now routinely controlled with herbicides or less disruptive cultivators, resulting in smoother surfaces and faster water advance times.
The use of sprinklers has been a significant factor contributing to improved irrigation efficiency. Two decades ago, vegetable crops were principally established by subbing. This practice involved running water in furrows until crop emergence, which typically took seven to 10 days. Given that typical valley soils have a water intake rate of three to five inches per day, estimates for water used for subbing ranging 18–37 inches. Conversely, sprinklers used for crop establishment are typically run for 24 h continuously, and 4–6 h per day thereafter as needed to keep the soil surface moist. The typical solid-set sprinkler system used in the region delivers about 0.125 inches of water per hour. Given that a typical sprinkler system is operated for up to 68 h during crop establishment, the water required for crop establishment is reduced to approximately 8.5 inches, with three inches of establishment water remaining in the top foot of soil and available for use by the crop.
More recently, sprinklers have been used for season-long vegetable production. This is due to an increase in vegetables produced on 84-inch beds, including spring mix lettuce and brassica crops, spinach, and romaine hearts, where furrow irrigation is not possible. Sprinklers also are routinely used to establish stands in wheat, resulting in additional water savings. The use of sprinklers potentially enables growers to apply amounts of water nearly equal to the water lost to ETc. The hand-move systems used in the Yuma area are generally well designed. Yet, it is of utmost importance that sprinkler systems be operated and maintained for the uniform delivery of water. Poor distribution uniformities lead to poor efficiencies because growers adjust system run times to ensure that drier portions of the field (areas receiving lower water deliveries) receive adequate water. This leads to over-irrigation of part of the field.

6.3. Components of Irrigation Scheduling

Irrigation scheduling methods have also improved in Yuma. Three principal questions must be addressed to effectively manage irrigation. When should water be applied (irrigation timing)? How much water should be applied (required depth)? How should an irrigation system be managed to apply this required depth?
For most crops, water must be applied before available soil water is depleted to some critical threshold where a further decrease would result in irreversible yield and quality losses. This threshold, specific to each crop, is known as the management allowable depletion (MAD). Field crops often can handle higher levels of soil water depletion. For example, cotton will tolerate up to 60% depletion of available water without yield loss. Vegetable crops are more sensitive to soil water depletion and generally have lower MAD values. Using lettuce as an example, irrigation must be applied before 40% of the available water is depleted (Figure 8).
Rooting depth for cool season vegetables averages about 18 inches, and a typical medium to heavy textured soil in the lower Colorado River Valley holds four to six inches of total water per foot of soil. However, only about 50% of this water is available for uptake by the crop. Irrigations must occur when just 40% of available soil moisture or 1.2 to 1.8 inches of water have been used by the crop. This determination can be made by direct measurements of soil moisture (soil moisture sensor in Table 5) or indirect estimates derived from weather-based estimates of environmental evaporative demand (daily ET reports in Table 5) known as reference evapotranspiration (ETos) [80,81]. These values are used with experimentally determined crop coefficients to estimate ETc.
The minimum required depth of water to apply equals the amount depleted since the last irrigation, with a possible adjustment for leaching for salt management. For loam to clay loam soils, the required depth would be approximately 1.2 inches and 1.8 inches, respectively, for lettuce. For many other Yuma crops, the required depth of water would be greater and depend on rooting depth, MAD, and soil type. Lighter, sandy soils hold less water and require water application more often than heavier textured soils, but would require less water to refill the rooting zone each irrigation. For lettuce irrigated with Colorado River water, the required leaching is typically 20%. However, the required leaching does not have to occur every irrigation, but rather across the growing season overall to avoid detrimental salt build-up and osmotic stress. Required leaching volumes can be restricted to certain irrigations where management of mobile nutrients, such as nitrogen, are less critical. In practice, much of the required leaching can be achieved with the pre-irrigation and water applied to the rotational crops.
How an irrigation system should be managed to achieve the required water depth depends on infrastructure. For sprinkler and drip systems, the application of water to offset ETc or ETc plus a required leaching fraction is a relatively simple task if the conveyance system is well maintained and operated. Application frequency is largely a logistical consideration because low volume deliveries can be achieved. However, for surface irrigation, water application should occur when the MAD is reached, because maximum soil storage capacity is needed to avoid deep percolation losses. The optimal operation of surface systems requires the careful manipulation of flows, cutoff time, or distance, and knowledge of field hydraulic characteristics such as bed slope, friction slope, and infiltration parameters.
Since it is impossible to gain such data on every field, approximations have been developed through hydraulic modeling. If the resulting model is calibrated using field data and validated with independent field data sets, criteria for system operations can be developed for various irrigation scenarios [79,82] and provided to growers through generalized operation manuals [83,84]. With the proper adjustment of the factors, water-application efficiencies approaching 90% can be obtained for furrow irrigation in Yuma area valley soils.
The sandy soils on the Yuma Mesa present a special challenge for surface irrigation. Infiltration rates range from three to four inches per hour, and soil water-holding capacities run approximately 3.5 inches per foot. Assuming 50% of the soil water is available for plant uptake, a MAD of 50%, and a rooting depth of two feet for citrus, it takes only 1.8 inches to refill the rooting zone. This is difficult to achieve at infiltration rates of four inches per hour. Irrigation efficiencies for the Mesa districts have historically averaged less than 40%. However, using the technologies noted above, including laser leveling, clean cultivation, narrow borders, high flow turnouts, and water cutoff before the water reaches the end of field, irrigation efficiencies approaching 65% for citrus and 55% for alfalfa have been attained.
One proposed technique for improving Yuma irrigation efficiencies is drip or trickle irrigation. Research has shown drip irrigation can be used for vegetable crops in Arizona [85,86,87]. However, less than 2% of the vegetable acreage in Yuma is irrigated by drip. Drip is generally only used where production advantages compared with surface irrigation are evident, as with watermelon, and to some extent cantaloupes. There are several factors besides low-cost water and high installation costs that discourage the use of drip irrigation in Yuma. There is no production advantage for cool season lettuce and brassica crops, because wetting is insufficiently uniform to establish the crop. Sprinklers are therefore needed for crop establishment. Secondly, the need to leach salts remains. The use of buried drip irrigation leads to the accumulation of salts near the soil surface, which can only be removed through periodic leaching using flood irrigation, which significantly reduces the potential water savings. A third complication is the variable ways that crops are planted or configured in fields. For example, two-row bed lettuce and brassica crops are planted on beds oriented in a north–south direction so that one row does not shade the other. Spring melons are typically planted on the south side of beds oriented in an east–west direction to capitalize on solar warming. Many crops such as wheat and sudangrass are planted in basins. In addition, row widths can vary. Most two-row vegetable crops are planted on 40 or 42-inch raised beds, but a single row of cauliflower is planted on 38-inch beds. In many cases, two-row romaine hearts are planted on 34-inch beds, and most of the spring mix is planted on 80 or 84-inch beds. A buried drip system once installed will restrict crop rotations and planting configurations. One area where pressurized irrigation might be given further consideration is citrus production on the Yuma Mesa [88]. Both drip and micro-sprinklers are possibilities.

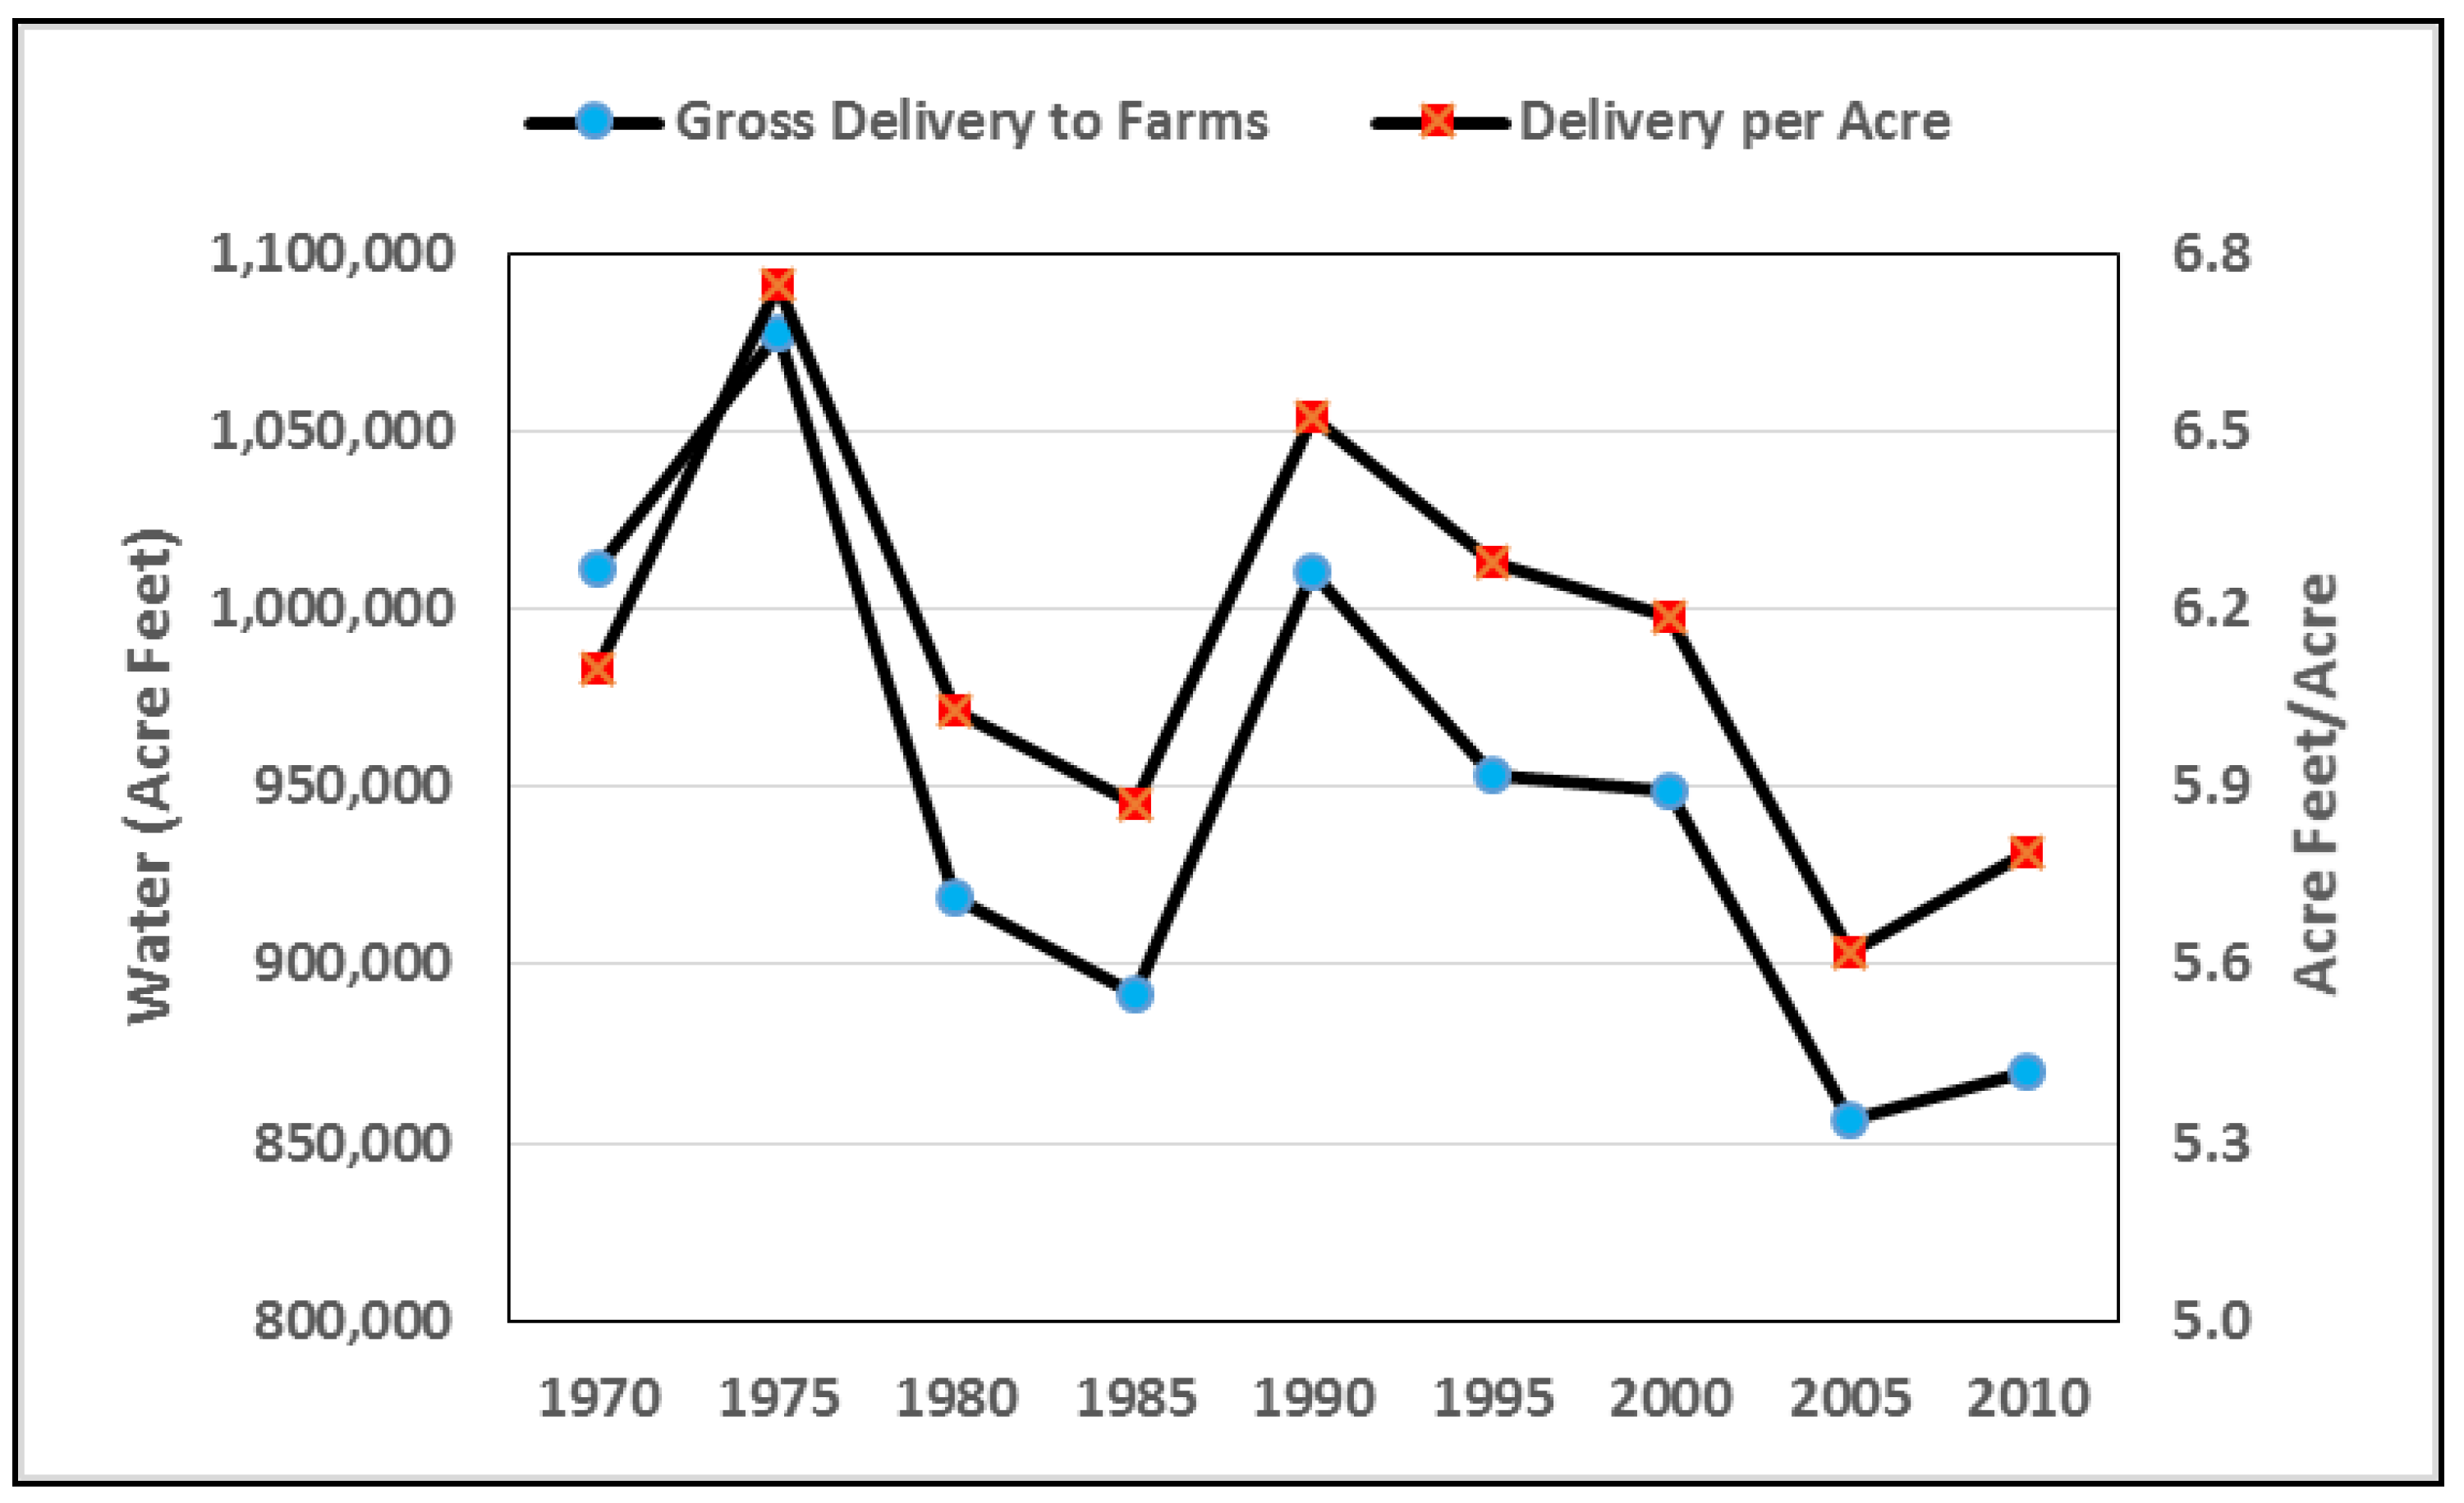
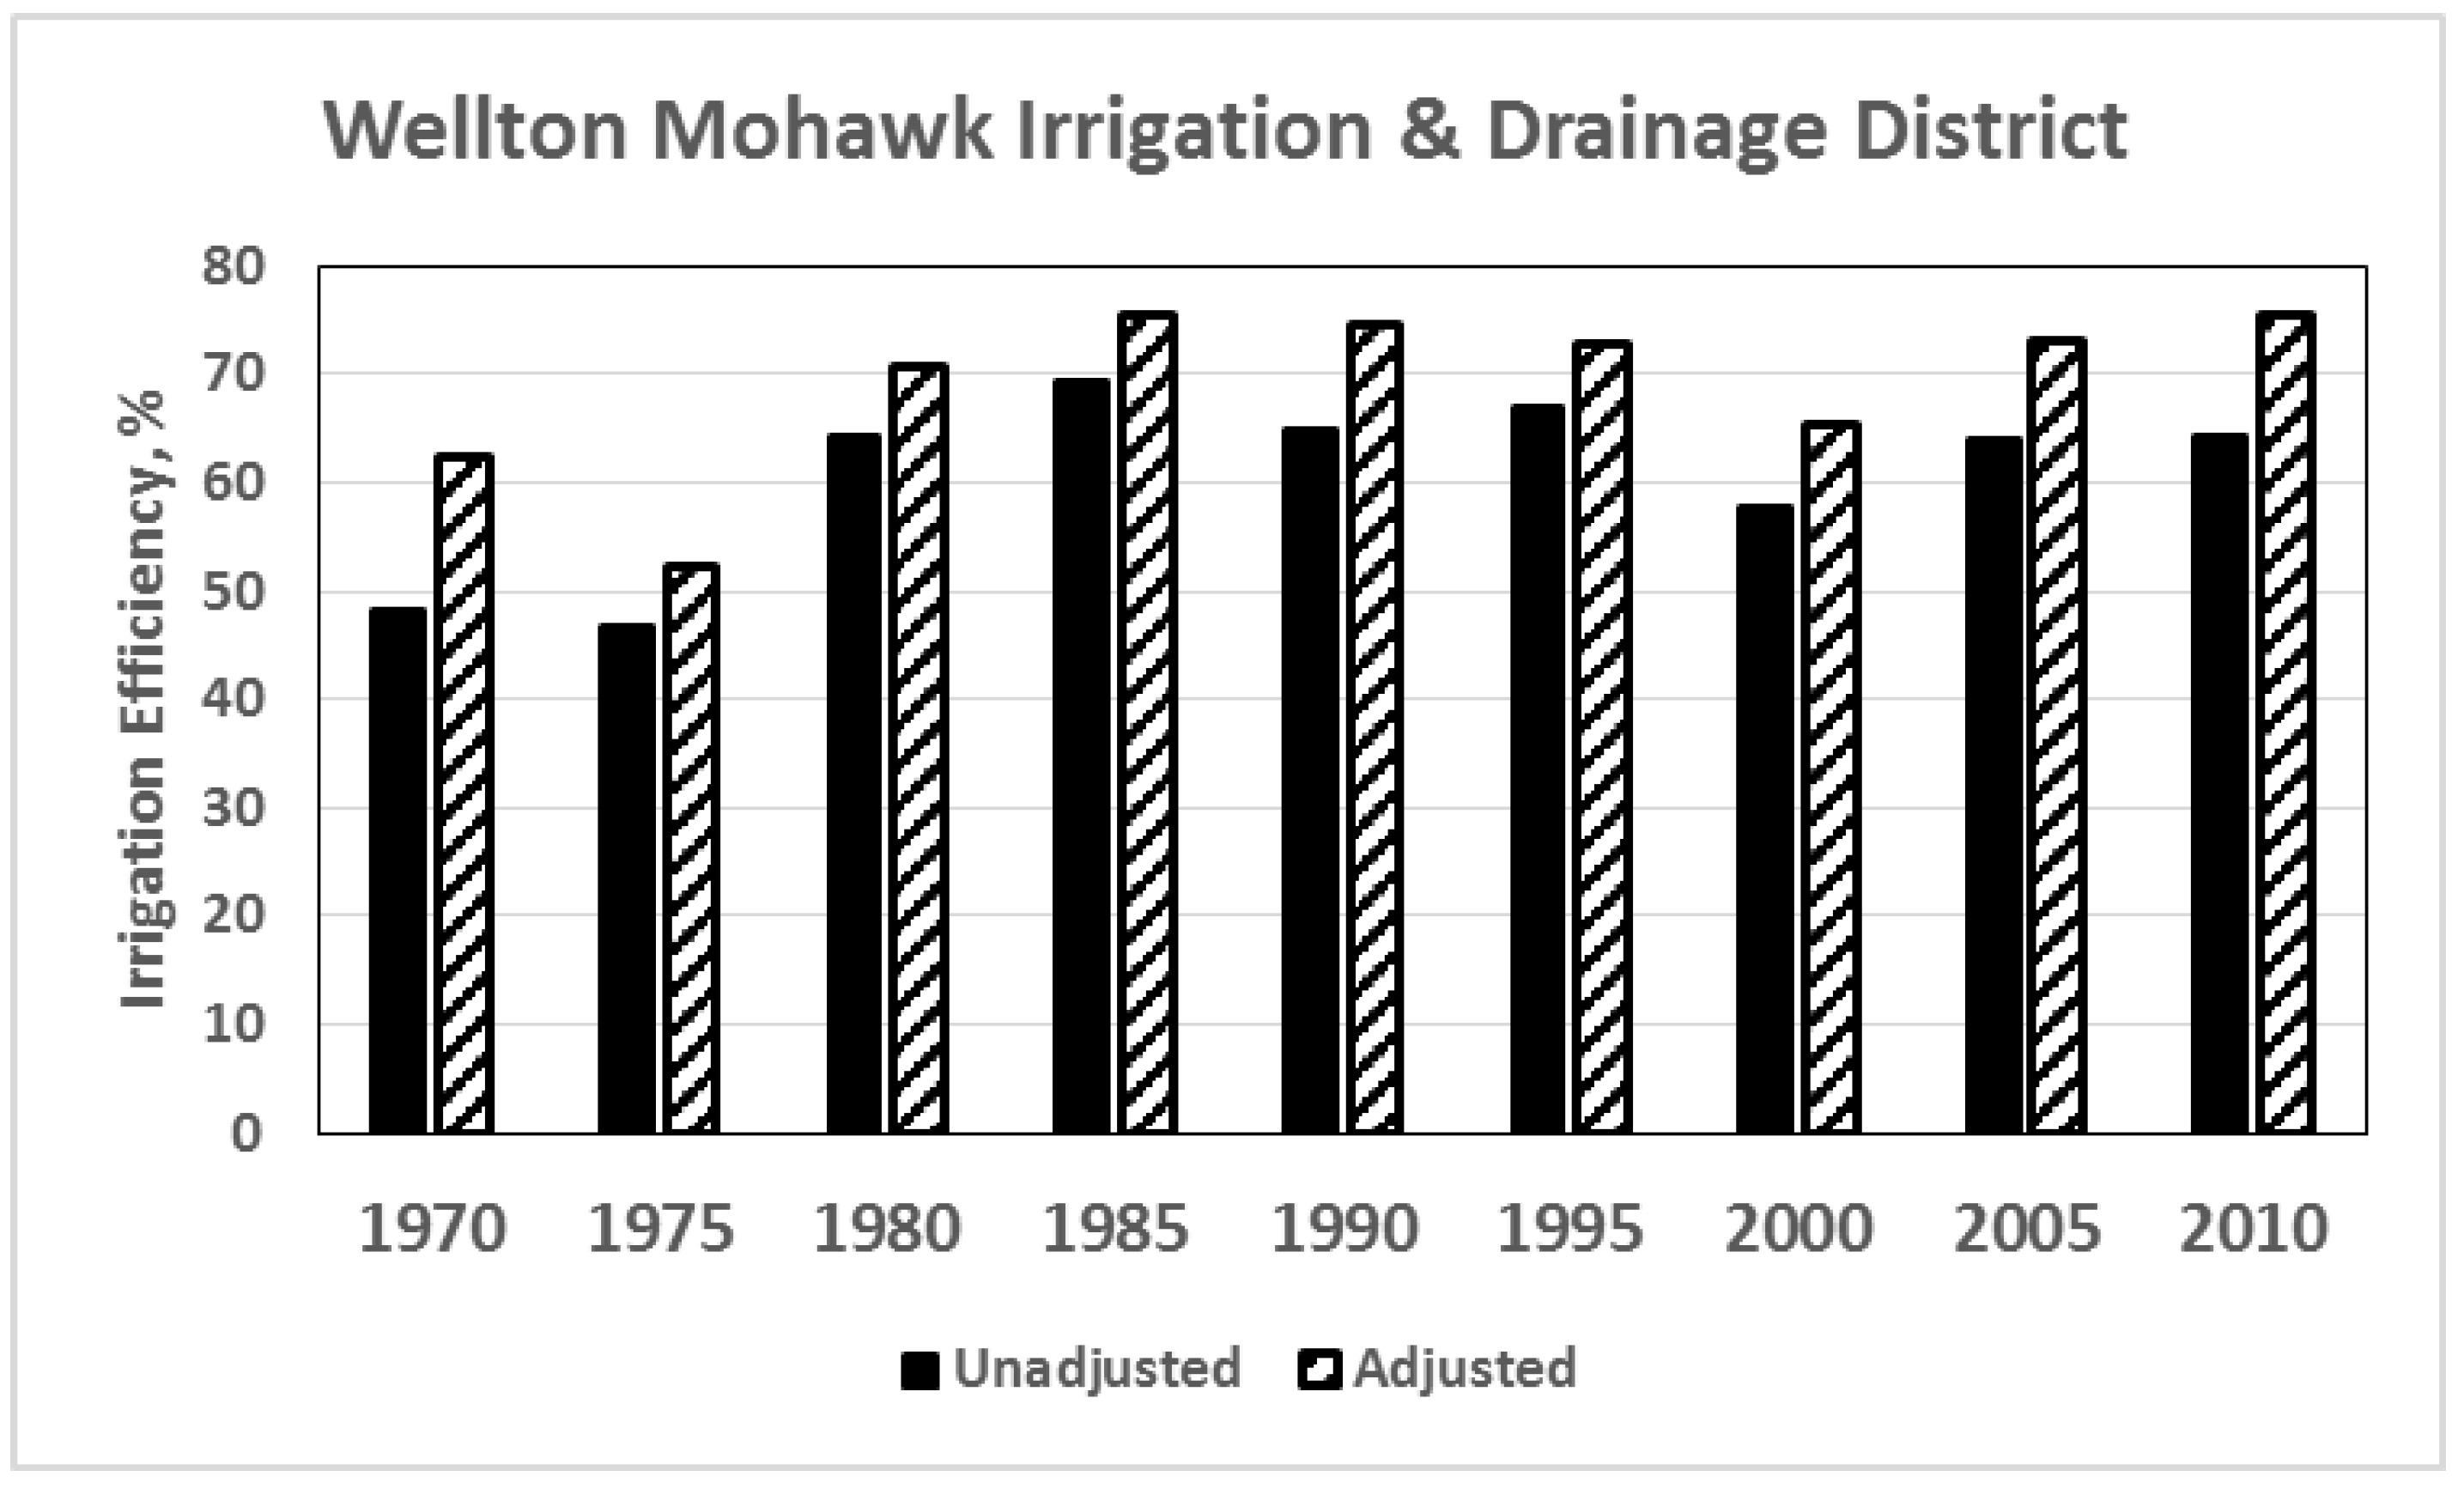
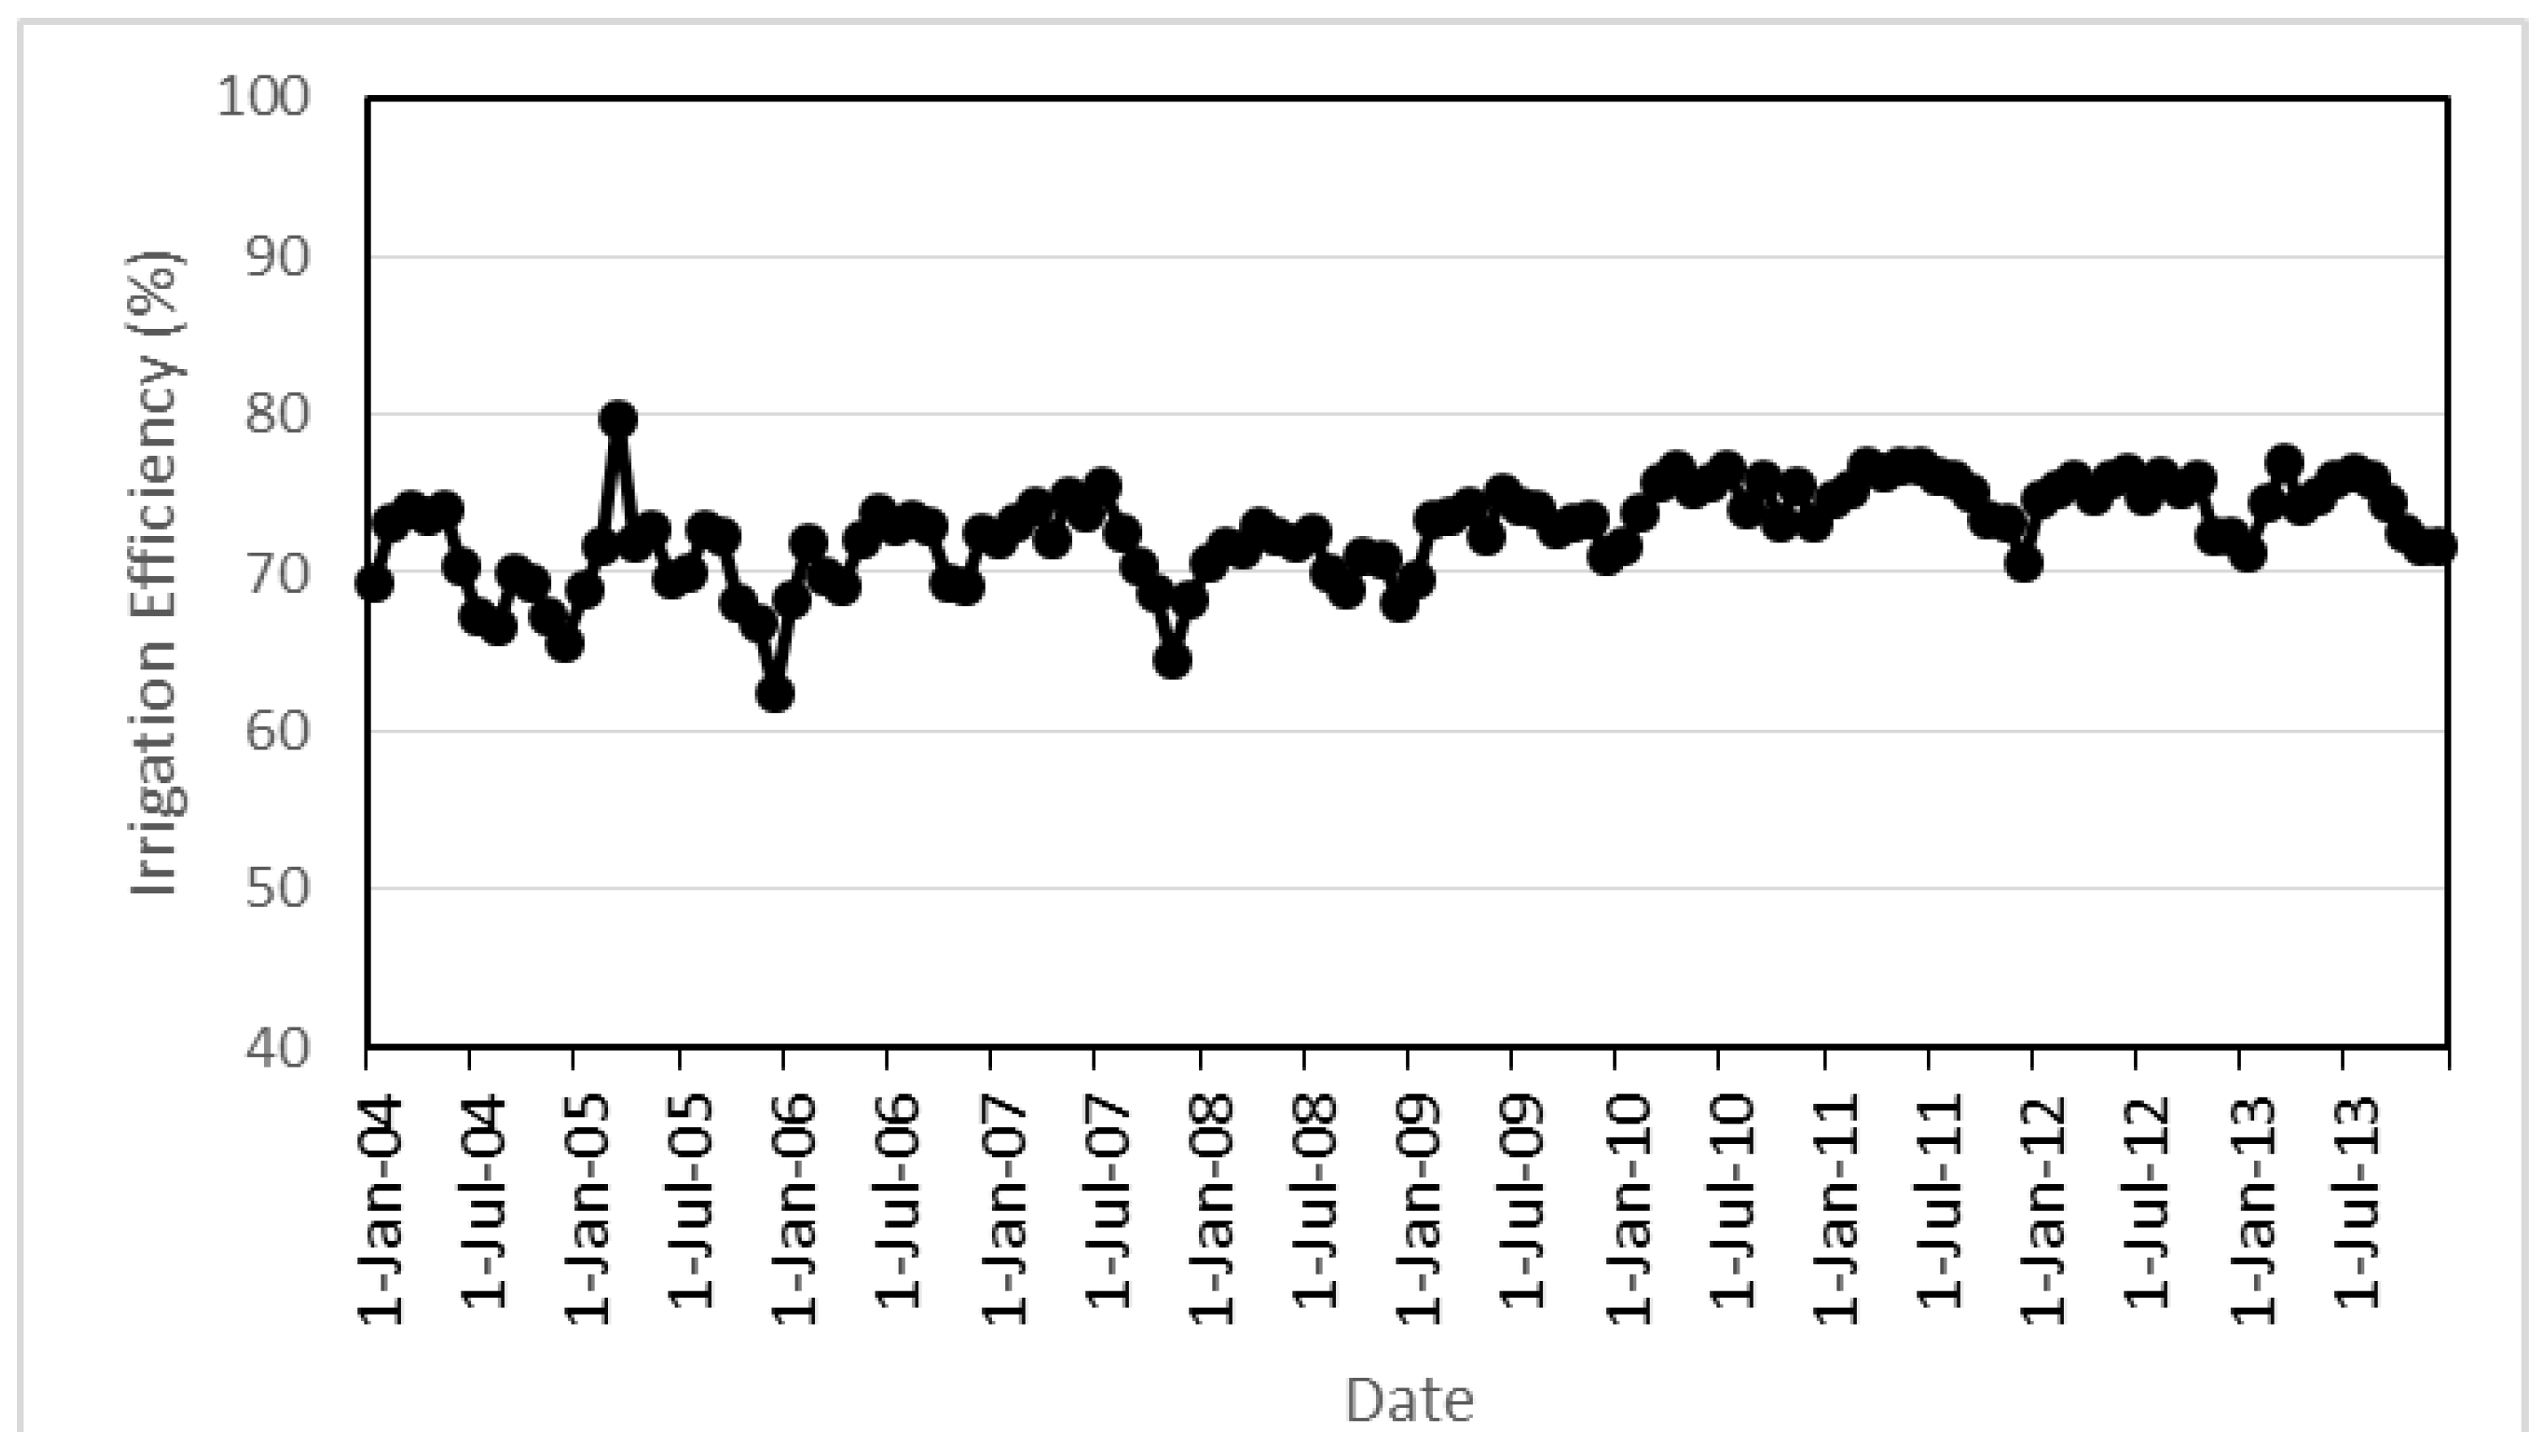
6.4. Basin-Scale Yuma Irrigation Efficiency

Information about irrigation efficiency on a district-wide basis is limited in Yuma [74]. One means of addressing this issue is to relate ETc to the total amount water diverted to farms. This procedure restricts the beneficial use of water to ETc and does not account for other beneficial uses of water such as leaching, microclimate modification, and water for tillage. Well-established procedures for estimating ETc have been developed over the past two decades [80,89] and consist of using crop-specific adjustment factors (crop coefficients: Kc) to convert meteorological estimates of environmental evaporative demand, known as reference evapotranspiration (ETos), into accurate estimates of ETc:
ETc = Kc × ETos
The procedure on a district-wide basis first requires that ETc be calculated for each crop. Next, the ETc value for each crop is multiplied by the planted area to determine the total volume of water used by each crop. District-wide ETc is then obtained by summing the water used by each crop with irrigation efficiency computed by dividing the district-wide ETc value by the volume of water diverted to farms.
These methods were used to assess irrigation efficiency of the WMIDD in five-year increments from 1970 through 2010. Reference ET data dating back to 1970 were developed using the ETos data available from the Arizona Meteorological Network (AZMET) [90] to calibrate the temperature-based Hargreaves equation [89]. The Hargreaves equation was used to estimate ETos in this study because the AZMET datasets extend back just 27 years to 1987. Crop coefficient curves were developed for each crop grown in the WMIDD using the procedures recommended by Allen [91], with adjustments made for the length of the cropping season and the aridity of the local climate.
Crop acreage estimation proved to be the most challenging and potentially limiting factor in estimating district-wide irrigation efficiency using ETc. Acreage estimates provided by the USDA did not agree with the acreage reported by the irrigation districts and the USBR. The WMIDD was chosen for the efficiency assessment because the district maintained better crop data than the other districts and the WMIDD, through direct measurement of drainage, provided a second means of assessing irrigation efficiency. The WMIDD also approximates a closed system. It is not adjacent to the channel of the Colorado River, and all the water going into and out of the district is monitored. There may be some errors associated with sub-surface flows within and into the Gila River, but these would be less than for the Colorado Riparian districts. Yet, even with the WMIDD’s better records, the sum of the crop-specific acreage values provided by the district were less than the total number of farmed acres, taking into consideration multiple crop fields. Acreage estimates that are biased downward will transfer that bias to the estimate of irrigation efficiency because the computation divides district-wide ETc by the volume of water diverted to farms. A correction factor was developed to adjust for the low acreage estimate, and a second, adjusted irrigation efficiency was computed. Unadjusted irrigation efficiencies have increased from the upper 40% range in the 1970s to current values in the low to mid-60% range in recent years (Figure 7). The peak unadjusted irrigation efficiency was 69% in 1985. The acreage adjustment increased irrigation efficiency from 5% to 14%. Adjusted efficiencies ranged from 52% in 1975 to a peak of 77% in 2010, and have exceeded 70% since 1985, except in 2000 (Figure 9).
The adjustment for underreported acreage could itself be biased, providing incorrect estimates of irrigation efficiency. Fortunately, alternative procedures were available and used to assess WMIDD irrigation efficiency. For the management of salt and water tables in the WMIDD, drainage wells are operated, and the water is pumped into a drain for transport to the Santa Clara slough north of the Sea of Cortez. Using data for salt concentrations measured in the irrigation water diverted into the WMIDD and that of the drainage water transported out of this district (courtesy of the USBR), the drainage or leaching fraction (L) can be estimated. This computation is based on a salt balance. Under steady state assumptions: L = Ddw/Diw = Ciw/Cdw, where D = volume of water, C = concentration of salt, iw = irrigation water, and dw = drainage water [92].
Irrigation efficiency can be reported as a percentage from this computation by subtracting the leaching fractions from 1.0 and multiplying by 100. Irrigation efficiencies obtained this way agree quite closely with the adjusted values presented in Figure 9, indicating district-wide values approaching 75% on an annual basis (Figure 10). Efficiency values obtained from both methods are trending higher in recent years. The decrease in irrigation efficiency that appears each fall presumably reflects the increased drainage associated with establishment of vegetable crops. The efficiency value computed using L should provide a better overall assessment of district-wide irrigation efficiency, because the computation includes all the water entering the district as compared with the ETc-based computation that is based on water diverted to farm fields. A district-wide irrigation efficiency approaching 75% would be considered an excellent value given the fact that growers must always apply water in excess of growing season ETc to leach soluble salts and keep soils productive.

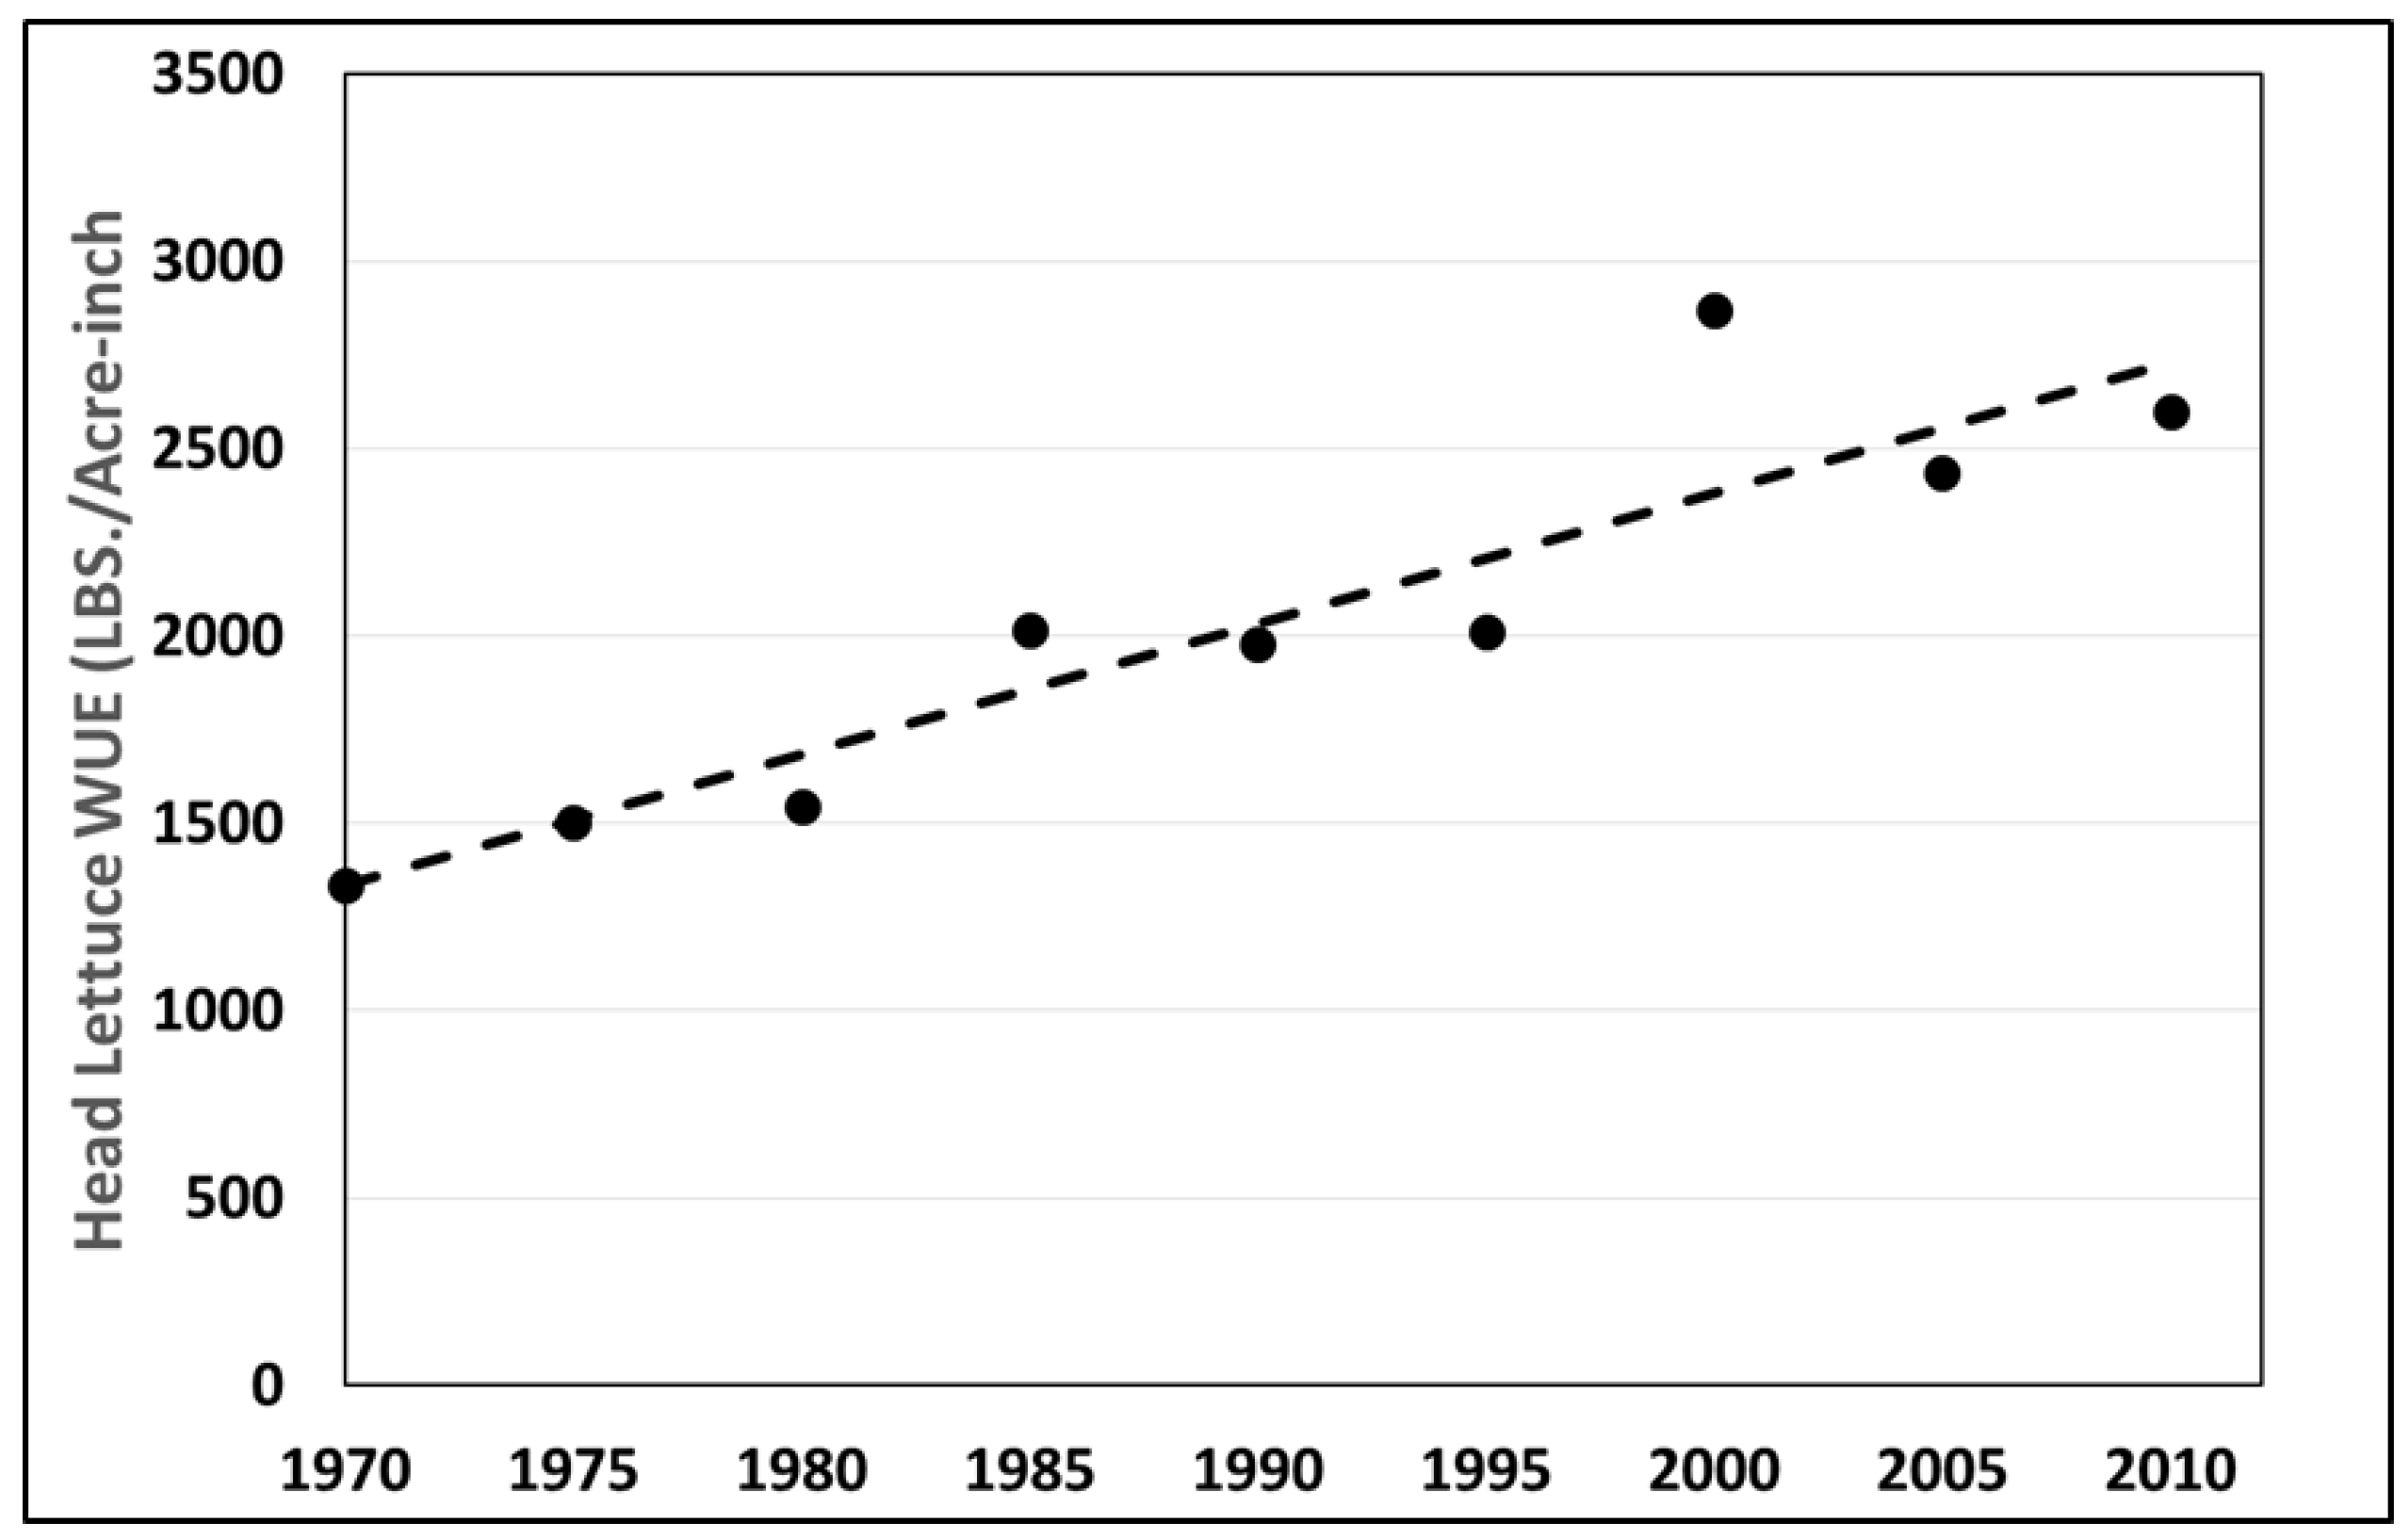
6.5. Water-Use Efficiency (WUE)

Crop yields in Yuma have increased significantly over the past 40 years due to improvements in crop genetics, agronomic practices, pest management procedures, tillage systems, and irrigation management technologies. Crop evapotranspiration, as estimated by applying crop coefficients [91] to estimates of environmental evaporative demand known as reference evapotranspiration (ETos), has remained relatively constant over this same period, fluctuating only slightly from year to year based on growing-season weather conditions and minor changes in cropping seasons. The only Yuma crops that have exhibited significant changes in ETc over the past 40 years are cotton and sudangrass, two summer crops that now are primarily grown using a shortened growing season to ensure that the ground can be converted to fall vegetable production in early September. Current cotton and sudangrass systems use significantly less water (ETc) than the long full summer production systems used previously.
Since yields continue to increase and ETc remains nearly unchanged, the WUE of crops grown in Yuma continues to improve. Head lettuce provides the most stellar example of improved WUE. Growers in 2010 produced 2734 pounds of lettuce per acre per inch of ETc, which was more than double the value of 1970 (Figure 11). Impressive increases in the WUE of other crops over this same time frame include durum wheat (55%), alfalfa (29%), and cotton (16%).

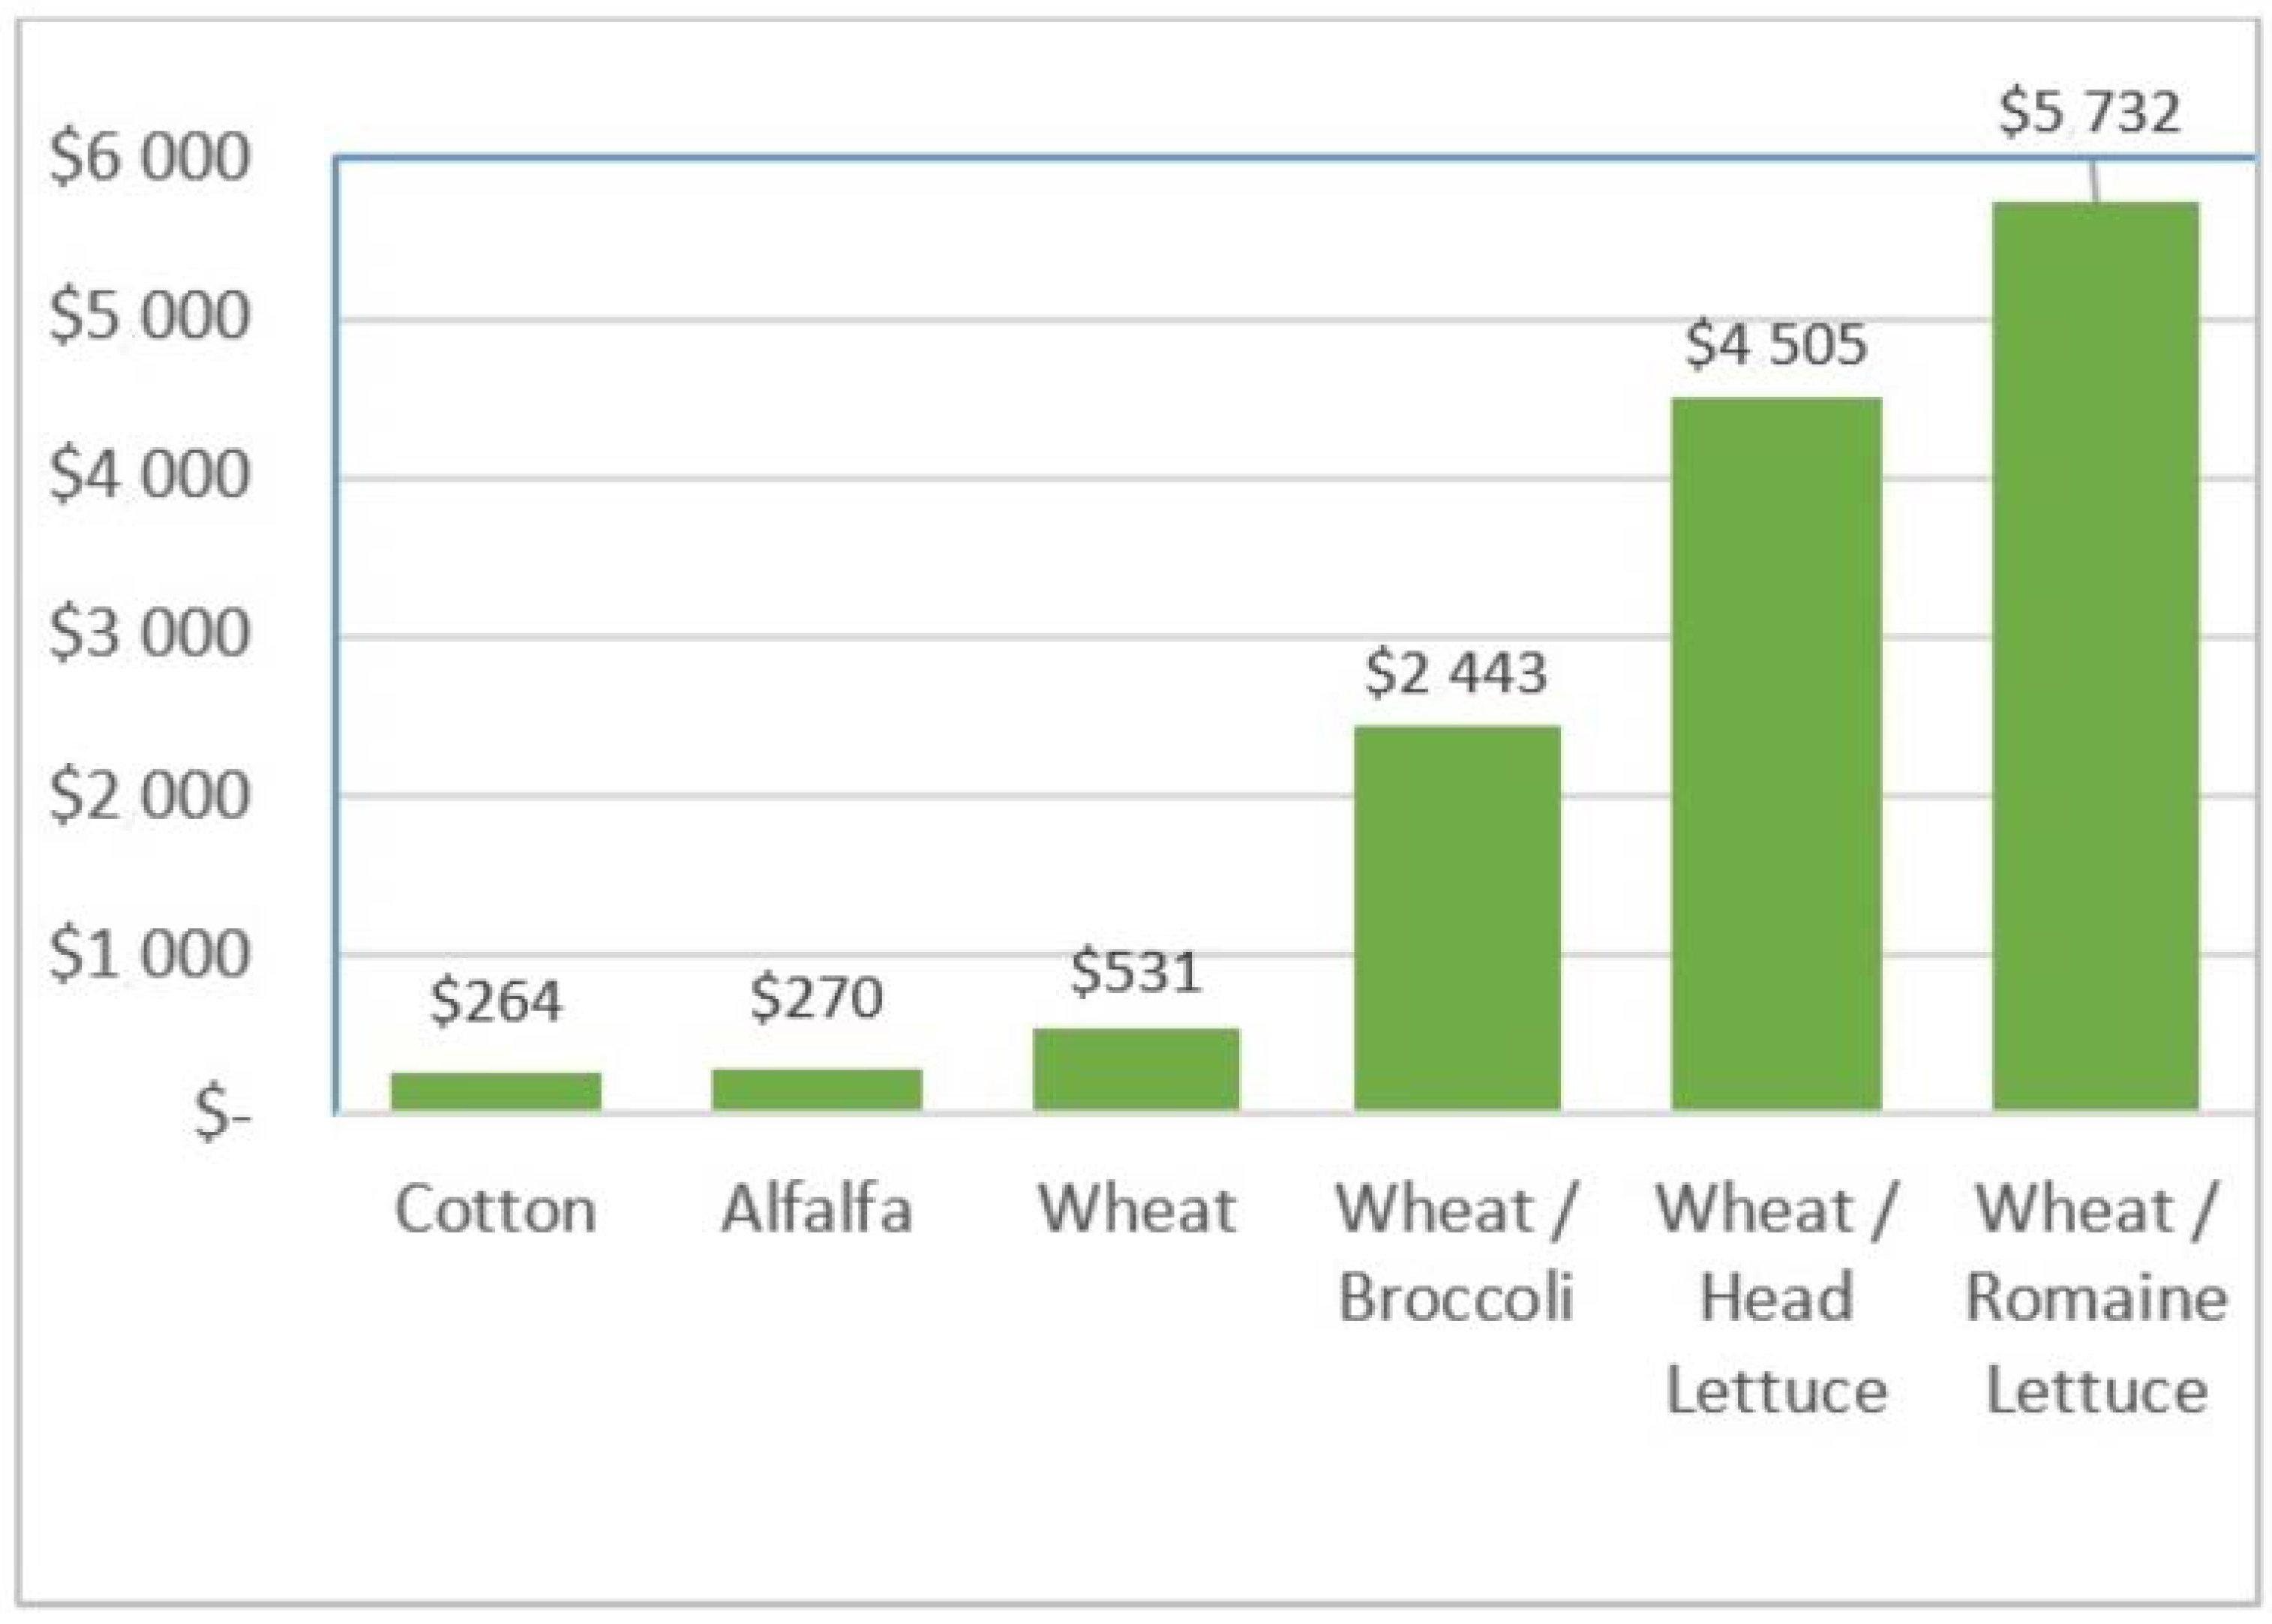
6.6. Economic Water Productivity (EWP)

Economic water productivity is the monetary value generated from each unit of water consumed [75]. Isolated, crop-specific measures of water use or productivity often ignore the important role of crop rotations and multi-cropping systems agriculture. In Yuma, the shift from perennial and summer-centric crop production to winter-centric, multi-crop systems focused on producing high-value, vegetable crops dramatically increases water economic productivity (Figure 12). Gross income per AF of water consumed for wheat alone was $531/AF, which was double that of cotton and alfalfa. After accounting for the acres planted being devoted to a multi-crop system, the economic productivity is several orders of magnitude greater. A wheat/broccoli rotation would generate $2443/AF of water, while wheat/lettuce rotations generate $4505/AF to $5732/AF. Yuma growers have been able to increase their economic water productivity between nine and 21 times by switching to crop rotations.

6.7. Return Flows

Return flows play a unique and crucial role in the U.S.–Mexico border region. First, the United States is required under the 1944 Treaty on Utilization of Waters of the Colorado and Tijuana and of the Rio Grande to deliver 1.5 million acre-feet (MAF) annually of Colorado River water to Mexico, except under certain pre-specified conditions of extreme shortage [94,95]. Throughout the Valley Division of the Yuma Project, an open network of drains receives return flows as well as water pumped from wells along the Valley’s east side. These wells lower the Valley’s groundwater table, alleviating problems of high water tables. The drain system terminates at the Boundary Pumping Plant at the International Boundary with Mexico at San Luis, Arizona. This drain water, about 85,000 AF per year (AFY) combined with an additional 20,000 AFY pumped from a USBR well field (approximately 20,000 AFY) is pumped into a canal in Mexico and is counted as part of the 1944 Treaty’s obligation to Mexico. Water delivered to Mexico supports a $280 million agricultural industry in the Mexicali Valley [96].
Return flows also serve important ecological functions. In the 1970s, the disposal of agricultural drain water by the WMIIDD inadvertently created the Cienega de Santa Clara [97]. At 5635 ha, it is largest brackish marsh in the Sonoran Desert, and the WMIIDD supplies 95% of the Cienega’s water [98]. The Cienega is a major wintering and stopover site for migratory birds on the Pacific Flyway. It also supports the largest remaining breeding population of the endangered Yuma clapper rail (Rallus longirostris yumanensis) on the Lower Colorado River [97]. While some aquatic habitats created with agricultural drain water have had environmental problems [97], to date, the Cienega appears to be functioning sustainably in terms of vegetation, hydrology, and habitat value [97,98].
Some proposals for the ecological restoration of the Colorado River Delta in Mexico have called for the fallowing of the WMIDD (and other area) agricultural land [99,100] or increased irrigation efficiency (IE) [99,100,101,102,103] to increase environmental water deliveries to the Delta. Yet, it has been pointed out that such policies, by reducing agricultural return flows, would actually “reduce or even eliminate flows to the Cienega de Santa Clara” [104] (p. 49) and other aquatic habitats of the Delta [104]. Scholars working on the ecological restoration of the Colorado Delta have begun to take a more nuanced view toward the ecological benefits of agricultural return flows, recognizing that reducing the water diverted for Yuma agriculture and increasing the water taken up by the crop in ETc can mean less water available for ecosystem services [104]. In short, what has been characterized as “inefficiencies” actually makes the ecosystem “better off” (p. 49) [104]. Ecosystem services, in turn, have attendant economic benefits [65,105].

7. Discussion

Both economic theory and empirical findings suggest that reliance on gravity-flow irrigation is determined by its profitability relative to sprinkler and drip systems. Profitability, in turn, depends largely on location-specific factors such as land characteristics, climate, and water costs. The appropriateness of gravity systems therefore depends on local context. Given Yuma’s combination of land characteristics, climate, and access to relatively inexpensive and dependable surface water, as economic theory would predict, growers there rely heavily on gravity systems. The adoption of gravity or pressurized systems is not a simple either–or dichotomy. In Arizona and California, about 20% of irrigated acres make use of more than one technology. In Yuma, growers have adopted sprinklers where they have made economic sense. While they have experimented with drip systems on produce on a limited scale, in many cases, except melons, it has been discontinued because it provided no production or economic advantages.
Gravity systems have been derided as inefficient, and many have advocated for policies to encourage a switch to pressurized systems to conserve water. Yet, a host of modeling studies and empirical counter-examples suggest improving on-farm irrigation efficiency need not conserve water and can actually increase water consumption. This is especially true if the adoption of pressurized systems increases irrigated acreage.
Agriculture in Yuma transformed itself from perennial and summer-centric crop production systems to winter-centric, multi-crop systems that focus on high-value vegetable crops, making Yuma one of the world’s most productive and profitable agricultural areas. To achieve this transformation, Yuma growers have made extensive changes in irrigation technologies, changes in production practices, and investments in irrigation infrastructure. These innovations have led to improvements in a host of water-use efficiency factors, including on-farm and district-level irrigation efficiency, water-use efficiency, and economic water productivity. Due to the shift to vegetable crops, economic water productivity increased. These changes have led to actual, overall water conservation. Yuma is a unique agronomic area, so it may be difficult to replicate its success in other areas [7]. Yet, the case study of Yuma illustrates that growers can and do make a host of innovative adaptations in gravity-based systems when there are economic incentives to do so.
Finally, there are beneficial uses of water that may not be imbedded into some standard measures of irrigation efficiency as ETc as a share of water applied to a crop. Such benefits include salt removal (leaching), climate control, soil preparation, and water harvested in the crop (e.g., water contained in harvested melons, produce, etc.) [76]. Return flows satisfy the U.S. treaty obligation to supply Colorado River water to Mexico, providing agricultural, recreational, and fishing benefits to Mexico [65,96,105], and maintaining the health of the riparian habitat of Mexico’s Colorado River Delta [93,94,100]. Again, circumstances are unique in the Yuma/Colorado Delta area, but there is evidence elsewhere that return flows, rather than a measure of wastefulness, provide valuable ecological services [7,62,63].

8. Concluding Remarks

The efficiency of water use and irrigation methods will be of heightened interest as competition for water resources and the need to feed an ever-growing population continue. As the Yuma case study demonstrates, examination of the full context for local water use is critical to understanding the irrigation methods that are selected by farmers. One size rarely fits all, and sophisticated irrigated agriculture in the southwestern United States is no exception.

Author Contributions

Conceptualization, S.B.M.; Writing-Original Draft Preparation, G.F, C.S., N.G., P.B.; Writing-Review & Editing, G.F, C.S., N.G., P.B, S.B.M.; Project Administration, S.B.M.

Funding

This work was supported in part by the National Oceanic and Atmospheric Administration’s Regional Integrated Sciences and Assessments (RISA) program through grant NA12OAR4310124 with the Climate Assessment for the Southwest program at the University of Arizona. The views expressed are those of the authors and do not necessarily reflect those of the USDA Natural Resources Conservation Service.

Acknowledgments

We thank Elia Tapia for map development and preparation.

Conflicts of Interest

The authors declare no conflict of interest.

References

  1. Wilkinson, C.F. Perspectives on Water and Energy in the American West and in Indian Country. S Dakota Law Rev. 1981, 26, 393–404. [Google Scholar]
  2. Lehr, J.H. Increase irrigation efficiency will ultimately silence the water-short blues of the wasteful West. Groundwater 1983, 21, 130–133. [Google Scholar] [CrossRef]
  3. Radhakrishna, B. Are we utilizing our water resources wisely? Curr. Sci. 1993, 65, 294–300. [Google Scholar]
  4. Lal, R. Carbon emission from farm operations. Environ. Int. 2004, 30, 981–990. [Google Scholar] [CrossRef] [PubMed]
  5. O’Mahony, B.; Dalrymple, J.; Levin, E.; Greenland, S. The role of information communications technology in sustainable water management practice. Int. J. Sustain. Agric. Manag. Inform. 2016, 2, 79–92. [Google Scholar]
  6. Owen, D. Smart Water and Water Megatrend Management and Mitigation. In Assessing Global Water Megatrends; Biswas, A.K., Tortajada, C., Eds.; Springer: Singapore, 2018; pp. 87–104. [Google Scholar]
  7. Masseroni, D.; Ricart, S.; de Cartagena, F.; Monserrat, J.; Gonçalves, J.; de Lima, I.; Facchi, A.; Sali, G.; Gandolfi, C. Prospects for improving gravity-fed surface irrigation systems in Mediterranean European contexts. Water 2017, 9, 20. [Google Scholar] [CrossRef]
  8. U.S. Geological Survey (USGS). Estimated Use of Water in the United States County-Level Data for 2010. Available online: https://water.usgs.gov/watuse/data/2010/index.html (accessed on 21 February 2018).
  9. Smith, R.J.; Raine, S.R.; Minkovich, J. Irrigation application efficiency and deep drainage potential under surface irrigated cotton. Agric. Water Manag. 2005, 71, 117–130. [Google Scholar] [CrossRef] [Green Version]
  10. Gonçalves, J.M.; Pereira, L.S. Decision support system for surface irrigation design. J. Irrig. Drain. Eng. 2010, 135, 343–356. [Google Scholar] [CrossRef]
  11. Arbat, G.; Puig-Bargués, J.; Duran-Ros, M.; Barragán, J.; Ramírez de Cartagena, F. Irrigation performance and gross water productivity in furrow-irrigated ornamental tree production. Span. J. Agric. Res. 2011, 9, 627–640. [Google Scholar] [CrossRef]
  12. Koech, R.K.; Smith, R.J.; Gillies, M.H. A real-time optimization system for automation of furrow irrigation. Irrig. Sci. 2014, 32, 319–327. [Google Scholar] [CrossRef]
  13. Khatri, K.L.; Smith, R.J. Real-time prediction of soil infiltration characteristics for the management of furrow irrigation. Irrig. Sci. 2006, 25, 33–43. [Google Scholar] [CrossRef]
  14. Khatri, K.L.; Smith, R.J. Toward a simple real-time control system for efficient management of furrow irrigation. Irrig. Drain. 2007, 56, 463–475. [Google Scholar] [CrossRef] [Green Version]
  15. Masseroni, D.; Uddin, J.; Tyrrell, R.; Mareels, I.; Gandolfi, C.; Facchi, A. Towards a smart automated surface irrigation management in rice-growing areas in Italy. J. Agric. Eng. 2017, 48, 42–48. [Google Scholar] [CrossRef]
  16. Masseroni, D.; Moller, P.; Tyrell, R.; Romani, M.; Lasagna, A.; Sali, G.; Facchi, A.; Gandolfi, C. Evaluating performances of the first automatic system for paddy irrigation in Europe. Agric. Water Manag. 2018, 31, 58–69. [Google Scholar] [CrossRef]
  17. Caswell, M.; Zilberman, D. The effects of well depth and land quality on the choice of irrigation technology. Am. J. Agric. Econ. 1986, 68, 798–811. [Google Scholar] [CrossRef]
  18. Caswell, M.; Fuglie, K.; Ingram, C.; Jans, S.; Kascak, C. Adoption of Agricultural Production Practices: Lessons Learned from the U.S. Department of Agriculture (USDA) Area Studies Project; Agricultural Economic Report No. AER792; USDA, Economic Research Service: Washington, DC, USA, 2001.
  19. Caswell, M.; Zilberman, D. The Choices of Irrigation Technologies in California. Am. J. Agric. Econ. 1985, 67, 224–234. [Google Scholar] [CrossRef]
  20. Negri, D.H.; Brooks, D.H. Determinants of irrigation technology choice. West. J. Agric. Econ. 1990, 15, 213–223. [Google Scholar]
  21. Dinar, A.; Yaron, D. Influence of Quality and Scarcity of Inputs on the Adoption of Modern Irrigation Technologies. West. J. Agric. Econ. 1990, 15, 224–233. [Google Scholar]
  22. Dinar, A.; Campbell, M.B.; Zilberman, D. Adoption of improved irrigation and drainage reduction technologies under limiting environmental conditions. Environ. Resour. Econ. 1992, 2, 373–398. [Google Scholar] [CrossRef]
  23. Green, G.; Sunding, D.; Zilberman, D.; Parker, D. Explaining irrigation technology choices: A microparameter approach. Am. J. Agric. Econ. 1996, 78, 1064–1072. [Google Scholar] [CrossRef]
  24. Mendelsohn, R.; Dinar, A. Climate, water, and agriculture. Land Econ. 2013, 79, 328–341. [Google Scholar] [CrossRef]
  25. Frisvold, G.B.; Deva, S. Climate and choice of irrigation technology: Implications for climate adaptation. J. Natl. Res. Policy Res. 2013, 5, 107–127. [Google Scholar] [CrossRef]
  26. Frisvold, G.; Bai, T. Irrigation Technology Choice as Adaptation to Climate Change in the Western United States. J. Contemp. Water Res. Ed. 2016, 158, 62–77. [Google Scholar] [CrossRef]
  27. Olen, B.; Wu, J.; Langpap, C. Irrigation decisions for major west coast crops: Water scarcity and climatic determinants. Am. J. Agric. Econ. 2015, 98, 254–275. [Google Scholar] [CrossRef]
  28. Huang, Q.; Xu, Y.; Kovacs, K.; West, G. Analysis of Factors that Influence the Use of Irrigation Technologies and Water Management Practices in Arkansas. J. Agric. Appl. Econ. 2017, 49, 159–185. [Google Scholar] [CrossRef]
  29. McLean, R.K.; Ranjan, S.; Klassen, G. Spray evaporation losses from sprinkler irrigation systems. Can. Agric. Eng. 2000, 42, 1–8. [Google Scholar]
  30. Negri, D.H.; Hanchar, J. Water Conservation through Irrigation Technology; Agriculture Information Bulletin No. 576; U.S. Departmen of Agriculture, Economic Research Service: Washington, DC, USA, 1989.
  31. Parry, M.; Arnell, N.; Hulme, H.; Nicholls, R.; Livermore, M. Adapting to the inevitable. Nature 1998, 395, 741. [Google Scholar] [CrossRef]
  32. Ragab, R.; Prudhomme, C. Climate change and water resources management in arid and semi-arid regions: Prospective and challenges for the 21st century. Biosyst. Eng. 2002, 81, 3–34. [Google Scholar] [CrossRef]
  33. Wallace, J.S. Increasing agricultural water use efficiency to meet future food production. Agric. Ecosyst. Environ. 2000, 82, 105–119. [Google Scholar] [CrossRef]
  34. Rockstrom, J.; Lannerstad, M.; Falkenmar, M. Increasing water productivity through deficit irrigation: Evidence from the Indus plains of Pakistan. Proc. Natl. Acad. Sci. USA 2007, 104, 6253–6260. [Google Scholar] [CrossRef] [PubMed]
  35. Jury, W.A.; Vaux, H. The role of science in solving the world’s emerging water problems. Proc. Natl. Acad. Sci. USA 2005, 102, 15715–15720. [Google Scholar] [CrossRef] [PubMed]
  36. Ward, F.A. Economic impacts on irrigated agriculture of water conservation programs in drought. J. Hydrol. 2014, 508, 114–127. [Google Scholar] [CrossRef]
  37. Cooley, H.; Christian-Smith, J.; Gleick, P. Sustaining California Agriculture in an Uncertain Future; Technical Report; Pacific Institute: Oakland, CA, USA, 2009. [Google Scholar]
  38. Evans, R.G.; Sadler, E.J. Methods and technologies to improve efficiency of water use. Water Res. 2008, 44. [Google Scholar] [CrossRef]
  39. Johnson, N.; Revenga, C.; Echeverria, J. Managing water for people and nature. Science 2001, 292, 1071–1072. [Google Scholar] [CrossRef] [PubMed]
  40. Zinn, J.A.; Canada, C. (Environmental Quality Incentives Program (EQIP): Status and Issues; Congressional Research Service Report for Congress: Washington, DC, USA, May 2007. [Google Scholar]
  41. OECD. Environmental Performance of Agriculture in OECD Countries since 1990 (Report); Organisation for Economic Co-operation and Development: Paris, France, 2008. [Google Scholar]
  42. Ward, F.A.; Pulido-Velazquez, M. Water conservation in irrigation can increase water use. Proc. Natl. Acad. Sci. USA 2008, 105, 18215–18220. [Google Scholar] [CrossRef] [PubMed]
  43. Viets, F.G. Fertilizers and the efficient use of water. Adv. Agron. 1962, 14, 223–264. [Google Scholar]
  44. Mekonnen, M.M.; Hoekstra, A.Y. The green, blue and grey water footprint of crops and derived crop products. Hydrol. Earth Syst. Sci. 2011, 15, 1577–1600. [Google Scholar] [CrossRef] [Green Version]
  45. Scheierling, S.M.; Young, R.A.; Cardon, G.E. Public subsidies for water-conserving irrigation investments: Hydrologic, agronomic, and economic assessment. Water Res. 2006, 42, 1–11. [Google Scholar] [CrossRef]
  46. Peterson, J.M.; Ding, Y. Economic adjustments to groundwater depletion in the high plains: Do water-saving irrigation systems save water? Am. J. Agric. Econ. 2005, 87, 147–159. [Google Scholar] [CrossRef]
  47. Huffaker, R.; Whittlesey, N. A theoretical analysis of economic incentive policies encouraging agricultural water conservation. Int. J. Water Res. Dev. 2003, 19, 37–53. [Google Scholar] [CrossRef]
  48. Khanna, M.; Isik, M.; Zilberman, D. Cost-effectiveness of alternative green payment policies for conservation technology adoption with heterogeneous land quality. Agric. Econ. 2002, 27, 157–174. [Google Scholar] [CrossRef]
  49. Hanak, E.; Lund, J.; Dinar, A.; Gray, B.; Howitt, R.; Mount, J.; Moyle, P.; Thompson, B.B. Myths of California Water-Implications and Reality; Technical Report; Public Policy Institute of California: San Francisco, CA, USA, 2009. [Google Scholar]
  50. Frisvold, G.; Emerick, K. Rural-Urban Water Transfers with Applications to the U.S.-Mexico Border Region. In Game Theory and Policy Making in Natural Resources and the Environment (Vol. 10); Dinar, A., Albiac, J., Sánchez-Soriano, J., Eds.; Routledge: London, UK, 2008. [Google Scholar]
  51. Contor, B.; Taylor, R.G. Why Improving Irrigation Efficiency Increases Total Volume of Consumptive Use. Irrig. Drain. 2013, 62, 273–280. [Google Scholar] [CrossRef]
  52. Upendram, S.; Peterson, J.M. Irrigation technology and water conservation in the High Plains Aquifer Region. J. Contemp. Water Res. Ed. 2007, 137, 40–46. [Google Scholar] [CrossRef]
  53. Gutierrez-Martin, C.; Gomez, C.M. Assessing irrigation efficiency improvements by using a preference revelation model. Span. J. Agric. Res. 2011, 9, 1009–1020. [Google Scholar] [CrossRef]
  54. Lecina, S.; Isidoro, D.; Playán, E.; Aragüés, R. Irrigation modernization and water conservation in Spain: The case of Riegos del Alto Aragón. Agric. Water Manag. 2010, 97, 1663–1675. [Google Scholar] [CrossRef] [Green Version]
  55. Gómez, C.M.; Pérez-Blanco, C.D. Simple myths and basic maths about greening irrigation. Water Res. Manag. 2014, 28, 4035–4044. [Google Scholar] [CrossRef]
  56. Jevons, W.S. The Coal Question; Macmillan and Co.: London, UK, 1865. [Google Scholar]
  57. Dumont, A.; Mayor, B.; López-Gunn, E. Is the rebound effect or Jevons paradox a useful concept for better management of water resources? Insights from the irrigation modernisation process in Spain. Aquat. Procedia 2013, 1, 64–76. [Google Scholar] [CrossRef]
  58. Golden, B.B.; Peterson, J.M. Evaluation of Water Conservation from More Efficient Irrigation Systems; Staff Paper 06-03; Department of Agricultural Economics, Kansas State University: Manhattan, KS, USA, 2006. [Google Scholar]
  59. Pfeiffer, L.; Lin, C.Y.C. Does efficient irrigation technology lead to reduced groundwater extraction? Empirical evidence. J. Environ. Econ. Manag. 2014, 67, 189–208. [Google Scholar] [CrossRef]
  60. Frisvold, G.B. Water, agriculture, and drought in the west under changing climate and policy regimes. Nat. Res. J. 2015, 55, 293–328. [Google Scholar]
  61. Wallander, S.; Hand, M.S. Measuring the Impact of the Environmental Quality Incentives Program (EQIP) on Irrigation Efficiency and Water Conservation. In Proceedings of the 2011 Annual Meeting, Agricultural and Applied Economics Association, Pittsburgh, PA, USA, 24–26 July 2011. No. 103269. [Google Scholar]
  62. Fernald, A.G.; Guldan, S.J. Surface water–groundwater interactions between irrigation ditches, alluvial aquifers, and streams. Rev. Fish. Sci. 2006, 14, 79–89. [Google Scholar] [CrossRef]
  63. Fernald, A.G.; Baker, T.T.; Guldan, S.J. Hydrologic, riparian, and agroecosystem functions of traditional acequia irrigation systems. J. Sustain. Agric. 2007, 30, 147–171. [Google Scholar] [CrossRef]
  64. Glenn, E.P.; Flessa, K.W.; Pitt, J. Restoration potential of the aquatic ecosystems of the Colorado River Delta, Mexico: Introduction to special issue on “Wetlands of the Colorado River Delta”. Ecol. Eng. 2013, 59, 1–6. [Google Scholar] [CrossRef]
  65. Kerna, A.; Colby, B.; Zamora, F. Cultural and Recreational Values for Environmental Flows in Mexico’s Colorado River Delta. Water Econ. Policy 2017, 3, 1650035. [Google Scholar] [CrossRef]
  66. Stromberg, J.C. Restoration of riparian vegetation in the south-western United States: Importance of flow regimes and fluvial dynamism. J. Arid Environ. 2001, 49, 17–34. [Google Scholar] [CrossRef]
  67. Wiener, J.; Crifasi, R.; Dwire, K.; Skagen, S.; Yates, D. Riparian ecosystem consequences of water redistribution along the Colorado Front Range. Water Res. Impact 2008, 10, 18–21. [Google Scholar]
  68. U.S. Department of Agriculture. Farm and Ranch Irrigation Survey: 2013; Volume 3, Special Studies, Part 1 of the 2012 Census of Agriculture, AC-12-SS-1; National Agricultural Statistics Service: Washington, DC, USA, 2014.
  69. Map Prepared by the University of Arizona Water Resources Research Center. March 2018.
  70. National Agricultural Statistics Service. 2012 Census of Agriculture. County Profile. Yuma County, Arizona. United States Department of Agriculture; 2014. Available online: https://www.agcensus.usda.gov/Publications/2012/Online_Resources/County_Profiles/Arizona/cp04027.pdf (accessed on 8 May 2018).
  71. National Agricultural Statistics Service. 2012 Census of Agriculture. Volume 1, Chapter 2: County Level Data Arizona. Table 1. County Summary Highlights and Volume 1, Chapter 1: U.S. National Level Data. Historical Highlights. 2004; Total Cropland Data. Available online: https://www.agcensus.usda.gov/Publications/2012/ (accessed on 8 May 2018).
  72. U.S. Department of Commerce. Bureau of Economic Analysis. Local Personal Income and Employment Interactive Tables. Table CA45: Farm Income and Expenses. 2012; Cash Receipts: Crops Data. Available online: https://www.bea.gov/regional/ (accessed on 8 May 2018).
  73. Brown, P.W.; Nolte, K.D.; Sanchez, C.A. Irrigation Management in Yuma County. In A Case Study in Efficiency—Agriculture and Water Use in the Yuma; Yuma County Agricultural Water Coalition: Arizona Area, Yuma, AZ, USA, 2015; pp. 17–49. Available online: http://www.agwateryuma.com/ (accessed on 8 May 2018).
  74. Bureau of Reclamation. Quality of Water: Colorado River Basin; Progress Report No. 22; U.S. Department of Interior, Bureau of Reclamation, Upper Colorado Regional Office: Salt Lake City, UT, USA, 2005; 69p.
  75. Sadras, V.; Grassini, P.; Steduto, P. 2011: Status of Water Use Efficiency of Main Crops. State of World’s Land and Water Resources for Food and Agriculture (SOLAW) Background Thematic Rep. TR07. p. 41. Available online: www.fao.org/fileadmin/templates/solaw/files/thematic_reports/TR_07_web.pdf (accessed on 8 May 2018).
  76. Burt, C.M.; Clemmens, A.J.; Strelkoff, T.S.; Solomon, K.H.; Bliesner, R.D.; Hardy, L.A.; Howell, T.A.; Eisenhauer, D.E. Irrigation performance measures: Efficiency and uniformity. J. Irrig. Drain. Eng. 1997, 123, 423–442. [Google Scholar] [CrossRef]
  77. Erie, L.J.; Dedrick, A.R. Level Basin Irrigation: A Method for Conserving Water and Labor; USDA SEA Farmers’ Bulletin 2261; US Government Printing Office: Washington, DC, USA, 1979; 23p.
  78. Howell, T.A. Irrigation Efficiency. In Encyclopedia of Water Science; Stewart, B.A., Howell, T.A., Eds.; Marcel Dekker, Inc.: New York, NY, USA, 2003; pp. 467–472. [Google Scholar]
  79. Sanchez, C.A.; Zerihun, D.; Strelkoff, T.S.; Clemmens, A.J.; Farrell-Poe, K.L. Development of management guidelines for efficient irrigation of basins on sandy soils. Appl. Eng. Agric. (ASABE) 2008, 24, 215–224. [Google Scholar] [CrossRef]
  80. ASCE. The ASCE Standardized Reference Evapotranspiration Equation; Allen, R.G., Elliott, R., Jensen, M.E., Itenfisu, D., Mecham, B., Howell, T.A., Snyder, R., Brown, P., Echings, S., Spofford, T., et al., Eds.; American Society of Civil Engineers: Reston, VA, USA, 2005; 59p. [Google Scholar]
  81. Brown, P.W. Standardized Reference Evapotranspiration: A New Procedure for Estimating Reference Evapotranspiration in Arizona; Ext. Rpt.1324; College of Agricultural & Life Sciences, University of Arizona: Tucson, AZ, USA, 2005. [Google Scholar]
  82. Sanchez, C.A.; Zerihun, D.; Farrell-Poe, K.L. Management guidelines for efficient irrigation of vegetables using closed-end level furrows. Agric. Water Manag. 2008, 96, 43–52. [Google Scholar] [CrossRef]
  83. Sanchez, C.A.; Zerihun, D. Irrigation Management Guidelines for Citrus and Alfalfa Grown on the Sandy Soils of the Yuma Mesa Irrigation Districts; Project Report Submitted to the United States Bureau of Reclamation; Yuma Area Office: Yuma, AZ, USA, 2004.
  84. Sanchez, C.A.; Zerihun, D. Irrigation Management Guidelines for Furrow Irrigated Vegetable Production Systems in the Yuma Valley; Project Report Submitted to the United States Bureau of Reclamation; Yuma Area Office: Yuma, AZ, USA, 2004.
  85. Pier, J.W.; Doerge, T.A. Concurrent evaluations of agronomic, economic, and environmental aspects of trickle irrigated water melon production. J. Environ. Qual. 1995, 24, 79–86. [Google Scholar] [CrossRef]
  86. Thompson, T.L.; Doerge, T.A. Nitrogen and water rates for subsurface trickle irrigated romaine lettuce. HortScience 1995, 30, 1233–1237. [Google Scholar]
  87. Thompson, T.L.; Doerge, T.A. Nitrogen and water interactions in subsurface trickle irrigated leaf lettuce. II. Agronomic, economic, and environmental outcomes. Soil Sci. Soc. Am. J. 1996, 60, 168–173. [Google Scholar] [CrossRef]
  88. Roth, R.L.; Sanchez, C.A.; Gardner, B.R. Growth and yield of mature “Valencia” oranges converted to pressurized irrigation. Appl. Eng. Agric. 1995, 11, 101–105. [Google Scholar] [CrossRef]
  89. Hargreaves, G.H.; Samani, Z.A. Estimating potential evapotranspiration. J. Irrig. Drain. Eng. 1982, 108, 25–230. [Google Scholar]
  90. AZMET: The Arizona Meteorological Network. Available online: https://cals.arizona.edu/azmet/ (accessed on 2 March 2018).
  91. Allen, R.G.; Pereira, L.S.; Raes, D.; Smith, M. Crop Evapotranspiration: Guidelines for Computing Crop Water Requirements; FAO Irrigation & Drainage Paper 56; Food and Agriculture Organization of the United Nations: Rome, Italy, 1998; 300p. [Google Scholar]
  92. ASCE. Agricultural Salinity and Management; ASCE Manuals and Reports on Engineering Practice No. 71; American Society of Civil Engineers (ASCE): Reston, VA, USA, 1990. [Google Scholar]
  93. Frisvold, G. Developing Sustainability Metrics for Water Use in Arizona Small Grains Production; Final report to the Arizona Grain Research and Promotion Council; Arizona Department of Agriculture: Phoenix, AZ, USA, 2015.
  94. Frisvold, G.; Caswell, M. Transboundary water management: Game-theoretic lessons for projects on the US–Mexico border. Agric. Econ. 2000, 24, 101–111. [Google Scholar]
  95. International Boundary and Water Commission (IBWC). Extension of Cooperative Measures and Adoption of a Binational Water Scarcity Contingency Plan in the Colorado River Basin; Minute 323; International Boundary and Water Commission (IBWC): Ciudad Juarez, Mexico, 21 September 2017. [Google Scholar]
  96. Medellina-Azuara, J.; Lund, J.; Howitt, R. Water supply analysis for restoring the Colorado River delta, Mexico. Water Resour. Plan. Manag. 2007, 133, 462–471. [Google Scholar] [CrossRef]
  97. Mexicano, L.; Glenn, E.P.; Hinojosa-Huerta, O.; Garcia-Hernandez, J.; Flessa, K.; Hinojosa-Corona, A. Long-term sustainability of the hydrology and vegetation of Cienega de Santa Clara, an anthropogenic wetland created by disposal of agricultural drain water in the delta of the Colorado River, Mexico. Ecol. Eng. 2013, 59, 111–120. [Google Scholar] [CrossRef]
  98. Brusca, R.C.; Álvarez-Borrego, S.; Hastings, P.A.; Findley, L.T. Colorado River flow and biological productivity in the Northern Gulf of California, Mexico. Earth-Sci. Rev. 2017, 164, 1–30. [Google Scholar] [CrossRef]
  99. Glennon, R.J.; Culp, P.W. The last green lagoon: How and why the Bush Administration should save the Colorado River Delta. Ecol. Law Q. 2002, 28, 903–988. [Google Scholar]
  100. Postel, S.L.; Morrison, J.I.; Gleick, P.H. Allocating fresh water to aquatic ecosystems: The case of the Colorado River Delta. Water Int. 1998, 23, 119–125. [Google Scholar] [CrossRef]
  101. Wichelns, D.; Oster, J.D. Sustainable irrigation is necessary and achievable, but direct costs and environmental impacts can be substantial. Agric. Water Manag. 2006, 86, 114–127. [Google Scholar] [CrossRef]
  102. Morrison, J.I.; Postel, S.L.; Gleick, P.H. The Sustainable Use of Water in the Lower Colorado River Basin; The Global Water Project; Pacific Institute for Studies in Development, Environment, and Security (PISDES): Oakland, CA, USA, 1996. [Google Scholar]
  103. Betley, E.C. How the West Was Watered: A Case Study of the Colorado River. Lessons Conserv. 2015, 5, 62–84. [Google Scholar]
  104. Carrillo-Guerrero, Y.; Glenn, E.P.; Hinojosa-Huerta, O. Water budget for agricultural and aquatic ecosystems in the delta of the Colorado River, Mexico: Implications for obtaining water for the environment. Ecol. Eng. 2013, 59, 41–51. [Google Scholar] [CrossRef]
  105. Duval, D.; Colby, B. The influence of Colorado River flows on the upper Gulf of California fisheries economy. Ecol. Eng. 2017, 106, 791–798. [Google Scholar] [CrossRef]
Figure 1. Yuma Area Irrigation Districts. Source: University of Arizona, Water Resources Research Center, [69].
Sustainability 10 01548 g001
Figure 2. Yuma County Crop Production in 1970 and 2010. Source: Brown et al. [73] (p. 21).
Sustainability 10 01548 g002
Figure 3. Irrigable Acres Planted to Vegetable and Multi-crop Production Systems in Yuma County, 1970–2010. Source: Brown et al. (p. 21).
Sustainability 10 01548 g003
Figure 4. Volume of Irrigation Water Delivered to Yuma County Irrigators, 1970–2010. Source: Brown et al. [73] (p. 23).
Sustainability 10 01548 g004
Figure 5. Estimated Crop Water Use in the Yuma Area. Cross-hatched bars represent the water use of the vegetable crop. Solid bars above the hatched bars represent water use of the rotation crop. Source: Brown et al. [73] (p. 23).
Sustainability 10 01548 g005
Figure 6. Monthly Farm Water Deliveries (AF) for Yuma Valley Irrigation Districts. Source: Brown et al. [73] (p. 23).
Sustainability 10 01548 g006
Figure 7. Relationship between Furrow Length, Flow Rate and Application Efficiency for Fine Textured Soils in the Yuma Valley. Source: Brown et al. [73] (p. 32), adapted from [79].
Sustainability 10 01548 g007
Figure 8. Relative Yield of Lettuce Irrigated at Different Depletion Percentages. Source: Brown et al. [73] (p. 36).
Sustainability 10 01548 g008
Figure 9. On-farm Irrigation Efficiencies for the Wellton-Mohawk Irrigation and Drainage District (WMIDD) computed from estimates of crop water use, 1970–2010. Source: Brown et al. [73] (p. 45).
Sustainability 10 01548 g009
Figure 10. Irrigation Efficiency in the WMIDD Estimated from Monthly Leaching Fractions. Source: Brown et al. [73] (p. 47).
Sustainability 10 01548 g010
Figure 11. Water-Use Efficiency of Head Lettuce in the Yuma Area, 1970 to 2010. Source: Brown et al. [73] (p. 47).
Sustainability 10 01548 g011
Figure 12. Water Economic Productivity in the Yuma Area: Gross Revenue per Acre-Foot of Water Consumed. Source: Frisvold, 2015, [93].
Sustainability 10 01548 g012
Table 1. Measure of water-use efficiency, Lower Rio Grande, New Mexico, 2006.
Irrigation EfficiencyWater-Use EfficiencyBlue Water Footprint
ET/Water Applied% ChangeYield/(ET/acre)% Change(ET/acre)/Yield% Change
FloodDripFlood-to-DripFloodDripFlood-to-DripFloodDripFlood-to-Drip
Alfalfa0.441127%3.63.72%27.5027.00−2%
Pima cotton0.431133%625.0625.00%0.160.160%
Upland cotton0.431133%833.3833.30%0.120.120%
Lettuce, Spring0.441127%431.8424.1−2%0.230.242%
Lettuce, Fall0.421136%357.1347.2−3%0.280.293%
Onions, Fall0.431135%600.0600.00%0.170.170%
Onions, Midseason0.58174%293.5291.0−1%0.340.341%
Onions, Spring0.56178%305.6303.3−1%0.330.331%
Grain sorghum0.451122%44.445.52%2.252.20−2%
Wheat0.441127%83.682.1−2%1.201.222%
Green chile0.431130%5.55.50%18.1818.120%
Red chile0.441127%1590.91620.42%0.060.06−2%
Pecans0.431131%445.4452.42%0.220.22−2%
Median 0.441127%357.1347.20%0.280.290%
Source: Ward and Pulido-Velazquez [42].
Table 2. Farms and acres in Arizona and California using gravity irrigation technology, 2013.
ArizonaCalifornia
FarmsAcresFarmsAcres
Total Irrigation4380851,40744,3477,543,928
Base Technology
 Sprinkler37.4%28.3%30.4%22.0%
 Drip/Low-Flow10.8%5.9%57.3%36.9%
 Gravity68.6%87.9%34.3%60.2%
 Column sum 116.8%122.0%122.0%119.1%
Values can exceed 100% because farms use more than one method on their irrigated acreage. Source: USDA, 2014 [68].
Table 3. Farms and acres in Arizona and California using gravity irrigation technologies, 2013.
ArizonaCalifornia
FarmsAcresFarmsAcres
Gravity water control
 Down rows or furrows33.4%51.7%36.6%32.2%
 Between borders or in basins63.6%45.7%60.8%55.8%
 Uncontrolled 7.4%1.2%5.8%5.6%
 Other (Includes sub-irrigation by controlling water table)9.4%1.4%9.1%6.4%
 Column sum 113.8%100.0%112.3%100.0%
Gravity water delivery
 Above ground pipe5.7%0.5%5.0%4.8%
 Poly tubing0.8%0.2%13.6%2.3%
 Lined ditches41.9%36.9%5.5%10.6%
 Unlined ditches17.3%6.6%39.3%51.2%
 Underground pipe1.6%1.6%56.2%19.2%
 Column sum 67.2%45.7%119.7%88.0%
Values can exceed 100% because farms use more than one method on their irrigated acreage. Source: USDA, 2014 [68].
Table 4. Farms and acres in Arizona and California using sprinkler irrigation technology, 2013.
ArizonaCalifornia
FarmsAcresFarmsAcres
Sprinkler Systems
Center pivot23.1%46.5%18.7%9.0%
Linear move tower8.4%1.8%5.5%5.7%
Solid set and permanent16.7%23.5%40.2%41.0%
Side roll, wheel move12.1%3.6%6.4%10.0%
Big gun or traveler7.6%0.4%0.8%0.4%
Hand move26.6%13.4%25.7%8.3%
Other sprinkler13.0%10.8%14.2%25.6%
Column sum 107.6%100.0%111.6%100.0%
Values can exceed 100% because farms use more than one method on their irrigated acreage. Source: USDA, 2014 [68].
Table 5. Methods Used in Deciding When to Irrigate: 2013.
Irrigation Timing MethodsArizona FarmsCalifornia Farms
Traditional Methods
Condition of crop72.4%74.8%
Feel of soil44.8%40.8%
Scheduled by district15.8%12.1%
Personal calendar schedule23.5%33.6%
When neighbors irrigate1.6%8.3%
Advanced Methods
Soil moisture sensor4.0%16.8%
Plant moisture sensor0.5%4.8%
Scheduling service8.1%7.1%
Daily ET reports6.6%11.7%
Computer simulation0.1%1.6%
Source: USDA, 2014, [68].

