Comparative Analysis of Public Attitudes toward Nuclear Power Energy across 27 European Countries by Applying the Multilevel Model


Abstract
:1. Introduction
2. Theoretical Background
2.1. Acceptance of Nuclear Energy
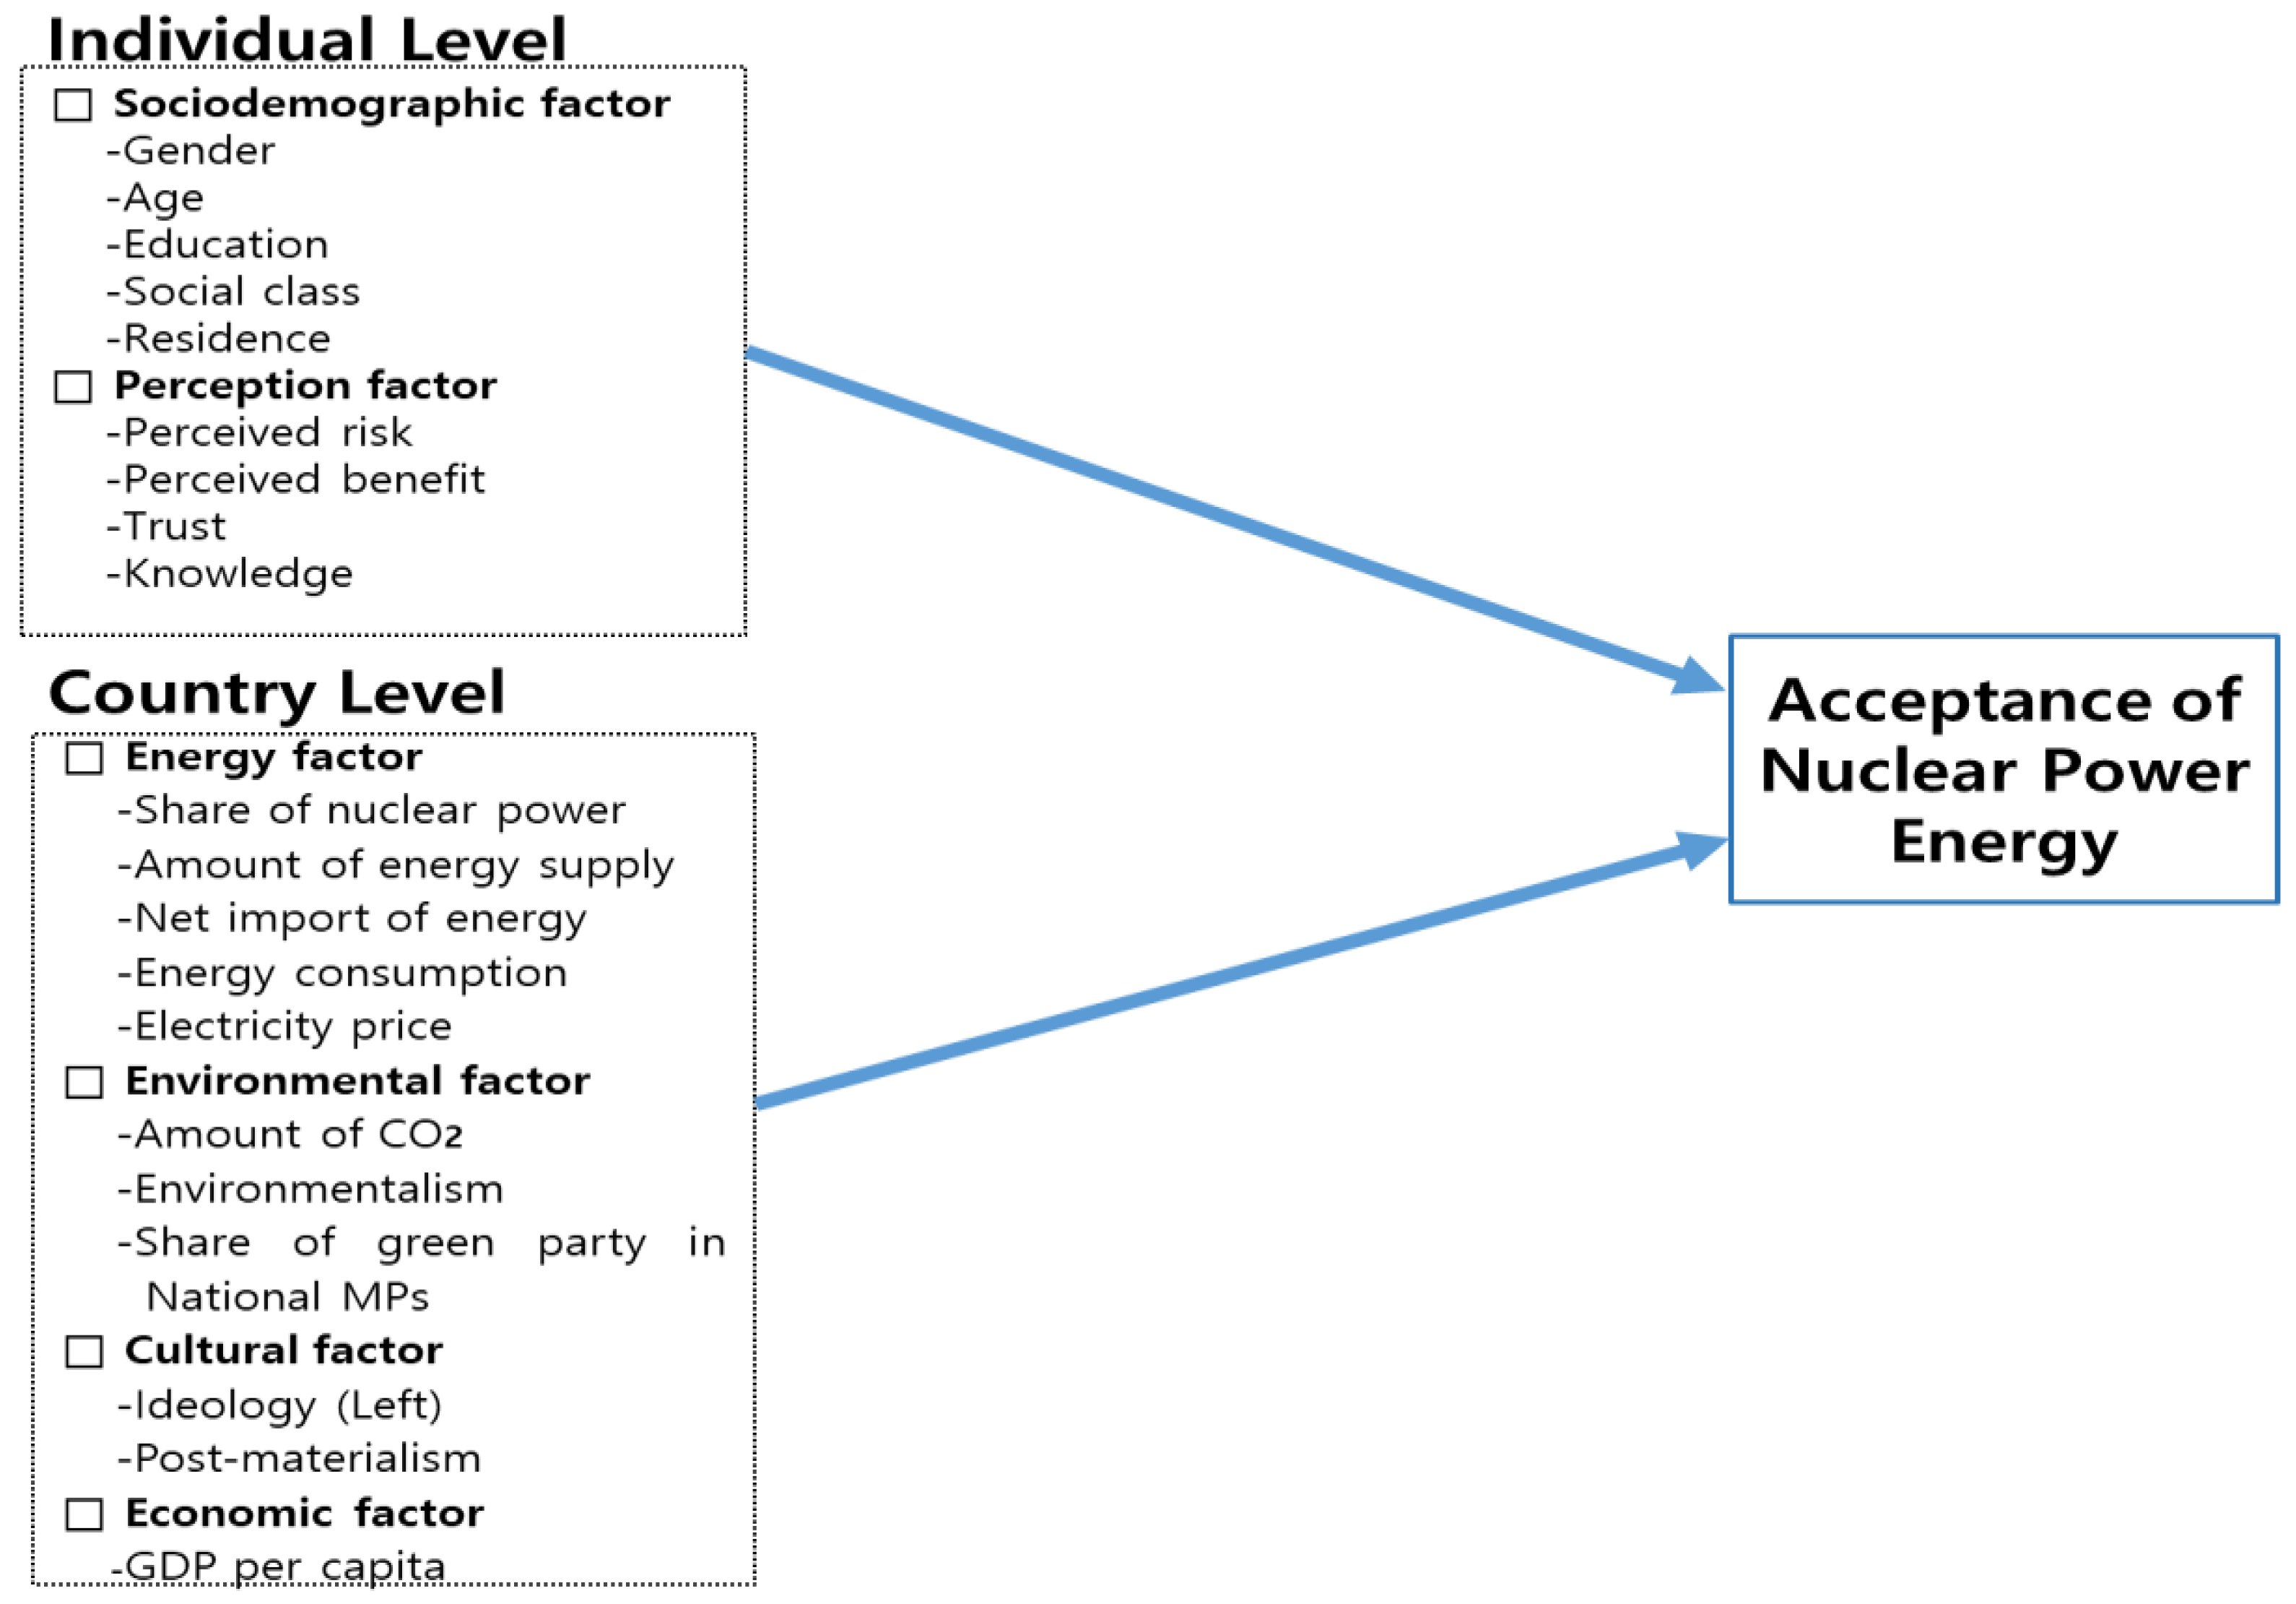
2.2. Perception Factor at the Individual Level
2.3. Contextual Factor at the Country Level
3. Data and Measures
4. Analysis and Findings
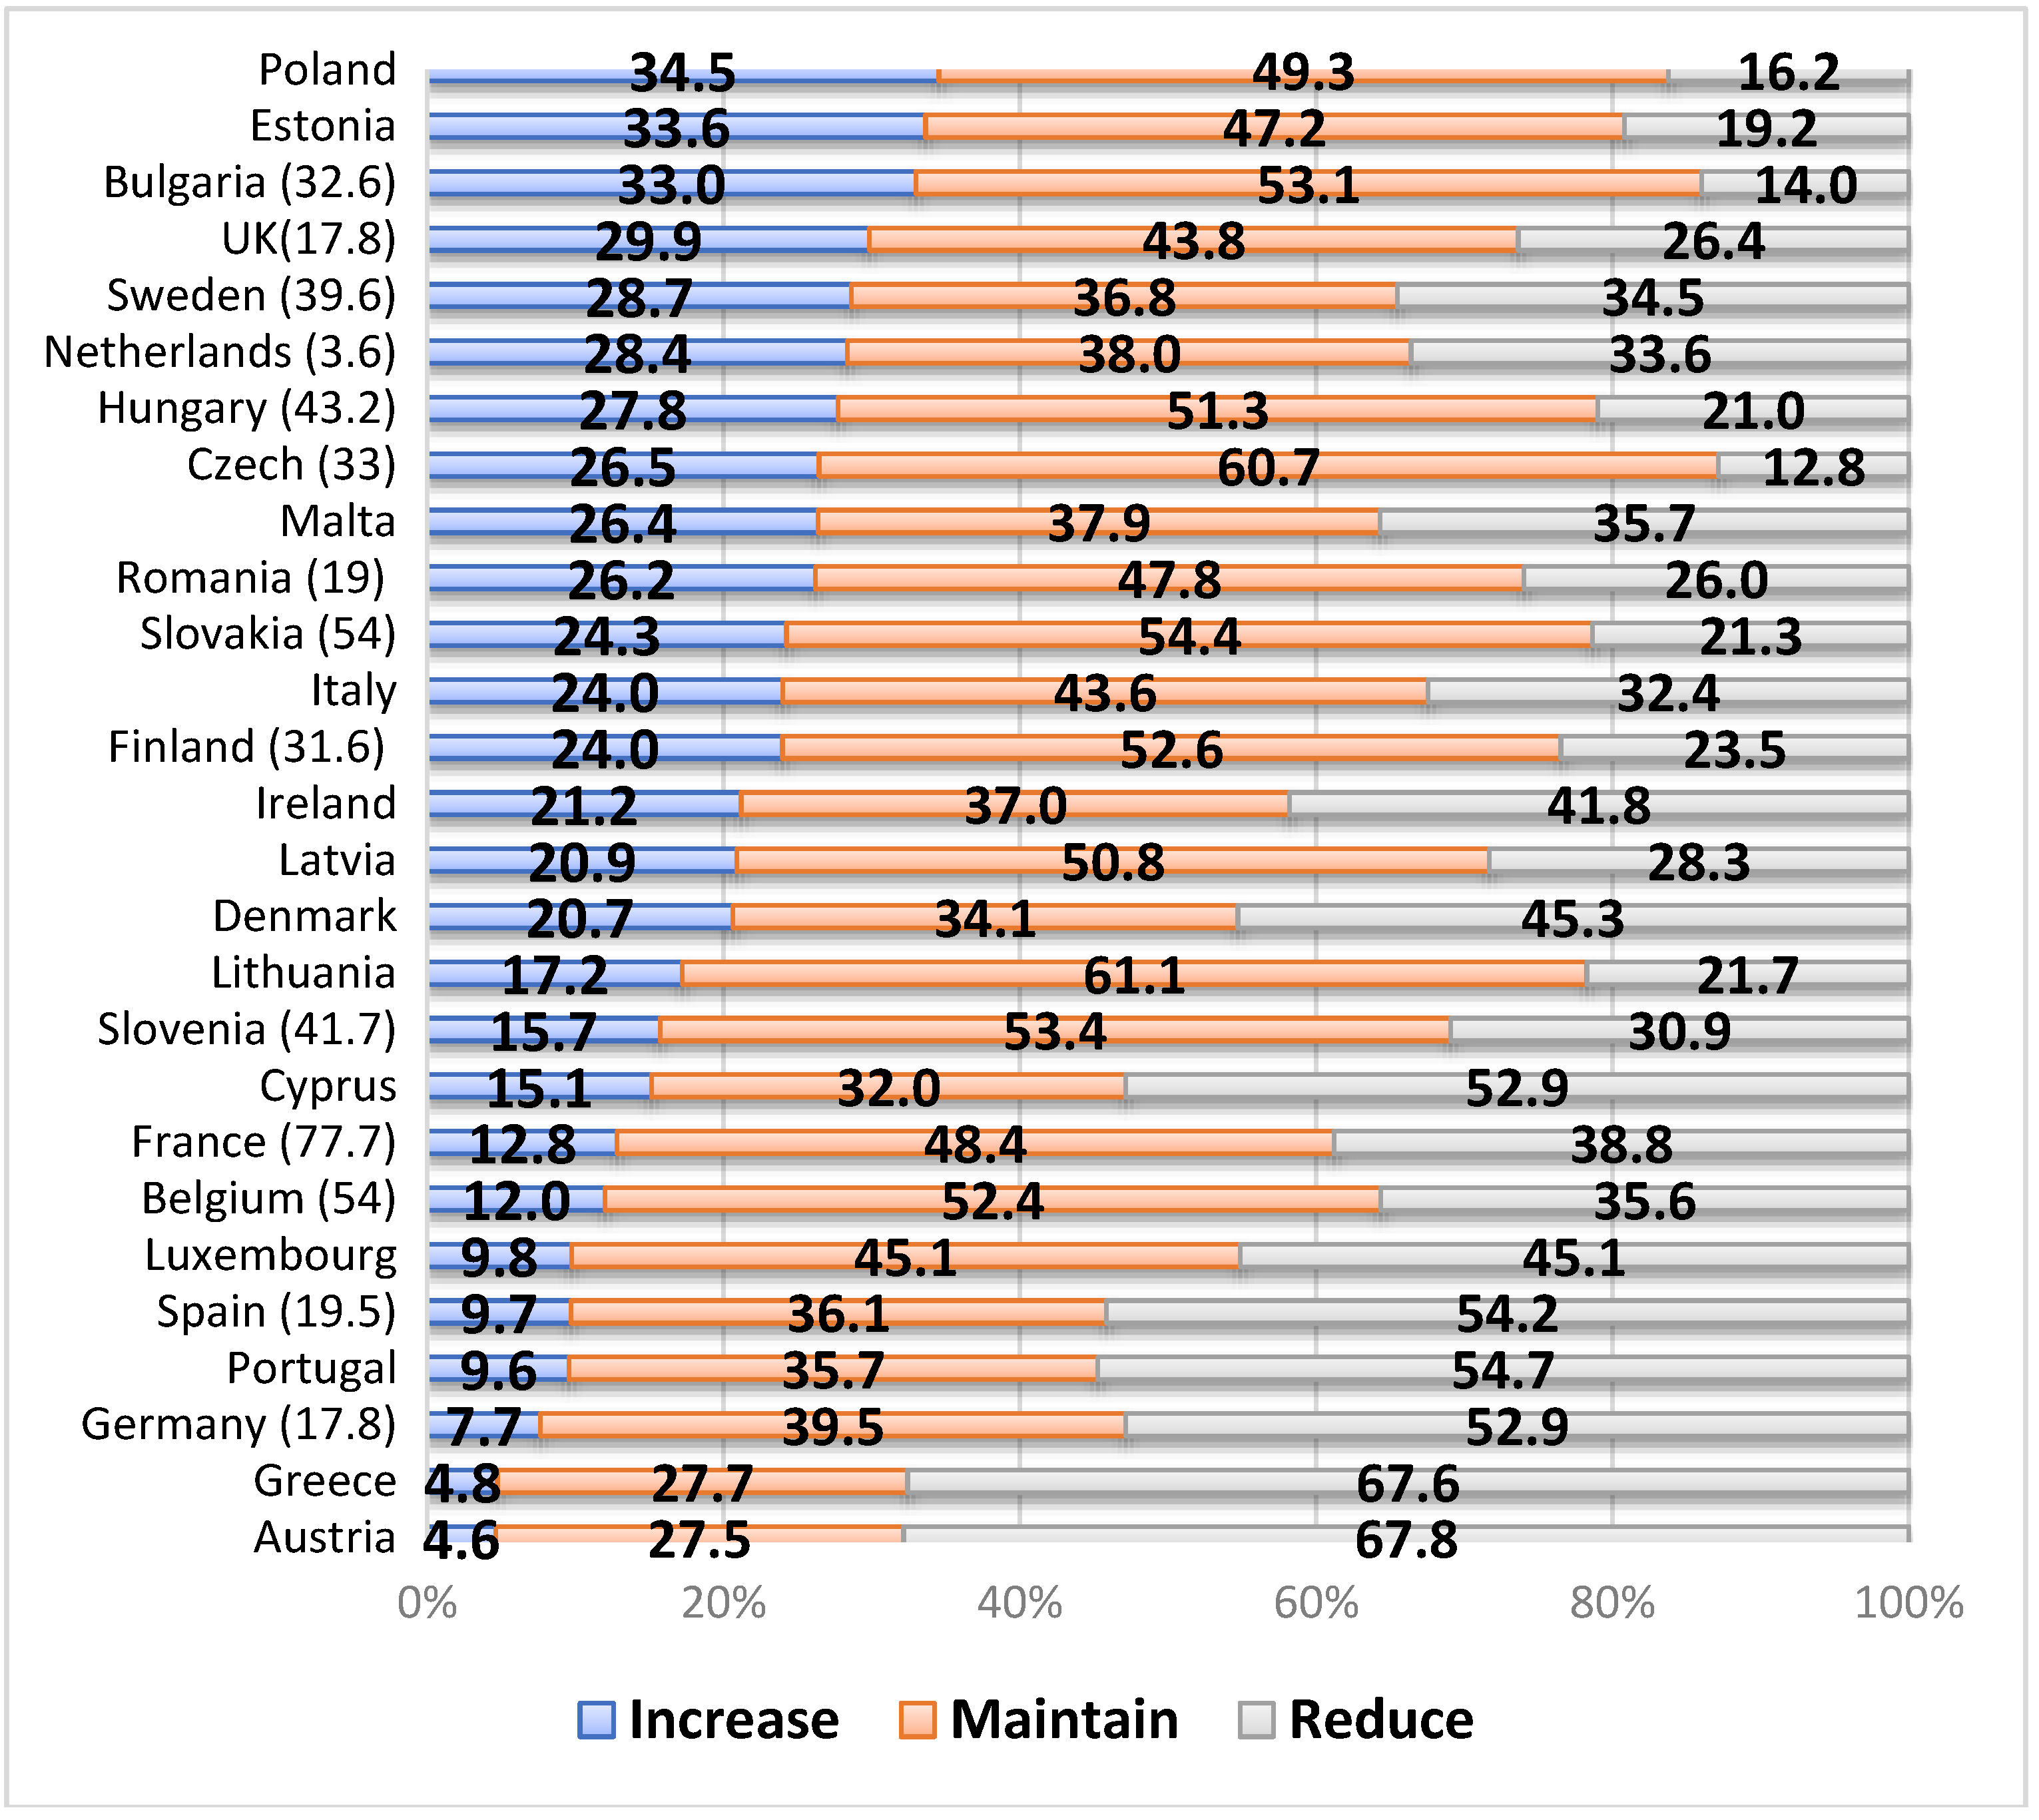
4.1. The Difference of Acceptance across Countries
4.2. Individual-Level Analysis
4.3. Country-Level Analysis
4.4. Multilevel Analysis
5. Conclusions
5.1. Summary
5.2. Implication
5.3. Limitations
5.4. The State of Energy in EU
Author Contributions
Funding
Conflicts of Interest
References
- World Nuclear Association. Country Profile. 2017. Available online: www.world-nuclear.org (accessed on 1 April 2018).
- International Atomic Energy Agency (IAEA). Nuclear Power Reactors in the World; Reference Data Series No. 2; IAEA: Vienna, Austria, 2017. [Google Scholar]
- National Grid. Future Energy Scenarios; National Grid: London, UK, 2017. [Google Scholar]
- Jäckle, S.; Bauschke, R. Comparing socialization, cultural and individual level effects on attitudes towards nuclear energy—A multilevel analysis of 27 European countries. Polit. Cult. Soc. 2012, 2, 341–366. [Google Scholar]
- Kim, Y.; Kim, W.; Kim, M. An international comparative analysis of public acceptance of nuclear energy. Energy Policy 2014, 66, 475–483. [Google Scholar] [CrossRef]
- Swaton, E.; Renn, O. Attitudes towards Nuclear Power: A Comparison between Three Nations; A-2361; International Institute for Applied Systems Analysis (IIASA): Laxenburg, Austria, 1984. [Google Scholar]
- Peters, E.; Slovic, P. The Role of Affect and Worldviews as Orienting Dispositions in the Perception and Acceptance of Nuclear Power. J. Appl. Soc. Psychol. 1996, 26, 1427–1453. [Google Scholar] [CrossRef]
- Slovic, P.; Flynn, J.; Mertz, C.K.; Poumadere, M.; Mays, C. Nuclear power and the public: A Comparative study of risk perception in France and the United Sates. In Cross-Cultural Risk Perception; Renn, O., Rohrmann, B., Eds.; Kluwer Academic: Boson, MA, USA, 2000; pp. 55–102. [Google Scholar]
- Kim, S.; Choi, S.; Wang, J. Individual perception vs. structural context: Searching for multilevel determinants of social acceptance of new science and technology across 34 countries. Sci. Public Policy 2014, 41, 44–57. [Google Scholar] [CrossRef]
- Wiegman, O.; Gutteling, J.M.; Cadet, B. Perception of Nuclear Energy and Coal in France and the Netherlands. Risk Anal. 1995, 15, 513–521. [Google Scholar] [CrossRef] [PubMed]
- Lawrence, A.; Sovacool, B.; Stirling, A. Nuclear energy and path dependence in: Coherence or continued divergence? Clim. Policy 2016, 16, 622–641. [Google Scholar] [CrossRef]
- Slovic, P. The Perception of Risk; Routledge: London, UK, 2016. [Google Scholar]
- Fischhoff, B.; Slovic, P.; Lichtenstein, S.; Read, S.; Combs, B. How safe is safe enough? A psychometric study of attitudes toward technological risks and benefit. Policy Sci. 1978, 9, 127–152. [Google Scholar] [CrossRef]
- Alhakami, A.S.; Slovic, P. A psychological study of the inverse relationship between perceived risk and perceived benefit. Risk Anal. 1994, 14, 1085–1096. [Google Scholar] [CrossRef] [PubMed]
- Vainio, A.; Paloniemi, R.; Varho, V. Weighing the Risks of Nuclear Energy and Climate Change: Trust in Different Information Sources, Perceived Risks, and Willingness to Pay for Alternatives to Nuclear Power. Risk Anal. 2017, 37, 557–569. [Google Scholar] [CrossRef] [PubMed]
- Kim, Y.; Kim, M.; Kim, W. Effect of the Fukushima nuclear disaster global public acceptance of nuclear energy. Energy Policy 2013, 61, 822–828. [Google Scholar] [CrossRef]
- Tanaka, Y. Major Psychological Factors Determining Public Acceptance of the Siting of Nuclear Facilities. J. Appl. Soc. Psychol. 2004, 34, 1147–1165. [Google Scholar] [CrossRef]
- De Groot, J.I.M.; Steg, L. Morality and Nuclear Energy: Perceptions of Risks and Benefits, Personal Norms, and Willingness to Take Action Related to Nuclear Energy. Risk Anal. 2010, 30, 1363–1373. [Google Scholar] [CrossRef] [PubMed]
- Flynn, J.; Burns, W.; Mertz, C.K.; Slovic, P. Trust as a determinant of opposition to a high-level radioactive waste repository: Analysis of a structural model. Risk Anal. 1992, 12, 417–430. [Google Scholar] [CrossRef]
- Sjöberg, L.; Drottz-Sjöberg, B. Knowledge and risk per-ception among nuclear power plant employees. Risk Anal. 1991, 11, 607–618. [Google Scholar] [CrossRef] [PubMed]
- Costa-Font, J.; Rudisill, C.; Mossialos, E. Attitudes as an Expression of Knowledge and “Political Anchoring”: The Case of Nuclear Power in the United Kingdom. Risk Anal. 2008, 28, 1273–1288. [Google Scholar] [CrossRef] [PubMed]
- Stoutenborough, J.W.; Vedlitz, A. The role of scientific knowledge in the public’s perceptions of energy technology risks. Energy Policy 2016, 96, 206–216. [Google Scholar] [CrossRef]
- Nuclear Energy Agency (NEA). Public Attitudes to Nuclear Power; NEA—OECD: Paris, France, 2010; p. 6859. Available online: https://www.oecd-nea.org/ndd/reports/2010/nea6859-public-attitudes.pdf (accessed on 2 March 2018).
- Bielecki, J. Energy security: Is the wolf at the door? Q. Rev. Econ. Financ. 2002, 42, 235–250. [Google Scholar] [CrossRef]
- Pampel, F.C. Support for Nuclear Energy in the Context of Climate Change: Evidence from the European Union. Organ. Environ. 2011, 24, 249–268. [Google Scholar] [CrossRef]
- Corner, A.; Venables, D.; Spence, A.; Poortinga, W.; Demski, C.; Pidgeon, N. Nuclear power, climate change and energy security: Exploring British public attitudes. Energy Policy 2011, 39, 4823–4833. [Google Scholar] [CrossRef]
- Jun, E.; Chang, S.H. The analysis of security cost for different energy source. Appl. Energy 2009, 86, 1894–1901. [Google Scholar] [CrossRef]
- Choi, Y. Study on the determinant of social acceptance of energy resource: Focusing fossil, nuclear power and renewable energy. J. Gov. Stud. 2015, 21, 295–330. [Google Scholar]
- Spence, A.; Poortinga, W.; Pidgeon, N. Public Perceptions of Energy Choices: The Influence of Beliefs about Climate Change and the Environment. Energy Environ. 2010, 21, 385–407. [Google Scholar] [CrossRef]
- Besley, J.C.; Oh, S. The Impact of Accident Attention, Ideology, and Environmentalism on American Attitudes toward Nuclear Energy. Risk Anal. 2014, 34, 949–964. [Google Scholar] [CrossRef] [PubMed]
- Rothman, S.; Lichter, S.R. Elite Ideology and Risk Perception in Nuclear Energy Policy. Am. Polit. Sci. Rev. 1987, 81, 383–404. [Google Scholar] [CrossRef]
- Inglehart, R. The silent revolution in Europe: Intergenerational change in post-industrial societies. Am. Polit. Sci. Rev. 1971, 65, 991–1017. [Google Scholar] [CrossRef]
- Abramson, P.R.; Inglehart, R. Generational replacement and value change in six West European societies. Am. J. Polit. Sci. 1986, 30, 1–25. [Google Scholar] [CrossRef]
- European Commission. Eurobarometer 72.2 (Sep-Oct 2009); ZA4976; TNS OPINION & SOCIAL, Brussels [Producer]; GESIS Data Archive; Data file Version 3.0.0; European Commission: Cologne, Germany, 2012; Available online: http://zacat.gesis.org (accessed on 7 May 2018). [CrossRef]
- IAEA. Nuclear Share of Electricity Generation in 2017. Available online: http://www.iaea.org/PRIS/WorldStatistics/NuclearShareofElectricityGeneration.aspx (accessed on 4 March 2018).
- World Energy Agency. Key world Energy Statistics; World Energy Agency: Paris, France, 2009. [Google Scholar]
- Eurostat. Available online: http://ec.europa.eu/eurostat/statistics-explained/index.php/Electricity_price_statistics (accessed on 4 March 2017).
- European Commission. Eurobarometer 63.1 (Jan-Feb 2005); TNS OPINION & SOCIAL, Brussels [Producer]; GESIS Data Archive; ZA4233 Data file Version 1.1.0; European Commission: Cologne, Germany, 2012; Available online: http://zacat.gesis.org (accessed on 7 May 2018). [CrossRef]
- The European Parliament. 2009 Election Results. Available online: http://www.europarl.europa.eu/elections2014-results/en/election-results-2009.html (accessed on 5 March 2018).
- Word Bank. Selected Indicators for 2009. Available online: http://data.worldbank.org/indicator (accessed on 5 March 2018).
- Solomon, L.S.; Tomaskovic-Devey, D.; Risman, B.J. The gender gap and nuclear power: Attitudes in a politicized environment. Sex Roles 1989, 21, 401–414. [Google Scholar] [CrossRef]
- Peugh, J.L. A practical guide to multilevel modeling. J. Sch. Psychol. 2010, 48, 85–112. [Google Scholar] [CrossRef] [PubMed]
- Peugh, J.L.; Enders, C.K. Using the SPSS mixed procedure to fit cross-sectional and longitudinal multilevel models. Educ. Psychol. Meas. 2005, 65, 717–741. [Google Scholar] [CrossRef]
- Luke, D.A. Multilevel Modeling; Sage: London, UK, 2004. [Google Scholar]
- Muthén, B.O. Multilevel covariance structure analysis. Soc. Methods Res. 1994, 22, 376–398. [Google Scholar] [CrossRef]
- European Commission. State of Play in the EU Energy Policy. 2010. Available online: http://eur-lex.europa.eu/legal-content/EN/TXT/PDF/?uri=CELEX:52010SC1346&from=EN (accessed on 6 March 2018).
- International Energy Agency. World Energy Outlook 2011. Available online: https://webstore.iea.org/world-energy-outlook-2011 (accessed on 6 March 2018).
- European Commission. Energy in Figures. 2014. Available online: https://ec.europa.eu/energy/sites/ener/files/documents/2014_pocketbook.pdf (accessed on 7 March 2018).
- Win-Gallup International. Impact of Japan Earthquake on Views about Nuclear Energy. 2011. Available online: http://www.nrc.co.jp/report/pdf/110420_2.pdf (accessed on 1 April 2018).


| Theoretical Concept | Questionnaire | Response Scale |
|---|---|---|
| Acceptance | QA15: In your opinion, should the current level of nuclear energy as a proportion of all energy sources be reduced, maintained the same, or be increased? | 1. Reduced, 2. Maintained the same, 3. Increased |
| Residence | QA1: Residence: Have you ever lived in an area close (within a 50-km radius) to a nuclear power plant? | 1. No, 2. Yes |
| Perceived Risk 1 (personal risk) | QA9: To what extent do you think that (the) nuclear power plant(s) in (OUR COUNTRY) represent(s) a risk to you and your family? | 1. Not a risk at all, 2. Not much of a risk, 3. Some risk, 4. A big risk |
| Perceived Risk 2 (relative risk) | QA10: Nuclear incidents sometimes raise major concerns in the media and among the public. In your opinion, compared to other safety risks in our lives, would you say that nuclear risks are…? | 1. Strongly exaggerated, 2. Somewhat exaggerated, 3. Somewhat underestimated, 4. Strongly underestimated |
| Perceived benefit | QA12: To what extent do you agree or disagree with each of the following three statements on the value of nuclear energy? (for example, nuclear energy helps to limit climate change) | 1. Totally disagree, 2. Tend to disagree, 3. Tend to agree, 4. Totally agree |
| Trust | QA11: To what extent do you agree or disagree with each of the following “seven” statements? (for example, it is possible to operate a nuclear power plant in a safe manner) | 1. Totally disagree, 2. Tend to disagree, 3. Tend to agree, 4. Totally agree |
| Knowledge | QA5: How informed do you think you are about the safety of nuclear power plants? | 1. Not at all informed, 2. Fairly well informed, 3. Not very well informed, 4. Very well informed |
| Variables | Whole Model | Austria | Greece | Portugal | Cyprus | Denmark | Luxembourg | |||||||
| B(SE) | β | B(SE) | β | B(SE) | β | B(SE) | β | B(SE) | β | B(SE) | β | B(SE) | β | |
| Gender (1 = Women) | −0.069 ***(0.010) | −0.047 | −0.029(0.044) | −0.025 | −0.055(0.039) | −0.049 | 0.040(0.068) | 0.029 | −0.419 ***(0.143) | −0.270 | −0.151 **(0.065) | −0.096 | 0.018(0.067) | 0.013 |
| Age | 0.002 ***(0.000) | 0.045 | −0.001(0.002) | −0.024 | −0.002 *(0.001) | −0.073 | 0.001(0.002) | 0.017 | −0.008(0.005) | −0.166 | 0.006 ***(0.002) | 0.133 | 0.001(0.002) | 0.030 |
| Education (1 = above 15 years) | 0.058 ***(0.016) | 0.026 | 0.055(0.091) | 0.023 | −0.035(0.053) | −0.028 | −0.011(0.077) | −0.008 | −0.086(0.255) | −0.035 | 0.008(0.138) | 0.002 | −0.136(0.136) | −0.050 |
| Social Class | −0.013 ***(0.003) | −0.028 | 0.027(0.017) | 0.061 | 0.006(0.014) | 0.017 | −0.039(0.030) | −0.069 | 0.033(0.048) | 0.064 | −0.007(0.020) | −0.015 | −0.050 **(0.023) | −0.105 |
| Residence | −0.031 **(0.015) | −0.014 | −0.005(0.096) | −0.002 | −0.037(0.183) | −0.007 | 0.473 *(0.254) | 0.096 | - | - | 0.110(0.071) | 0.063 | 0.028(0.064) | 0.021 |
| Perceived Risk 1 | −0.127 ***(0.006) | −0.155 | −0.065 **(0.030) | −0.093 | −0.078 ***(0.028) | −0.106 | −0.214 ***(0.044) | −0.261 | −0.183 ***(0.067) | −0.247 | −0.051(0.038) | −0.058 | −0.113 ***(0.040) | −0.157 |
| Perceived Risk 2 | −0.095 ***(0.007) | −0.106 | −0.109 ***(0.033) | −0.161 | −0.031(0.026) | −0.045 | −0.043(0.048) | −0.048 | −0.059(0.080) | −0.071 | −0.077(0.047) | −0.076 | −0.159 ***(0.048) | −0.181 |
| Perceived Benefit | 0.203 ***(0.008) | 0.211 | 0.041(0.035) | 0.058 | 0.168 ***(0.028) | 0.254 | 0.196 **(0.072) | 0.172 | 0.210 **(0.082) | 0.264 | 0.255 ***(0.048) | 0.238 | 0.115 **(0.051) | 0.132 |
| Trust | 0.233 ***(0.009) | 0.219 | 0.260 ***(0.044) | 0.322 | 0.161 ***(0.043) | 0.165 | 0.230 ***(0.080) | 0.196 | 0.203 *(0.112) | 0.177 | 0.363 ***(0.059) | 0.294 | 0.193 ***(0.062) | 0.190 |
| Knowledge | 0.017 **(0.007) | 0.017 | 0.059 *(0.033) | 0.072 | 0.002(0.030) | 0.003 | 0.088(0.058) | 0.084 | −0.035(0.106) | −0.033 | −0.004(0.043) | −0.004 | −0.037(0.043) | −0.044 |
| F-Value | 703.93 *** | 25.27 *** | 17.96 *** | 11.50 *** | 5.00 *** | 19.10 *** | 10.31 *** | |||||||
| Adjusted R2 | 0.301 | 0.322 | 0.194 | 0.257 | 0.281 | 0.281 | 0.215 | |||||||
| Adjusted R2 in Model 1 | 0.028 | 0.032 | 0.036 | 0.031 | 0.055 | 0.058 | 0.002 | |||||||
| Adjusted R2 in Model 2 | 0.290 | 0.323 | 0.211 | 0.251 | 0.222 | 0.252 | 0.208 | |||||||
| R2 Change | 0.276 | 0.285 | 0.176 | 0.243 | 0.199 | 0.243 | 0.220 | |||||||
| Variables | Ireland | Malta | Italy | Latvia | Lithuania | Estonia | Poland | |||||||
| B(SE) | β | B(SE) | β | B(SE) | β | B(SE) | β | B(SE) | β | B(SE) | β | B(SE) | β | |
| Gender (1 = Women) | −0.089(0.055) | −0.057 | −0.246 *(0.127) | −0.155 | −0.093 *(0.053) | −0.062 | −0.160 ***(0.061) | −0.113 | −0.107 **(0.049) | −0.087 | −0.192 ***(0.063) | −0.133 | −0.190 ***(0.057) | −0.133 |
| Age | 0.003(0.002) | 0.061 | 0.001(0.005) | 0.012 | 0.002(0.002) | 0.037 | 0.004 **(0.002) | 0.090 | 0.004 **(0.002) | 0.107 | 0.001(0.002) | 0.020 | 0.001(0.002) | 0.026 |
| Education (1 = above 15 years) | 0.149(0.094) | 0.059 | −0.167(0.176) | −0.087 | −0.054(0.067) | −0.031 | −0.081(0.237) | −0.014 | −0.029(0.115) | −0.011 | 0.013(0.162) | 0.004 | 0.043(0.122) | 0.015 |
| Social Class | 0.031 *(0.017) | 0.062 | −0.117 ***(0.041) | −0.234 | −0.029(0.022) | −0.047 | 0.004(0.020) | 0.008 | 0.022(0.016) | 0.053 | −0.003(0.019) | −0.007 | 0.014(0.018) | 0.031 |
| Residence | 0.148(0.160) | 0.032 | 0.113(0.310) | 0.029 | 0.179(0.125) | 0.051 | 0.014(0.096) | 0.006 | 0.014(0.087) | 0.006 | −0.286 *(0.172) | −0.069 | −0.358 *(0.216) | −0.065 |
| Perceived Risk 1 | −0.176 ***(0.036) | −0.194 | −0.101(0.074) | −0.110 | −0.353 ***(0.031) | −0.424 | −0.039(0.029) | −0.062 | −0.132 ***(0.029) | −0.204 | −0.093 ***(0.033) | −0.129 | −0.172 ***(0.034) | −0.221 |
| Perceived Risk 2 | −0.150 ***(0.040) | −0.165 | −0.114 *(0.062) | −0.146 | −0.064(0.039) | −0.071 | −0.070*(0.036) | −0.095 | 0.014(0.036) | 0.017 | −0.112 ***(0.043) | −0.125 | −0.020(0.039) | −0.024 |
| Perceived Benefit | 0.203 ***(0.043) | 0.201 | 0.324 ***(0.082) | 0.318 | 0.144 ***(0.046) | 0.135 | 0.207 ***(0.046) | 0.215 | 0.135 ***(0.040) | 0.147 | 0.304 ***(0.051) | 0.292 | 0.117**(0.046) | 0.118 |
| Trust | 0.187 ***(0.052) | 0.170 | 0.184 *(0.101) | 0.153 | 0.045(0.059) | 0.038 | 0.290 ***(0.060) | 0.246 | 0.073(0.048) | 0.070 | 0.112*(0.058) | 0.101 | 0.301 ***(0.057) | 0.262 |
| Knowledge | 0.053(0.036) | 0.053 | 0.090(0.079) | 0.091 | 0.062 *(0.037) | 0.061 | 0.047(0.044) | 0.046 | 0.002(0.036) | 0.002 | 0.086 *(0.047) | 0.081 | 0.055(0.041) | 0.056 |
| F-Value | 33.12 *** | 4.51 *** | 24.01 *** | 14.36 *** | 8.62 *** | 18.26 *** | 19.62 *** | |||||||
| Adjusted R2 | 0.368 | 0.201 | 0.279 | 0.232 | 0.113 | 0.288 | 0.281 | |||||||
| Adjusted R2 in Model 1 | 0.048 | 0.003 | 0.004 | 0.025 | 0.031 | 0.076 | 0.050 | |||||||
| Adjusted R2 in Model 2 | 0.370 | 0.150 | 0.259 | 0.173 | 0.097 | 0.268 | 0.250 | |||||||
| R2 Change | 0.315 | 0.219 | 0.278 | 0.223 | 0.091 | 0.229 | 0.246 | |||||||
| Variables | Spain | Germany | France | Belgium | Sweden | Netherlands | Slovenia | |||||||
| B(SE) | β | B(SE) | β | B(SE) | β | B(SE) | β | B(SE) | β | B(SE) | β | B(SE) | β | |
| Gender (1 = Women) | 0.010(0.043) | 0.007 | 0.029(0.029) | 0.023 | −0.057(0.045) | −0.042 | 0.007(0.042) | 0.006 | −0.064(0.050) | −0.040 | −0.123 **(0.048) | −0.078 | −0.098 **(0.046) | −0.070 |
| Age | −0.001(0.001) | −0.017 | 0.001(0.001) | 0.028 | 0.003 **(0.001) | 0.086 | 0.002(0.001) | 0.052 | 0.005 ***(0.002) | 0.096 | 0.006 ***(0.001) | 0.123 | 0.002(0.001) | 0.043 |
| Education (1 = above 15 years) | −0.057(0.054) | −0.039 | 0.005(0.044) | 0.003 | −0.148 **(0.067) | −0.080 | 0.018(0.071) | 0.009 | 0.023(0.084) | 0.008 | −0.049(0.110) | −0.014 | −0.064(0.115) | −0.019 |
| Social Class | −0.009(0.018) | −0.017 | −0.016(0.010) | −0.036 | −0.010(0.015) | −0.022 | 0.005(0.014) | 0.011 | 0.012(0.017) | 0.021 | 0.033*(0.018) | 0.055 | 0.005(0.014) | 0.011 |
| Residence | −0.022(0.092) | −0.008 | 0.056(0.037) | 0.034 | −0.070(0.055) | −0.040 | −0.020(0.045) | −0.014 | 0.066(0.061) | 0.032 | 0.000(0.059) | 0.000 | 0.051(0.073) | 0.023 |
| Perceived Risk 1 | −0.212 ***(0.030) | −0.252 | −0.077 ***(0.023) | −0.098 | −0.129 ***(0.035) | −0.138 | −0.070 **(0.029) | −0.088 | −0.095 **(0.039) | −0.084 | −0.112 ***(0.034) | −0.111 | −0.084 ***(0.030) | −0.106 |
| Perceived Risk 2 | −0.147 ***(0.030) | −0.174 | −0.127 ***(0.021) | −0.181 | −0.126 ***(0.034) | −0.136 | −0.060 **(0.030) | −0.070 | −0.246 ***(0.037) | −0.238 | −0.102 ***(0.034) | −0.106 | −0.071 **(0.031) | −0.081 |
| Perceived Benefit | 0.186 ***(0.037) | 0.189 | 0.112 ***(0.023) | 0.141 | 0.142 ***(0.035) | 0.151 | 0.302 ***(0.038) | 0.312 | 0.302 ***(0.043) | 0.248 | 0.289 ***(0.035) | 0.280 | 0.217 ***(0.037) | 0.249 |
| Trust | 0.219 ***(0.041) | 0.205 | 0.274 ***(0.028) | 0.318 | 0.225 ***(0.044) | 0.196 | 0.139 ***(0.046) | 0.124 | 0.131 ***(0.047) | 0.110 | 0.317 ***(0.049) | 0.256 | 0.245 ***(0.045) | 0.237 |
| Knowledge | 0.070 **(0.033) | 0.072 | −0.026(0.019) | −0.032 | −0.001(0.035) | −0.001 | −0.014(0.029) | −0.016 | 0.041(0.037) | 0.034 | −0.088 ***(0.033) | −0.084 | 0.039(0.031) | 0.043 |
| F-Value | 35.51 *** | 74.63 *** | 24.60 *** | 23.43 *** | 37.76 *** | 46.02 *** | 31.78 *** | |||||||
| Adjusted R2 | 0.353 | 0.372 | 0.234 | 0.217 | 0.308 | 0.371 | 0.311 | |||||||
| Adjusted R2 in Model 1 | 0.007 | 0.006 | 0.040 | 0.018 | 0.053 | 0.069 | 0.033 | |||||||
| Adjusted R2 in Model 2 | 0.340 | 0.363 | 0.215 | 0.223 | 0.299 | 0.336 | 0.291 | |||||||
| R2 Change | 0.353 | 0.367 | 0.196 | 0.201 | 0.258 | 0.307 | 0.284 | |||||||
| Variables | UK | Romania | Finland | Slovakia | Hungary | Bulgaria | Czech Republic | |||||||
| B(SE) | β | B(SE) | β | B(SE) | β | B(SE) | β | B(SE) | β | B(SE) | β | B(SE) | β | |
| Gender (1 = Women) | −0.160 ***(0.051) | −0.105 | 0.011(0.062) | 0.008 | −0.145 ***(0.042) | −0.105 | −0.085 **(0.042) | −0.062 | −0.051(0.050) | −0.035 | 0.016(0.052) | 0.012 | −0.117 ***(0.034) | −0.095 |
| Age | 0.006 ***(0.001) | 0.138 | 0.000(0.002) | −0.002 | 0.003 ***(0.001) | 0.078 | 0.003 **(0.001) | 0.061 | 0.004 **(0.002) | 0.088 | −0.002(0.002) | −0.058 | 0.002(0.001) | 0.044 |
| Education (1 = above 15 years) | 0.182 *(0.101) | 0.061 | 0.013(0.106) | 0.006 | −0.017(0.085) | −0.006 | 0.044(0.166) | 0.008 | 0.031(0.064) | 0.018 | 0.185 *(0.108) | 0.066 | 0.085(0.203) | 0.011 |
| Social Class | −0.011(0.015) | −0.022 | −0.029 *(0.018) | −0.075 | 0.010(0.012) | 0.023 | 0.004(0.013) | 0.008 | −0.027(0.017) | −0.056 | −0.032 *(0.017) | −0.072 | 0.007(0.011) | 0.018 |
| Residence | 0.043(0.071) | 0.020 | 0.068(0.193) | 0.015 | −0.041(0.064) | −0.018 | 0.018(0.051) | 0.010 | 0.016(0.101) | 0.005 | −0.031(0.149) | −0.008 | −0.044(0.057) | −0.021 |
| Perceived Risk 1 | −0.133 ***(0.036) | −0.139 | −0.178 ***(0.034) | −0.239 | −0.151 ***(0.031) | −0.169 | −0.175 ***(0.030) | −0.202 | −0.146 ***(0.037) | −0.151 | −0.121 ***(0.032) | −0.173 | −0.131 ***(0.026) | −0.173 |
| Perceived Risk 2 | −0.074*(0.039) | −0.071 | −0.051(0.036) | −0.065 | −0.126 ***(0.034) | −0.125 | −0.102 ***(0.034) | −0.108 | −0.048(0.038) | −0.049 | −0.109 ***(0.041) | −0.121 | −0.093 ***(0.031) | −0.111 |
| Perceived Benefit | 0.227 ***(0.045) | 0.199 | 0.147 ***(0.043) | 0.161 | 0.255 ***(0.036) | 0.248 | 0.271 ***(0.037) | 0.259 | 0.205 ***(0.035) | 0.227 | 0.158 ***(0.042) | 0.163 | 0.155 ***(0.032) | 0.171 |
| Trust | 0.269 ***(0.055) | 0.210 | 0.073(0.050) | 0.071 | 0.225 ***(0.045) | 0.199 | 0.070(0.044) | 0.060 | 0.142 ***(0.048) | 0.123 | 0.243 ***(0.049) | 0.241 | 0.211 ***(0.039) | 0.214 |
| Knowledge | 0.018(0.034) | 0.018 | 0.037(0.040) | 0.042 | 0.023(0.030) | 0.024 | 0.047(0.030) | 0.050 | 0.081 **(0.035) | 0.083 | 0.096 ***(0.036) | 0.109 | 0.082 ***(0.023) | 0.103 |
| F-Value | 30.16 *** | 7.35 *** | 51.31 *** | 29.40 *** | 17.21 *** | 23.38 *** | 51.95 *** | |||||||
| Adjusted R2 | 0.291 | 0.120 | 0.390 | 0.251 | 0.181 | 0.310 | 0.363 | |||||||
| Adjusted R2 in Model 1 | 0.078 | 0.005 | 0.099 | 0.020 | 0.014 | 0.017 | 0.037 | |||||||
| Adjusted R2 in Model 2 | 0.282 | 0.142 | 0.380 | 0.258 | 0.161 | 0.294 | 0.352 | |||||||
| R2 Change | 0.213 | 0.131 | 0.292 | 0.233 | 0.174 | 0.303 | 0.328 | |||||||
| Model 1 | Model 2 | Model 3 | |||||
|---|---|---|---|---|---|---|---|
| B | Beta | B | Beta | B | Beta | ||
| Micro Variables | (Constant) | 1.350(1.886) | - | 4.223(0.071) | - | 2.987(0.575) | |
| Perceived Risk 1 | −0.133(0.170) | −0.195 | - | - | 0.251(0.224) | 0.368 | |
| Perceived Risk 2 | −0.171(0.340) | −0.140 | - | - | −0.332(0.344) | −0.272 | |
| Perceived Benefit | 0.357(0.232) | 0.327 | - | - | 0.135(0.251) | 0.124 | |
| Trust | 0.386 **(0.205) | 0.430 | 0.409(0.297) | 0.456 | |||
| Knowledge | −0.318(0.196) | −0.303 | - | - | 0.217(0.393) | 0.207 | |
| Macro Variables | GDP per capita | - | - | −0.001(0.000) | −0.114 | −0.001(0.000) | −0.191 |
| Share of nuclear power | - | - | 0.004 *(0.002) | 0.342 | 0.002(0.002) | 0.174 | |
| Amount of energy supply | - | - | 0.635 **(0.269) | 0.542 | 0.139(0.404) | 0.118 | |
| Net import of energy | - | - | 0.001(0.001) | 0.007 | 0.001(0.001) | 0.194 | |
| Energy consumption | - | - | 0.001(0.000) | 0.136 | −0.001(0.000) | −0.241 | |
| Electricity price | - | - | 0.275(0.976) | 0.057 | −0.050(0.961) | −0.010 | |
| Amount of CO2 | - | - | 0.011(0.015) | 0.150 | 0.025(0.016) | 0.351 | |
| Environmentalism | - | - | −0.763 **(0.282) | −0.384 | −0.347(0.364) | −0.174 | |
| Share of Green Party among national MPs | - | - | −0.009(0.010) | −0.231 | −0.001(012) | −0.033 | |
| Ideology (Left) | - | - | −0.241 *(0.112) | −0.374 | −0.315 **(125) | −0.487 | |
| Post-materialism | - | - | 0.425(0.272) | 0.279 | −0.057(481) | −0.038 | |
| F-Value | 8.208 *** | 5.232 *** | 5.635 *** | ||||
| Adjusted R-Square | 0.581 | 0.793 | 0.740 | ||||
| Model 1 | Model 2 | Model 3 | Model 4 | ||
|---|---|---|---|---|---|
| Regression Coefficient (Fixed-effect) | |||||
| Constant | 1.850 *** | 4.228 *** | 1.284 *** | 4.418 *** | |
| Level 1: Individual Predictors | Gender (1 = Women) | −0.080 *** | −0.079 *** | ||
| Age | 0.002 *** | 0.002 *** | |||
| Education (1 = above 15 years) | −0.004 | −0.004 | |||
| Social Class | −0.002 | −0.002 | |||
| Residence | 0.017 | 0.017 | |||
| Perceived Risk 1 | −0.133 *** | −0.133 *** | |||
| Perceived Risk 2 | −0.091 *** | −0.092 *** | |||
| Perceived Benefit | 0.200 *** | 0.199 *** | |||
| Trust | 0.198 *** | 0.198 *** | |||
| Knowledge | 0.031 *** | 0.030 *** | |||
| Level 2: Contextual Predictors | GDP per capita | 0.000 | 0.000 | ||
| Share of nuclear power | 0.003 * | −0.001 | |||
| Amount of energy supply | 0.660 ** | 0.483 | |||
| Net import of energy | 0.000 | 0.004 ** | |||
| Energy consumption | 0.000 | 0.000 | |||
| Electricity price | 0.159 | −0.527 | |||
| Amount of CO2 | 0.008 | −0.005 | |||
| Environmentalism | −0.789 ** | −0.072 | |||
| Share of Green Party among national MPs | −0.006 | −0.019 | |||
| Ideology (Left) | −0.231 * | −0.206 | |||
| Post-materialism | 0.417 | −1.112 ** | |||
| Variance Components (random effects) | |||||
| Variance of Residual() (at the individual level) | 0.475 *** | 0.475 *** | 343 *** | 0.343 *** | |
| Variance of Intercept() (at the country level) | 0.055 *** | 0.019 ** | 0.041 *** | 0.025 | |
| Sum of variance and covariance of slope’s deviation | - | - | 0.015 | 0.014 | |
| Model Summary | |||||
| Effect Index | Intraclass Correlation (ICC) | 10.02% | 3.94% | 13.91% | 10.45% |
| Model Fit Index | Deviance Statistic (−2 log likelihood) | 49667.366 | 49718.844 | 29287.455 | 29341.146 |
| Akaike’s Information Criterion (AIC) | 49671.366 | 49722.844 | 29311.455 | 29365.146 | |
| Schwarz’s Bayesian Criterion(BIC) | 49687.510 | 49738.989 | 29403.858 | 29457.540 | |
| 2009 (Pre-Fukushima) | 2010 (Pre-Fukushima) | 2011 (Post-Fukushima) | 2012 (Post-Fukushima) | |||||||||||||
|---|---|---|---|---|---|---|---|---|---|---|---|---|---|---|---|---|
| 1 | 2 | 3 | 4 | 1 | 2 | 3 | 4 | 1 | 2 | 3 | 4 | 1 | 2 | 3 | 4 | |
| EU Total | 28.8 | 23.6 | 28.1 | 19.5 | 27.5 | 23.8 | 27.6 | 21.1 | 28.3 | 22.4 | 27.7 | 21.6 | 29.8 | 18.8 | 27.0 | 24.4 |
| POL | 89.8 | 4.0 | 0.0 | 6.1 | 88.6 | 4.1 | 0.0 | 7.3 | 87.0 | 4.6 | 0.0 | 8.3 | 84.3 | 5.0 | 0.0 | 10.7 |
| EST | 88.5 | 5.7 | 0.0 | 5.7 | 86.8 | 5.4 | 0.0 | 7.8 | 85.3 | 5.4 | 0.0 | 9.3 | 82.5 | 5.0 | 0.0 | 12.5 |
| BGR | 49.8 | 4.7 | 35.6 | 10.0 | 49.4 | 4.3 | 32.6 | 13.7 | 54.8 | 4.2 | 32.3 | 8.7 | 48.7 | 5.1 | 33.3 | 12.9 |
| UK | 29.1 | 44.8 | 18.4 | 7.7 | 29.7 | 46.4 | 16.4 | 7.6 | 30.6 | 40.3 | 18.9 | 10.3 | 40.4 | 27.9 | 19.4 | 12.2 |
| SWE | 1.4 | 1.4 | 38.4 | 58.8 | 2.4 | 2.6 | 39.2 | 55.8 | 1.4 | 1.5 | 40.6 | 56.5 | 0.9 | 0.8 | 38.7 | 59.6 |
| NLD | 23.1 | 63.5 | 3.8 | 9.7 | 20.5 | 66.4 | 3.4 | 9.6 | 20.6 | 64.6 | 3.7 | 11.1 | 25.2 | 58.5 | 3.9 | 12.4 |
| HUN | 19.3 | 29.4 | 43.1 | 8.1 | 18.0 | 31.5 | 42.5 | 8.1 | 18.4 | 30.2 | 43.9 | 7.5 | 18.9 | 27.6 | 45.9 | 7.6 |
| CZE | 56.1 | 4.5 | 33.0 | 6.3 | 55.1 | 4.8 | 32.6 | 7.6 | 54.0 | 4.6 | 32.4 | 9.0 | 50.9 | 4.5 | 34.6 | 10.1 |
| MLT | 100.0 | 0.0 | 0.0 | 0.0 | 100.0 | 0.0 | 0.0 | 0.0 | 100.0 | 0.0 | 0.0 | 0.0 | 100.0 | 0.0 | 0.0 | 0.0 |
| ROU | 39.1 | 13.3 | 20.3 | 27.2 | 35.3 | 12.0 | 19.1 | 33.5 | 41.2 | 13.5 | 18.8 | 26.5 | 40.1 | 14.7 | 19.5 | 25.7 |
| SVK | 17.2 | 9.2 | 54.0 | 19.5 | 15.1 | 9.7 | 52.5 | 22.7 | 14.7 | 12.6 | 53.8 | 18.9 | 13.7 | 11.6 | 54.4 | 20.4 |
| ITA | 22.6 | 52.0 | 0.0 | 25.4 | 20.5 | 52.6 | 0.0 | 26.8 | 21.6 | 50.1 | 0.0 | 28.3 | 23.0 | 45.2 | 0.0 | 31.8 |
| FIN | 26.5 | 13.6 | 31.1 | 28.7 | 26.6 | 14.7 | 28.5 | 30.2 | 21.4 | 13.7 | 31.8 | 33.2 | 15.9 | 10.3 | 33.0 | 40.8 |
| IRL | 26.5 | 57.6 | 0.0 | 15.9 | 24.5 | 61.9 | 0.0 | 13.6 | 25.9 | 54.4 | 0.0 | 19.7 | 30.2 | 49.8 | 0.0 | 20.0 |
| LAT | 0.0 | 35.7 | 0.0 | 64.3 | 0.0 | 45.5 | 0.0 | 54.5 | 0.0 | 56.3 | 0.0 | 43.7 | 0.0 | 33.9 | 0.0 | 66.1 |
| DNK | 56.3 | 20.1 | 0.0 | 23.7 | 46.6 | 20.7 | 0.0 | 32.7 | 42.0 | 16.8 | 0.0 | 41.2 | 36.7 | 14.0 | 0.0 | 49.3 |
| LTU | 4.6 | 13.9 | 72.2 | 9.3 | 10.9 | 58.2 | 0.0 | 30.9 | 4.3 | 58.7 | 0.0 | 37.0 | 4.2 | 60.4 | 0.0 | 35.4 |
| SVN | 31.3 | 3.7 | 35.0 | 30.1 | 32.3 | 3.0 | 34.8 | 29.9 | 33.1 | 3.1 | 38.8 | 25.0 | 32.7 | 3.2 | 35.3 | 28.8 |
| CYP | 100.0 | 0.0 | 0.0 | 0.0 | 100.0 | 0.0 | 0.0 | 0.0 | 96.0 | 0.0 | 0.0 | 4.0 | 93.8 | 0.0 | 0.0 | 6.3 |
| FRA | 4.9 | 4.9 | 76.3 | 13.9 | 5.2 | 4.7 | 75.6 | 14.6 | 3.1 | 5.2 | 79.2 | 12.4 | 4.1 | 4.4 | 75.8 | 15.7 |
| BEL | 6.1 | 33.7 | 52.5 | 7.7 | 4.9 | 35.5 | 51.2 | 8.4 | 4.1 | 30.9 | 54.3 | 10.8 | 4.3 | 31.5 | 49.6 | 14.5 |
| LUX | 0.0 | 0.0 | 0.0 | 100.0 | 0.0 | 0.0 | 0.0 | 100.0 | 0.0 | 63.9 | 0.0 | 36.1 | 0.0 | 63.2 | 0.0 | 36.8 |
| ESP | 18.8 | 37.1 | 18.0 | 26.2 | 13.9 | 32.3 | 20.5 | 33.3 | 20.0 | 29.6 | 19.7 | 30.7 | 23.7 | 25.0 | 20.7 | 30.5 |
| PRT | 32.5 | 29.5 | 0.0 | 38.1 | 18.8 | 27.7 | 0.0 | 53.5 | 24.0 | 28.6 | 0.0 | 47.4 | 33.0 | 23.1 | 0.0 | 44.0 |
| DEU | 44.9 | 14.6 | 23.2 | 17.2 | 43.8 | 15.6 | 22.7 | 17.8 | 44.6 | 16.1 | 17.9 | 21.4 | 45.8 | 14.1 | 16.0 | 24.1 |
| GRC | 68.2 | 17.9 | 0.0 | 13.8 | 64.5 | 17.1 | 0.0 | 18.4 | 62.4 | 23.4 | 0.0 | 14.2 | 61.1 | 22.0 | 0.0 | 16.9 |
| AUT | 7.1 | 19.8 | 0.0 | 73.0 | 8.8 | 22.8 | 0.0 | 68.4 | 9.8 | 22.0 | 0.0 | 68.2 | 7.1 | 16.0 | 0.0 | 76.8 |
| Country | Before Fukushima | After Fukushima | ||||
|---|---|---|---|---|---|---|
| Favorable (1) | Unfavorable (2) | Net Favor (1–2) | Favorable (1) | Unfavorable (2) | Net Favor (1–2) | |
| Bulgaria | 68 | 16 | 52 | 62 | 23 | 39 |
| Czech | 63 | 31 | 32 | 61 | 34 | 27 |
| France | 66 | 33 | 34 | 58 | 41 | 17 |
| Switzerland | 40 | 56 | 16 | 47 | 44 | 3 |
| Austria | 13 | 87 | −74 | 9 | 90 | −81 |
| Italy | 28 | 71 | −43 | 24 | 75 | −51 |
| Germany | 34 | 64 | −30 | 26 | 72 | −46 |
| Poland | 36 | 41 | −5 | 30 | 50 | −20 |
| Netherlands | 51 | 43 | 8 | 44 | 50 | −6 |
| Spain | 39 | 42 | −3 | 41 | 44 | −3 |
© 2018 by the authors. Licensee MDPI, Basel, Switzerland. This article is an open access article distributed under the terms and conditions of the Creative Commons Attribution (CC BY) license (http://creativecommons.org/licenses/by/4.0/).
Share and Cite
Wang, J.; Kim, S. Comparative Analysis of Public Attitudes toward Nuclear Power Energy across 27 European Countries by Applying the Multilevel Model. Sustainability 2018, 10, 1518. https://doi.org/10.3390/su10051518
Wang J, Kim S. Comparative Analysis of Public Attitudes toward Nuclear Power Energy across 27 European Countries by Applying the Multilevel Model. Sustainability. 2018; 10(5):1518. https://doi.org/10.3390/su10051518
Chicago/Turabian StyleWang, Jaesun, and Seoyong Kim. 2018. "Comparative Analysis of Public Attitudes toward Nuclear Power Energy across 27 European Countries by Applying the Multilevel Model" Sustainability 10, no. 5: 1518. https://doi.org/10.3390/su10051518
APA StyleWang, J., & Kim, S. (2018). Comparative Analysis of Public Attitudes toward Nuclear Power Energy across 27 European Countries by Applying the Multilevel Model. Sustainability, 10(5), 1518. https://doi.org/10.3390/su10051518