5.1. Motivation of Group Selection
EU member states have set their major targets as the reduction of gross energy consumption by 2020, as in order to achieve the objectives of EU Directive [
2,
3], they should reduce final energy consumption by 20%. However, some countries have increased their consumption compared to 1995 (Croatia, Cyprus, Finland, Greece, Italy, and Portugal). The largest increase in final energy consumption was found in Malta and Lithuania. On the other hand, the share of final national energy consumption in the EU’s total energy consumption is different. For example, Germany has a share of about 20% in EU final energy consumption, while in Malta this value is only 0.04%. Thus, a 5% increase in FECRE in Germany contributes 1% growth at the EU level, while the same increase in Malta is insignificant (0.002%). This observation has led us to group EU countries according to the share of national energy consumption in total EU consumption. The average share of final energy consumption into final energy consumption of the EU over the period 1995–2016, ordered decreasingly is reported in
Table 10.
Group 1 contains the four EU members having the largest energy consumption with an average EU final energy consumption share of 56.38% (Germany—19.25%, France—13.43%, United Kindom—12.74%, and Italy—10.96%). This is due to the fact that these countries have a developed economy and a higher standard of living than most of the world’s states.
The second group of countries has a share of 3.2–7.3%, summing to 20.54% overall, and includes Spain, Poland, Netherland, and Belgium.
The third group comprises 9 countries with a share of 1–3%, accounting for 17.75% of the total energy consumed at the EU level.
The remaining 11 countries form the final group, with shares below 1%, accounting for 5.32% of the total energy consumed at the EU level.
The average shares of national FECRE in FEC (ratio) over the analyzed period for the 28 EU countries are given in
Table 11. Note that the values are no longer decreasing.
Concerning the FECRE share in FEC, the highest average can be found for countries in the Groups 3 and 4 (Latvia from the fourth group, 24.78%, Finland from the third group, 17.83%), while the countries from Groups 1 and 2 have average shares much lower than the EU average (UK from the first group, 1.78%, Nederland from the second group, 1.51%).
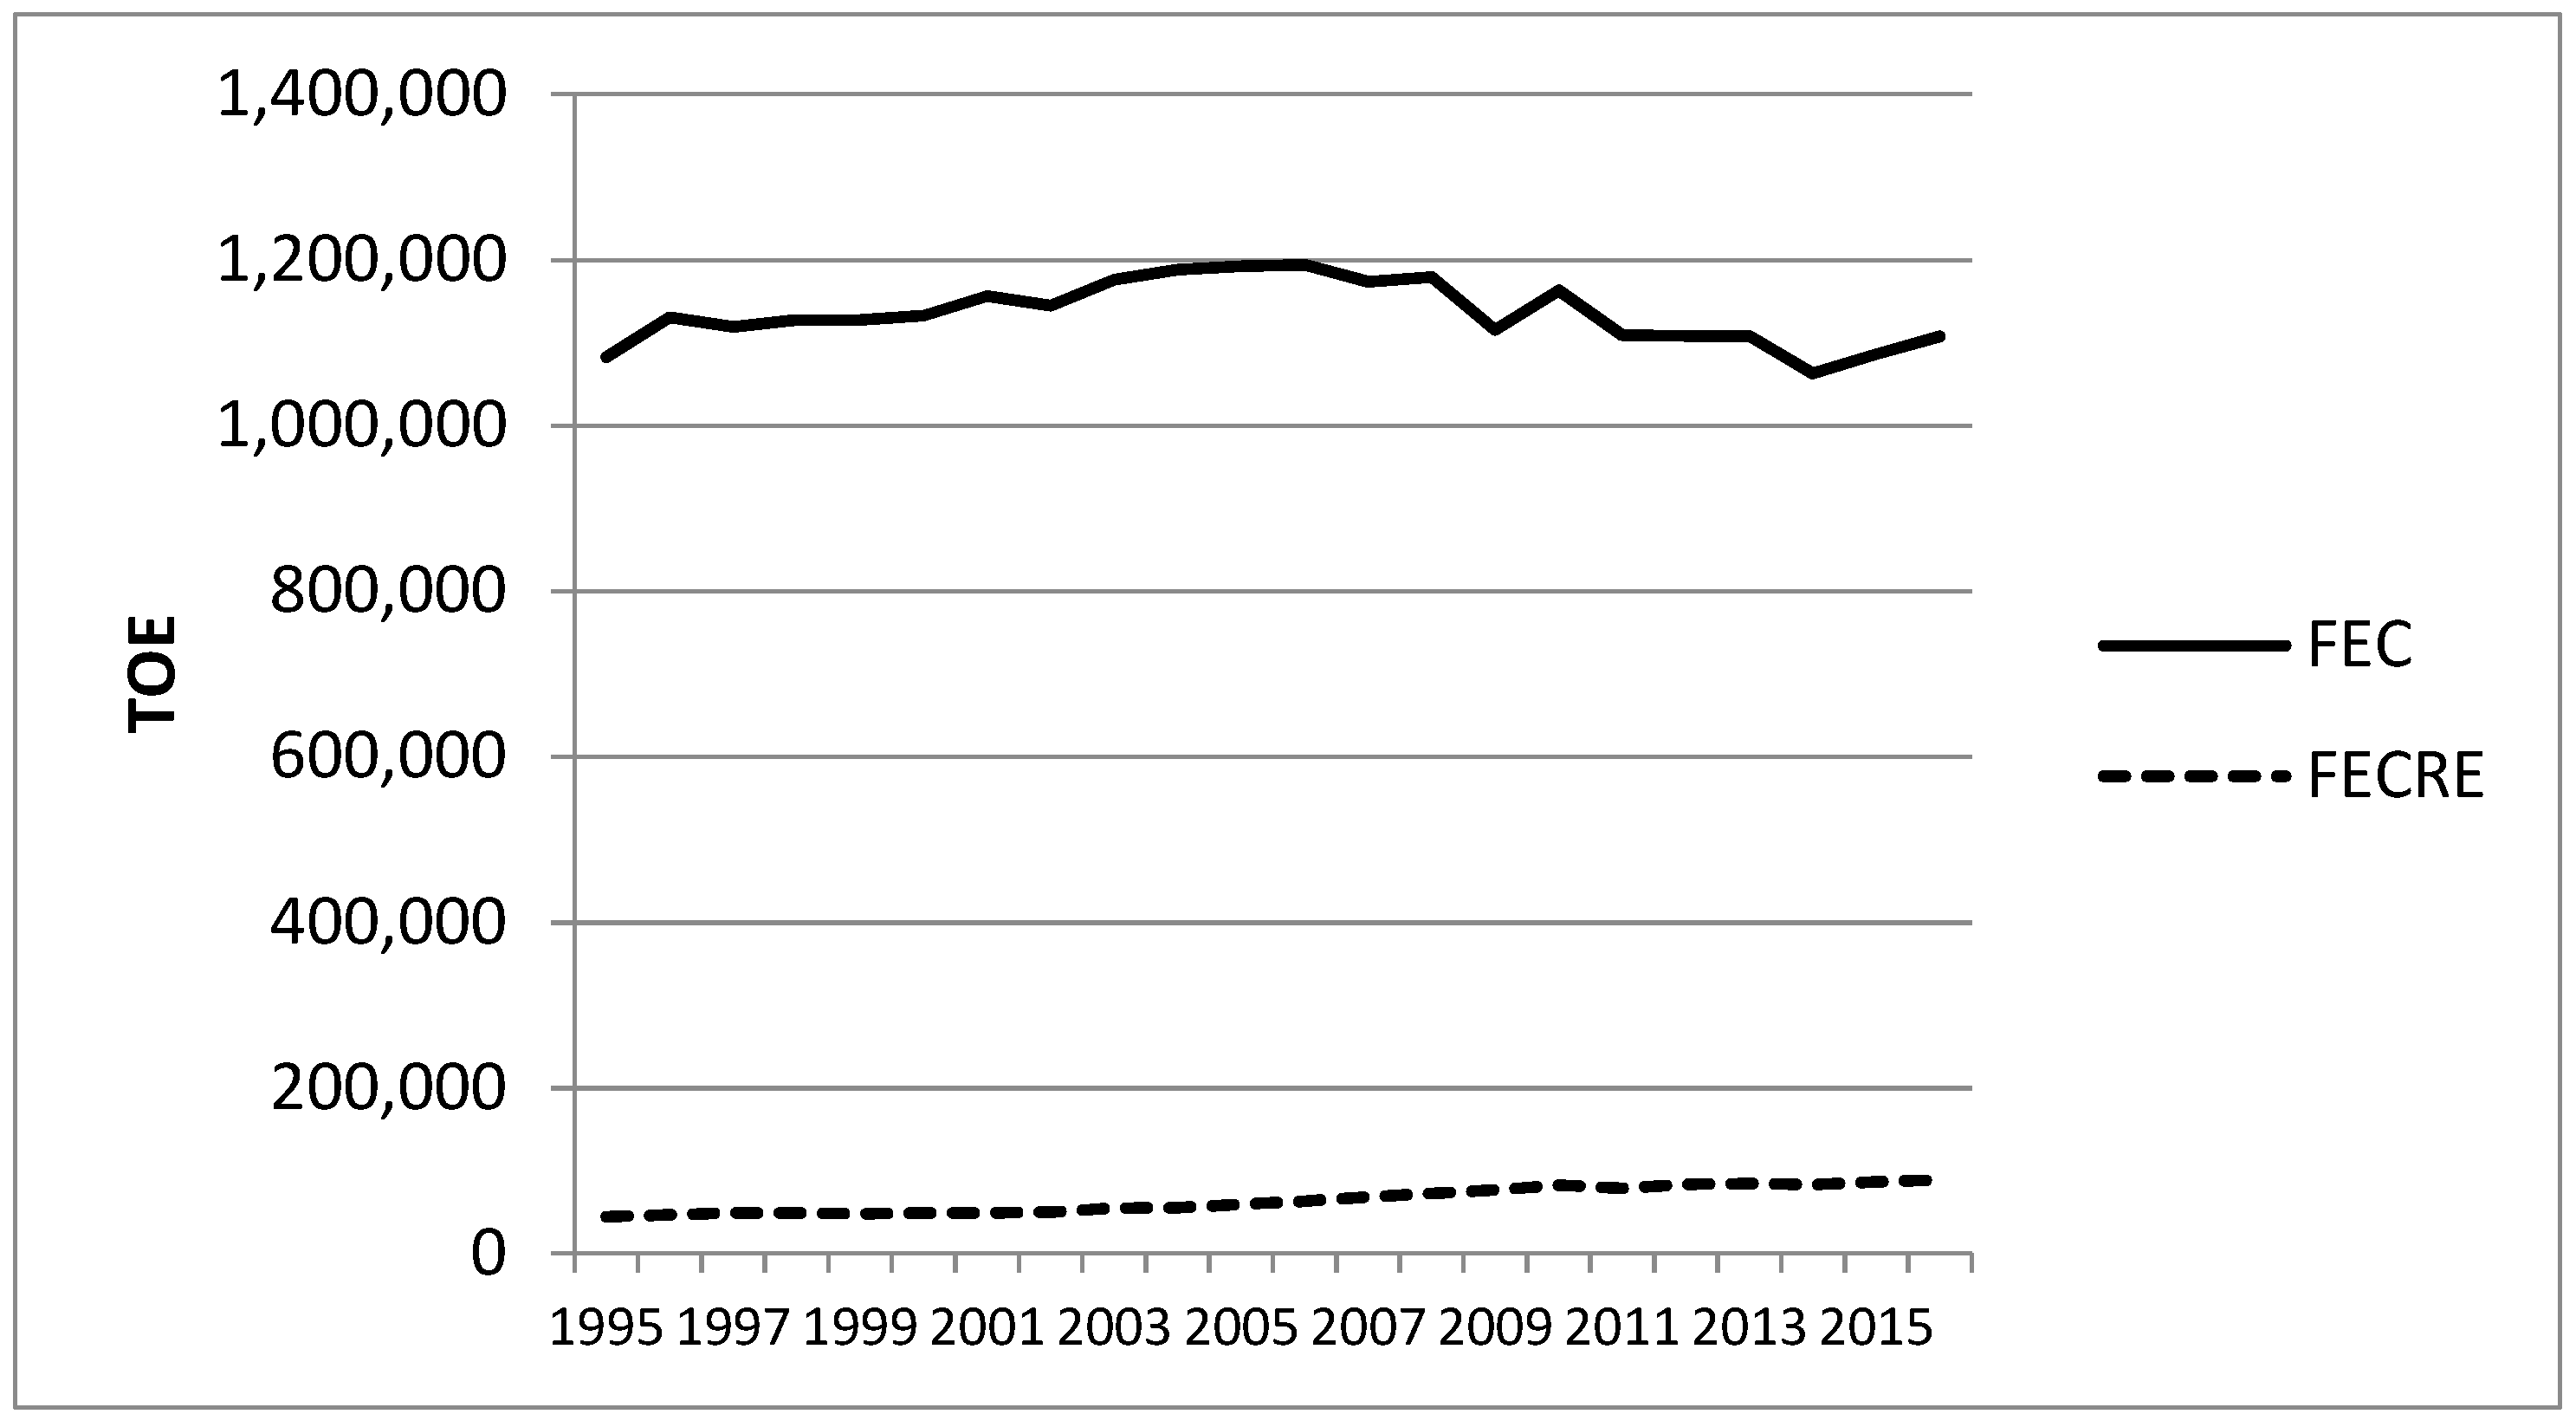
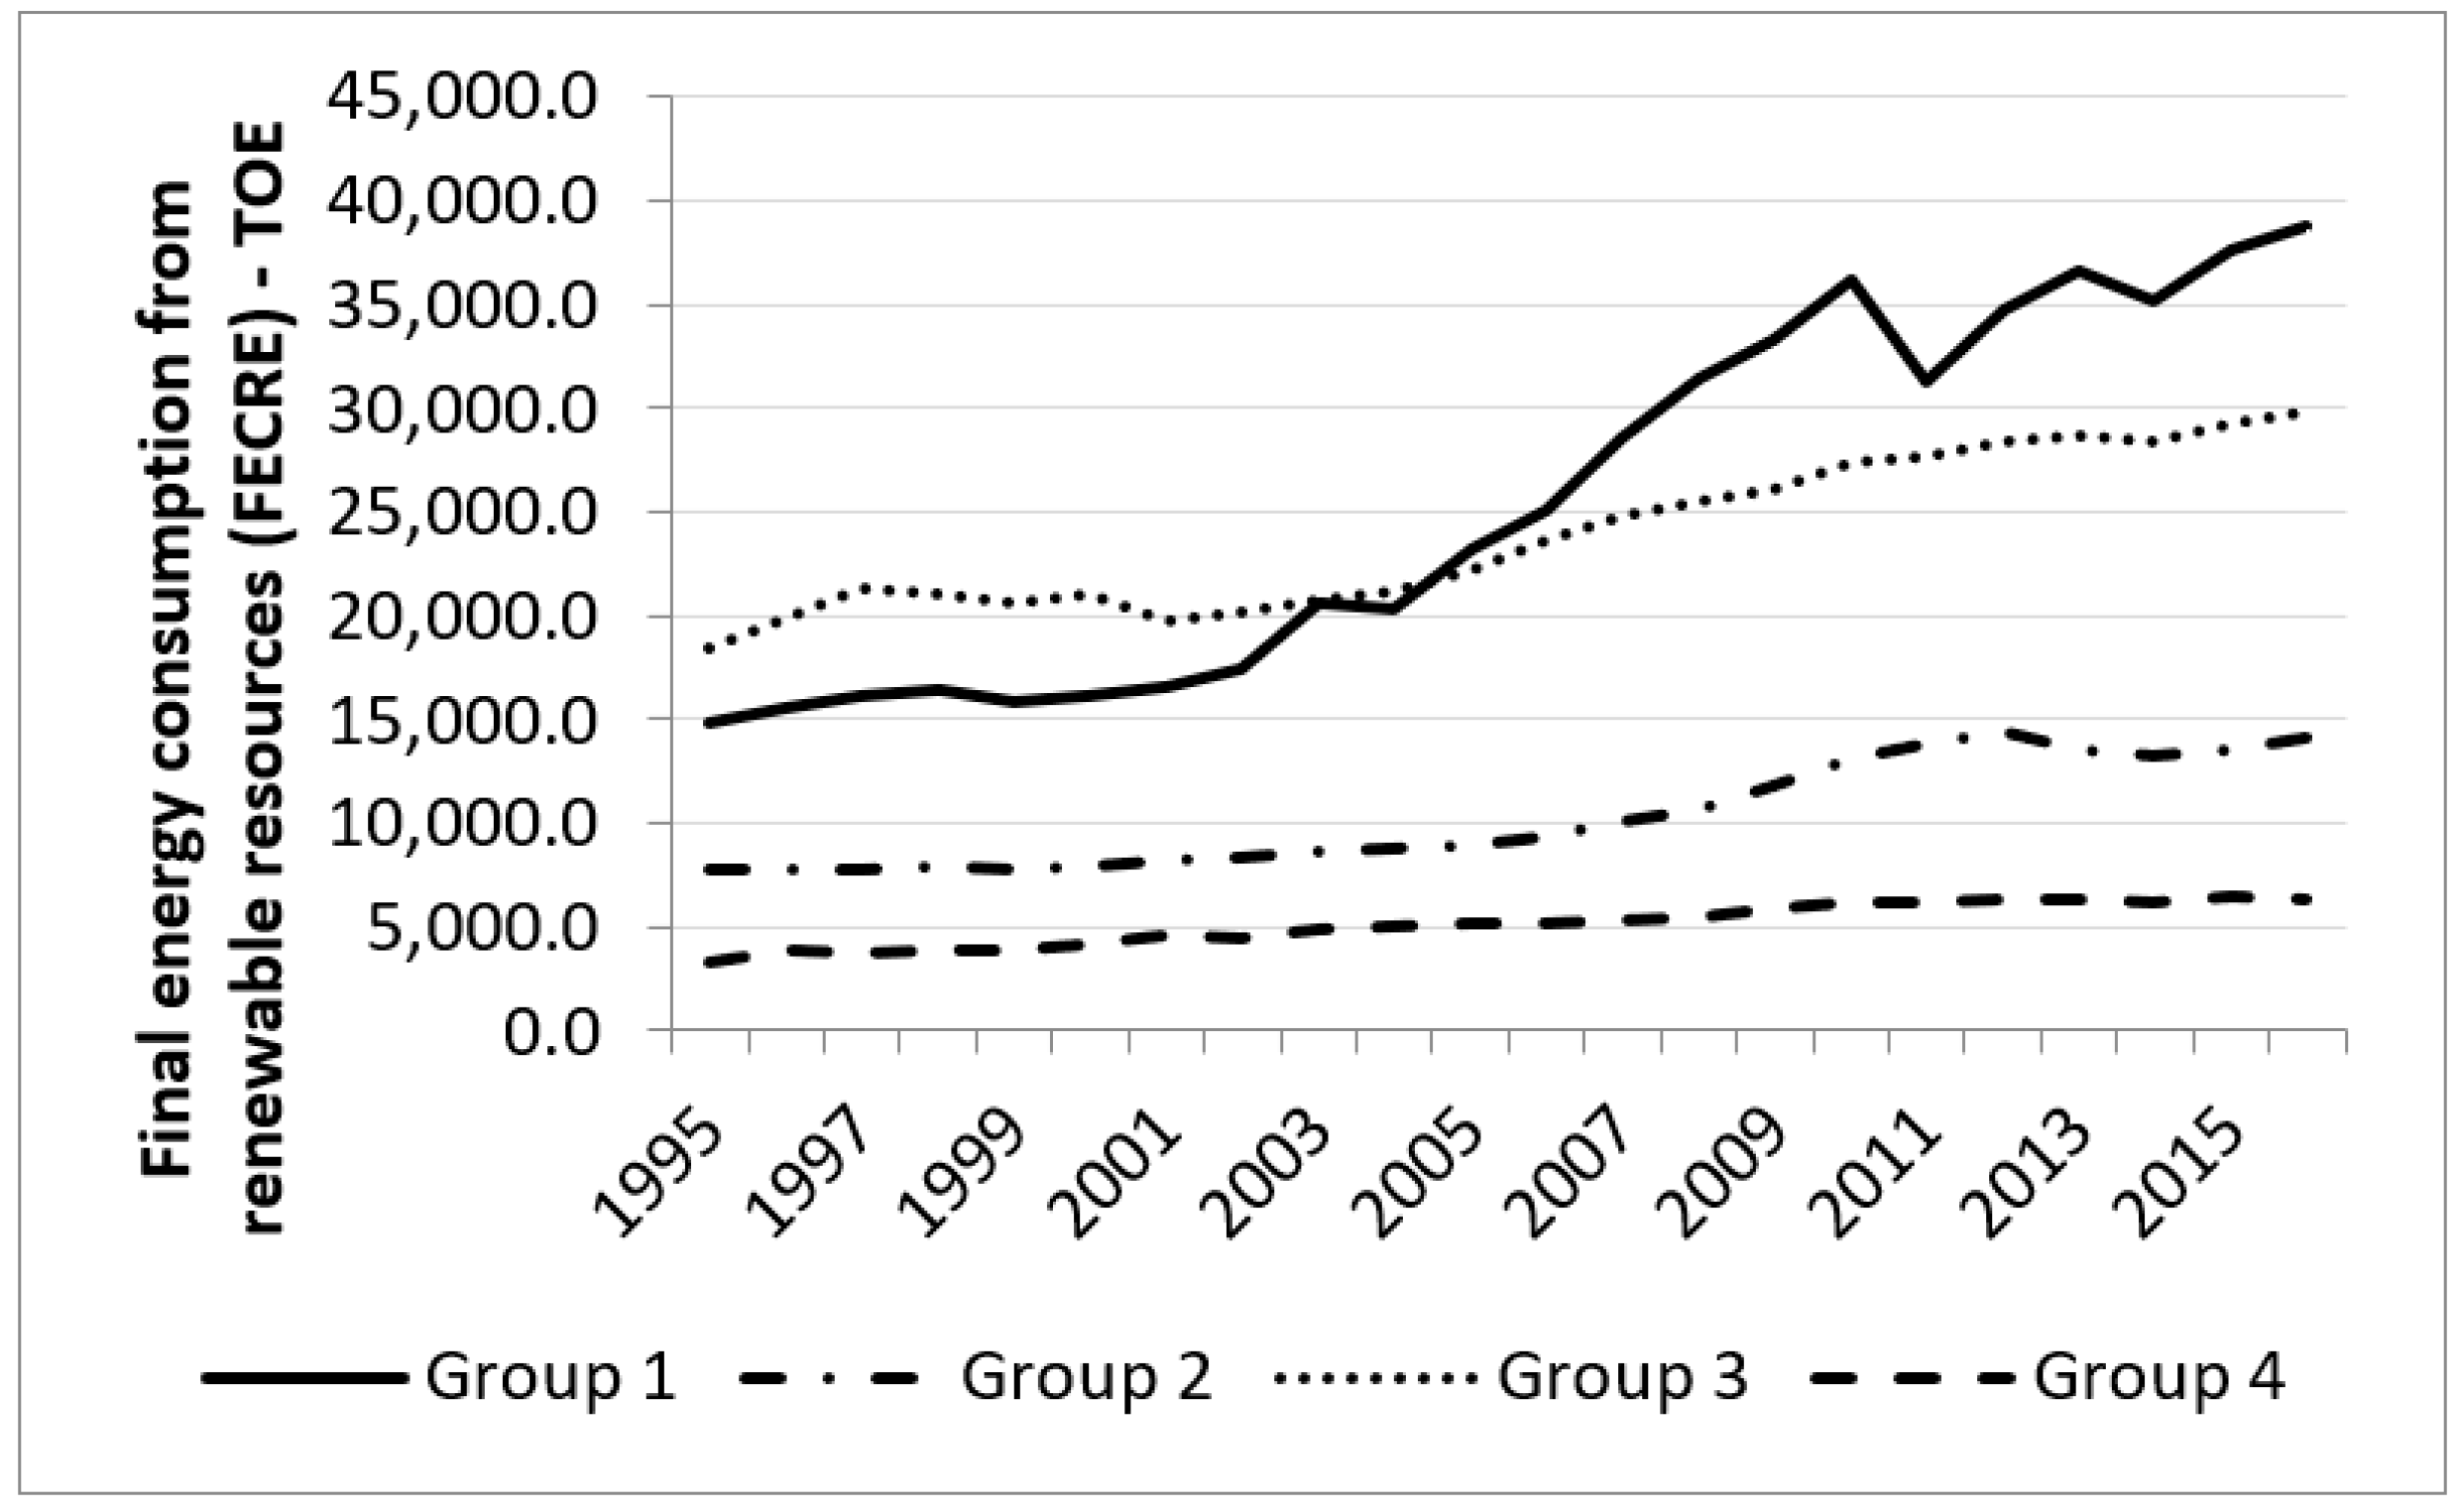
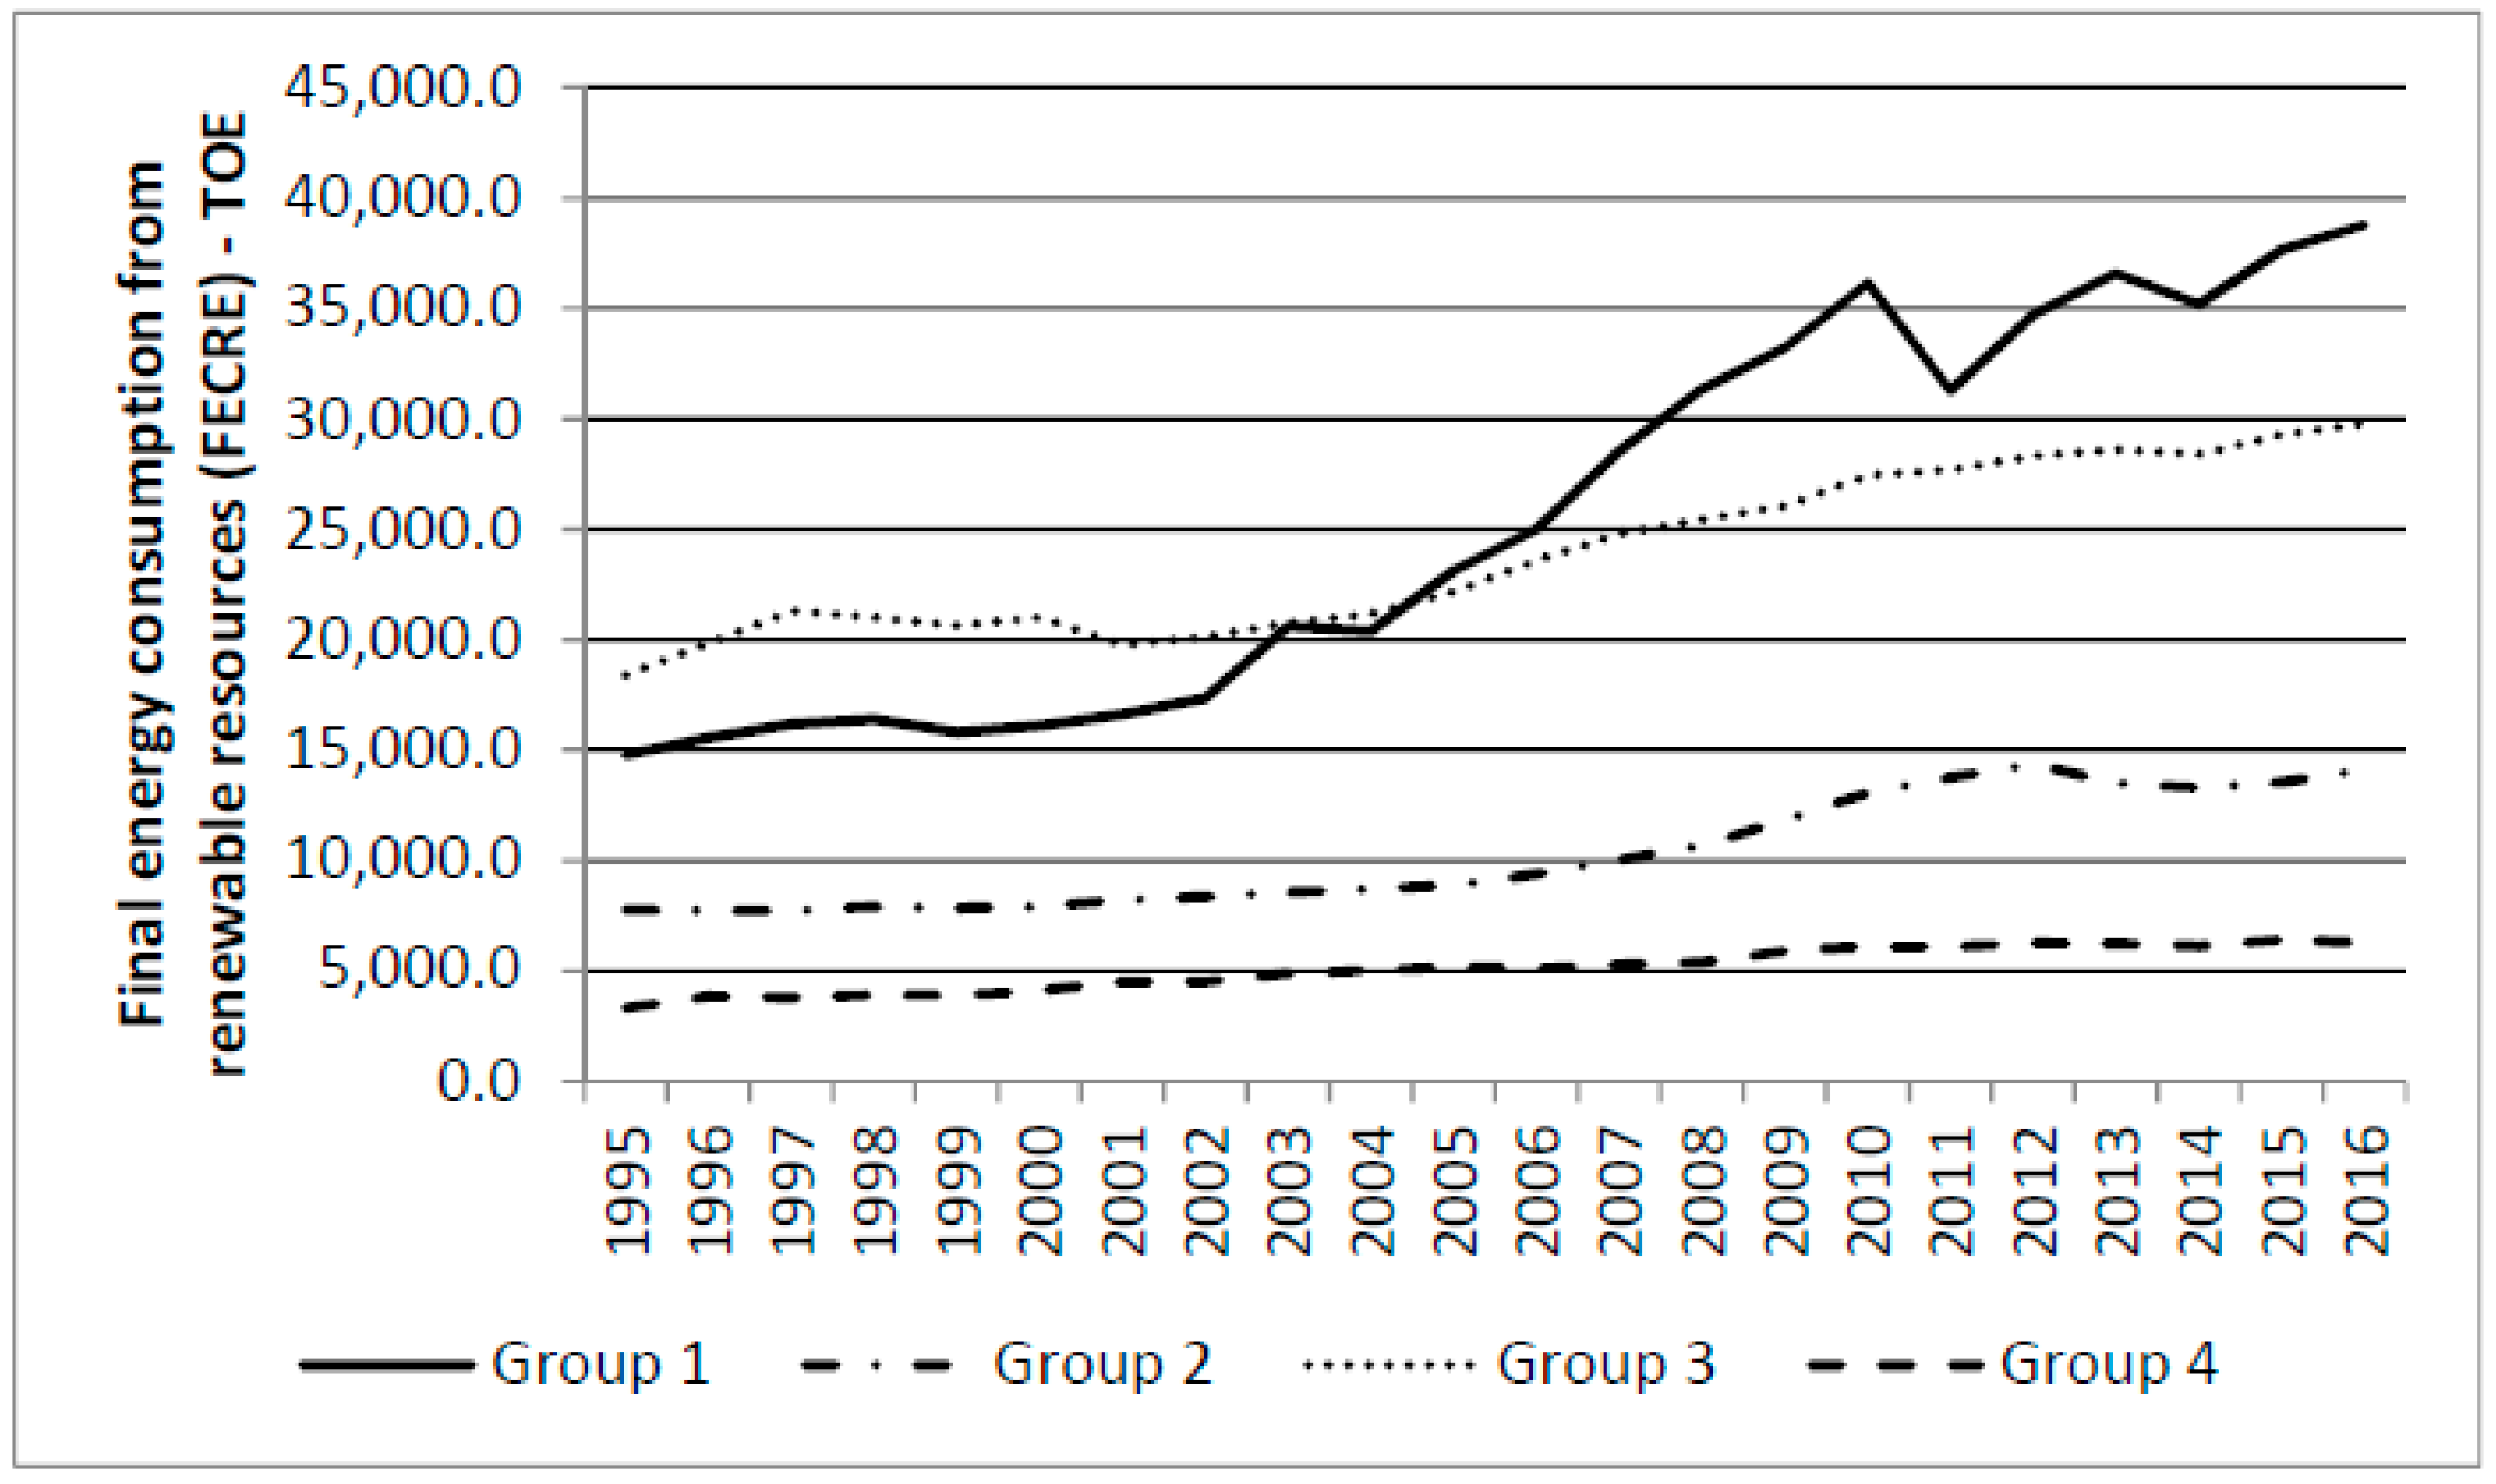
The time series of final energy consumption and final energy consumption from renewable sources are shown in
Figure 9 and
Figure 10, respectively.
According to the EU Directive [
2], by 2020, the final energy consumption should decrease by 20% from the 1995 level. It can be noted that Group 1 experienced a small decrease of 1.48%, while for the other three groups there are significant increases (of 10.8%, 2.97%, and 9.89%, respectively).
From
Figure 10, it is clear that the consumption of energy from renewable sources increased in all 4 groups, with a significant increase being recorded in the first group of countries (162.36% in 2016 compared to 1995), followed by the Group 4 countries with an increase of 88.81%, those in Group 2 by 81.08%, and those in Group 3 by 61.94%.
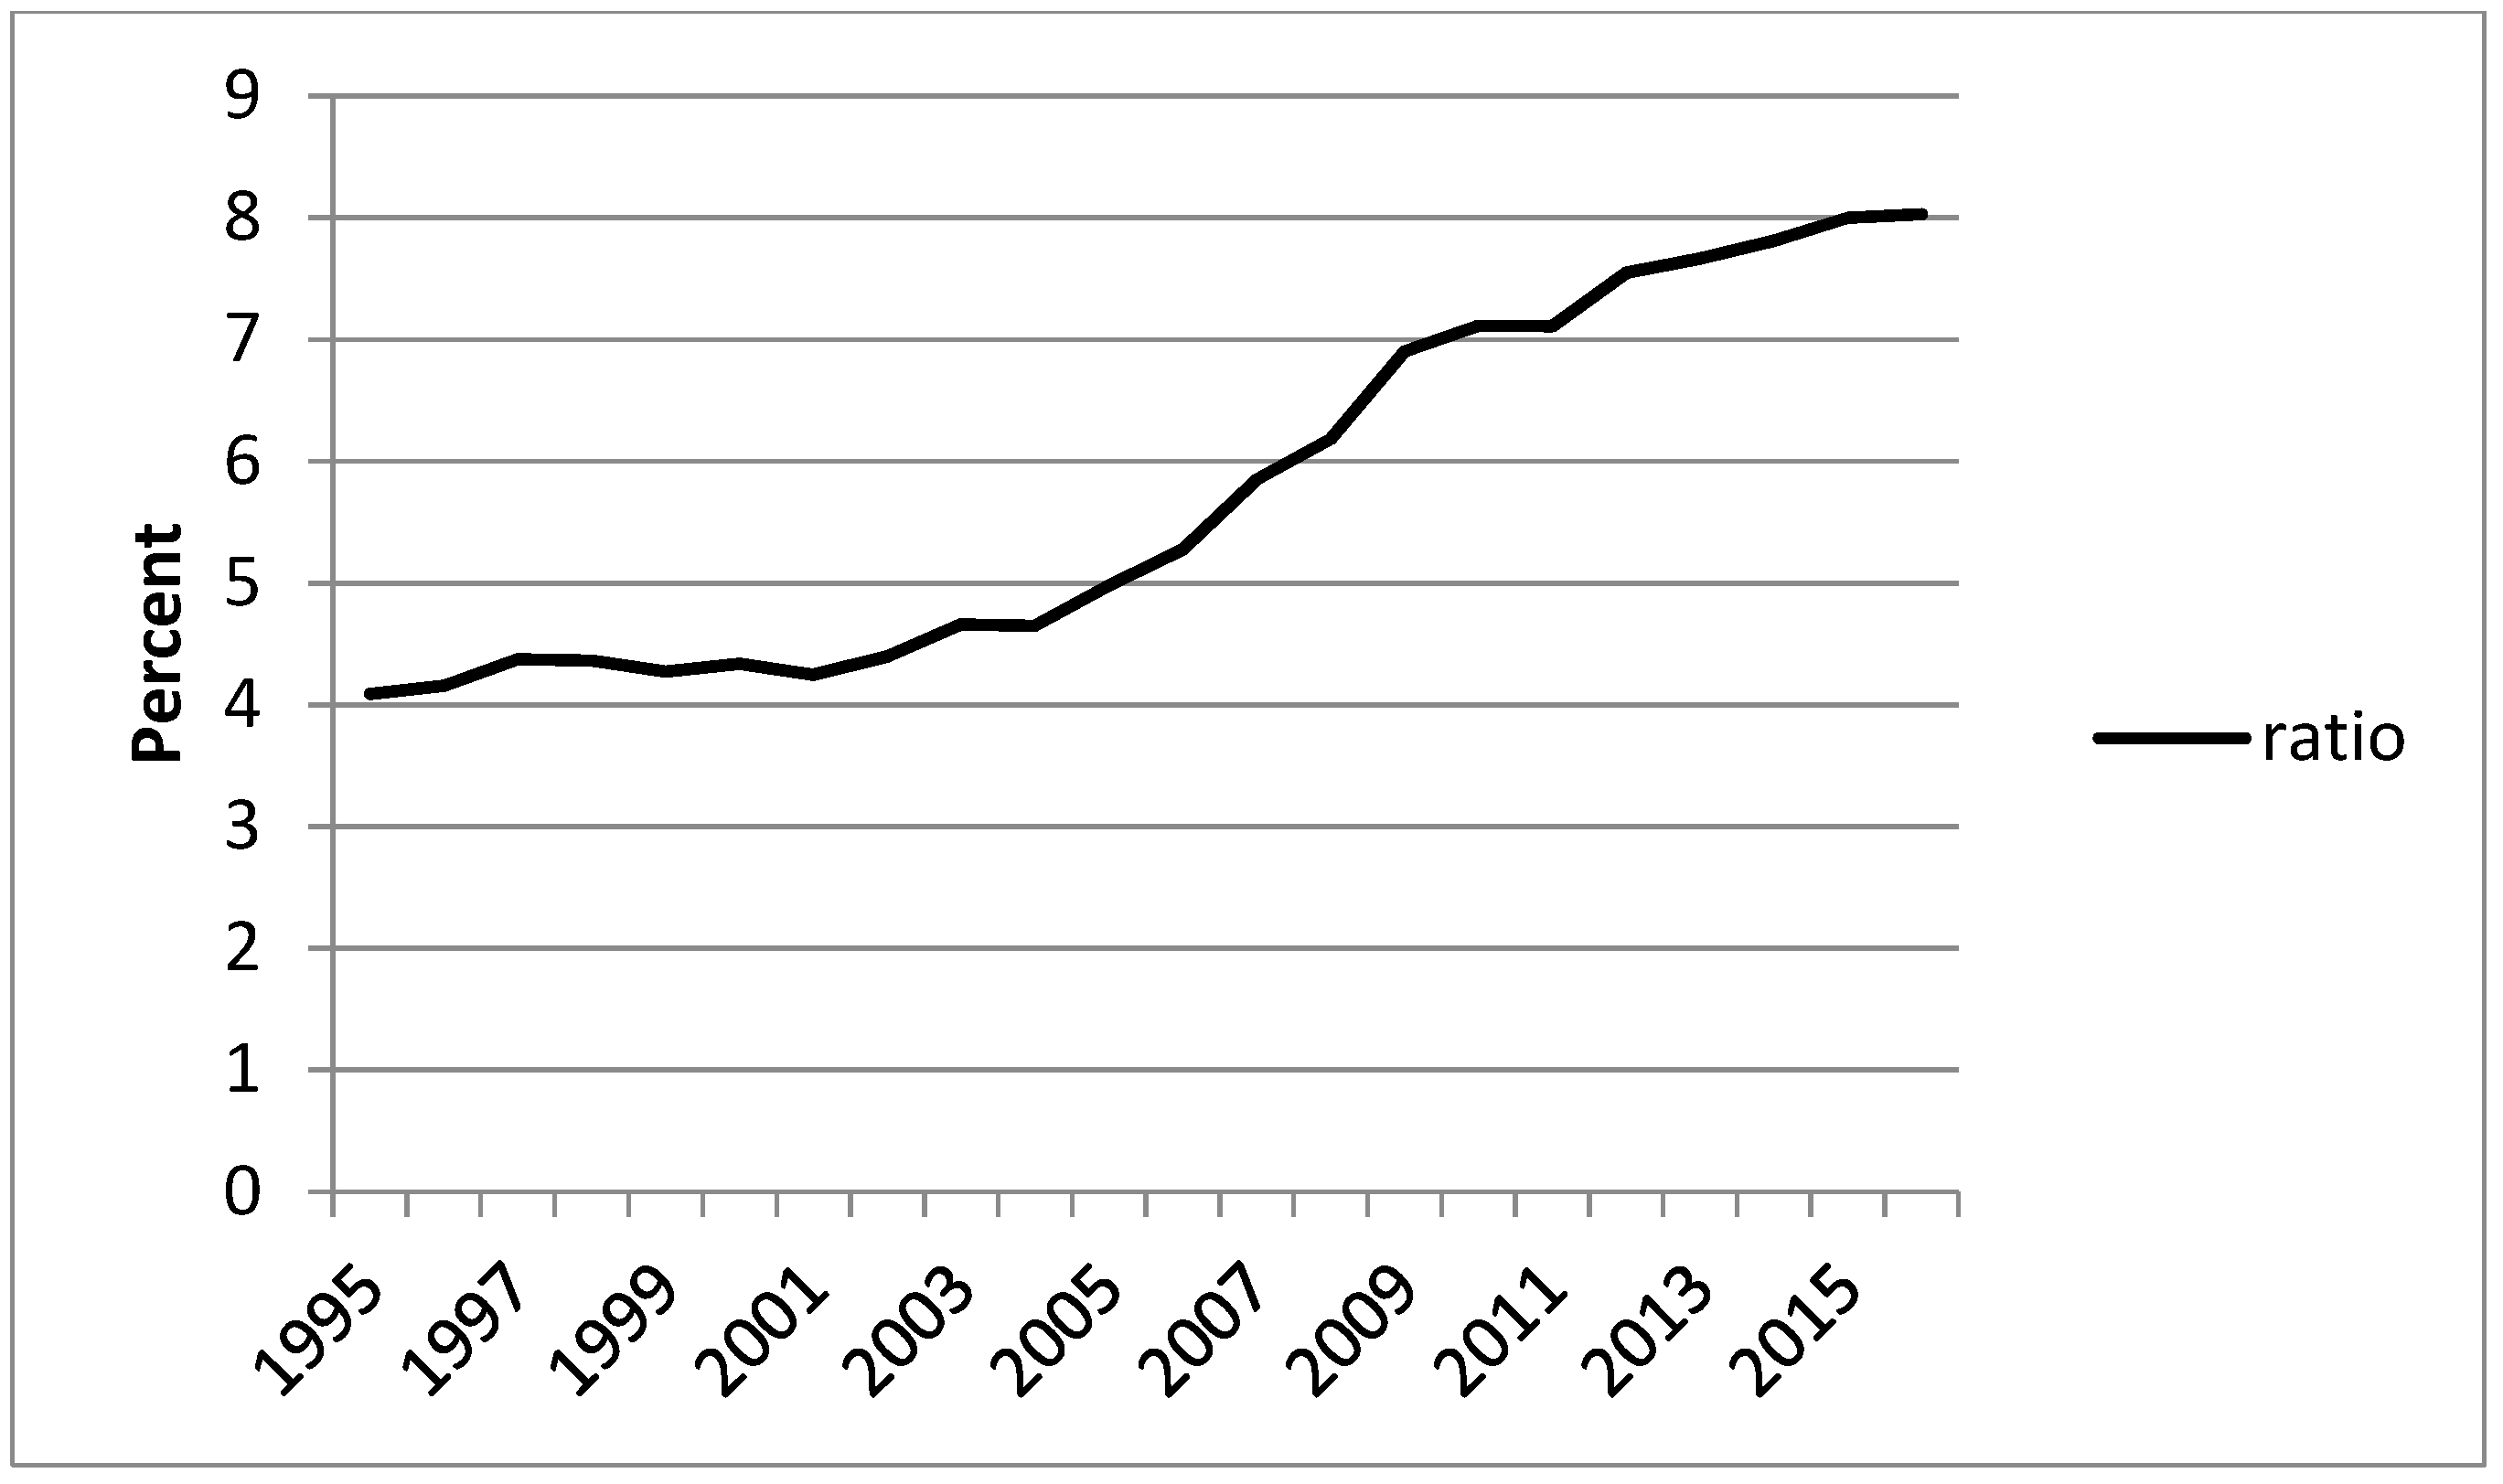
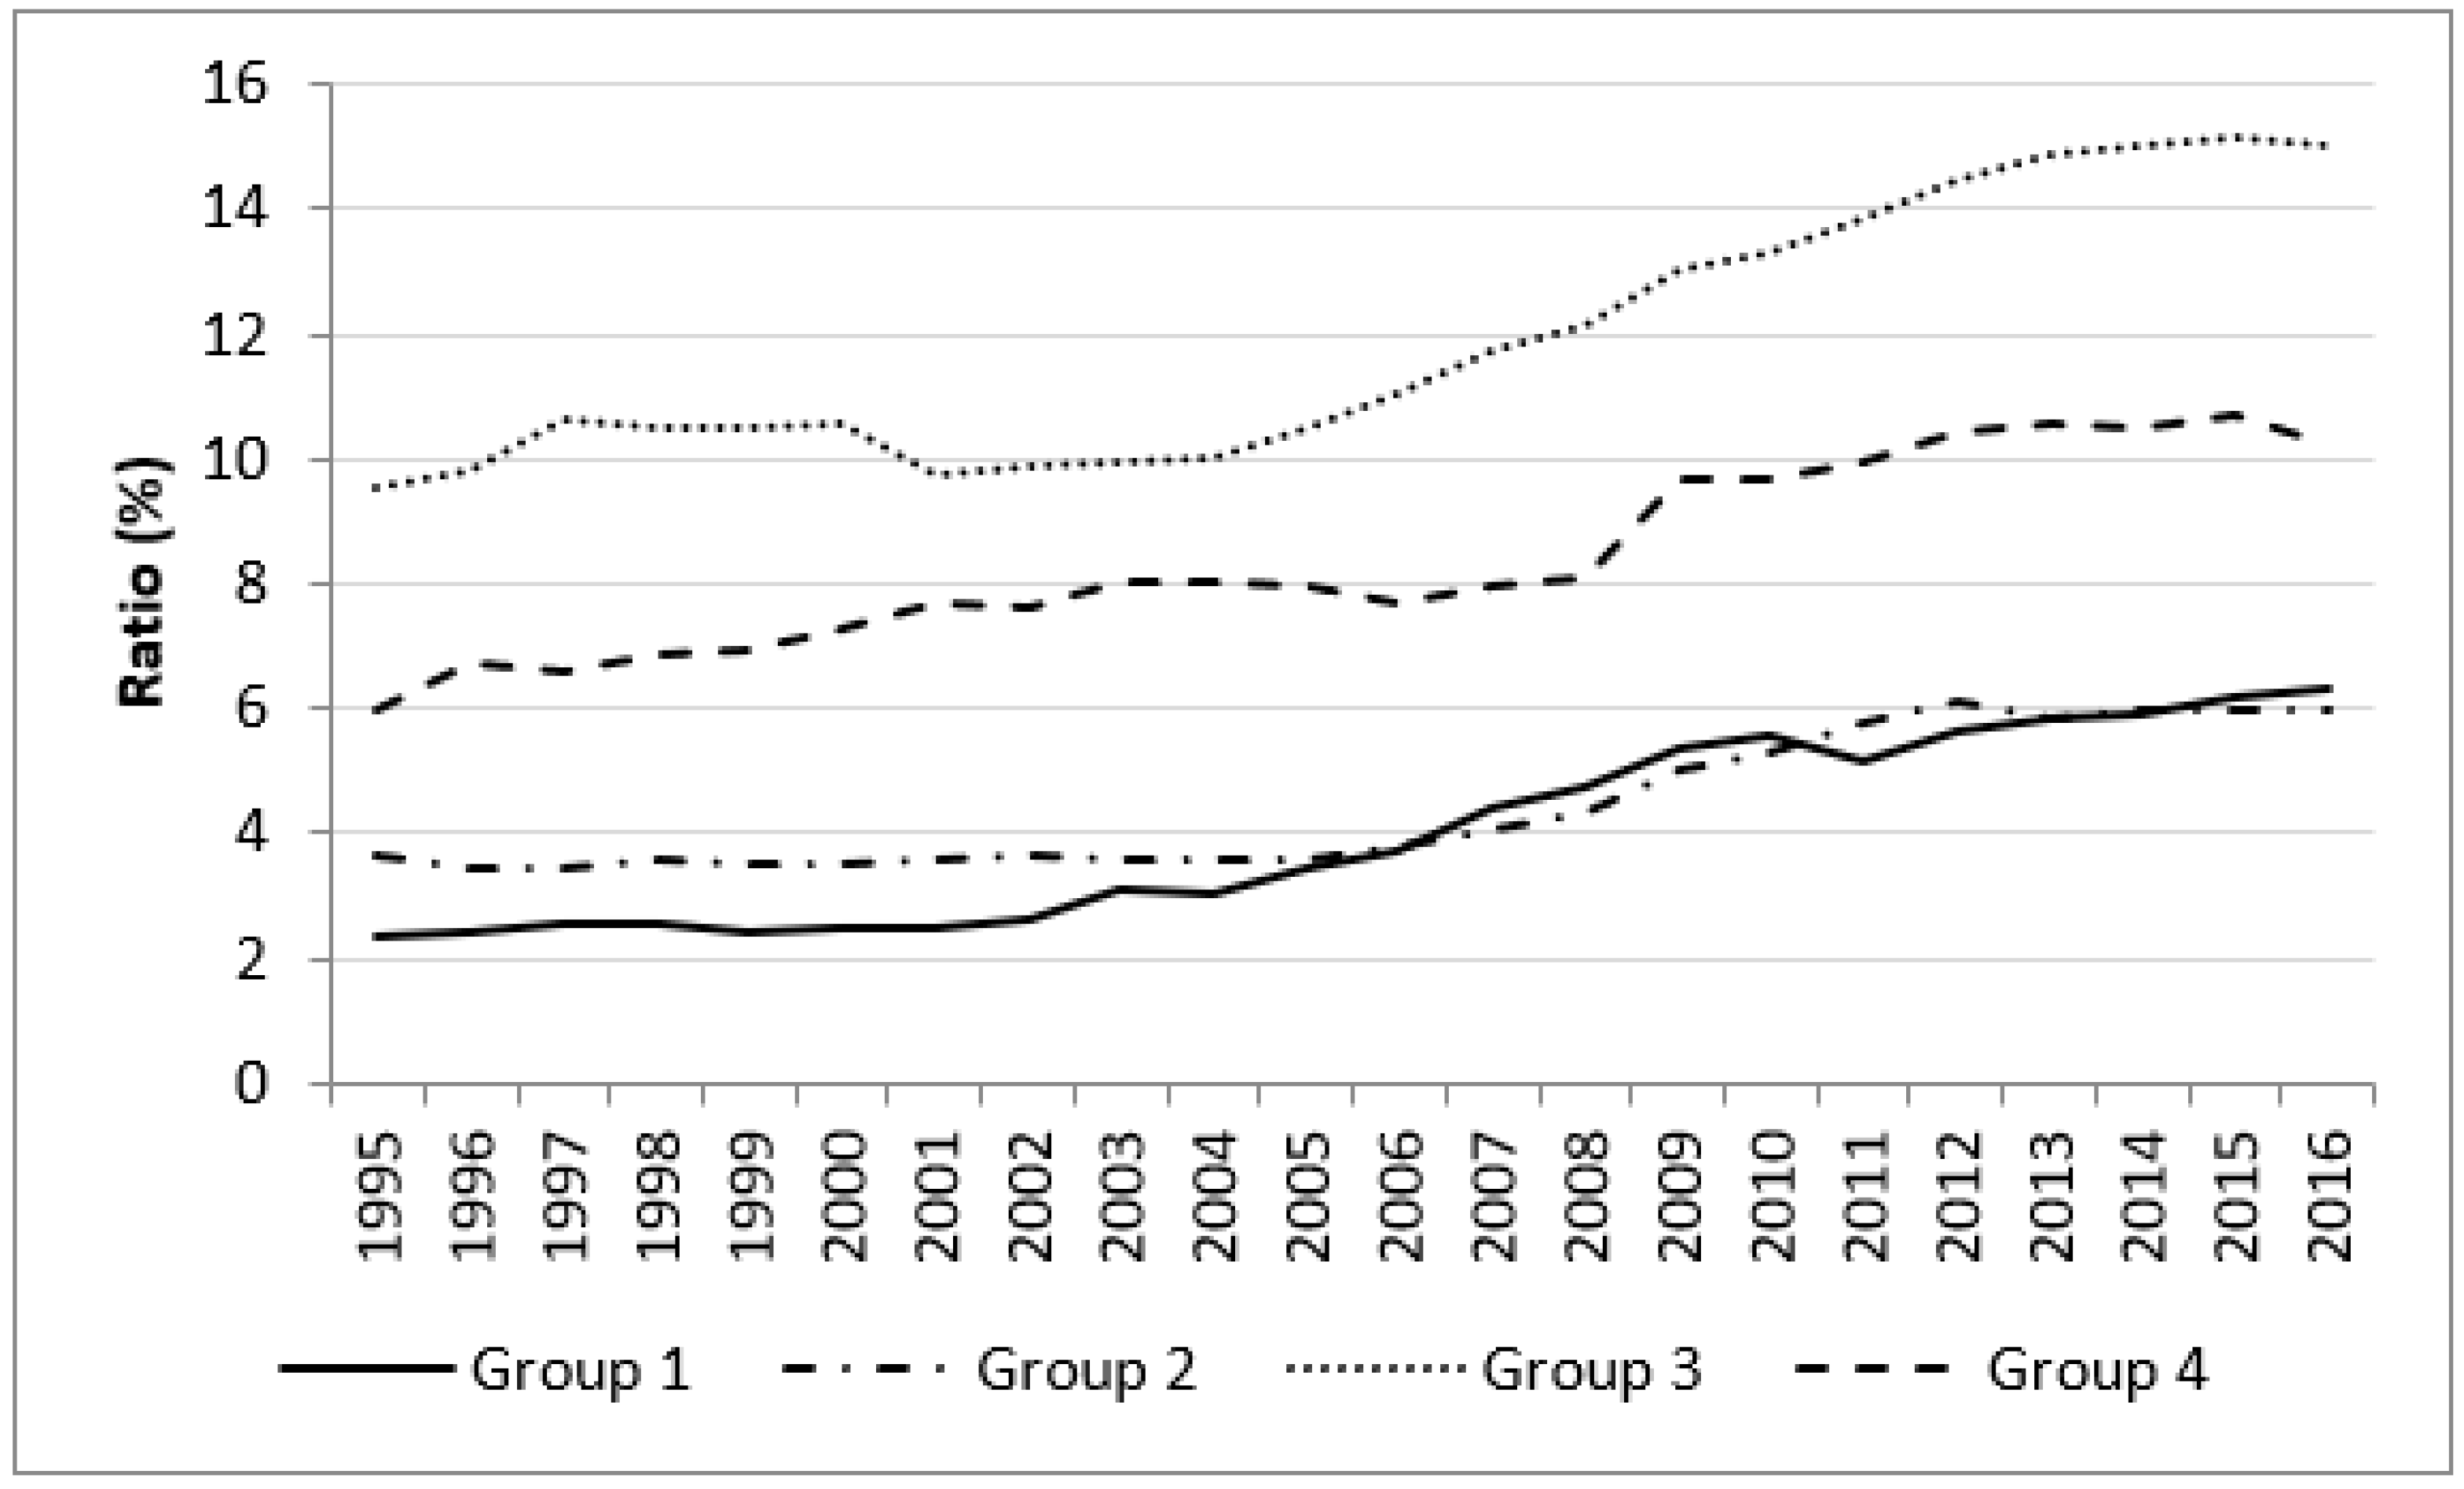
The evolution of the share of FECRE in FEC for the four focus groups over the analyzed period is represented in
Figure 11.
It is evident from
Figure 11 that the share of FECRE in FEC increased in 2016 compared to 1995 in the four groups of countries. Although the highest share increase rate was recorded by Group 1 (more than 2.5 times), the greatest share increase, in absolute values, corresponds to countries in the third group (which had a share of 9.56% in 1995 and reached 15.04% in 2016). This is also noted in
Table 12, where the average FECRE share in FEC for Group 3 is more than double the EU level. We observe that the third group of countries has a much higher average than the EU average, compared to the Groups 1 and 2 countries that are below the EU average.
The mean values of the percentage ratio in the four groups are given in
Table 12.
5.2. Empirical Estimations
In order to estimate the evolution of the ratio of FECRE and FEC for the four focus groups, we chose to use the linear and quadratic time regression models introduced in
Section 3, namely
for
.
The results of estimations obtained by LSM method in EViews, for Equation (6) are given in
Table 13 below.
All the coefficients of C and
t given in
Table 13 are statistically significant at the 1% significance level. Note that the increasing speed of the ratio in linear model (6) for EU, equal to 0.222, is almost equal to that of Group 1. This result is in good agreement with the weight of 56% in the final energy consumption of EU for this group. Compared to the result for EU, the increasing speed of the ratio is 24.05% bigger for Group 3 and 33% smaller for Group 2.
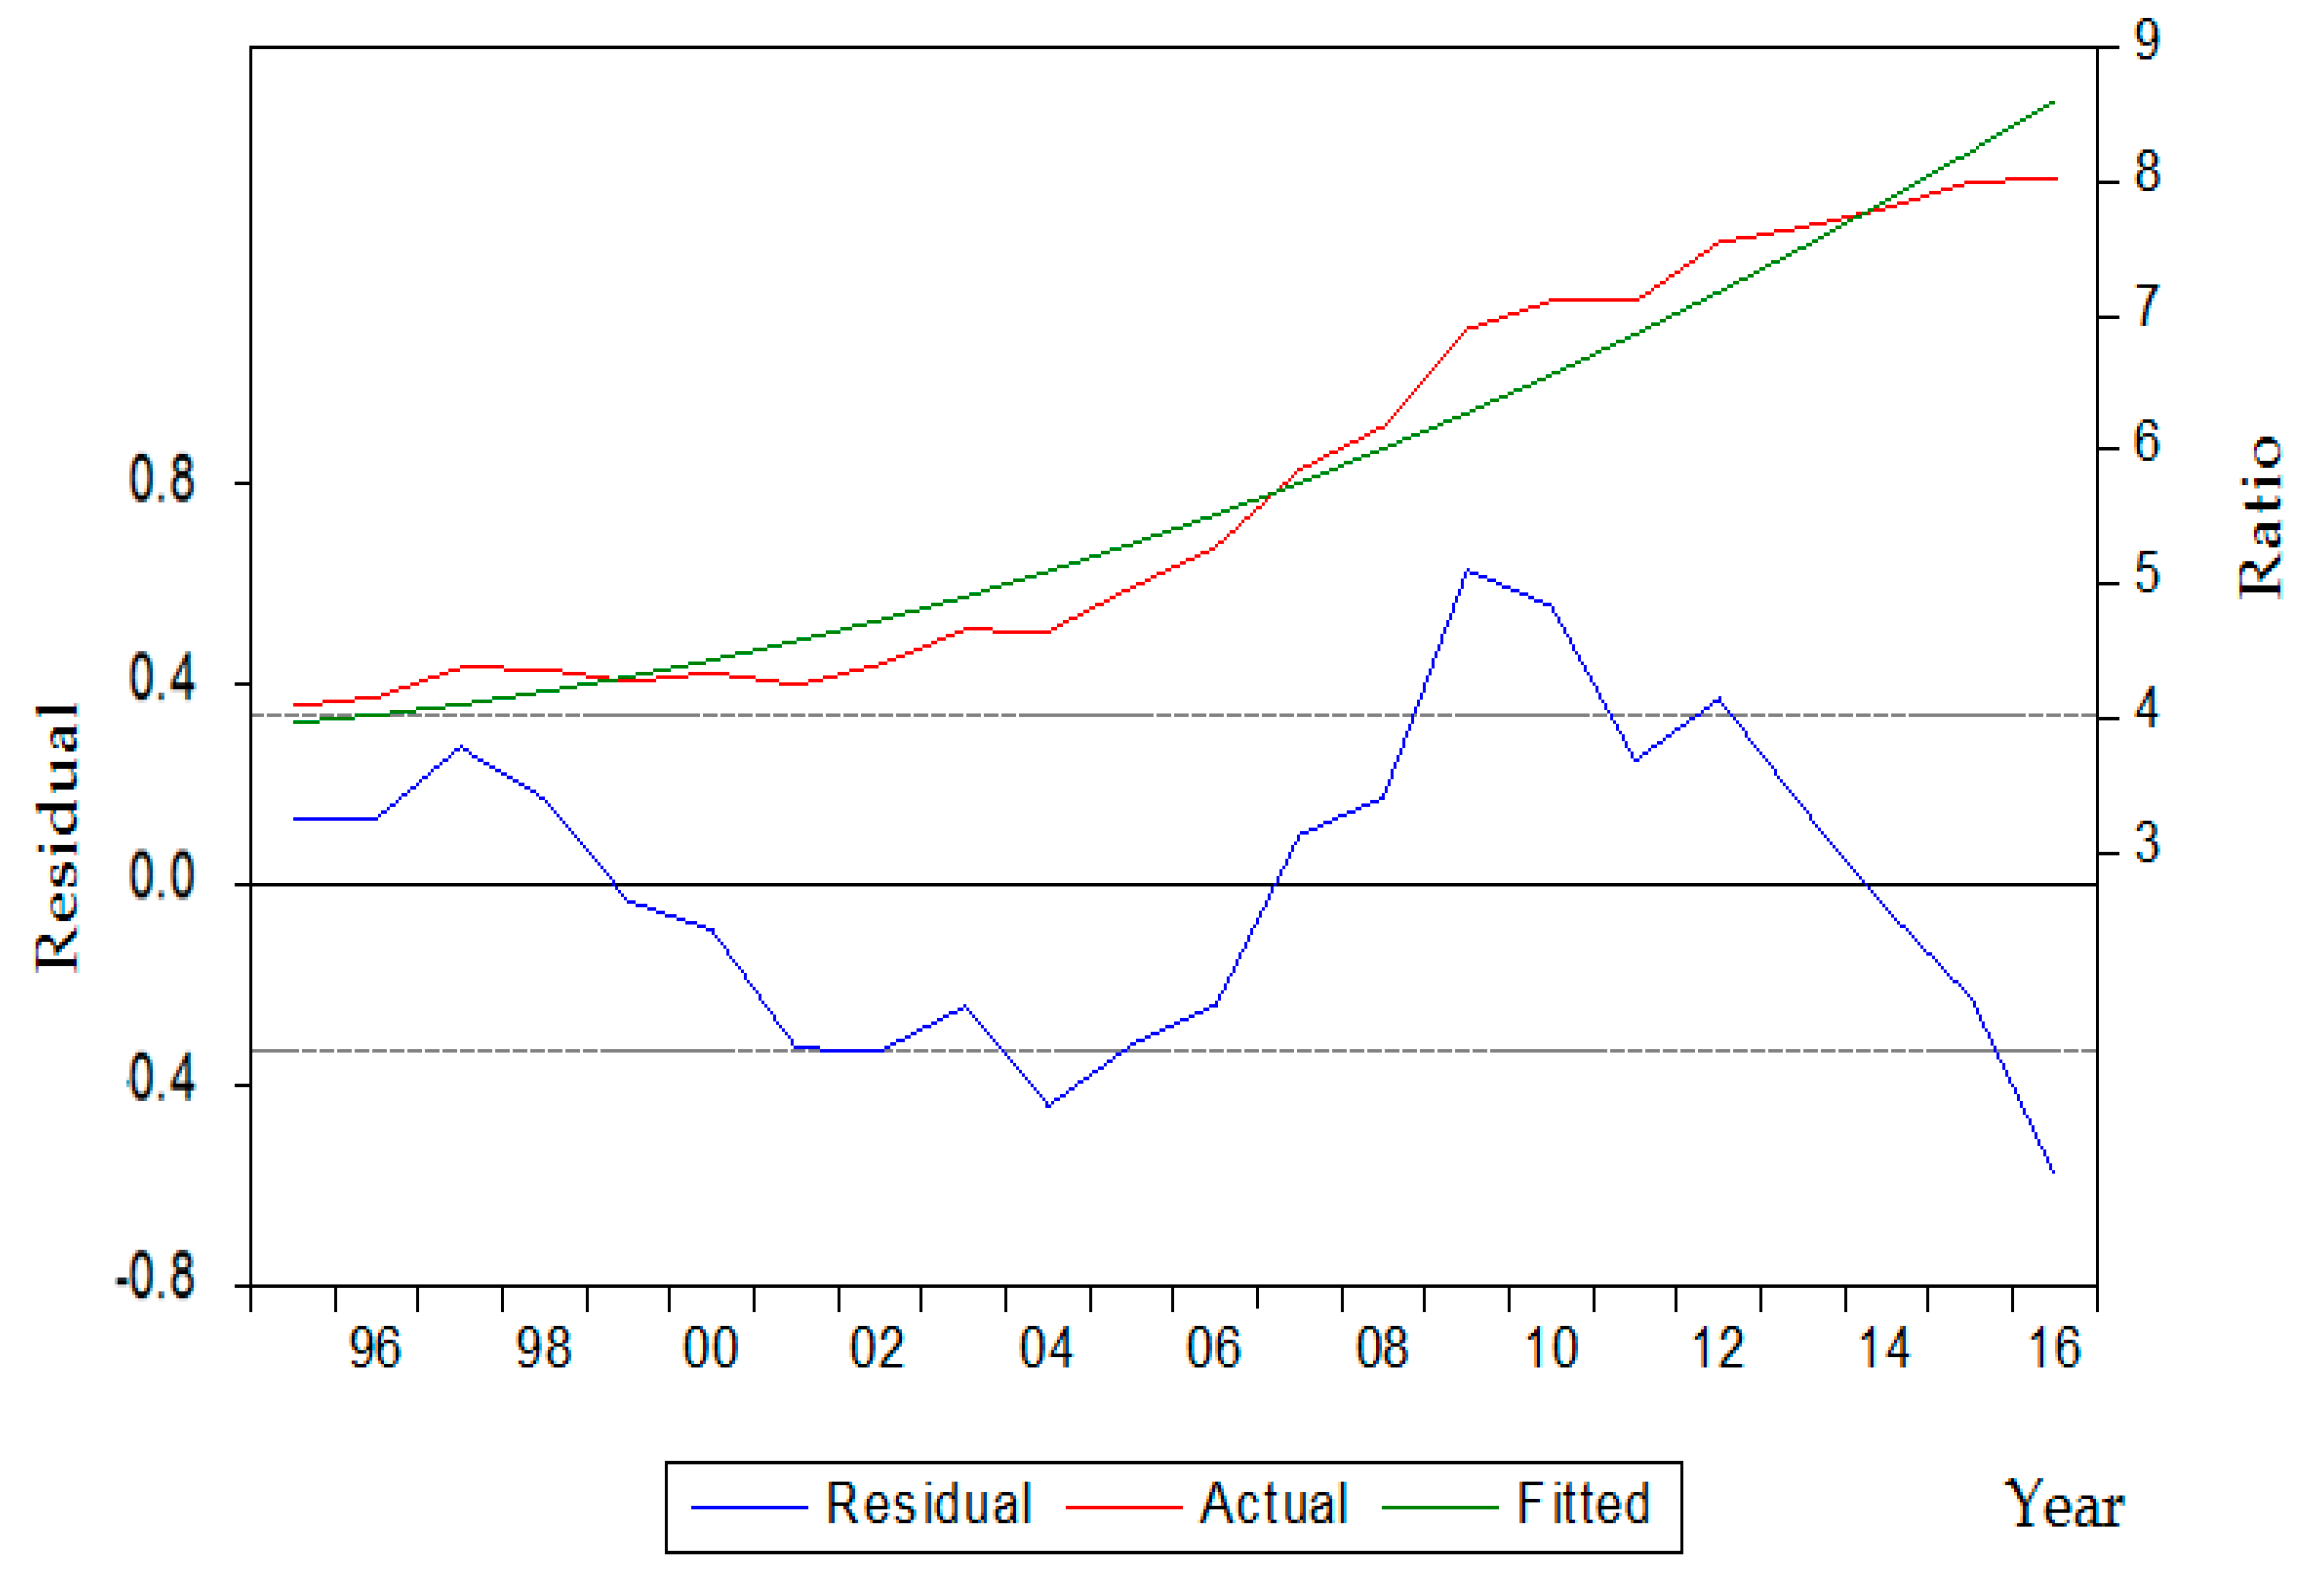
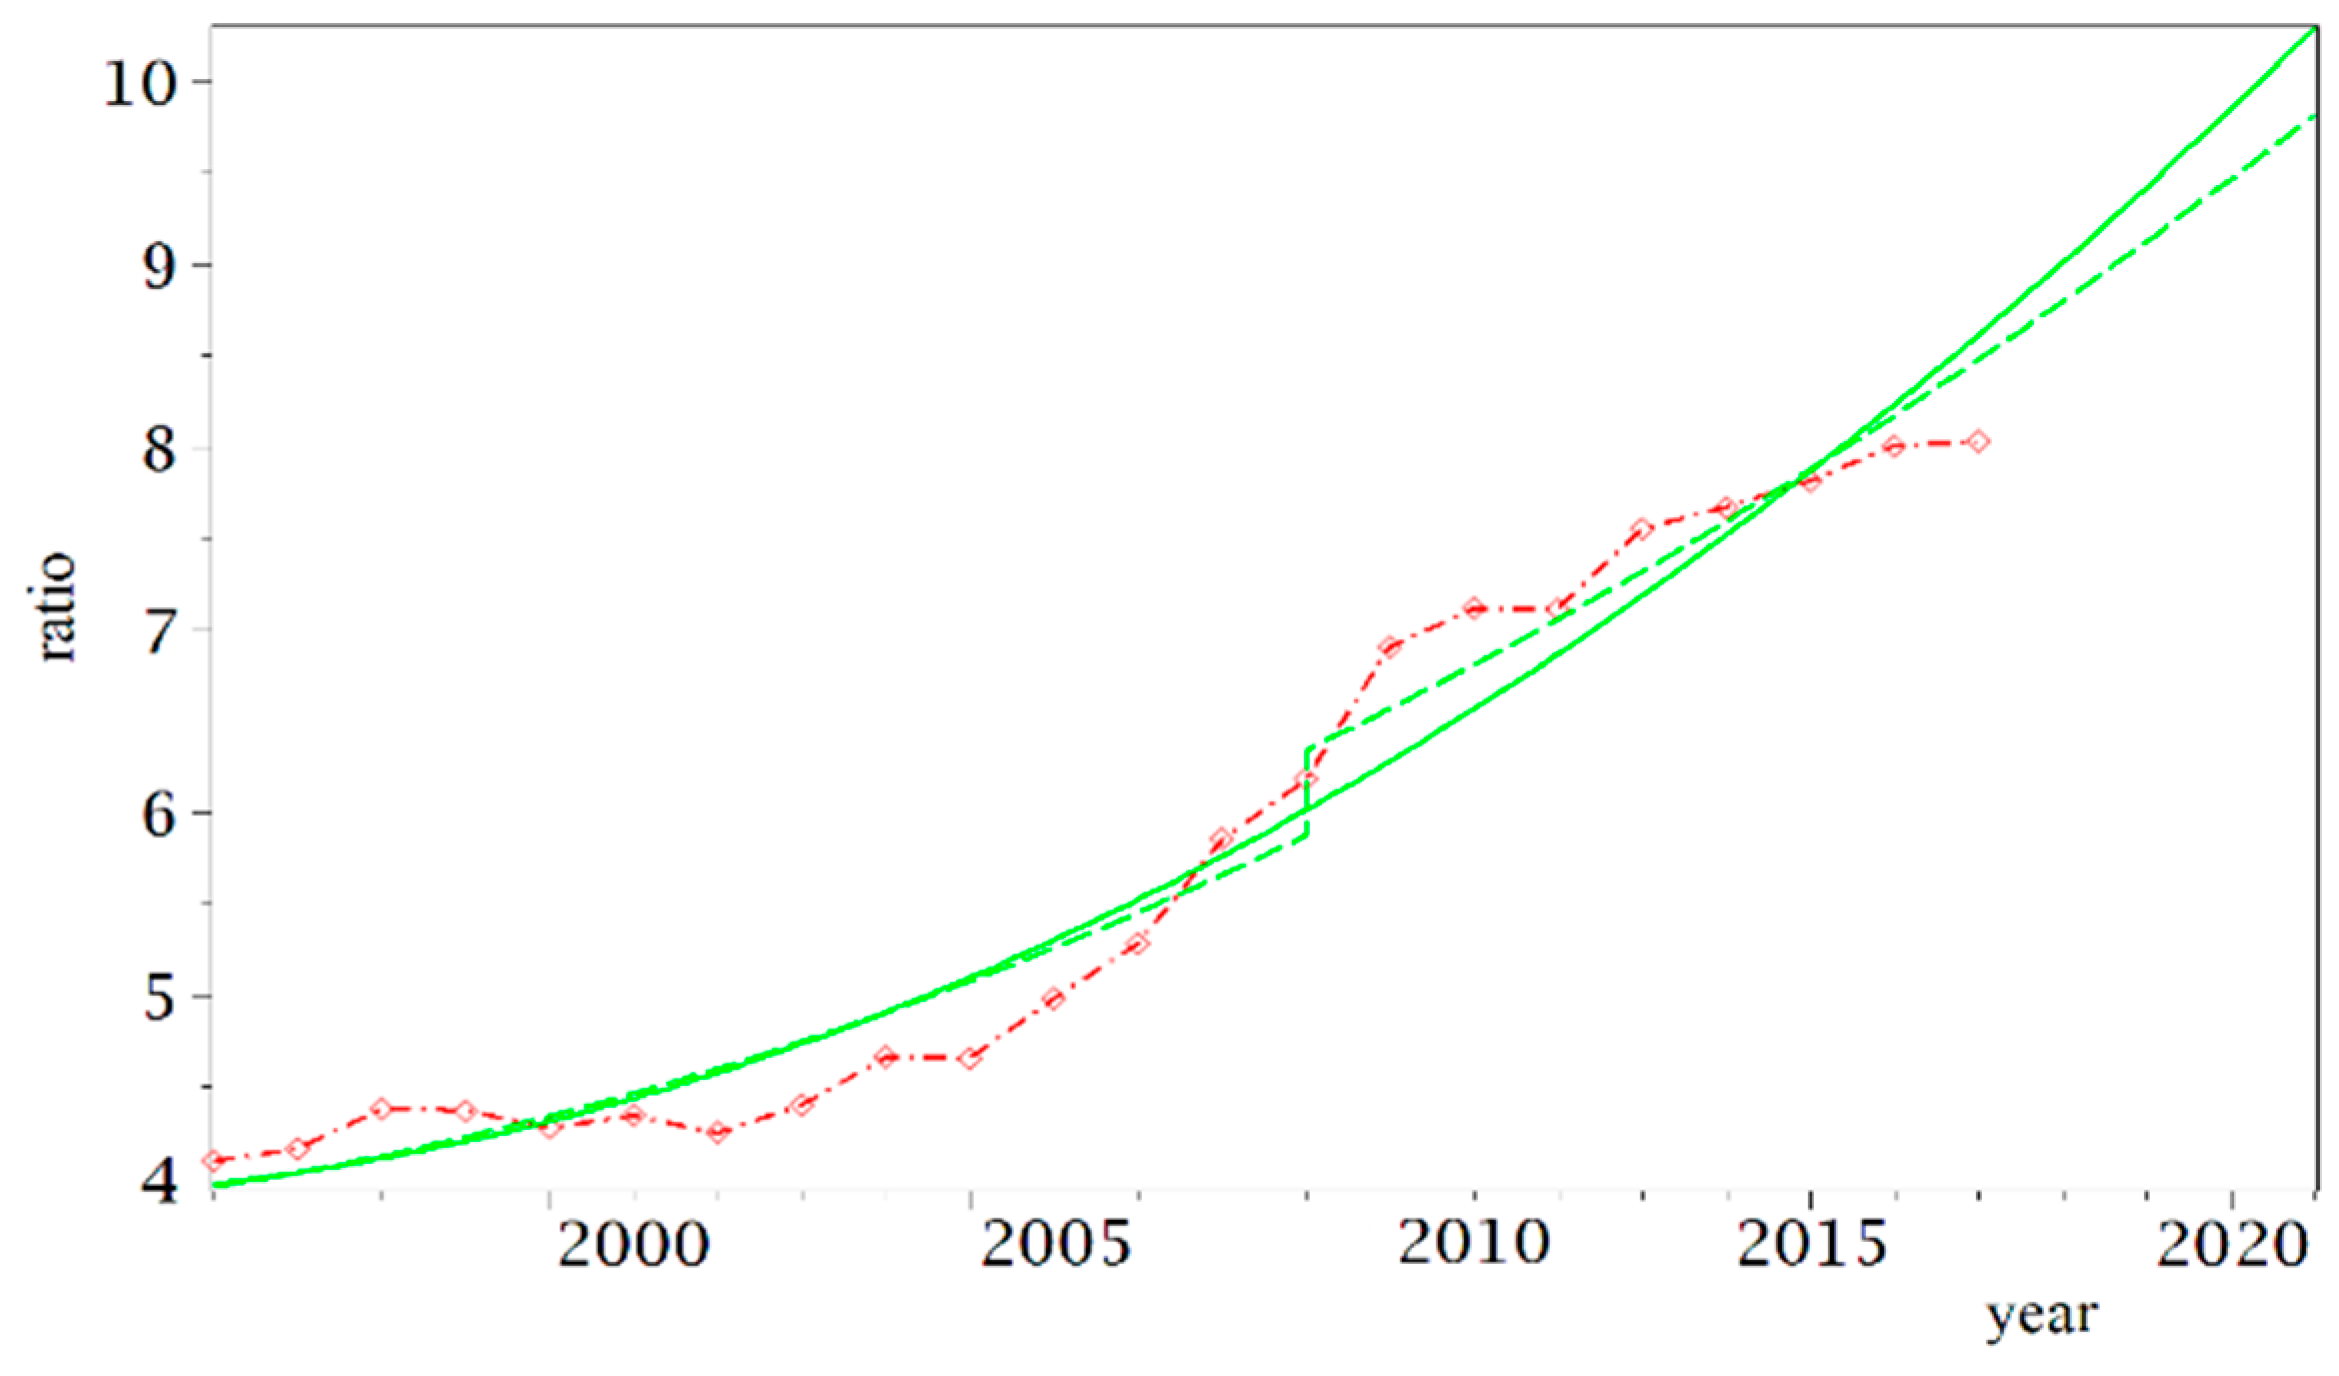
The empirical estimations of Equation (7) for the four groups are given in
Table 14.
The estimated coefficients the -term are all positive, hence the estimating function is convex and increasing, as for the EU case.
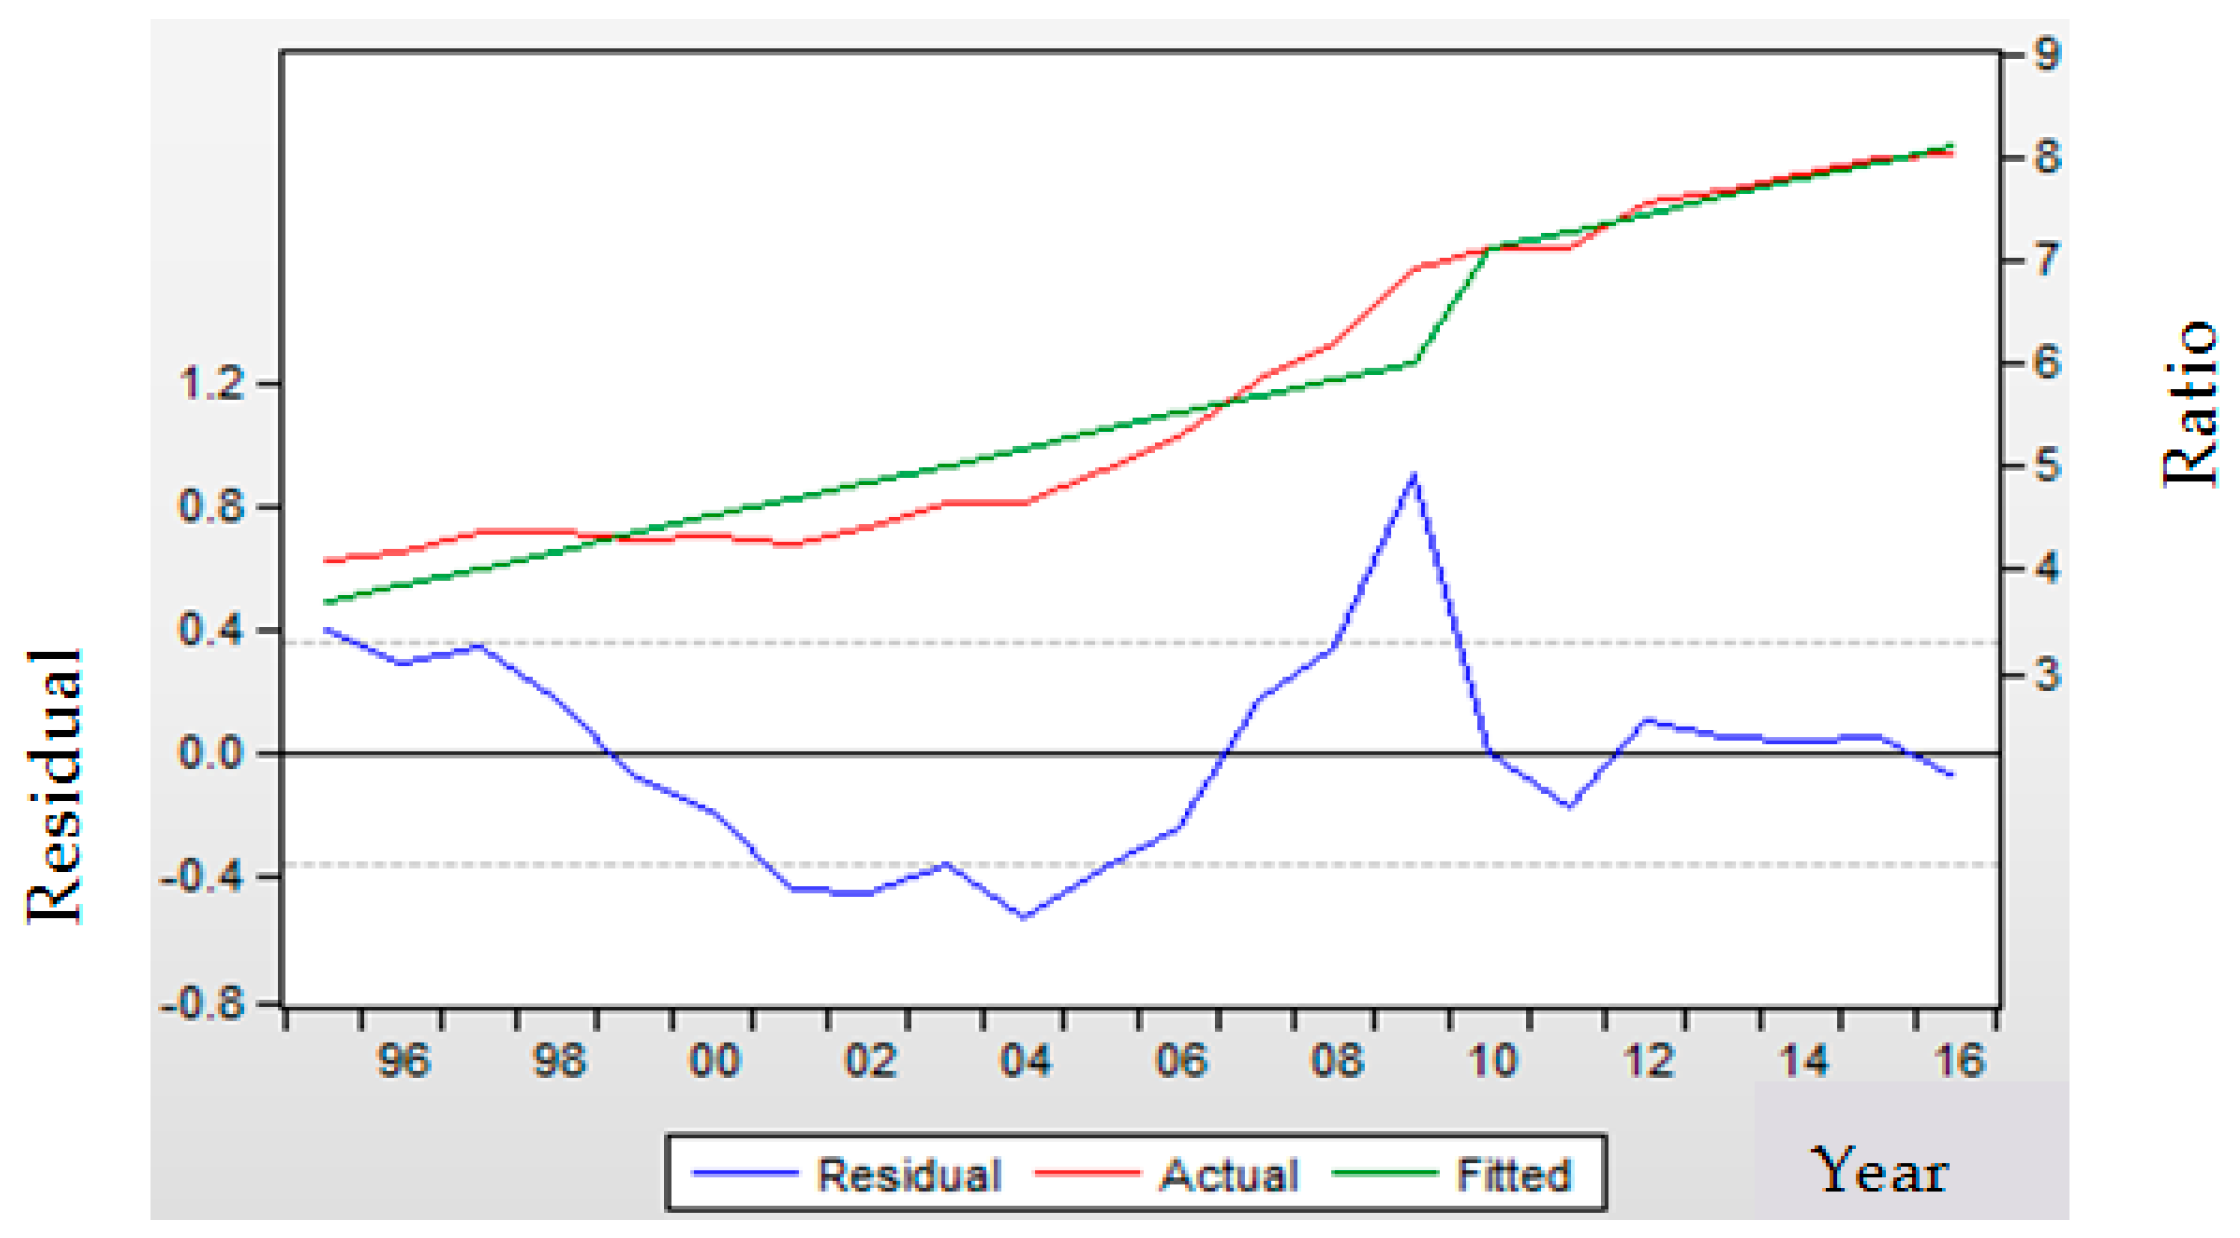
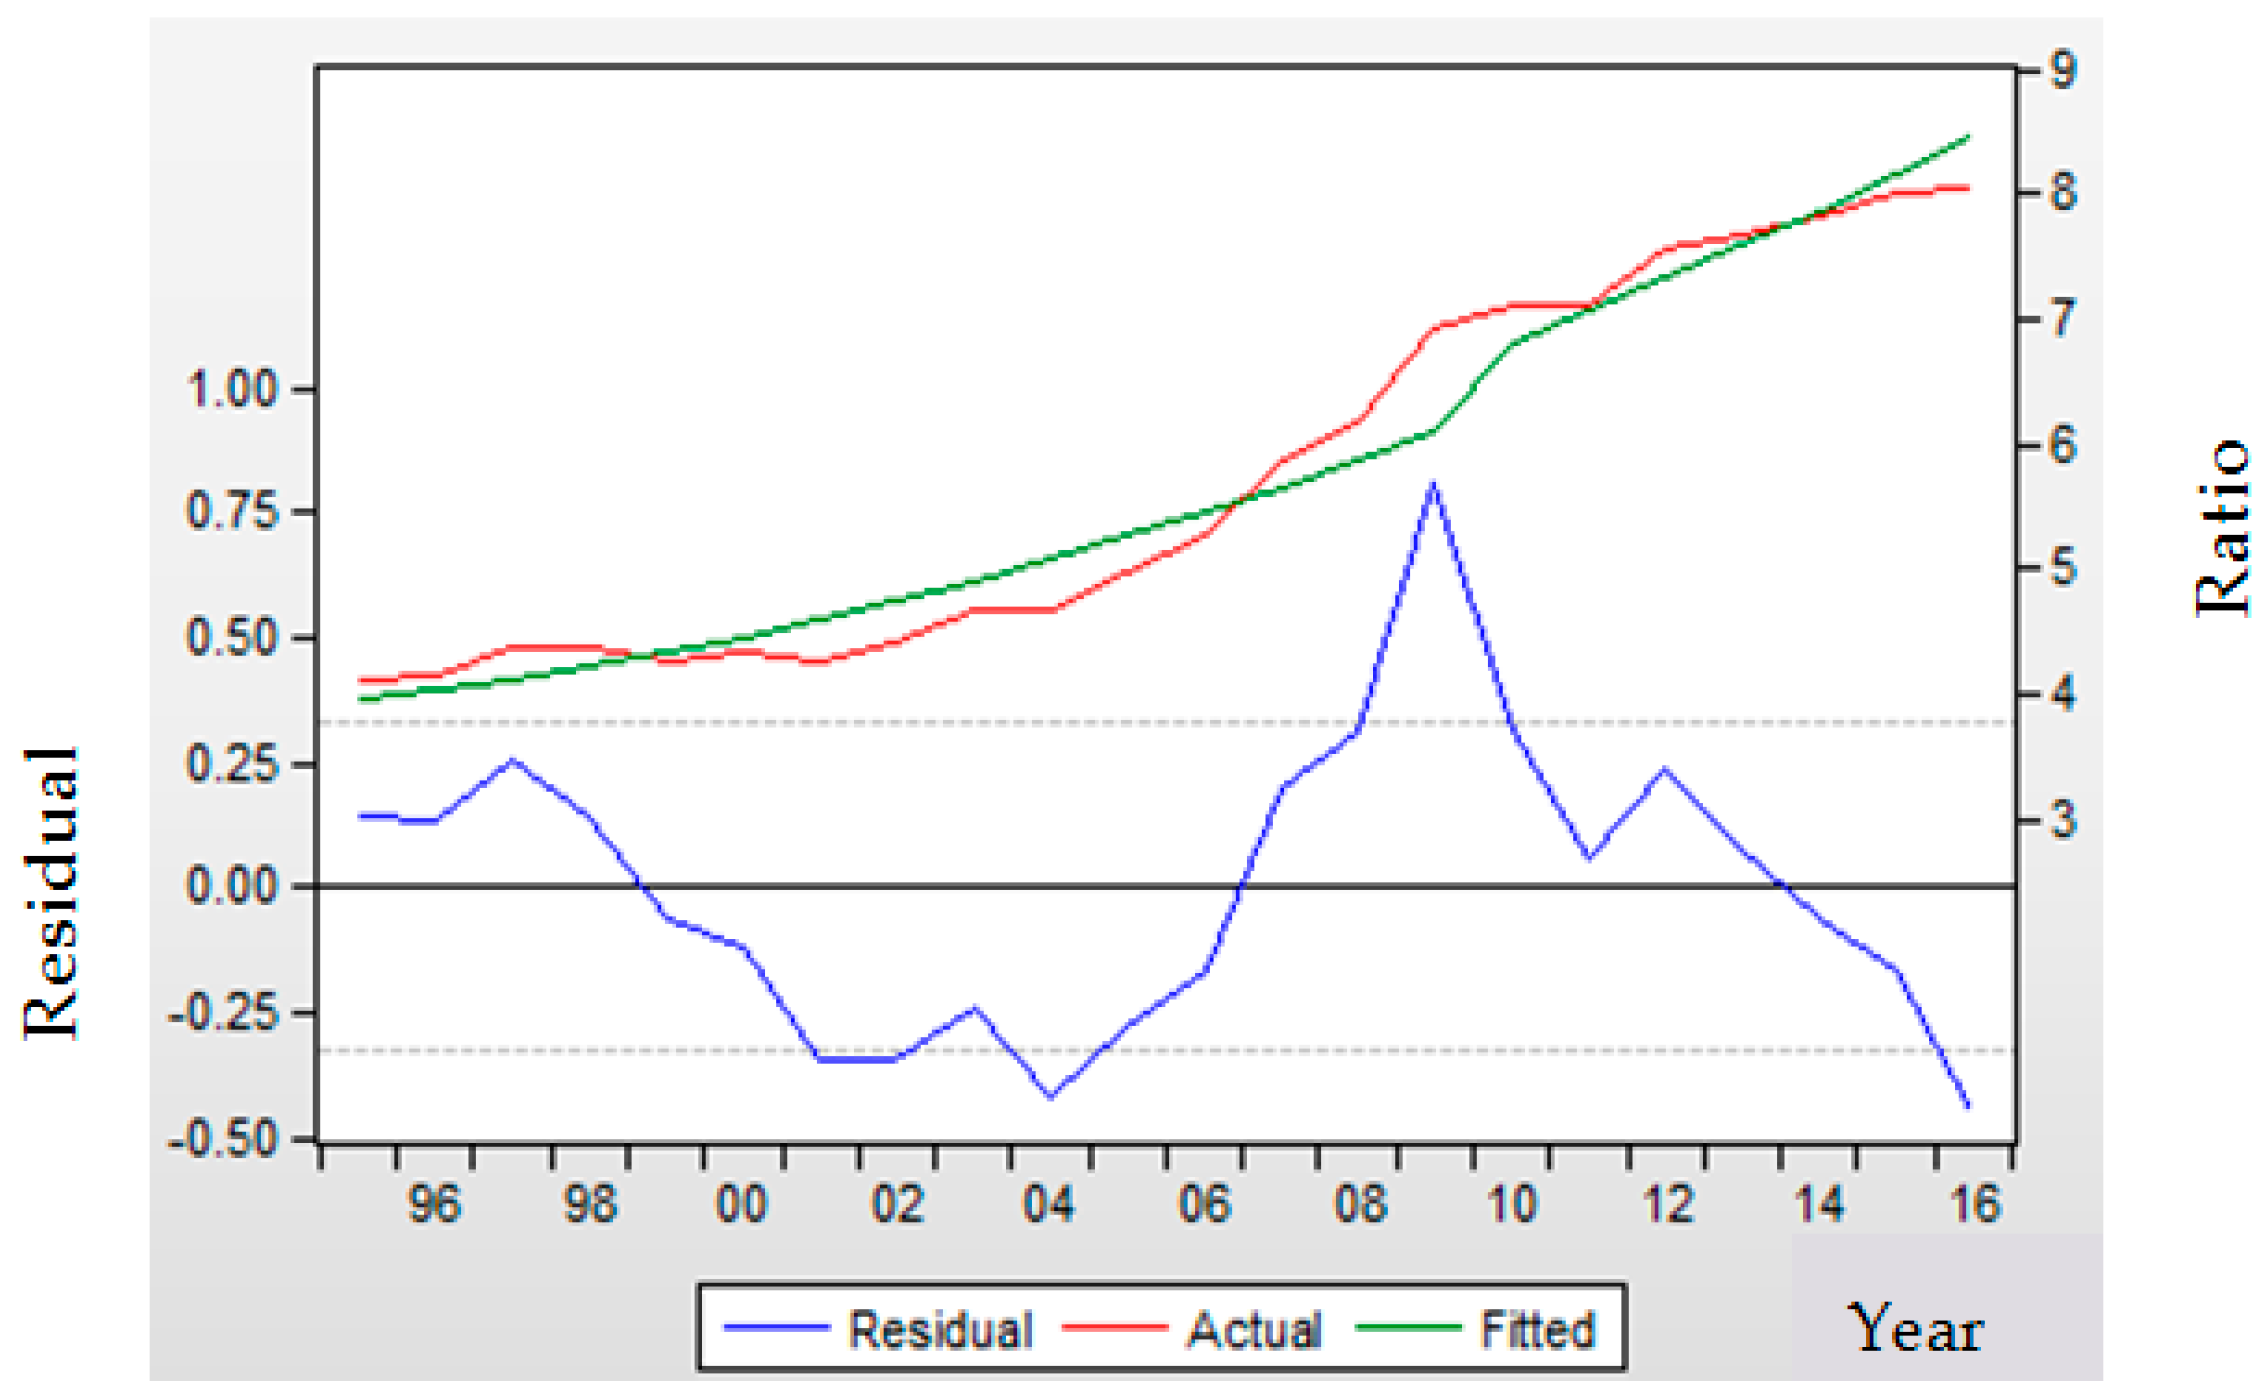
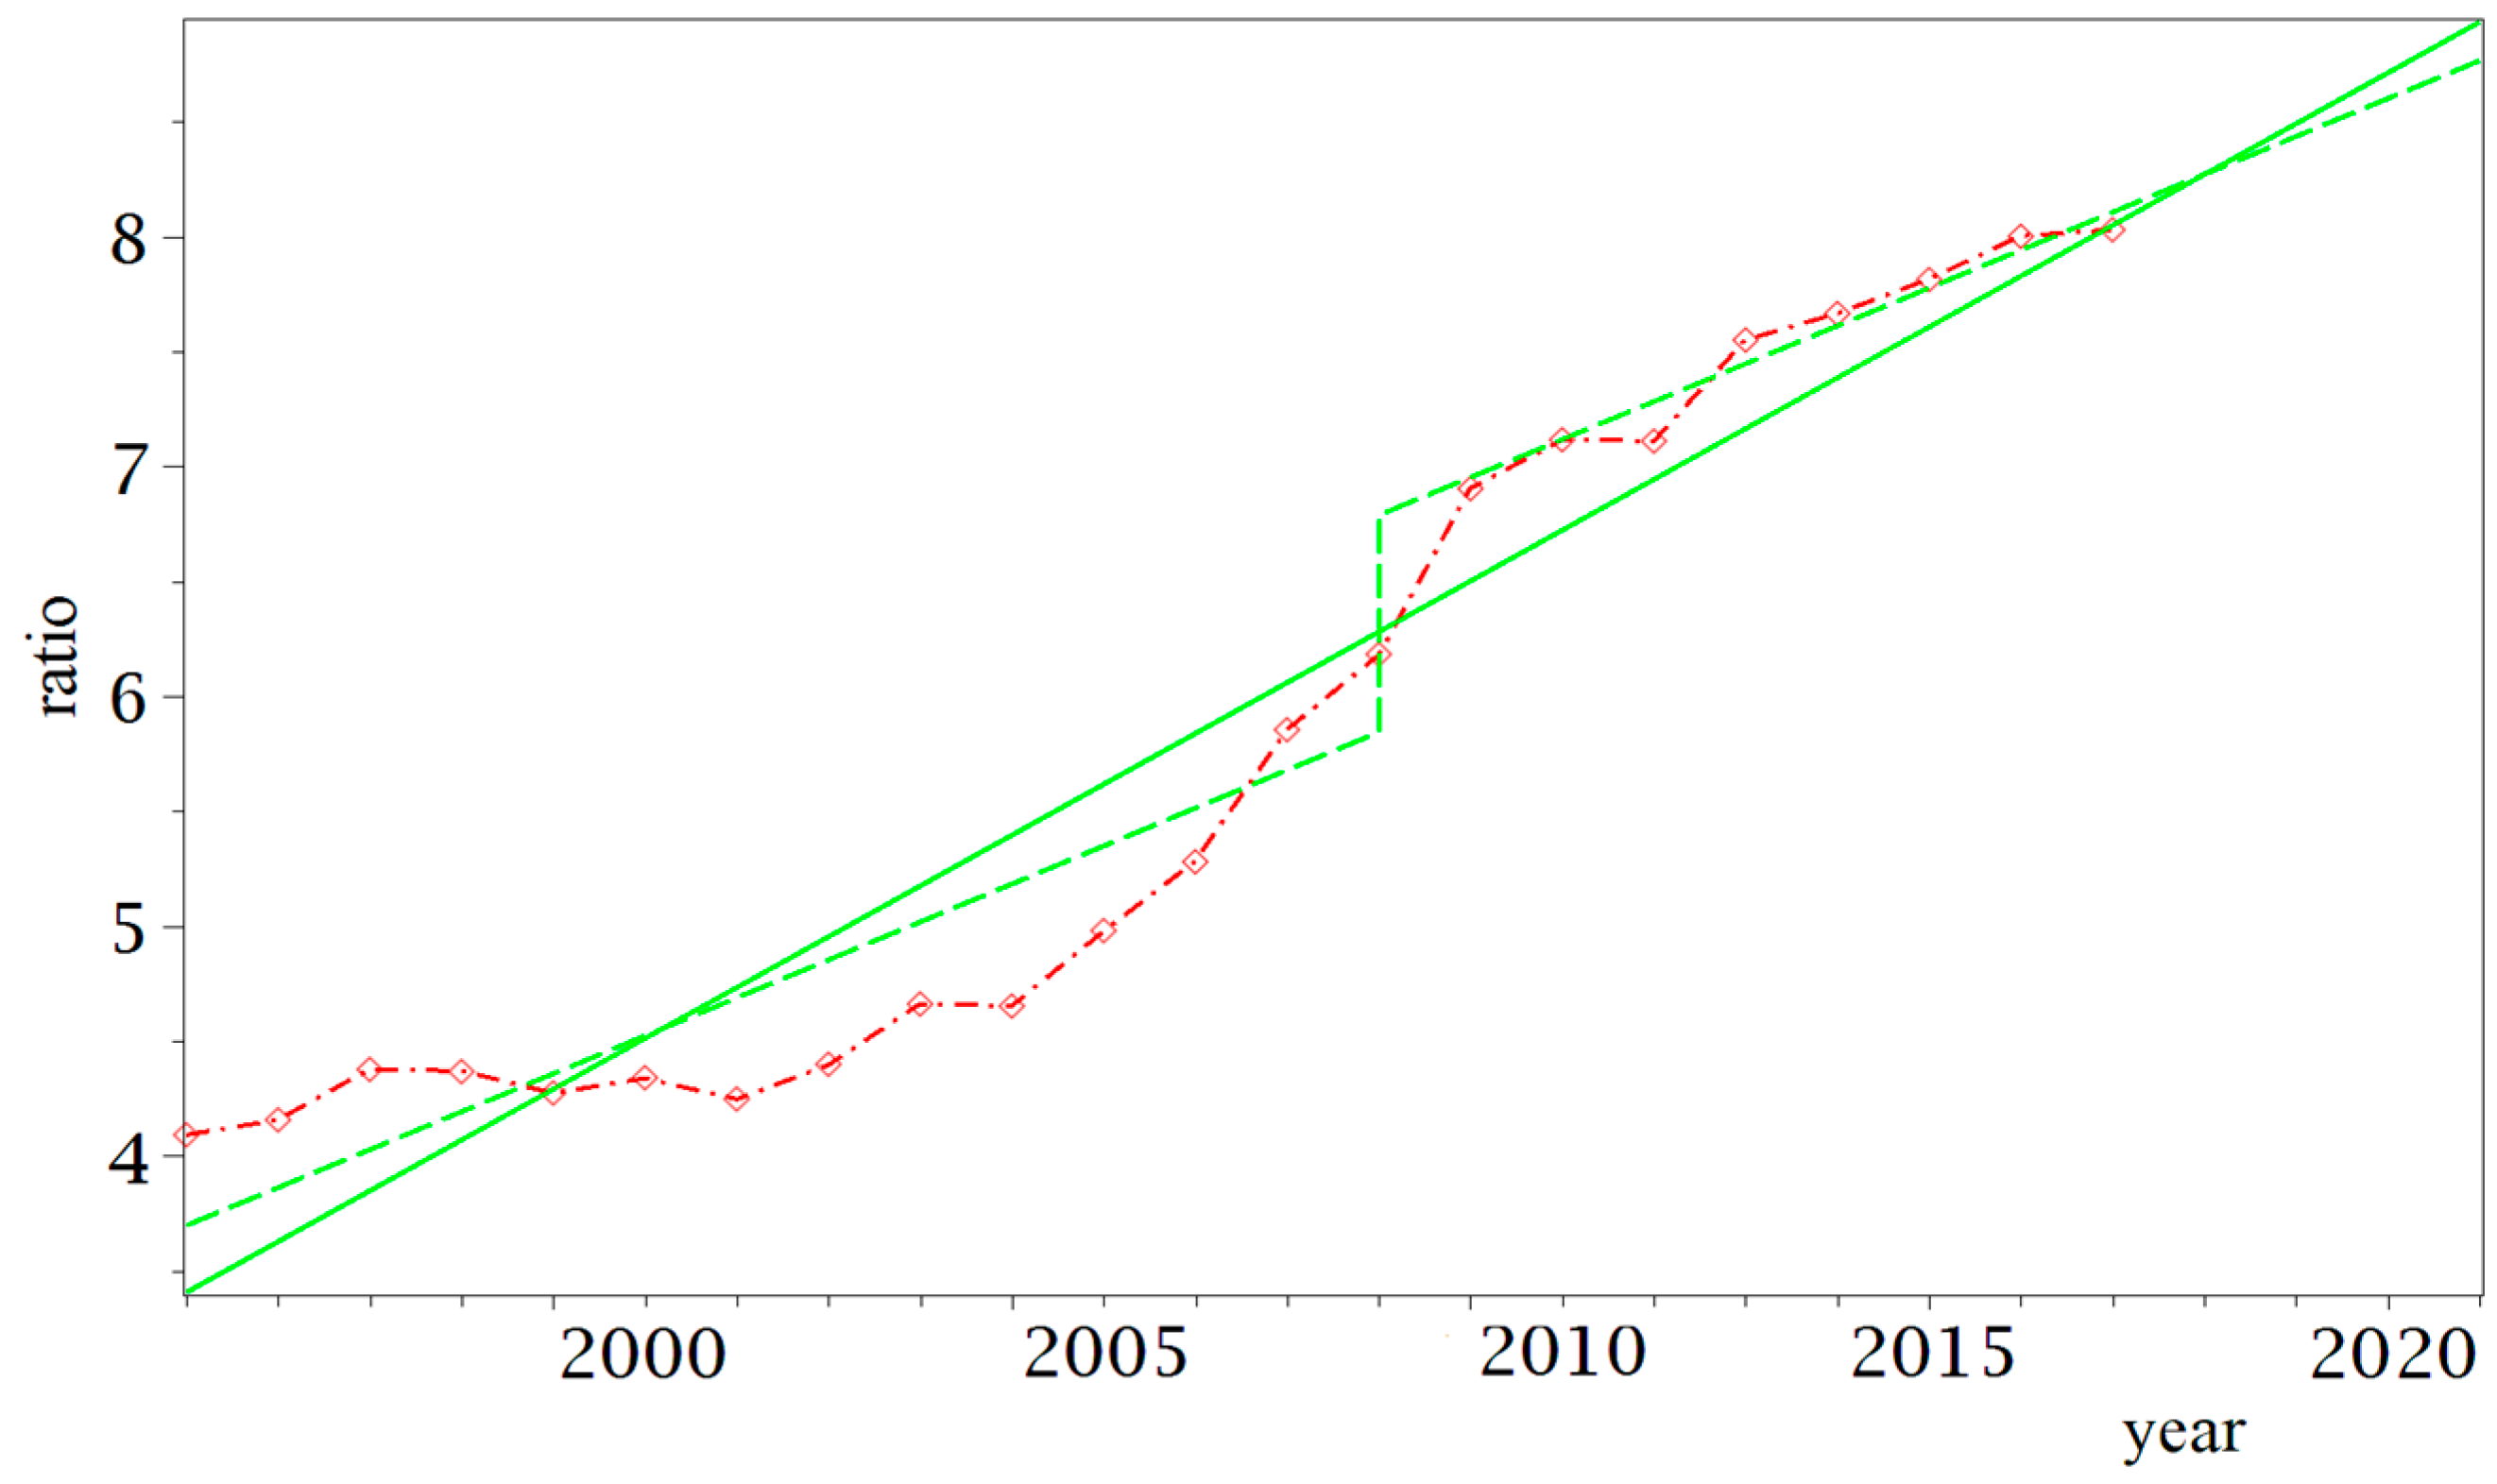
The estimations for the linear perturbed model in Equation (8) are given in
Table 15.
All the coefficients of C,
t, and D in
Table 15, except one, are statistically significant at the 1% significance level.
The coefficient of D for Group 1 has a probability of 0.102, so it is not statistically significant at the 10% significance level. Thus, the assumptions of time trend and impact of the EU directive are confirmed by the results of the linear perturbed model for three of the four groups.
The effect of the EU directive modelled by the term D is different for the four groups and the value 0.947 was obtained for the EU. The empirical estimation results in
Table 15 show that this effect is greatest for the countries of Group 3.
The analysis of the values of different regression coefficients (R-squared, SER, AIC, Schwarz) shows that the best fit for the data in Groups 1 and 3 is the quadratic one, while the perturbed linear model is the best fit for data in Groups 2 and 4.
The prediction obtained using the above three regression models for the four groups of EU countries for the horizon of 2020 are given in
Table 16.
The standard error of regression in
Table 13,
Table 14 and
Table 15 have to be taken into account in order to establish confidence intervals for these predicted values. We point out that according to these simulations, the countries in Group 3 may reach the threshold of 20% established in the EU Directive.
5.3. Economic Analysis
One of the EU’s strategies is to reduce final energy consumption by increasing energy efficiency and increasing the share of renewable energy consumption in final energy consumption, aiming to achieve sustainable development, to reduce the EU’s dependence on energy imports, to combat global warming, and to protect the environment.
As a result of the study, we found that the EU’s final energy consumption has been continually and significantly reduced, which leads us to conclude that the decrease in consumption could go below the 2020 target. Also, European countries have committed themselves to increasing the share (expressed as a percentage) of renewable energy consumption in final energy consumption (20% on average), which is different for each country.
Thus, each EU country has set its own 2020 target, taking into account its own characteristics, the potential of renewable sources, and economic performance. As a result, since 2004, the share of energy from renewable sources in final energy consumption has increased significantly in all EU member states. However, as it follows from
Table 11, 11 EU countries (namely Belgium, Germany, Ireland, Spain, Italy, Cyprus, Luxembourg, Malta, Netherlands, Slovakia, and the United Kingdom) have a share of renewable energy consumption in final energy consumption below the European Union average.
Among states with the highest shares are Latvia, Finland, Sweden, and Croatia (which have already exceeded the EU), and the opposite is Malta (about 2%), followed by the Netherlands and United Kingdom with a share of around 3%. Obviously, each of these countries will need to increase their share of renewable energy consumption in final consumption to achieve national targets and to fit into the European Union’s strategy. This, we believe, will require a change of policies and national renewable energy action plans and sustained support from the EU. Otherwise, there is a risk of widening the differences between EU countries, where only some will be able to continue the path of increasing the share of renewable energy consumption in final energy consumption. This could lead to the distortion and fragmentation of the internal energy market, automatically generating higher costs and a reduction in the use of energy from renewable sources at the EU level.
The increase in renewable energy consumption has begun to be significant since 2010, along with considerable investment in the production of energy from renewable sources in the EU countries as a result of the EU Directive from 2009. Although most member states are on an upward trend, it does not mean that the achievement of the 2020 target is secure, especially since the investments in renewable energy production have slowed down since 2015.
It is important to note that the first group that has the highest final energy consumption at the EU level (over 56%) has the lowest share of renewable energy (an average for the period 1995–2016 of 3.98%). Although significant investments have been made in increasing the production capacity of renewable energy (especially solar panels), the UK is the farthest country from achieving the EU target. Germany also continues to have overwhelming consumption of fossil and nuclear fuels, and alongside Italy and France, there are large deficits in meeting the targets by 2020.
Countries in the second group with final energy consumption of around 20% have a very different share of renewable energy consumption, averaging a total of 4.42%, which means they will also have problems reaching the targets. The Netherlands has the lowest average of ratio (1.51%) of the group, reaching 2.37% in 2016, much below the European average. This is due to the fact that their final energy consumption is based on a natural gas network (the gas is quite cheap), and government subsidies for the promotion of renewable energy sources are not attractive, being much lower than in other countries (e.g., Scandinavian countries). Spain and Belgium, with an average share of FECRE in FEC lower than the European one, focus on the consumption of electricity from renewable sources, the remainder being based on other types of fuels. Poland has taken important steps in increasing renewable energy consumption and is above the EU average, but in order to achieve the 2020 target, it will be necessary to take additional and rapid measures to boost production and appropriate energy consumption from renewable sources.
In Group 3, we have 9 countries with a final energy consumption of about 17%, but the final consumption of energy from renewable sources is the most significant in this group. This is because on the one hand, the group includes countries where renewable sources have already had a significant role in the energy mix (Austria, Denmark, Finland, and Sweden), and where the climate and the lack of fossil fuel resources have forced industry and society to minimize energy consumption. Portugal had a downward trend, unfortunately, and although it has invested heavily in renewable energy, in recent years the share of renewable energy consumption has fallen (17.44% in 1995 to 13.43 in 2016), due to fairly high costs. On the other hand, the other countries (Czech Republic, Romania, Greece, and Hungary), in addition to benefiting from a rich network of renewable sources, joined the EU quite recently (except for Greece) and had to intensify efforts to meet EU targets.
Group 4 includes the countries with the lowest final energy consumption of the final energy consumption total at the EU level (each smaller than 1%, with a sum of about 5%). But what is important is that the states in this group are small states, some of them have joined the EU recently and thus have constantly increased their share of FECRE in the FEC.
In some EU countries, the share of renewable sources in gross final consumption exceeded the target value for 2020, starting with Estonia and Hungary in 2011, Bulgaria and Sweden in 2012, Czech Republic in 2013, and Italy, Lithuania, Romania, and Finland in 2014, but their shares in final energy consumption are still significantly far from reaching the EU targets.
The forecasting realized in
Section 4 for the EU showed that the best prediction for the share of FECRE in FEC is 10.29% with a confidence interval (9.71, 10.87). The best prediction obtained using regression models in
Section 5.2 shows that expected values are smaller for Groups 1 and 2 (about 8.5%). The best prediction for Group 3 (of 18.7%) reaches the target imposed by the EU Directive.


