Article

Some Influences of Underground Coal Gasification on the Environment

Institute of Control and Informatization of Production Processes, Faculty of BERG, Technical University of Kosice, 04001 Kosice, Slovakia
*
Author to whom correspondence should be addressed.
Sustainability 2018, 10(5), 1512; https://doi.org/10.3390/su10051512
Submission received: 13 April 2018 / Revised: 7 May 2018 / Accepted: 8 May 2018 / Published: 10 May 2018
(This article belongs to the Special Issue Clean Coal Technologies)

Abstract

:
Increasing energy costs and energy demand have renewed global interest in clean coal technologies. Underground Coal Gasification (UCG) is an industrial process that converts coal into product gas. UCG is a promising technology with a lot of health, safety and environmental advantages over conventional mining techniques. UCG carries risks to human health, agriculture and the environment. This article briefly analyzes the advantages and negative environmental impacts of UCG. It describes experimental objects, mathematical models as tools for simulation cases and it used coal from UCG experiments in Cigel, Barbara and Wieczorek mines to analyze the environmental impacts of UCG. The gasification converts the carbon in the coal to syngas and heat. We carried out a numerical simulation of the two-dimensional unstable heat conduction in the coal and overburden, with the aim of judging the influence of this heat source on the surroundings, including the surface. The results show that the temperature in the surrounding rock first increases and then decreases with time, the peak of the temperature curve decreases gradually, and its position moves inside the surrounding rock from the ignition point. A small amount of potentially dangerous syngas leaks from the UCG cavity and channels into vulnerable areas depending on working pressures. The danger of explosion and poisoning in vulnerable zones was evaluated by the simulation model. The results show that the danger is real but by monitoring and controlling the air in the vulnerable area it is possible to reduce this risk.

1. Introduction

Today, economic, energy, and environmental concerns have spurred unprecedented interest in the future of clean and renewable sources of energy. Energy has been universally recognized as one of the most important inputs for economic growth and human development. There is a strong relationship between economic development and energy consumption. According to the relevant output statistics of the “global new energy development report 2016”, in 2015, fossil energy accounted for 66% of global electricity [1]. In terms of energy, coal is a major energy source which provides about 40% of the total electricity generation of the world [2]. Coal reserves significantly exceed oil and gas. Estimates of total world coal resources (including non-mineable coal) are usually stated in trillions of tons [3] and recent estimates of the total remaining coal resources in the world quote a figure of 18 trillion tons [4]. However, the extraction of coal and production of electricity in coal-fired power stations significantly pollutes the environment and is detrimental to the global climate [5,6,7,8]. Therefore, at the European level, a lot of effort has been made in recent decades to promote the use of renewable sources in the energy market [9,10,11,12]. By 2015, almost 27% of the European Union’s reported electricity production was coming from renewables, with the expectation that under an optimal scenario, this percentage will increase to 50% by 2030 [13]. However, renewable energy presents its own challenges. The use of renewable resources in the energy market also has negative impacts on environment. Energy from these sources is more expensive in comparison with conventional power stations. Therefore, development of some renewable energy sources must be supported by the government in many European countries. Financing the renewable energy industry is difficult due to its characteristics of high risk and long-term investment returns and relying on existing financing channels [1]. Considering this brief analysis, it appears appropriate to develop clean coal technologies. Exhaustion of non-renewable energy resource reserves leads to the conclusion it is necessary to seek the possibility of obtaining energy from these resources in the most economic and effective manner, i.e., from coal beds for which open pit or underground mining are impossible due to technical or economic reasons [14]. Moreover, global trends aiming to reduce greenhouse gas emissions, particularly CO2, make it necessary to develop clean coal technologies including underground coal gasification [15]. Underground coal gasification (UCG) is a technology permanently developed in world where coal is burnt in a controlled manner and gasified under in situ conditions to produce syngas which can be converted into various types of fuel, such as gas for electricity generation or even oil. Development of UCG continued for the next 78 years in the Soviet Union and included successful commercial production at numerous sites. During this time, the formerly Soviet Union conducted roughly 200 field tests and several commercial projects producing over 15 million tons of coal. Much of this was at the electric power plant in Angren, Uzbekistan that is still in operation after 53 years [16]. The World Energy Council estimates that UCG could enable the economic recovery of 600 billion tons of coal reserves, allowing companies to access coal that has previously been considered ‘non-minable’. Although the concept of UCG is not new as it dates back more than 100 years, renewed interest in UCG technology has recently occurred in most coal producing regions of the world [3,17,18,19,20,21,22,23,24,25,26,27]. Recently, several researchers have investigated UCG, focusing on electrical power generation [3,25,28] or on hydrogen production [19,20,21].
The main product of UCG, syngas, is recovered from the production borehole. Syngas consists mainly of the gasses CO, CO2, H2, CH4, CmHn, O2, N2, H2O, H2S, SO2, SO3. It can be used to generate power, or make urea for fertilizer, or produce ammonia and methanol and their derivatives, and/or can be converted into synthetic liquid fuels by using various methods or processes. The UCG process could be more economical than conventional surface coal gasification because no mining, processing and transportation of coal are involved. Further, no ash/slag removal or disposal is required. The environmental impact of UCG is relatively low compared to conventional mining methods, as major disturbances in landscape and surface disposal of ash are not required. The main motivation for moving toward UCG as the future coal utilizing technique is the environmental and other advantages over the conventional mining process. Some of these benefits include increased worker safety, reduced sulfur emissions, reduced discharge of Hg and tar, no surface disposal off ash and coal tailings, low dust and noise pollution, low water consumption, greater exploitation of coal resources and low methane emissions to the atmosphere [3,16,29,30]. UCG is particularly advantageous for deep coal deposits and steeply dipping coal seams since under these conditions there are less gas leakages to the surroundings, the high pressures favor methane formation [31] and the subsidence at the surface may be minimal [32]. This study analyzes the impact of syngas leakage on the safety of people working/living near UCG sites. Of course, UCG involves some environmental impacts such as land subsidence, ground water reserve pollution, air pollution and climate change exacerbation which represent disadvantages. Some negative environmental impacts follow.

1.1. Groundwater Contamination

Many hazardous water-borne contaminants have been identified during different UCG operations conducted so far, and in some locations, there has been long-term groundwater contamination. The organic pollutants detected after UCG processes include phenols, benzene and its derivatives, polycyclic aromatic hydrocarbons (PAHs), heterocycles, ammonia, mercury, zinc, sulphates, cyanides and other heavy metals. Phenol concentration in groundwater was high due to its high solubility in water [14,16,31,32,33]. Therefore, UCG sites should be away from water aquifers. Some methods for minimization this negative impact on groundwater contamination are described in [34,35,36,37,38].

1.2. Air Pollution

Business leaders, policymakers and researchers have reached a consensus that limiting the carbon emissions from the oil and natural gas industry is an important step in coping with the challenge of climate change [39,40,41]. Consequently, the industry under pressure to take actions to mitigate carbon emissions [42]. As one China is of the world’s leading CO2 emitters, it is necessary to conduct thorough research into the CO2 emission problem caused by China’s outward foreign direct investment (OFDI). When the host countries attract China’s OFDI to expand production and meet domestic needs, CO2 is released in their own yards. The impact on CO2 emissions from host countries caused by the dramatically increasing China’s OFDI can be calculated with the input-output analysis and their related data. In 2011, the top four countries in terms of host CO2 emissions were USA, Indonesia, Australia, and Russia, emitting 1135.0, 937.2, 729.4, and 601.7 kt CO2 respectively. Moreover, India, France, Germany, and Korea also emitted over 200 kt [43]. Ref. [44] presents results of eco-efficiency assessment, life cycle assessment (LCA) and life cycle costing (LCC) of UCG with the shaftless method and sensitivity analysis of eco-efficiency of electricity production from UCG. The largest impact on the damage categories was caused by CO2 emission from syngas combustion and electricity consumption. Based on LCC results it was concluded that for cost effective production of electricity with UCG it is necessary to maximize the scale of an installation while optimizing use of the produced electricity. The broad technology options available for capturing CO2 are physical absorption, chemical absorption, membrane separation and cryogenic separation [45,46,47]. Where UCG has taken place at depths in excess of about 700–800 m, storage of CO2 in these artificial high permeability zones is a very attractive proposition. UCG can also integrates carbon capture and utilization/storage (CCUS), where carbon dioxide is captured and then transported via pipeline and either sequestered or used to enhance oil recovery, into its operation to achieve more significant GHG emission reduction. Due to global climate change, CCUS is an important approach that can be combined with. A combined UCG–CCUS project can then offer integrated energy recovery from coal and storage of CO2 at the same site [3]. The UCG process releases toxic, explosive gases throughout the construction phase, operational phase and decommissioning. Of course, syngas leaks from UCG also over overburden on surface and has negative environmental impact. Methane and carbon dioxide from syngas have the biggest impact on global warming. Methane, carbon monoxide and hydrogen are explosive and toxic gasses. Therefore, the impact of the syngas leaking [48] directly from UCG through the overburden is analyzed, including its impact on environment.

1.3. The Heat Impact

More studies have demonstrated that land use changes can affect the suitability of habitat and diversity, water resources, surface runoff and surface temperatures [49]. Of course, UCG can influence surface temperature. The main evaluation indices of the urban thermal environment are atmospheric temperature (Ta), land surface temperature and thermal comfort. Among them, Ta and land surface temperature are utilized more in analyzing the spatial distribution of difference of temperature [50]. The impact of vegetation types on air and surface temperatures are researched [51,52] because vegetation and surface temperature interact. Therefore, this study analyzes the impact of UCG on surface temperature. UCG also influences rock temperature in overburden, then its mechanical properties are changed (positive/negative) by temperature impact [53,54,55] and the risk of subsidence increases or decreases. From this statement, this study also analyzes two-dimension temperature fields in overburden in a new way based on a moving gasification front. Some studies analyzed temperature fields using methods based on simplified approaches (one dimensional and analytical solution) [56,57,58]. To study the temperature field distribution in burnt surrounding rock and to determine ranges of burnt surrounding rock, the coal-wall coking cycle and heat influence in the underground coal gasification (UCG) stope, based on the Laplace transformation and inversion formula [56], the analytical temperature solution of one-dimensional unsteady heat conduction for multi-layer overlying strata under the first and the forth kinds of boundary conditions was studied.

2. Materials and Methods

UCG involves gasifying coal in situ, in an “underground coal gasifier” (see Figure 1). In the first step, injection and production bore holes are drilled apart from each other at some specified distance from the surface into the coal seam. In the following step, a permeable channel is created between two boreholes which enables the sufficient flow of gases in large-scale operation. It is necessary to ignite the coal initially to raise the coal temperature using a combustible gas and oxygen mixture with the help of a suitable ignition source. After this stage, the mixture of air/oxygen and steam are injected into the coal seam to gasify the coal.
There are descriptions of experimental objects, mathematical models as tools for simulation cases and materials used. During 2006 and 2017, a detailed experimental program was carried out with the aim of studying the effectiveness and effects of UCG in operating mines and areas of high vulnerability. The objective of this article for the reporting period was to analyze the effects of the UCG process on the environment. Experimental and simulation methods were used.

2.1. The UCG Experiments

First experiments were done under laboratory conditions for the Cigel coal seam at a depth of 370 m (Slovakia). Later, UCG research was carried out in the Barbara experimental mine and at Wieczorek Colliery (Poland). Several experiments were completed within the RFCS projects: HUGE (2007–2010), HUGE 2 (2011–2014) and the COGAR project (2013–2017).

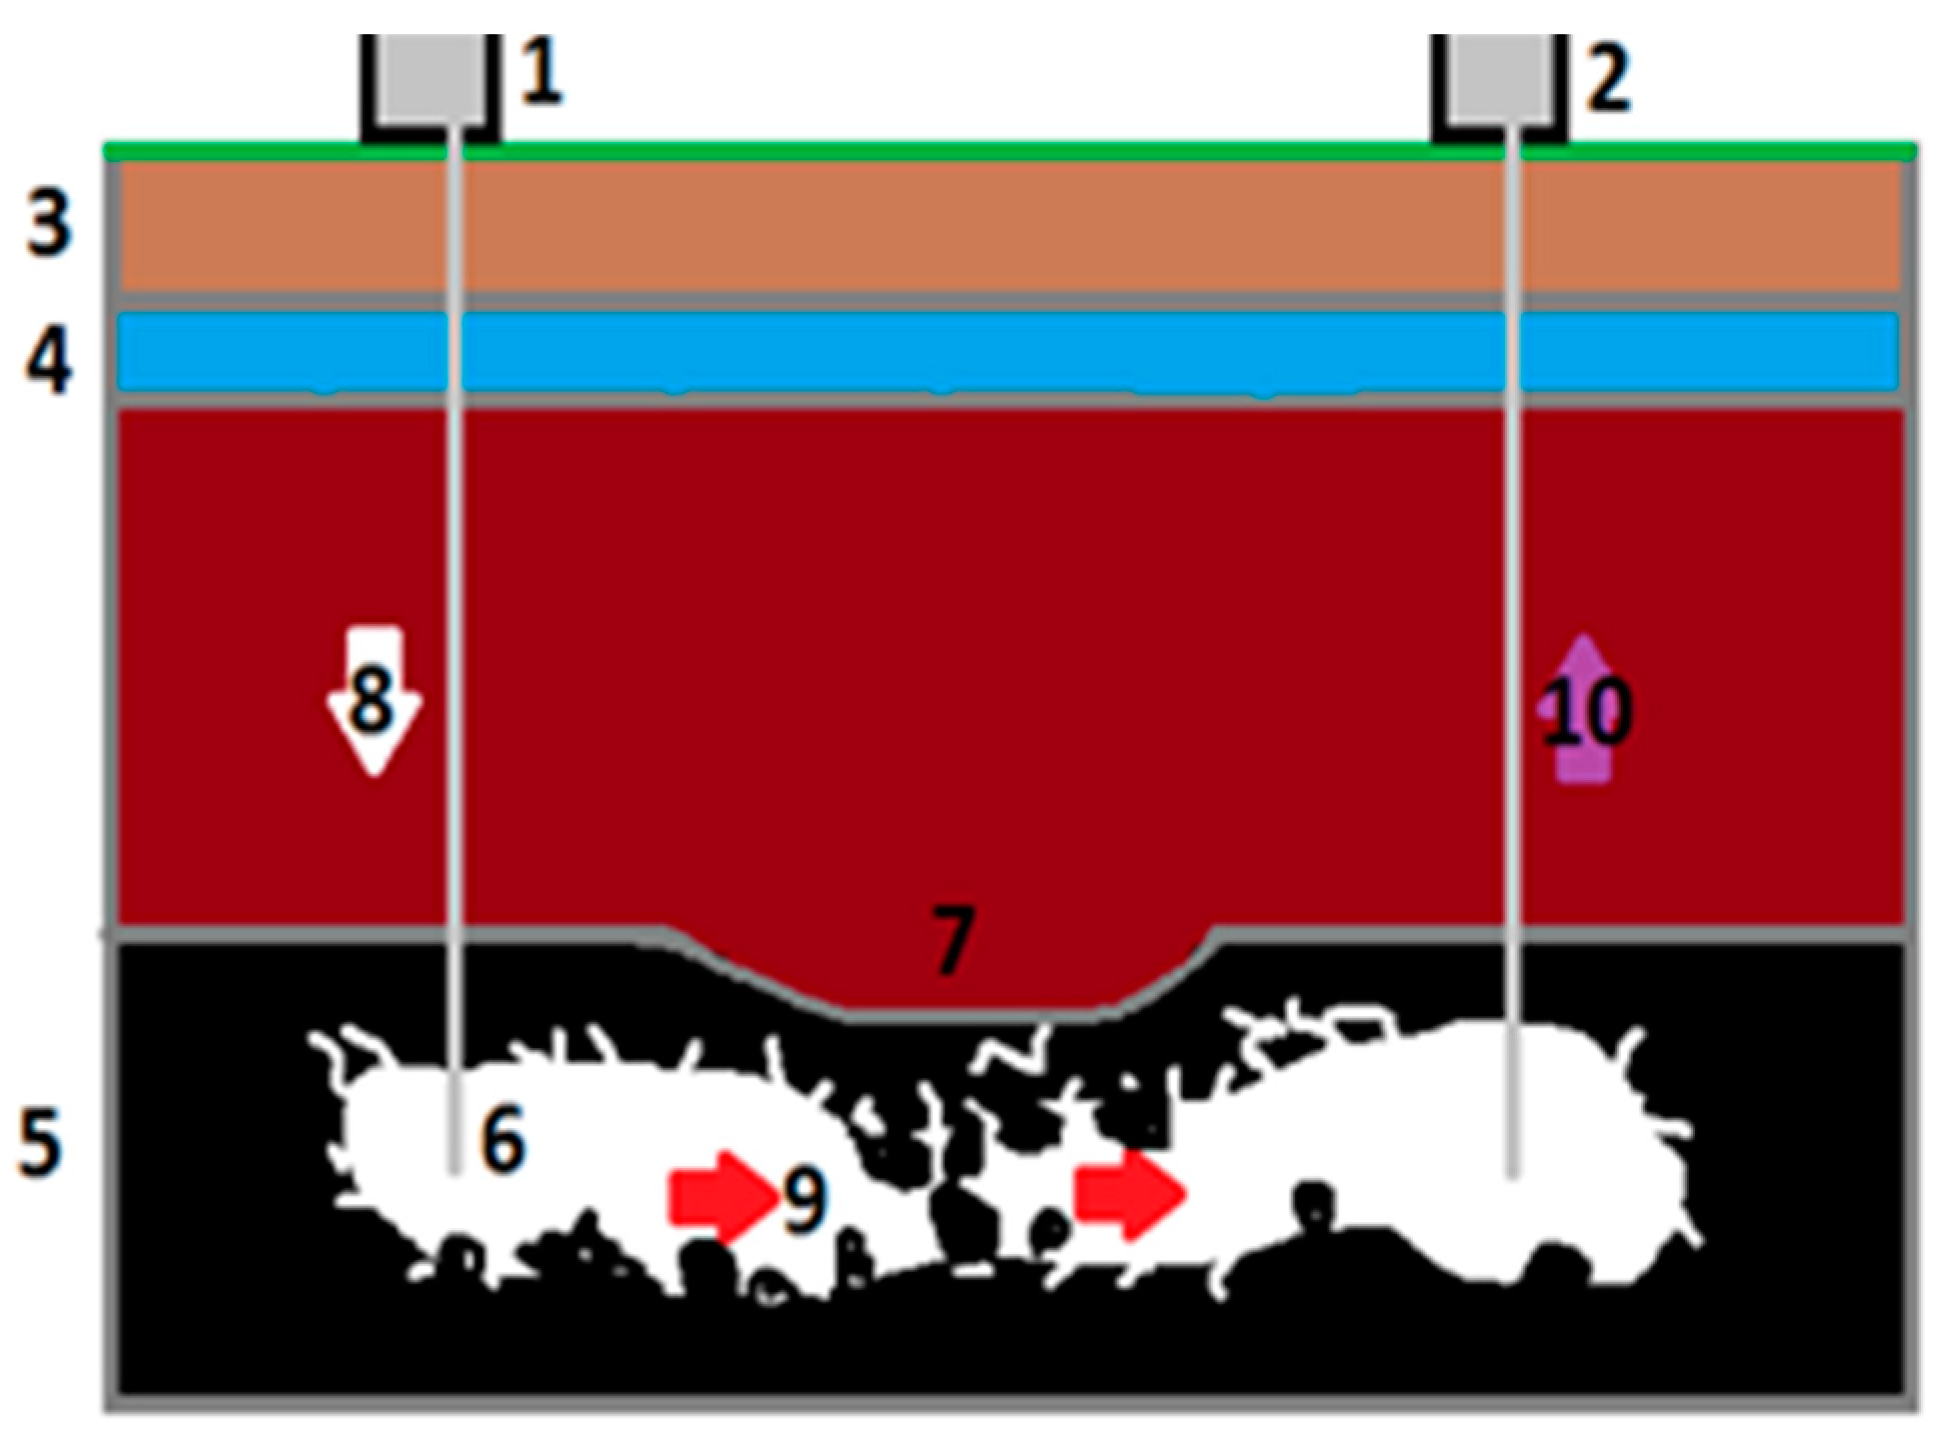
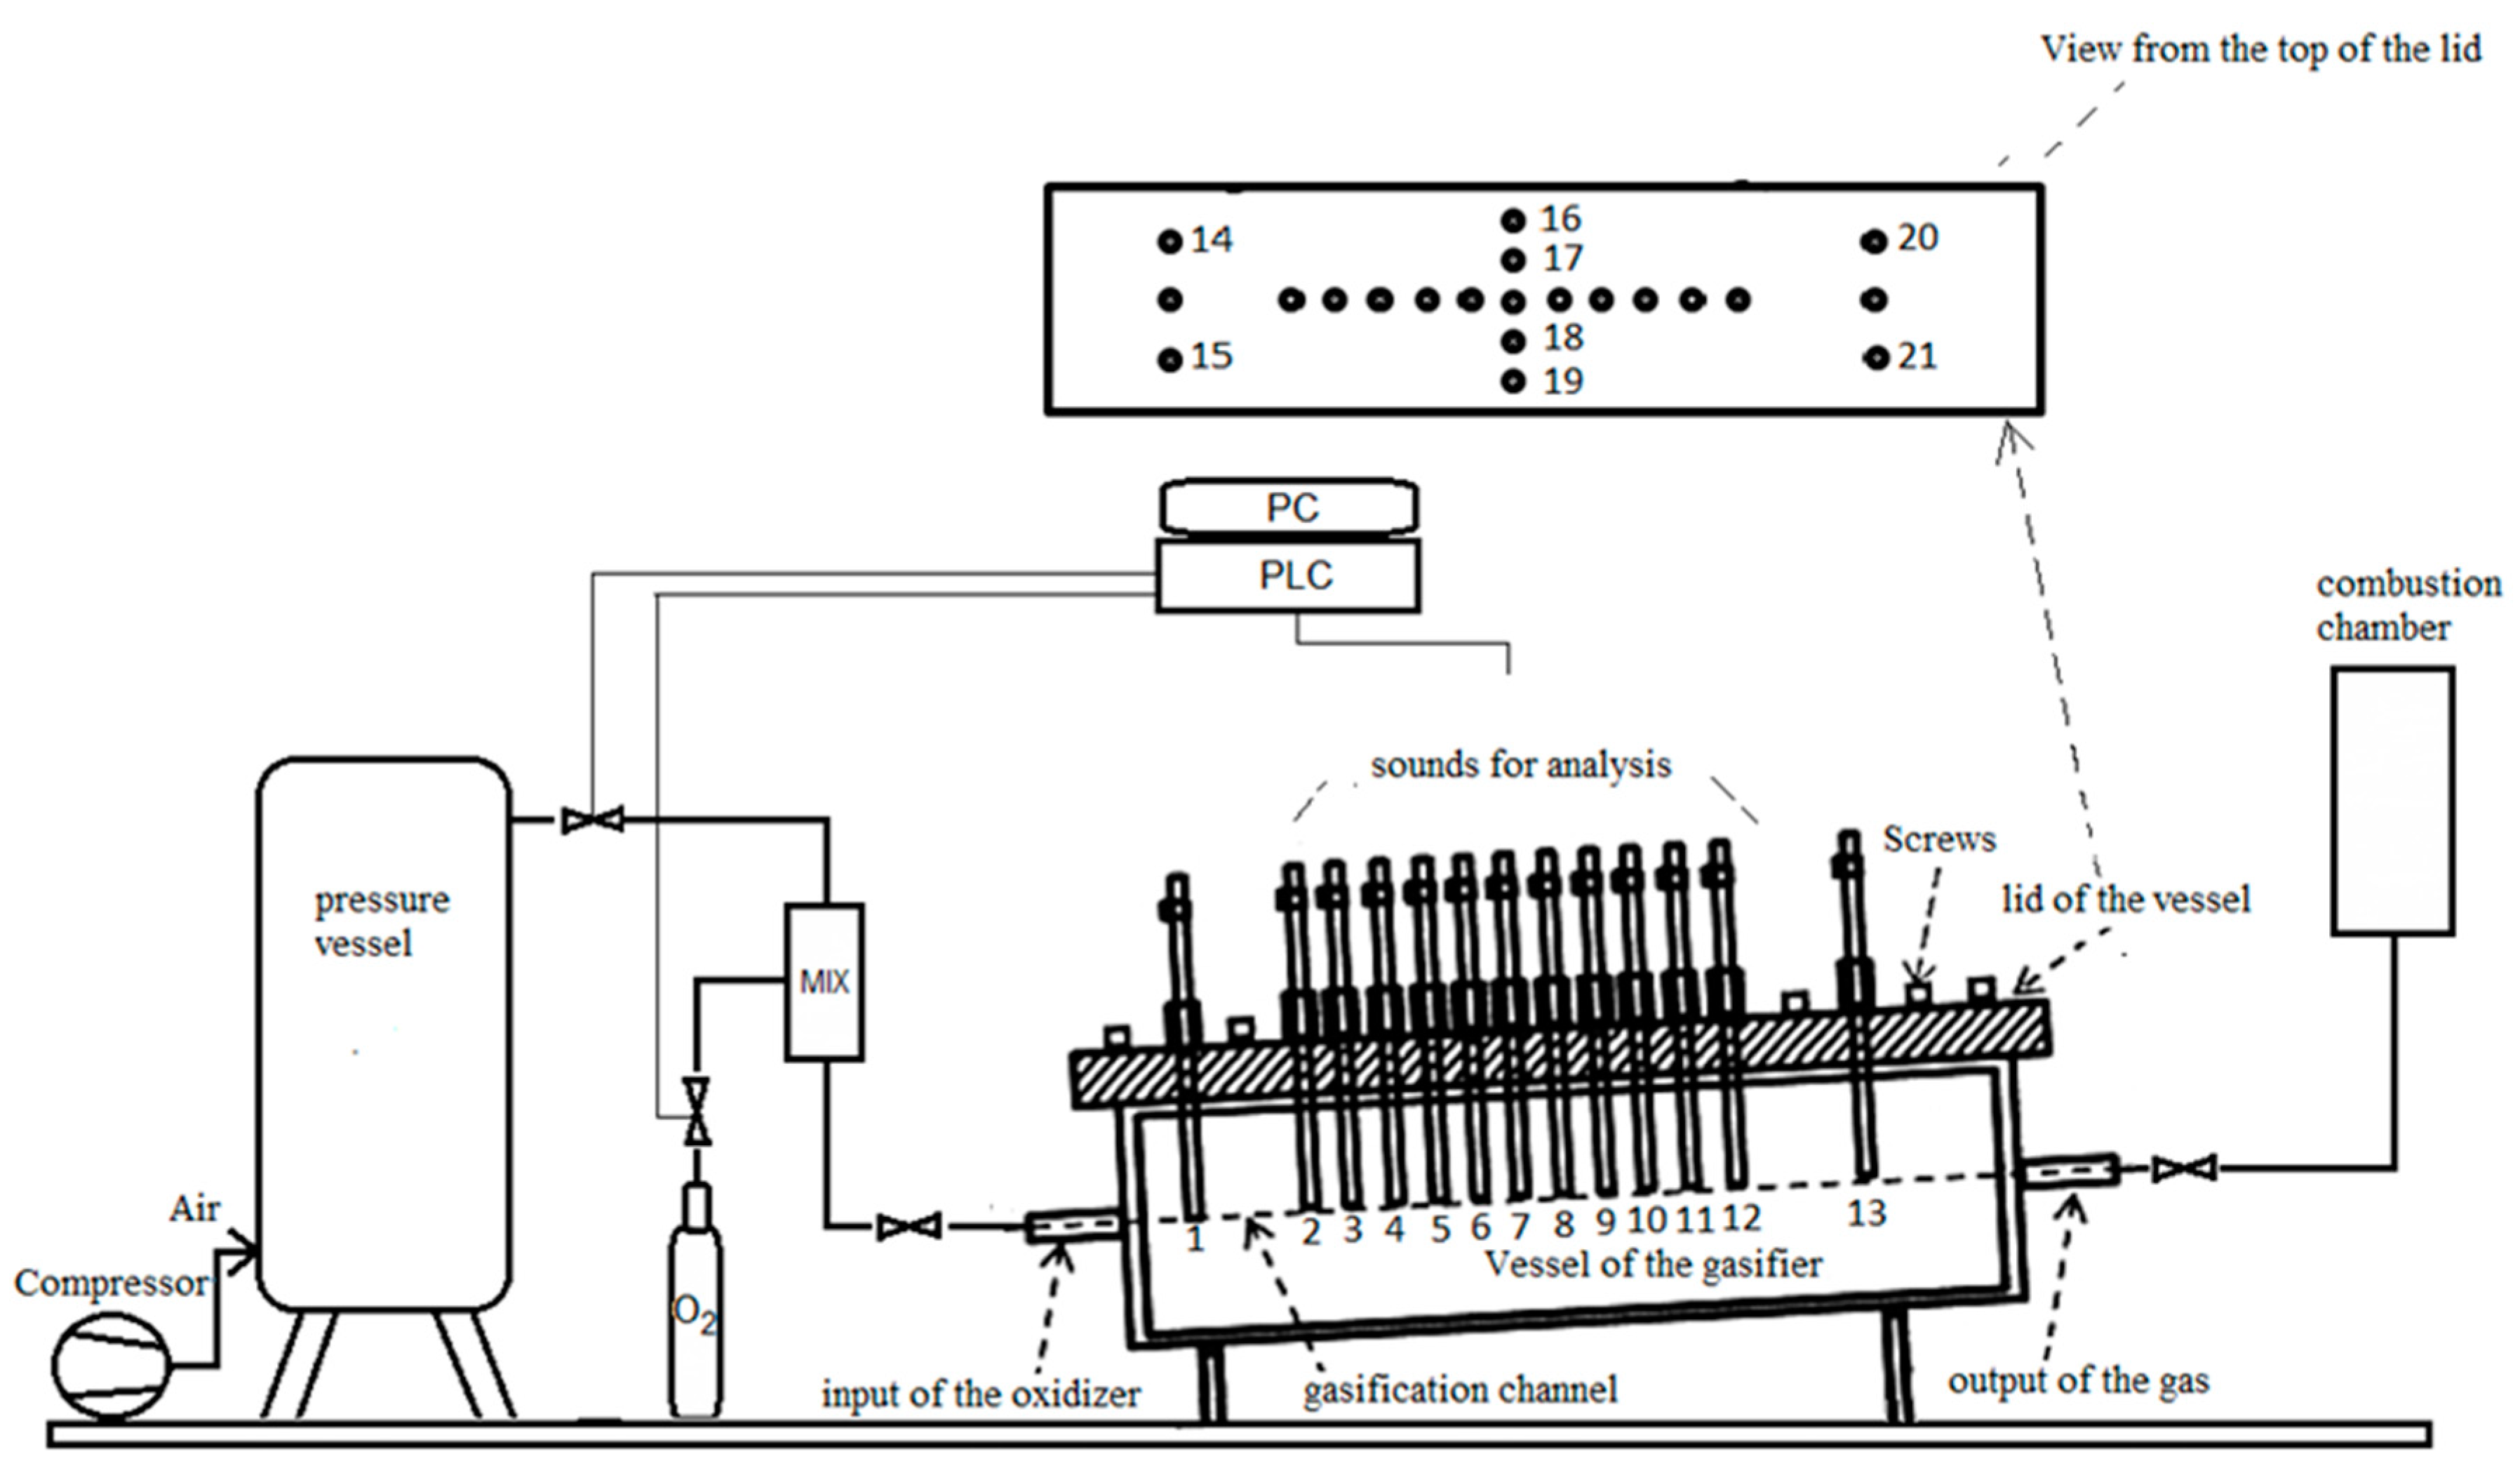
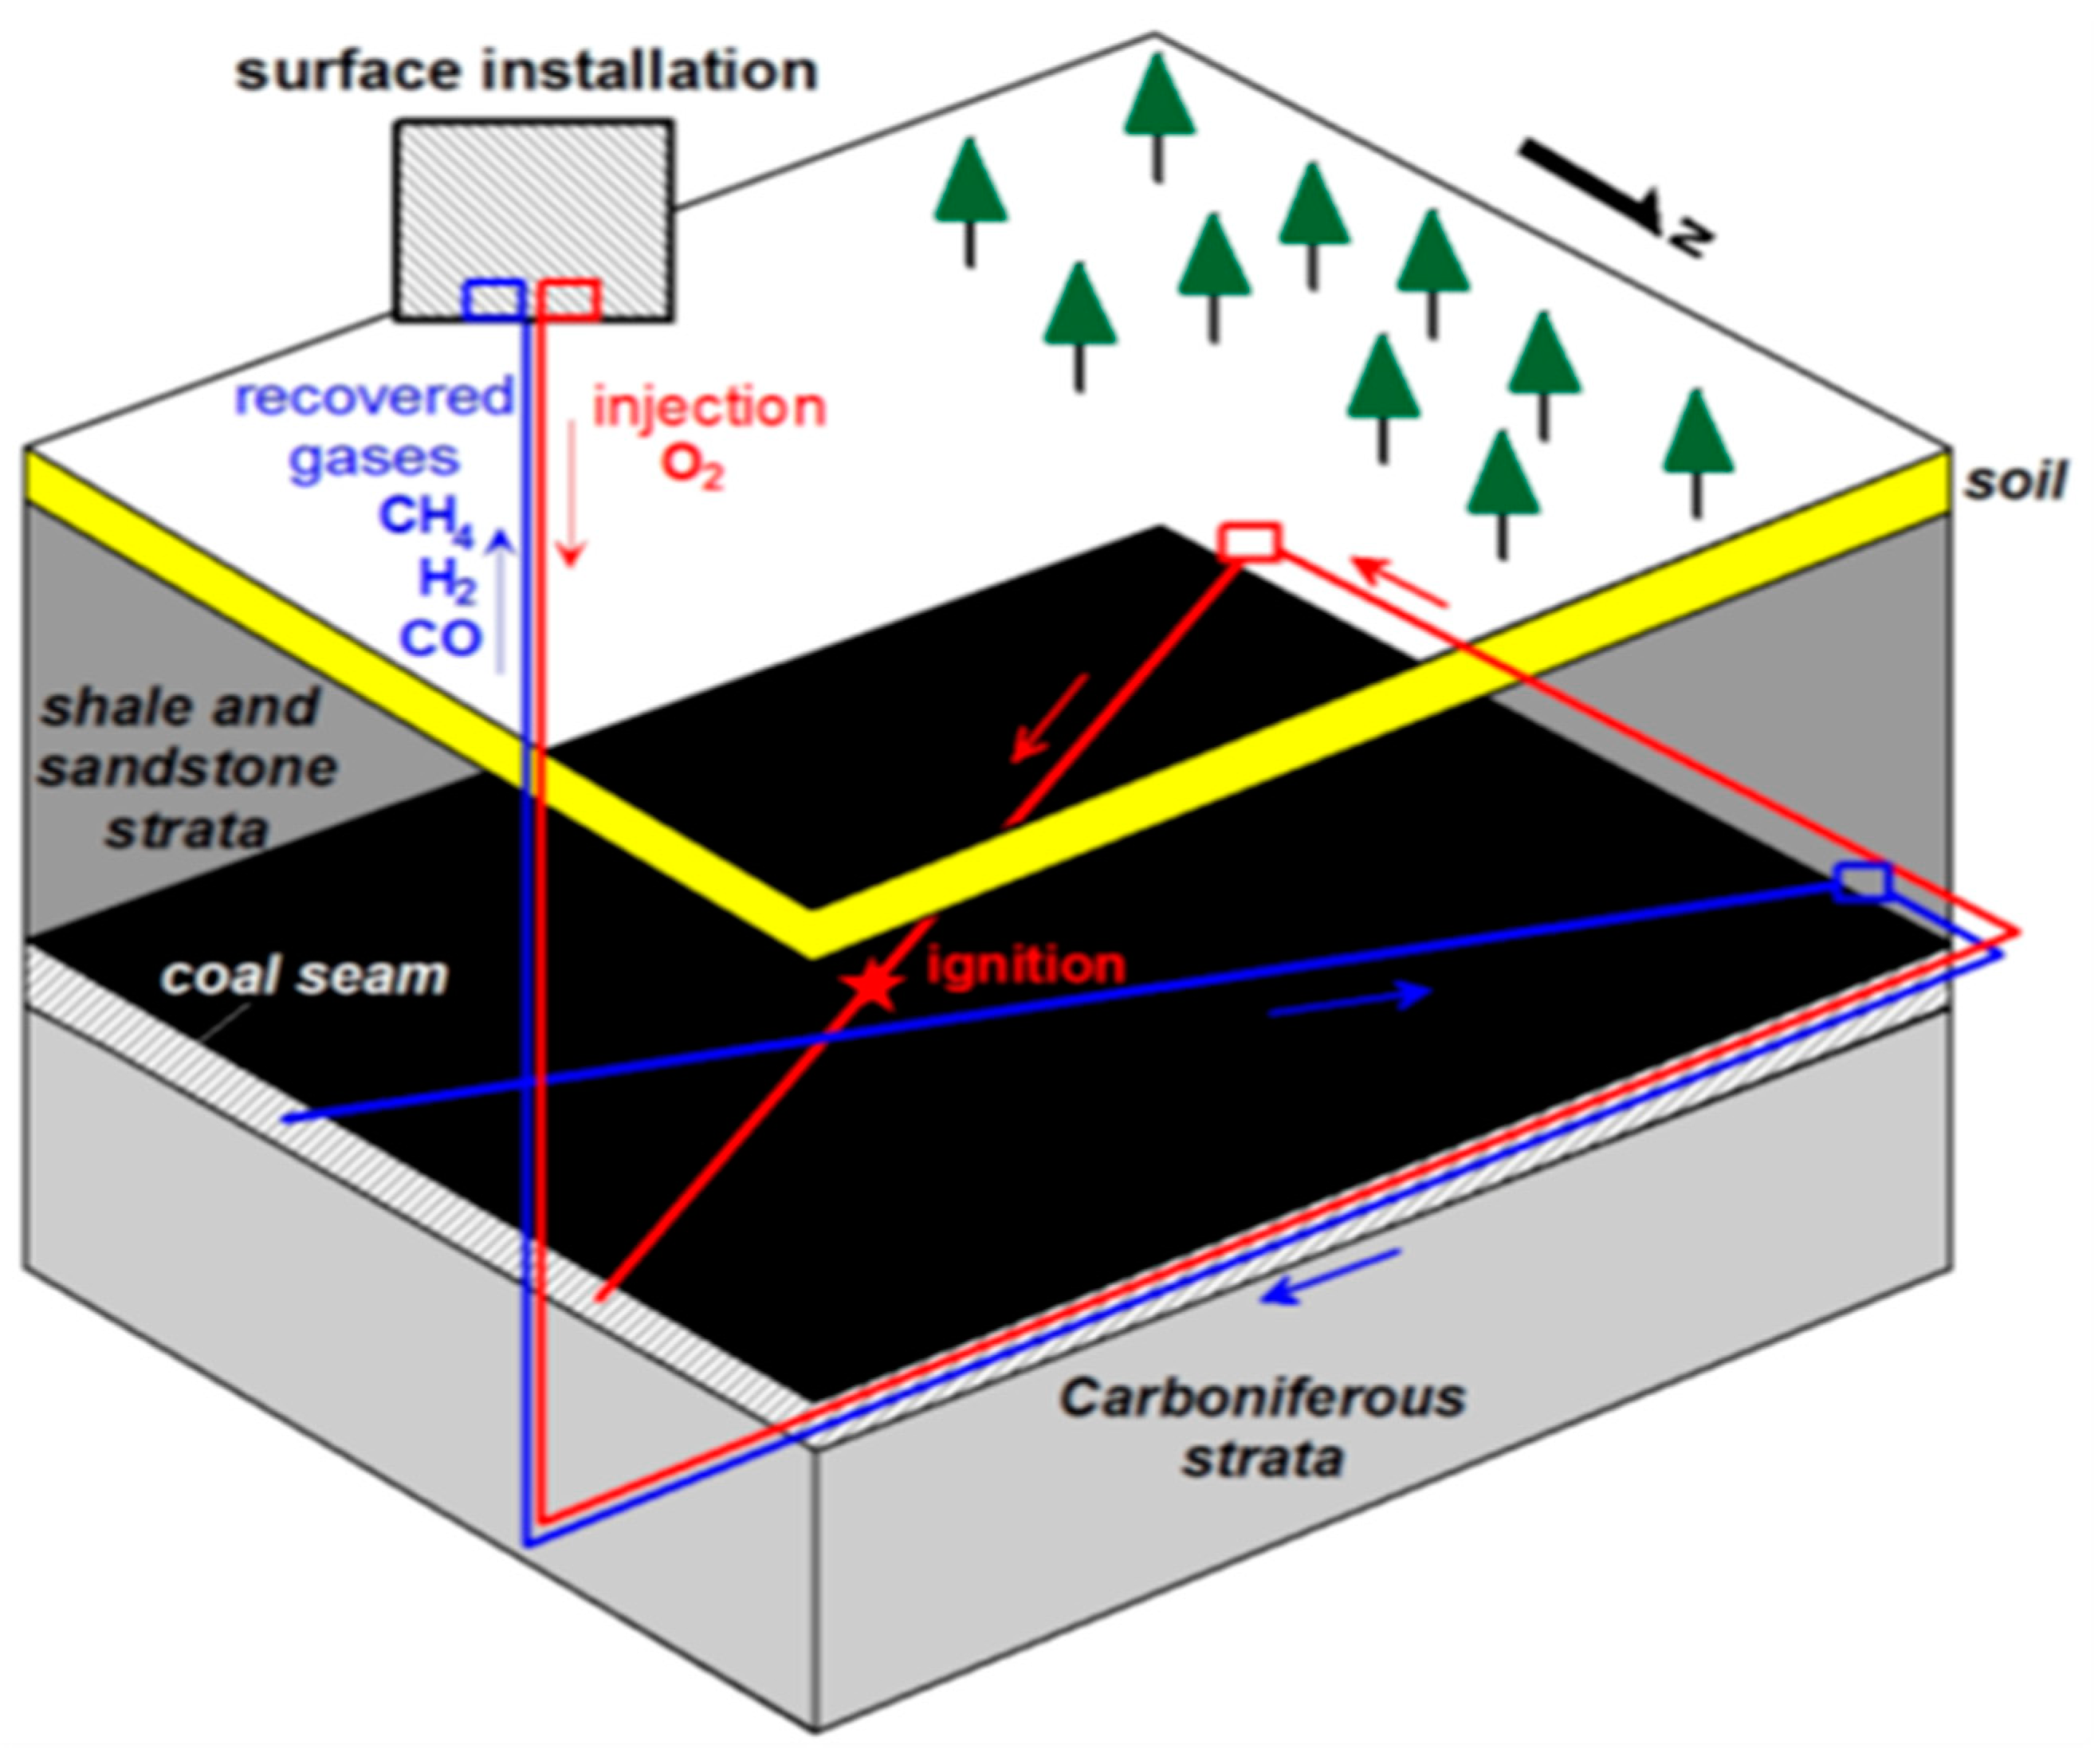
2.1.1. Description of Geo-Reactor and Process Gasification in Laboratory Condition

The experimental gasifier is shown in Figure 2. The geo-reactor ex situ is made of steel with dimensions 5 × 2 × 0.5 m and is used for holding original coal blocks. The planar dimensions of the steel overlay are the diminished by the scale of the potential gasifier angle slope and its slope is the same as the inclination of the coal deposit in question. The lower parts of the angular drilling blocks of the gas channel are placed in series along the geo-reactor. The brick blocks in the geo-reactor are surrounded by original rock, as it is in the potential gasifier underground. In other words, the substrate—underburned and overburden compositions are identical to the potential deposit. In the center of the generator structure, there is a ramp which represents a steel structure for holding the individual parts of the lid. The bottom side of the ramp is welded to the interior of the generator by steel tubes that protrude above the lid of the generator. These lockable tubes are for placing probes for the measurement of pressures, temperatures and syngas composition. Ignition takes place through the ignition opening using a gas burner that closes when ignition is completed. The oxidant is air, or a mixture of air with oxygen, or only technically pure oxygen. Air is pushed through a system of small compressors into a pressurized steel air container, the job of which is to maintain the required air pressure in the experimental generator. After the ignition of the coal, the UCG reaction gradually transforms natural coal to syngas. Finally, the outgoing syngas is burned in the combustion chamber and the exhaust gases are discharged into the atmosphere through the chimney. Two analyzers and a calorimeter were used for syngas analysis. The temperature inside various layers of the coal blocks and rock was measured with K type thermocouples. For experiments, the lignite from the Cigel mine was used. The Cigel mine is part of the Upper Nitra Coal Basin (Slovakia). The analysis of the coal from this mine is summarized in Table 1. The analysis of the coal sample was performed in an accredited laboratory.
Other UCG experiments have been performed in the Barbara experimental mine and at Wieczorek.

2.1.2. Characterization of Parameters of Geo-Reactor In Situ

The geo-reactor for conducting the UCG trail in the frame of HUGE-2 is in seam 310 at a depth of ca. 20 m at the Barbara Mine. Some measured results from Barbara and Wieczorek were found within the COGAR project [59]. The localization of the geo-reactor in the Barbara mine is shown in Figure 3. In this experiment, the gasification channel in coal seam had the shape of a letter “V”, the opposite of the channel in laboratory conditions. Technical analysis of coal for both experiments is shown in Table 2. Around the underground coal gasification experiment, Carboniferous strata are covered with a thin layer of Quaternary sediments of a thickness of approximately 1–2 m. Carboniferous formations show regular stratification and appear in form of beds of sandstones, mudstones, and shales
The geo-reactor for conducting the UCG is in seam 501 at a depth of ca. 450 m at Wieczorek. The geometrical model of the gasification channel was same as in the Barbara experimental mine.

2.2. Mathematical Modelling

The method proposed here was designed to dynamically simulate the impact of UCG development on the natural environment. The purpose of this part is to describe the mathematical models as tools for simulation and prediction of some impacts on rock strata, land and urban areas.

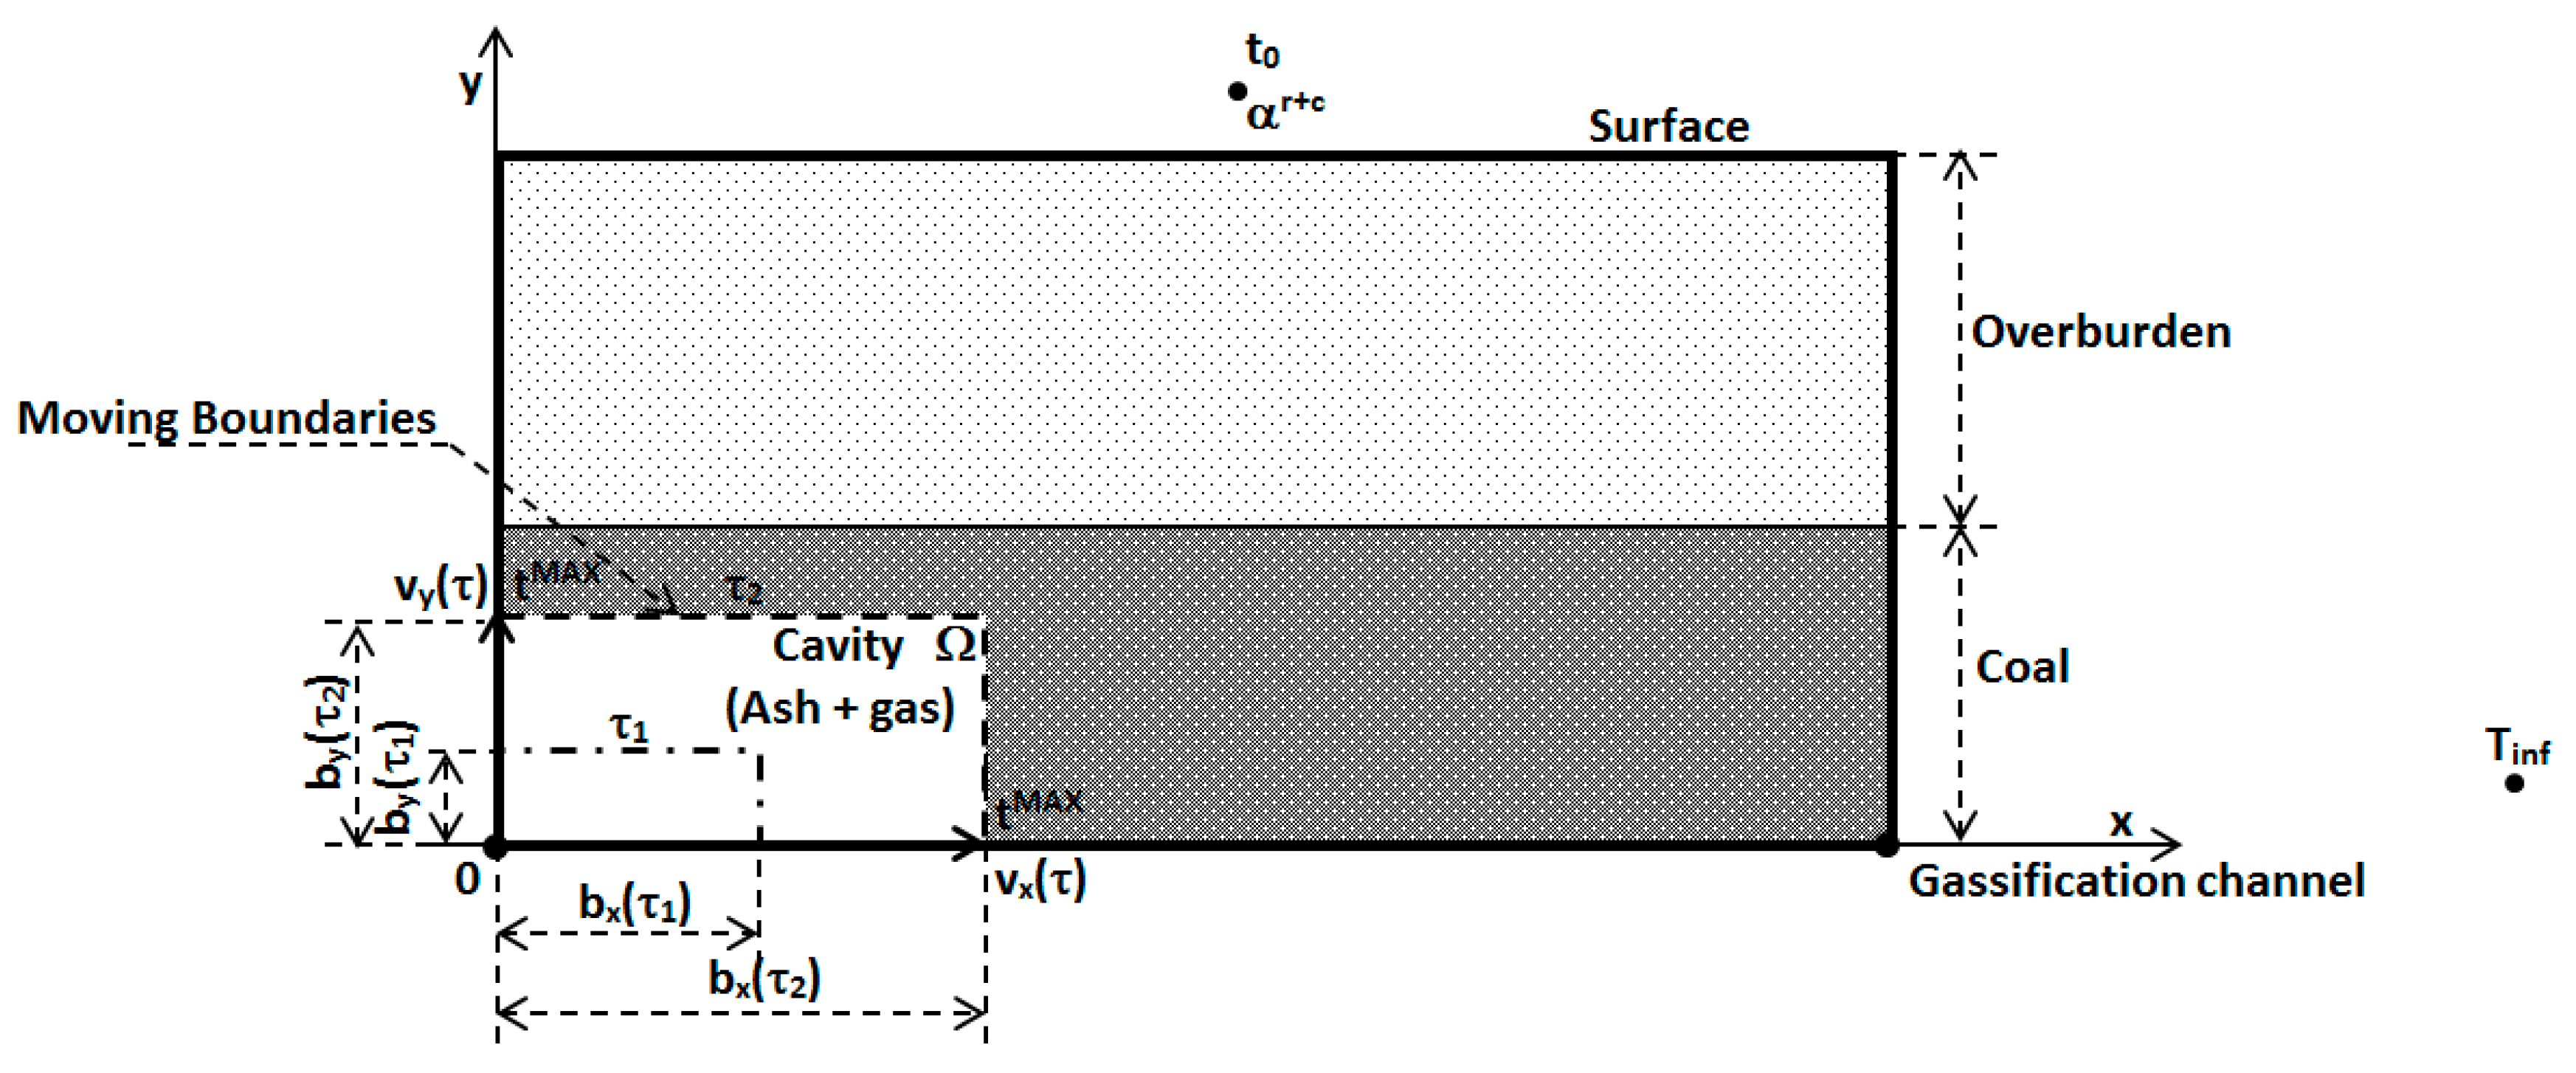
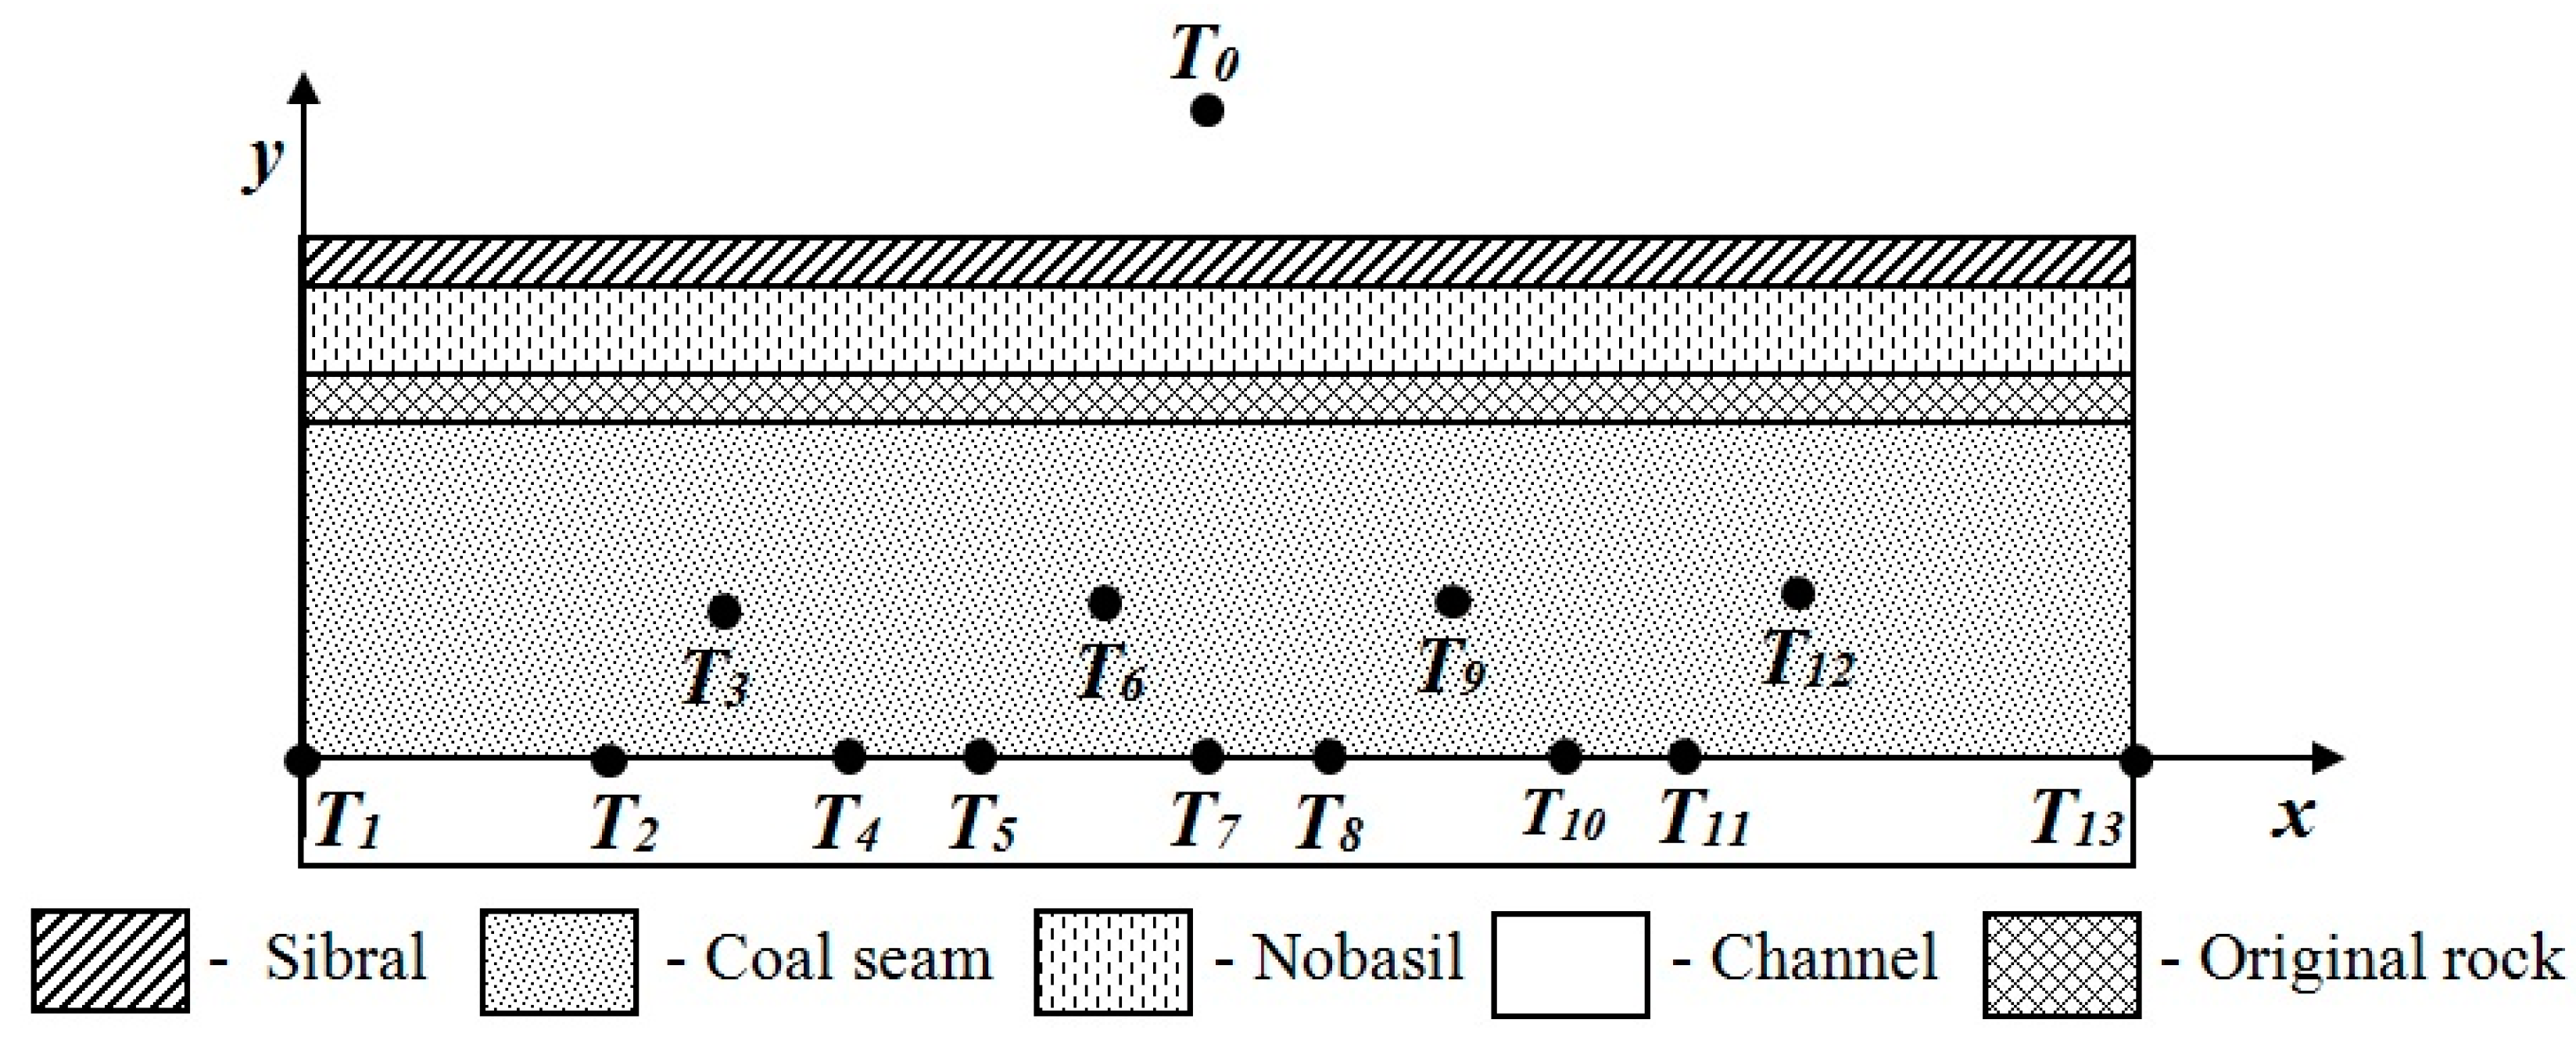
2.2.1. Mathematical Model for Two-Dimensional (2D) Temperature Fields

The thermal environment problem has attracted significant attention with the progress of urbanization [61,62] and it has received extensive attention from scholars for both the indoor and outdoor thermal environment [50,62,63,64,65]. The internal heat source at UCG influences the temperature field in the overburden. The objective of this part for is to determine the mathematical models which describe 2D temperature fields (2D-length and height) in the coal and the overburden during and after UCG. Based on a mathematical model, a specific programing language for supercomputers was used to create the simulation model (software). The supercomputers had to be used because the simulated area (2D temperature fields in the coal and the overburden) by numerical method (elementary balances) is huge as is the computing time with standard computers. The simulation model is a suitable tool for calculating temperatures and heat flows to the surface during and after UCG trials. UCG is a heat source underground which influences the temperatures in its surroundings. This source is reason for increasing temperatures in the rock mass around the coal gasifier. Geotechnical properties (tensile strength, elastic module, axial compressive strength …) decrease with increased temperature and therefore there is a risk of subsidence of the surface above the UCG reactor. The compressive strength (CS) of the sandstone decreases gradually with an increase in temperature up to 400 °C. Above 400 °C, CS is a sudden reduction (from 38 MPa to 20 MPa). Subsequently, UCS gradually increases when temperature is increased from 600 °C to 800 °C. This heat sources in shallow coal seam (e.g., Barbara mine) can increase surface temperatures T ( x , y ) . Heat flow “ q ” from the UCG cavity can influences soil humidity (agriculture), lakes (fishing), the stability of buildings, etc. Therefore, it is necessary to develop mathematical models to predict these increased temperatures at least minimal in two dimensions, meaning in the direction of the gasification channel and to the surface “ x ” and “ y ” respectively. Heat transfer from cavity of the coal gasifier is possible in the following forms:
  • by conduction,
  • by radiation,
  • by convection.
The mathematical model in this study is formulated on base following simplifying assumes:
  • Heat transfer by convection in the y axis direction is very low because the permeability of rocks underground is too small for gas streaming. Its heat capacity is very small in comparison with heat capacity of overburden.
  • Heat transfer by radiation and convection in the “ x ” axis direction has meaning only in the gasification channel. Mathematical model is solved by using first boundary condition which is defined by measured temperature on interface gasification channel—coal.
  • Thermo-physical parameters are considered as average values in assumed temperature interval.
  • Therefore, heat transfer around coal gasifier is limited to conduction.
Heat transfer as non-steady process by conduction is described by solving Fourier's partial equations for the solid phase (coal + rock).
( ρ j c j t j ) τ = ( λ j t j x ) x + ( λ j t j y ) y   f o r   j = 1 , , L
where c is the specific heat capacity [J·kg−1·K−1], ρ is the density [kg·m−3], x ,   y are the coordinates [m], t is the temperature [°C], λ is the thermal conductivity [W·m−1·K−1], τ is the time [s], j is the index of j th layer.
The specific capacity and thermal conductivity of mudstone and sandstone present decrease with increasing temperature but the decrease is not obvious [66]. To make it simpler, we assume that specific capacity and thermal conductivity of coal, mudstone, sandstone and other kinds of rock are invariable with the changing temperature, and take average values under different temperatures [67,68]. Based on the system Equation (1) is possible to solve each layer in overburden including of coal. It means that the mathematical model for coal and overburden consists of L layers (coal, sandstones, claystones, …). The system Equation (1) is solved at initial conditions which are defined by the temperature gradients between surface and coal in the form (2)
t j ( x , y , 0 ) = t j i n i t i a l ( x , y )   f o r   j = 1 , , L
Boundary conditions are defined for surface (3) as Newton condition (third type), vertical section in the infinitive as the first type by using (2), by the boundary condition (4th type) for internal surfaces between layers and for internal surface of UCG cavity in horizontal direction (bottom) is defined as first type condition (4)
λ L t L y | y = y L = α r + c [ t ( x , y L , τ ) t 0 ( τ ) ]
t ( x , 0 , τ ) = t ( x m e a s u r e d , 0 , τ )   f o r   x = x m e a s u r e d
where α r + c is the total coefficient of heat transfer from the surface to the surroundings by convection and radiation, t 0 is the atmosphere temperature, h k is the thickness of the k th layer, x m e a s u r e d is the coordinate of measured temperature at the coal point near the gasification channel.
We cannot measure this temperature at each point (infinitive points) along gasification channel because x m e a s u r e d is a moving coordinate in condition (4). Its speed is approximately the same as the velocity of motion of the gasification front. The coordinate of amplitude temperature t a in measured line is given by (5)
x ( τ ) = τ x ( t m a x ) τ
where x ( t m a x ) τ is the velocity of motion of maximum temperature in the measured line, t m a x is maximum measured temperature at the gasification front.
Then temperatures at point x at some time τ on gasification front are defined by (6).
t ( x , 0 , τ ) = t a ( x ( τ ) , 0 , τ )   f o r   o t h e r   x
Finally, the boundary condition in direction x from measured temperatures in continuous form is given by (6). Similarly, the boundary condition in direction y is defined using the measured velocity and maximum temperature in this direction. However, coal gasification is an internal heat source which moves through the coal as a gasification front. The move of gasification front is considered in one gasification channel because by aim is to create a 2D model. The combustion cavity can have various shapes depending on the UCG methods used [69]. Boundary conditions of the heat source are defined based on the assumption that the cavity is formed in a rectangular shape. The ignition point is taken as the beginning of the coordinate system. The velocity of the movement of gasification front is stated as v x , v y (7), (8) in the directions x and y respectively. As applied to rock strata for coal gasifiers in experimental mines, the meaning of main parameters is shown in Figure 4. Part of the coal is transformed to syngas and ash after a time “ τ ”. The dimensions of the cavity ( b y × b x ) are smaller in τ 1 than in τ 2 for τ 1 < τ 2 . The moving boundaries of cavity Ω are shown by broken lines in Figure 4. The coordinates of borderlines are given by velocities v x , v y in each moment. The temperature of these borderlines is defined by condition of first type (9).
v x = x ( t m a x ) τ
v y = y ( t m a x ) τ
t ( Ω ) = t m a x
The moving boundaries Ω (see Figure 4) are caused by the movement of the gasification front inside the coal seam.
For the verification of the described mathematical model a simulation model was created that simulated the heat transfer process of underground coal gasification in laboratory conditions (see geo-reactor in Section 2.1.1). The localization of thermocouples, surrounding rocks and coal in cross section is depicted in Figure 5. Places of the temperature measurement are schematically depicted using thermocouples in the Generator (temperatures in the channel—T1, T2, T4, T5, T7, T8, T10, T11, T13, temperatures in the coal seam—T3, T6, T9, T12 and atmosphere temperatures T0) during gasification experiment. Sibral and nobasil are insulating materials to prevent the thermal loss to the environs. The gasification channel was created using the following method: coal blocks drilled in the longitudinal direction were bonded into the monolith and laid in the laboratory gasifier. The thickness of the experimental coal blocks was 0.35 m. The ignition of coal was at absolute zero point.
The inputs into the simulation model were directly measured atmosphere temperature (T0) and channel temperatures. The time dependence for velocity vector v ( v x , v y ) was defined by measuring of the movement of the gasification front. Output from simulation model was the indirectly measured (predicted) temperature in the coal seam with the simulation model. After the experiment the indirectly measured temperature was compared with the directly measured temperature from experiments performed and the precision of the mathematical model was determined. The comparison of the directly measured temperature with the predicted temperature using the simulation model with thermocouple T3 is shown in Figure 6. There is maximum relative deviation between predicted and measured temperature of 22% at the 52nd h. This maximum relative deviation could be caused by coal combusted collapse from roof subsidence at the thermocouple during short time because the relative deviation was 2.8% on average in this experiment. The deviation between 30 and 40 h is probably caused by a jump change of measured temperature by thermocouple T3.

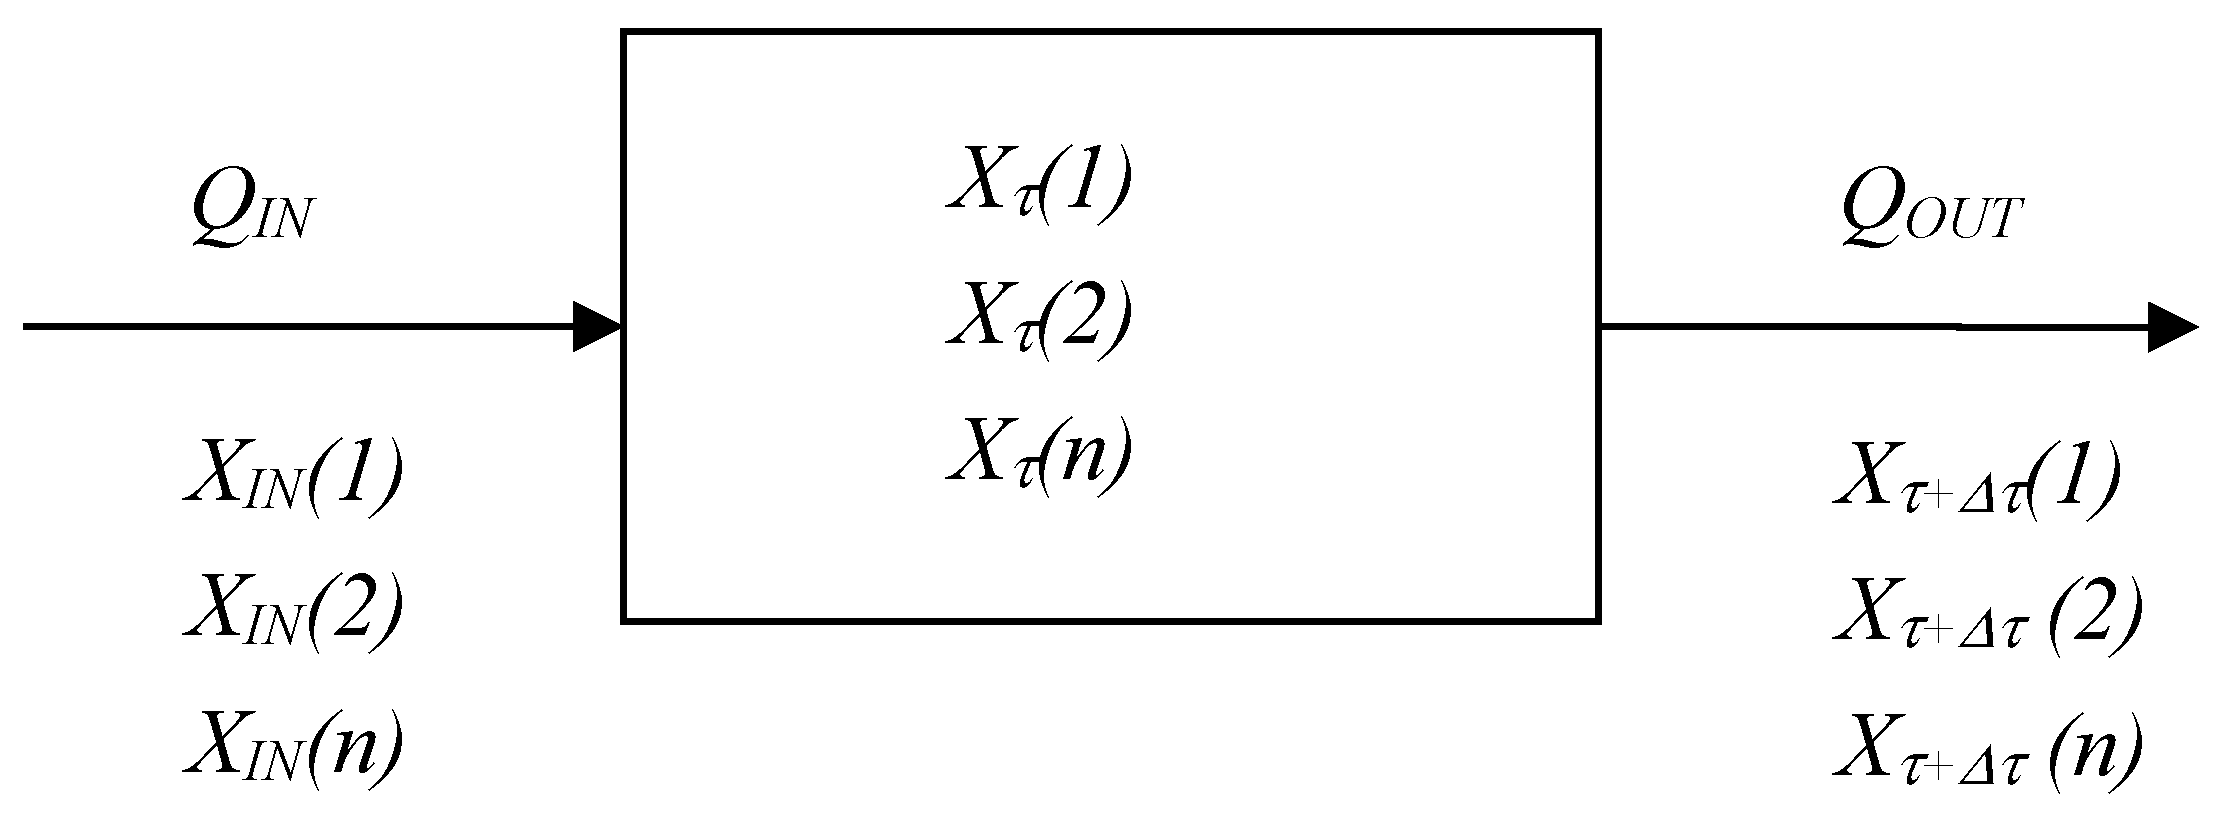
2.2.2. Mathematical Model for Mixing of gases

This model aims to predict the composition of the syngas mixture with air because this mixture can be dangerous. The principle of the model for mixing of gases is shown on Figure 7. The model is based on the solution of a system of differential equations. The equations represent the changing volume of the gas component for changing concentrations of the gas in element. The presented model is simplified and considers with constant pressure, constant temperature and ideal conditions for mixing of gases.
d V 1 d τ = Q I N · X I N ( 1 ) Q O U T · X ( 1 ) d V 2 d τ = Q I N · X I N ( 2 ) Q O U T · X ( 2 ) d V n d τ = Q I N · X I N ( n ) Q O U T · X ( n )
where X ( 1 ) is the concentration of the first component of the internal gas element, X I N ( 1 ) is the concentration of the first component of inlet gas, X ( n ) is the concentration of the n-th component of the internal gas element, X I N ( n ) is the concentration of the n component of inlet gas, Q I N is volume flow of the input gas, Q O U T is volume flow of the output gas, V is volume of element.
Balance equation
d V τ = d V 1 τ + d V 2 τ + + d V n τ
After mathematical modification of the system we obtain the following system of differential equations:
d X ( 1 ) d τ = ( Q I N · X I N ( 1 ) Q O U T · X ( 1 ) ) · 1 V d X ( 2 ) d τ = ( Q I N · X I N ( 2 ) Q O U T · X ( 2 ) ) · 1 V d X ( n ) d τ = ( Q I N · X I N ( n ) Q O U T · X ( n ) ) · 1 V
Figure 8 shows a preview of the simulation model for mixing of gases. In the top left corner the form for entering the input data is shown and in the bottom right part the graphic output is shown. In the chart you can see a change in the concentration of individual gas components for the element over time.
Use of the simulation model for the UCG process can be divided into two parts. In the first part we focus on the possibility of explosion caused by a leak of syngas. The second part of the simulation studies CO poisoning. Using a mathematical model for syngas streaming through porous media, syngas flows from the UCG cavity into different cuts of the overburden are calculated including earth surface to the surroundings [47]. Values of the volume flow of syngas calculated by mathematical model of syngas streaming were used as inputs into the model for mixing of gases to determine the critical time for explosion and for CO poisoning.

3. Results

3.1. The Heat Influence of UCG on Overburden

For the verification of the mathematical model described in Section 2.2.1 a simulation model was created that simulated the process of heat transfer from the underground coal gasification in the created physical model (laboratory conditions) and a real coal seam. An explicit method was used to solve this mathematical model. A simulation model (software) for the described boundary conditions and numerical solution was created in the programming language C. The first version of the simulation model was created on a standard PC. It required a lot of computing time due to the large scale of the temperature field solved (for example multiple 1040 × 1500 matrices, 1040—number of elements in the direction axis y , 1500—number of elements in the direction axis x ). For these reasons new methods were chosen (parallel algorithms) as well as supercomputers.
The results of indirect measurement of temperatures in surrounding underground gasifier for the Barbara experimental mine and Wieczorek experimental mine were obtained by the last version of simulation model, which was built in accordance with a mathematical model which is described in Section 2.2.1. Inputs for the simulation model were defined as follows.
The initial temperature condition is given by the temperature gradient [70] for the region of Katowice. The formula for calculating the rock mass temperature in Barbara and Wieczorek coal mines:
T = ( h 25 ) 1 33 + 7.5   ° C
where h —depth from surface [m].
Thermal—physical parameters (density, heat conductivity and specific heat capacity) were selected by the structure of individual layers of the coal seam and overburden. The values for individual layers are shown in Table 3. The thermal—physical parameters of the coal layers were replaced by thermo-physical parameters of ash after gasification of each coal element without taking into account the influence of the oxidizer.

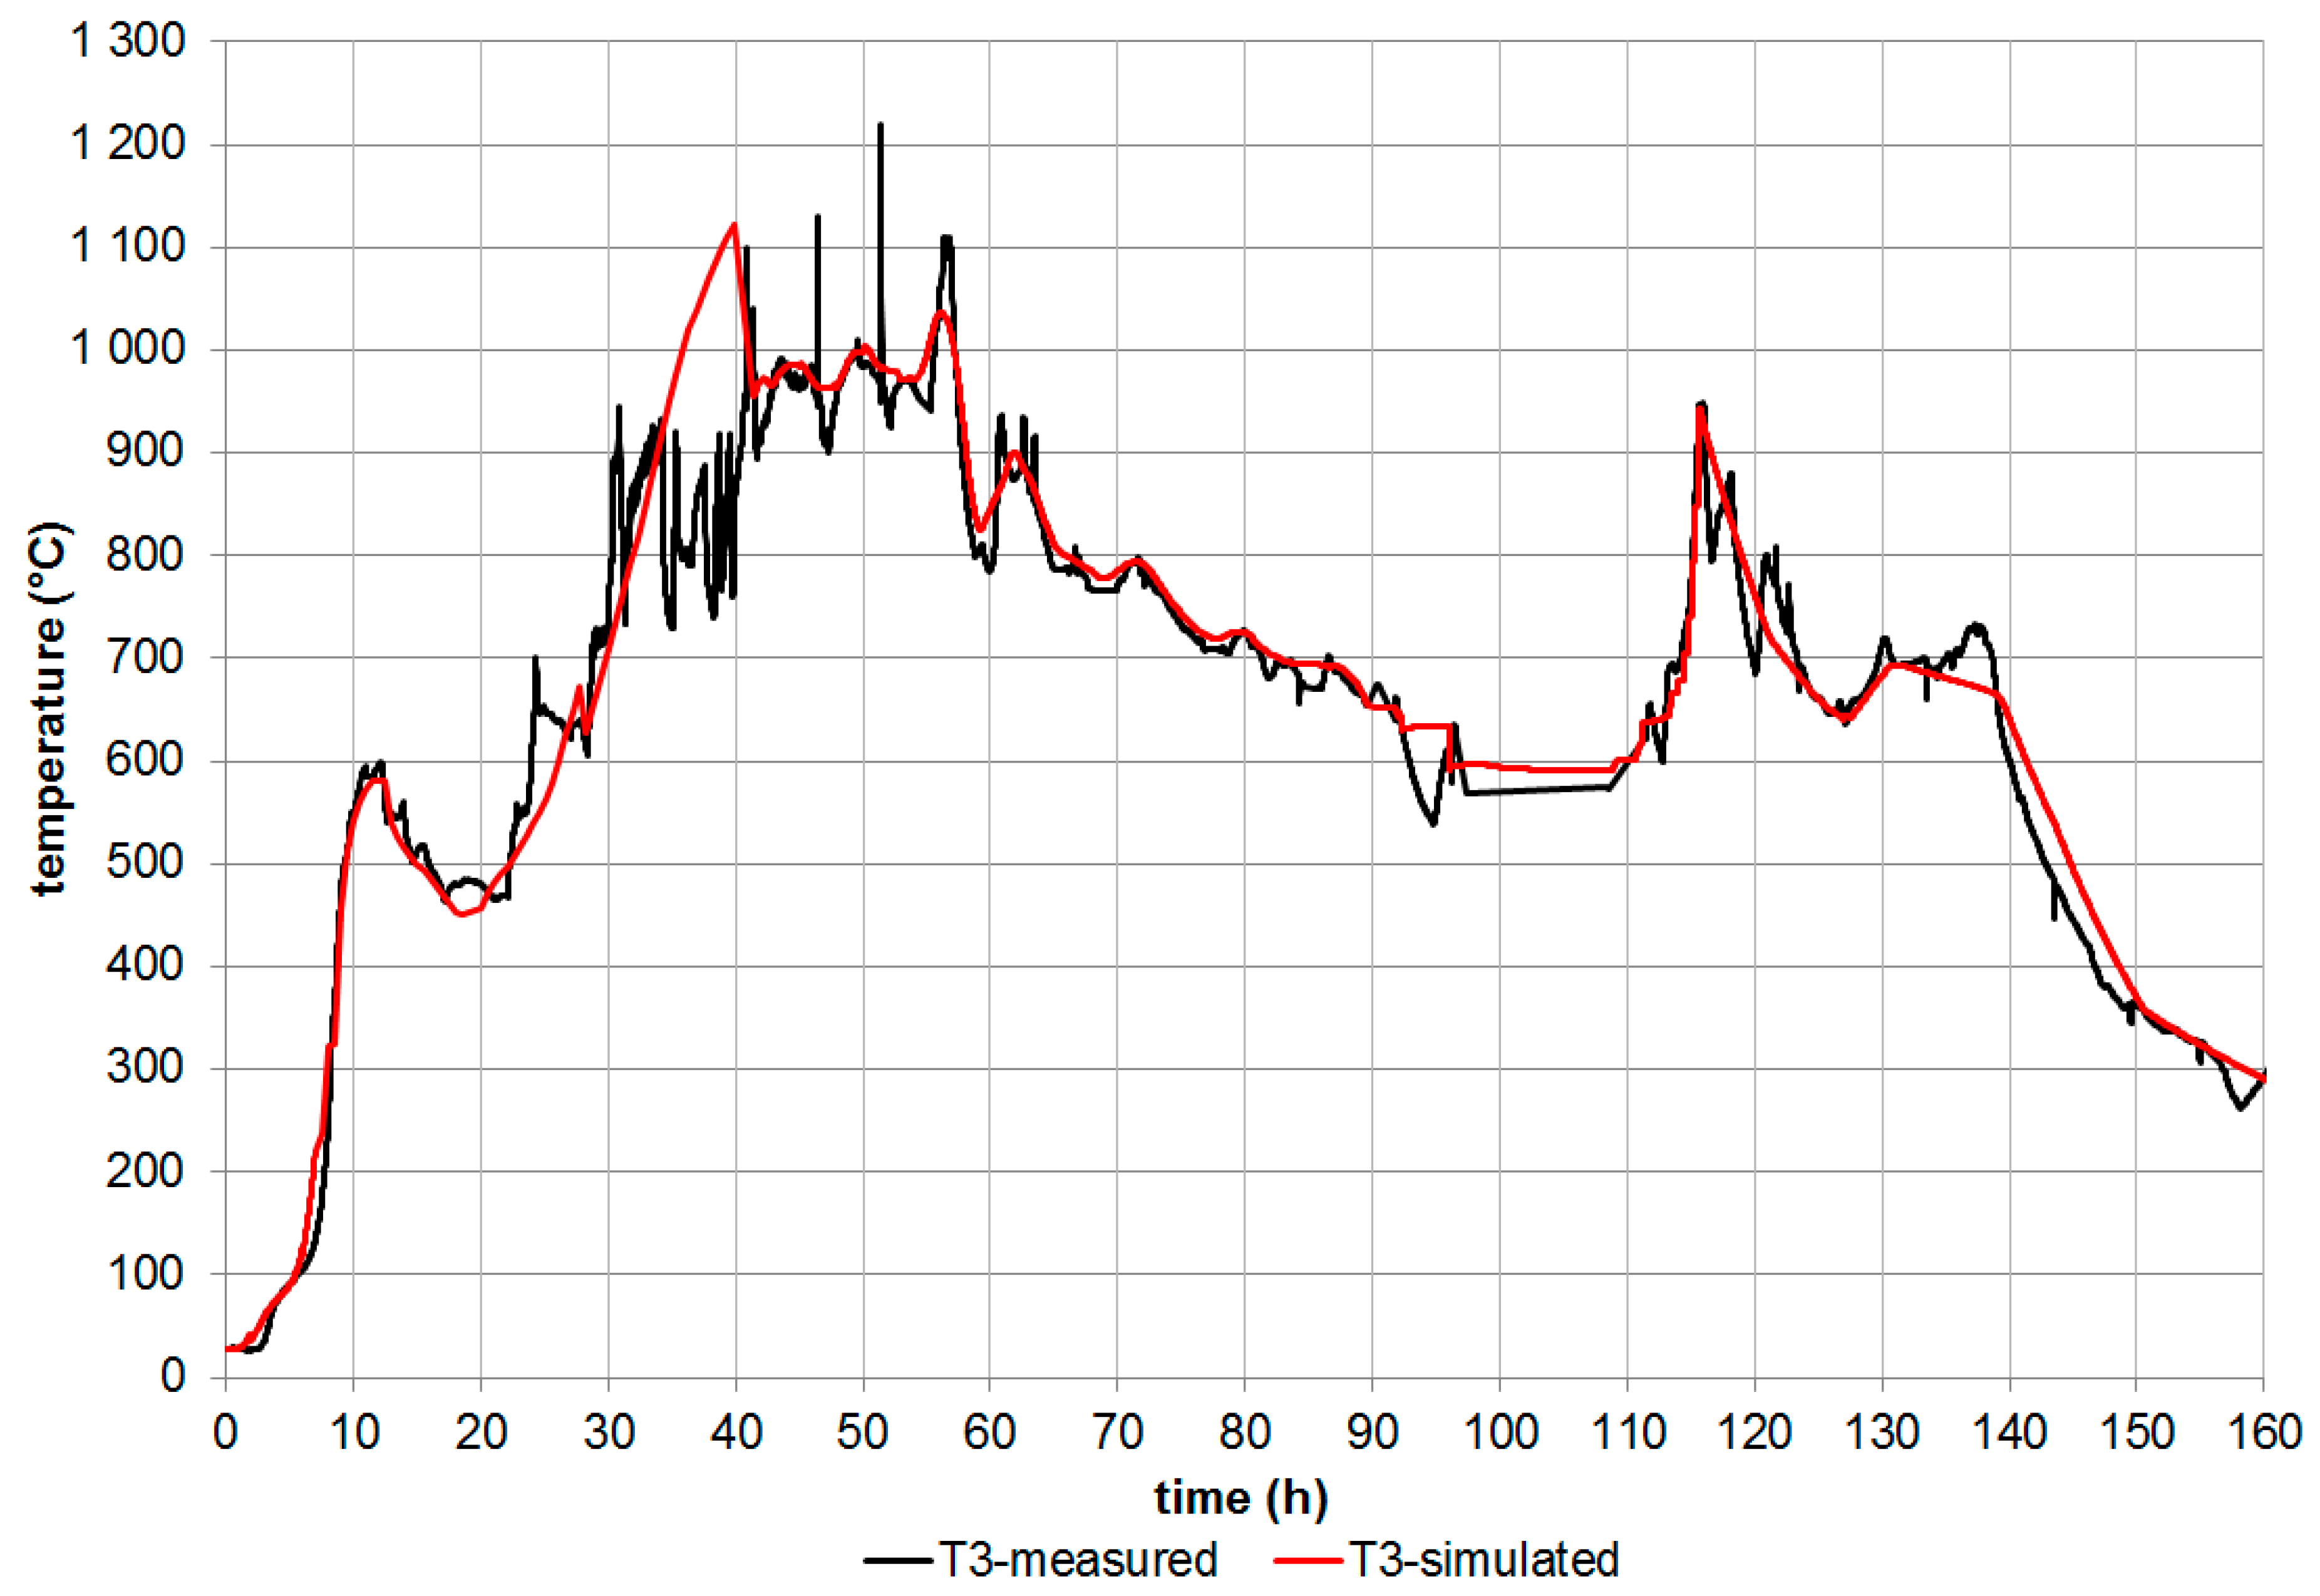
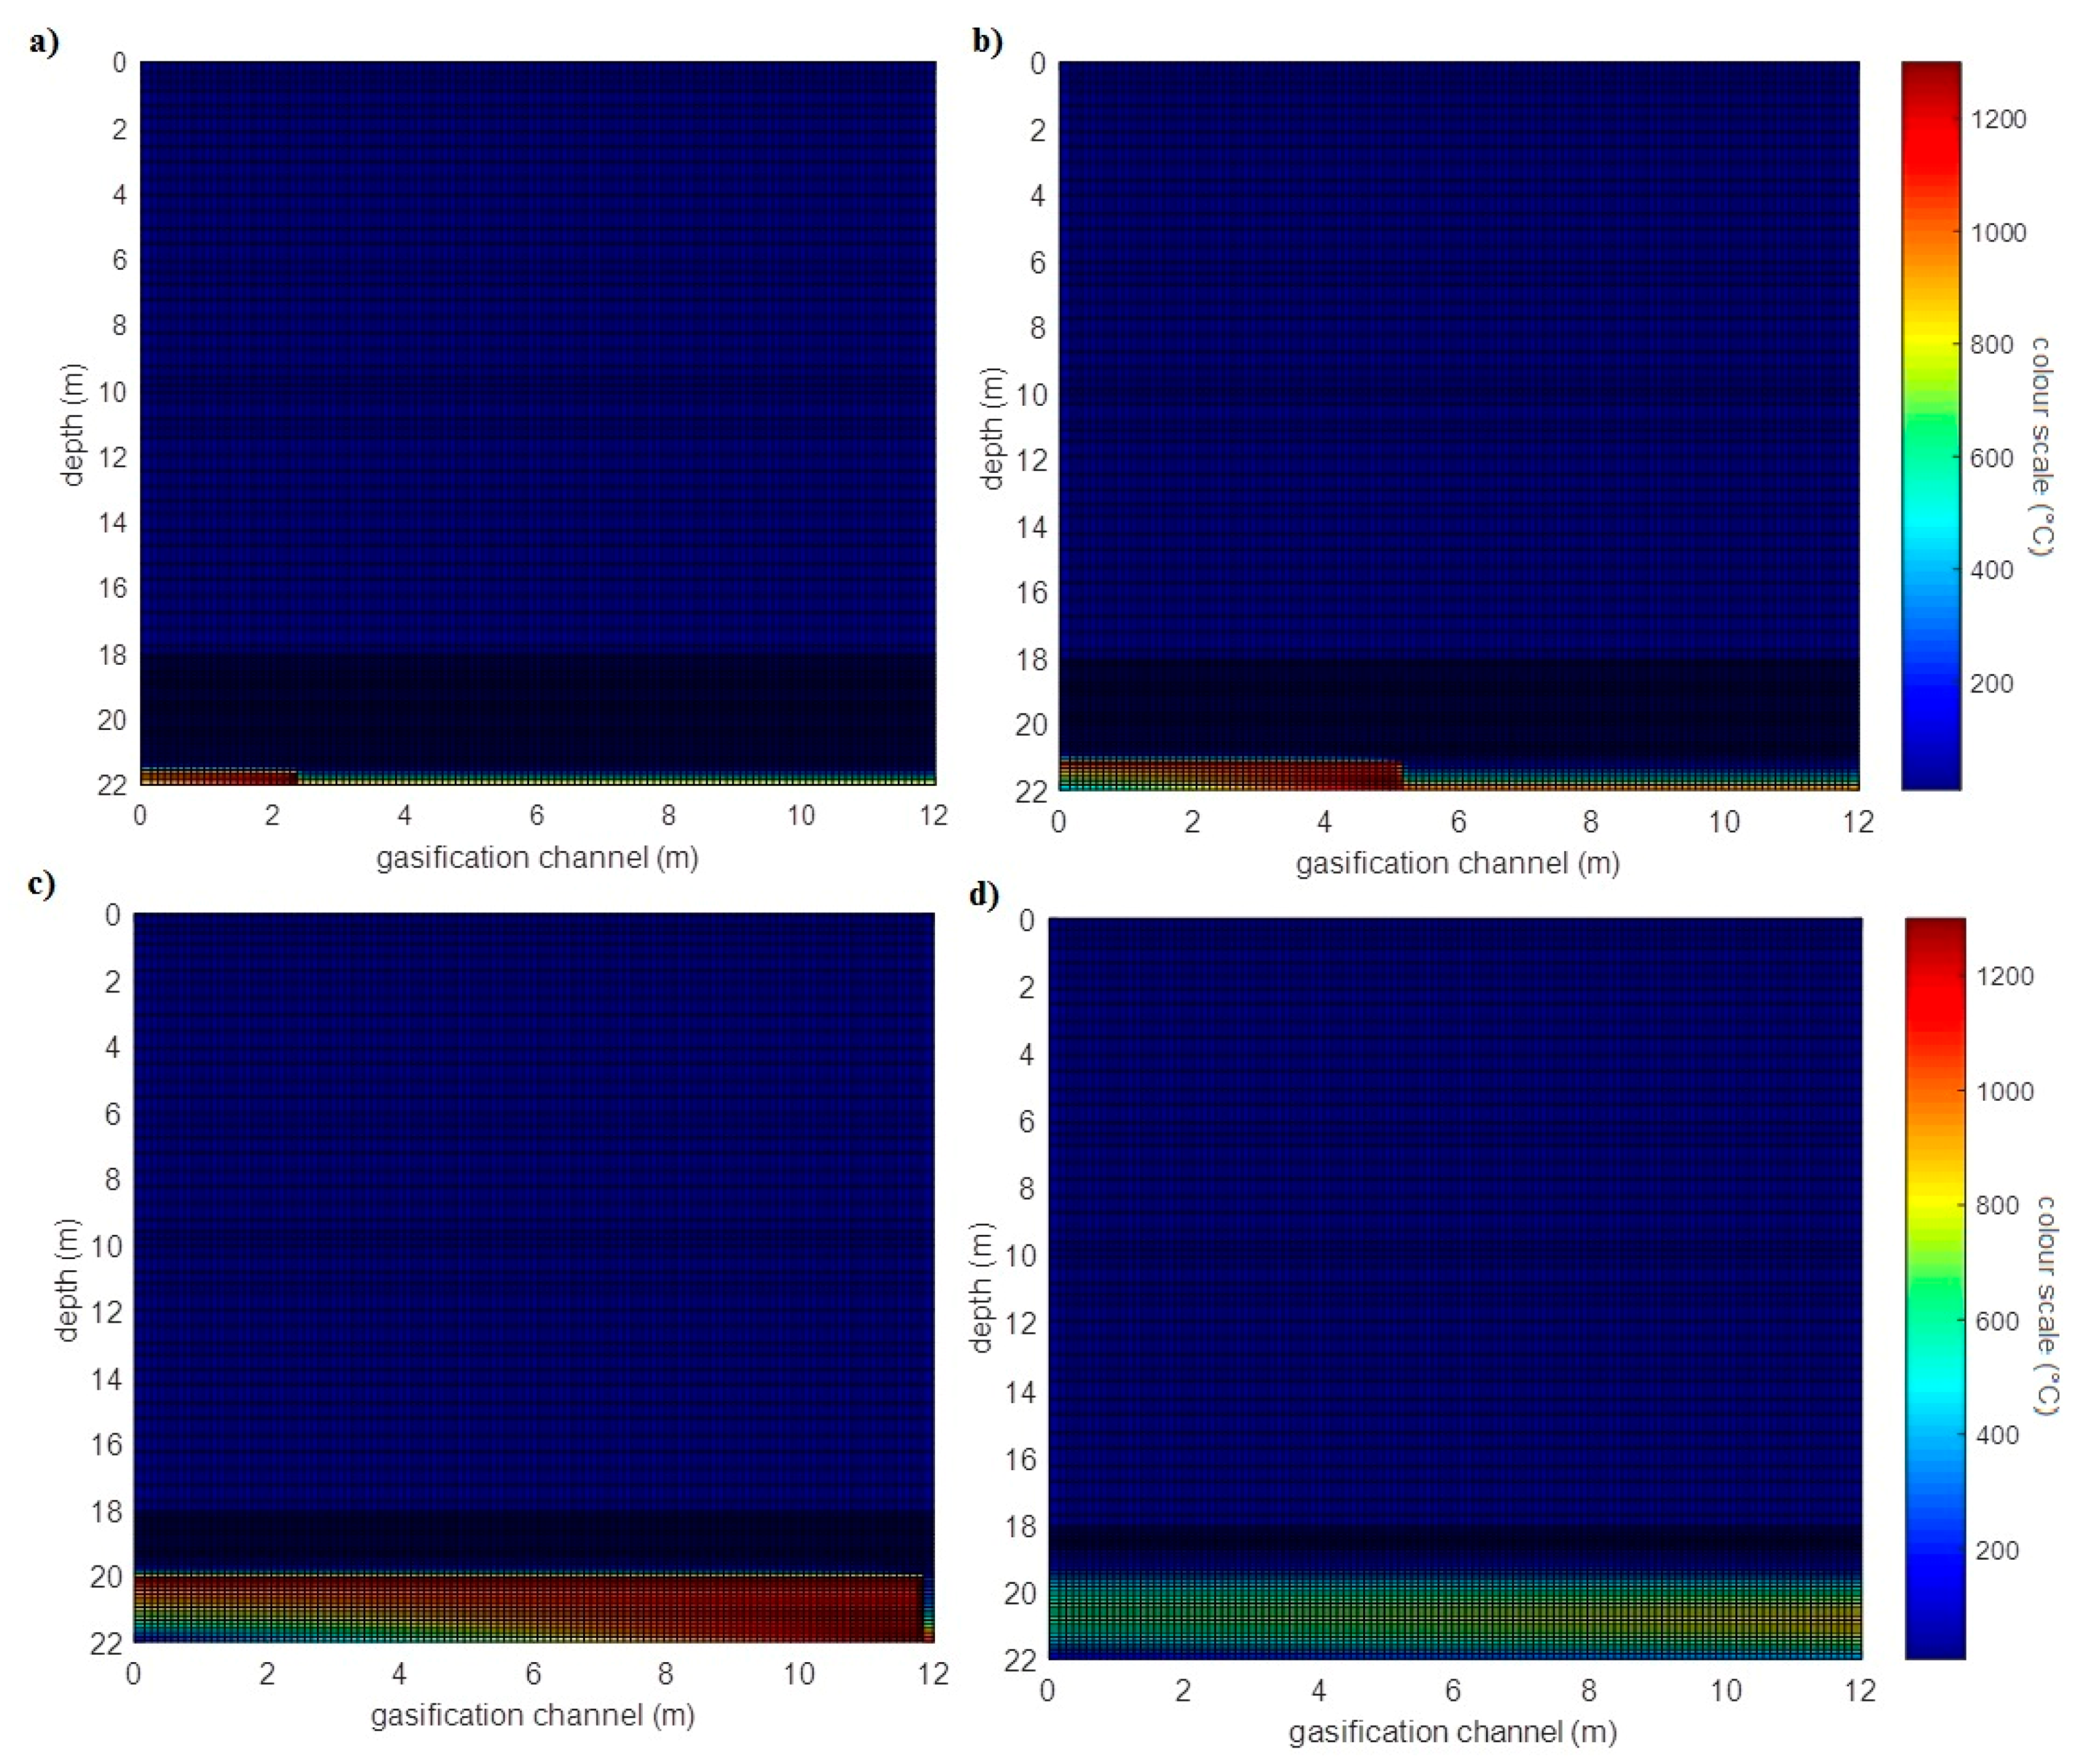
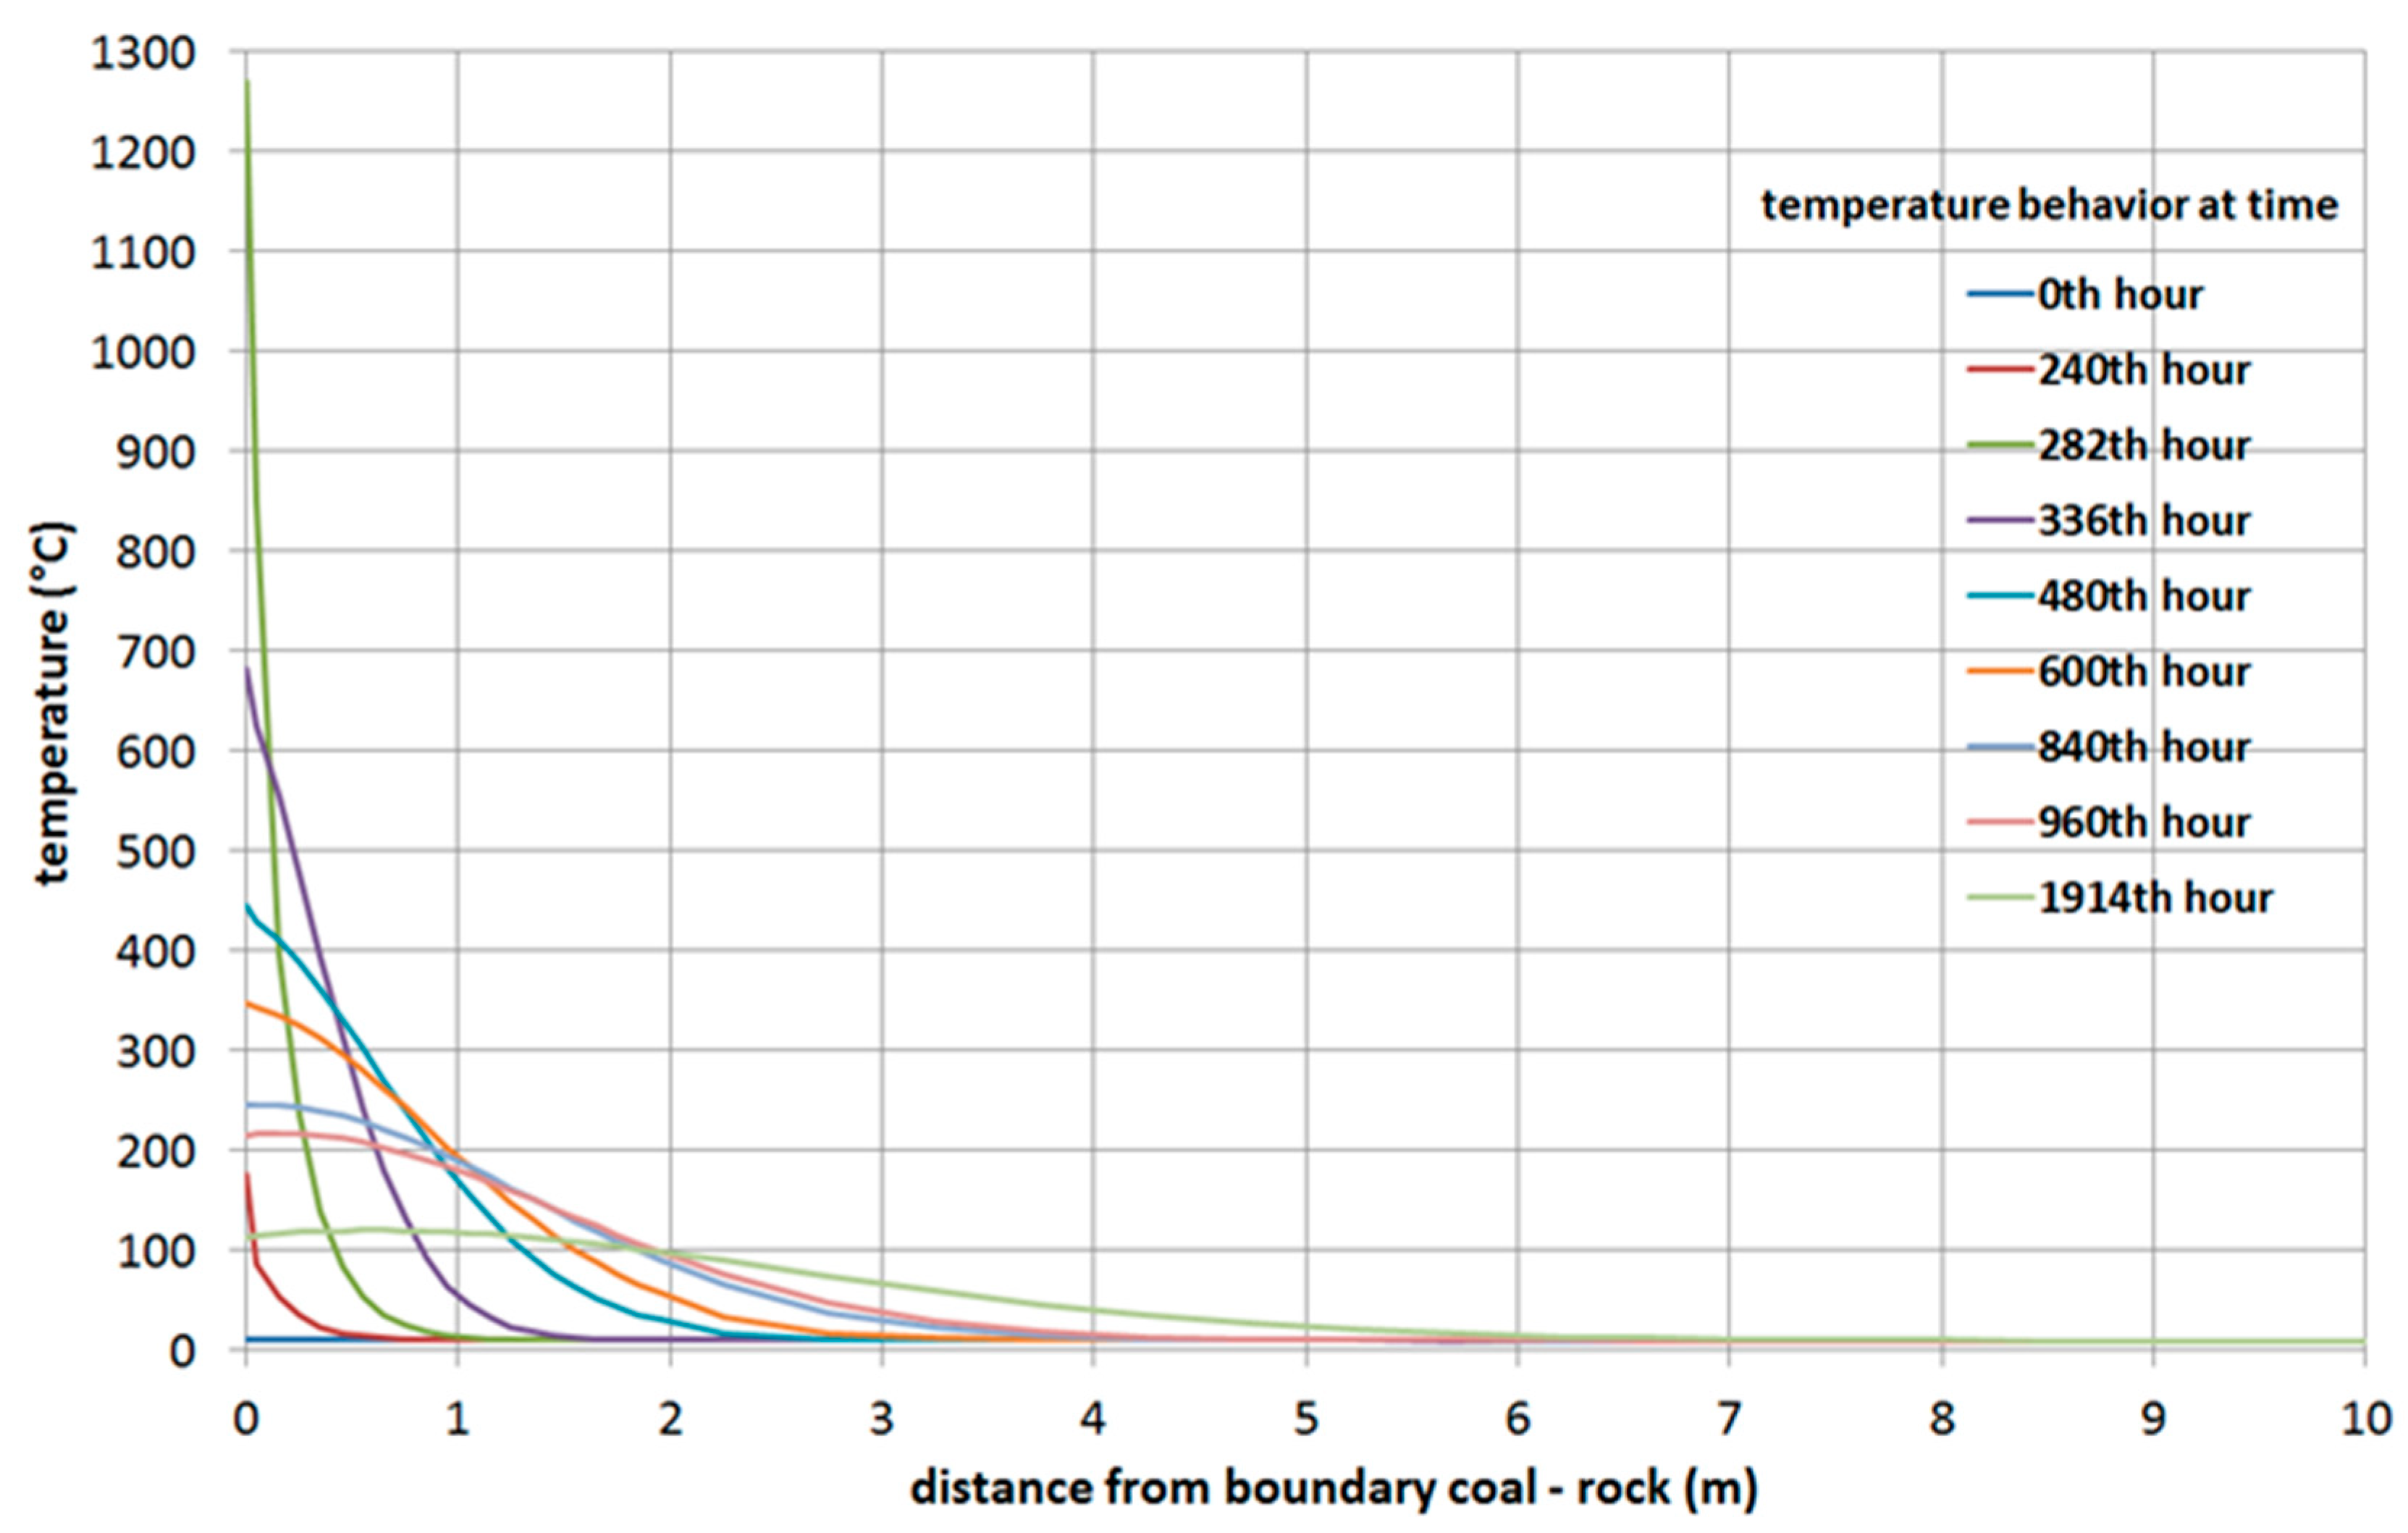
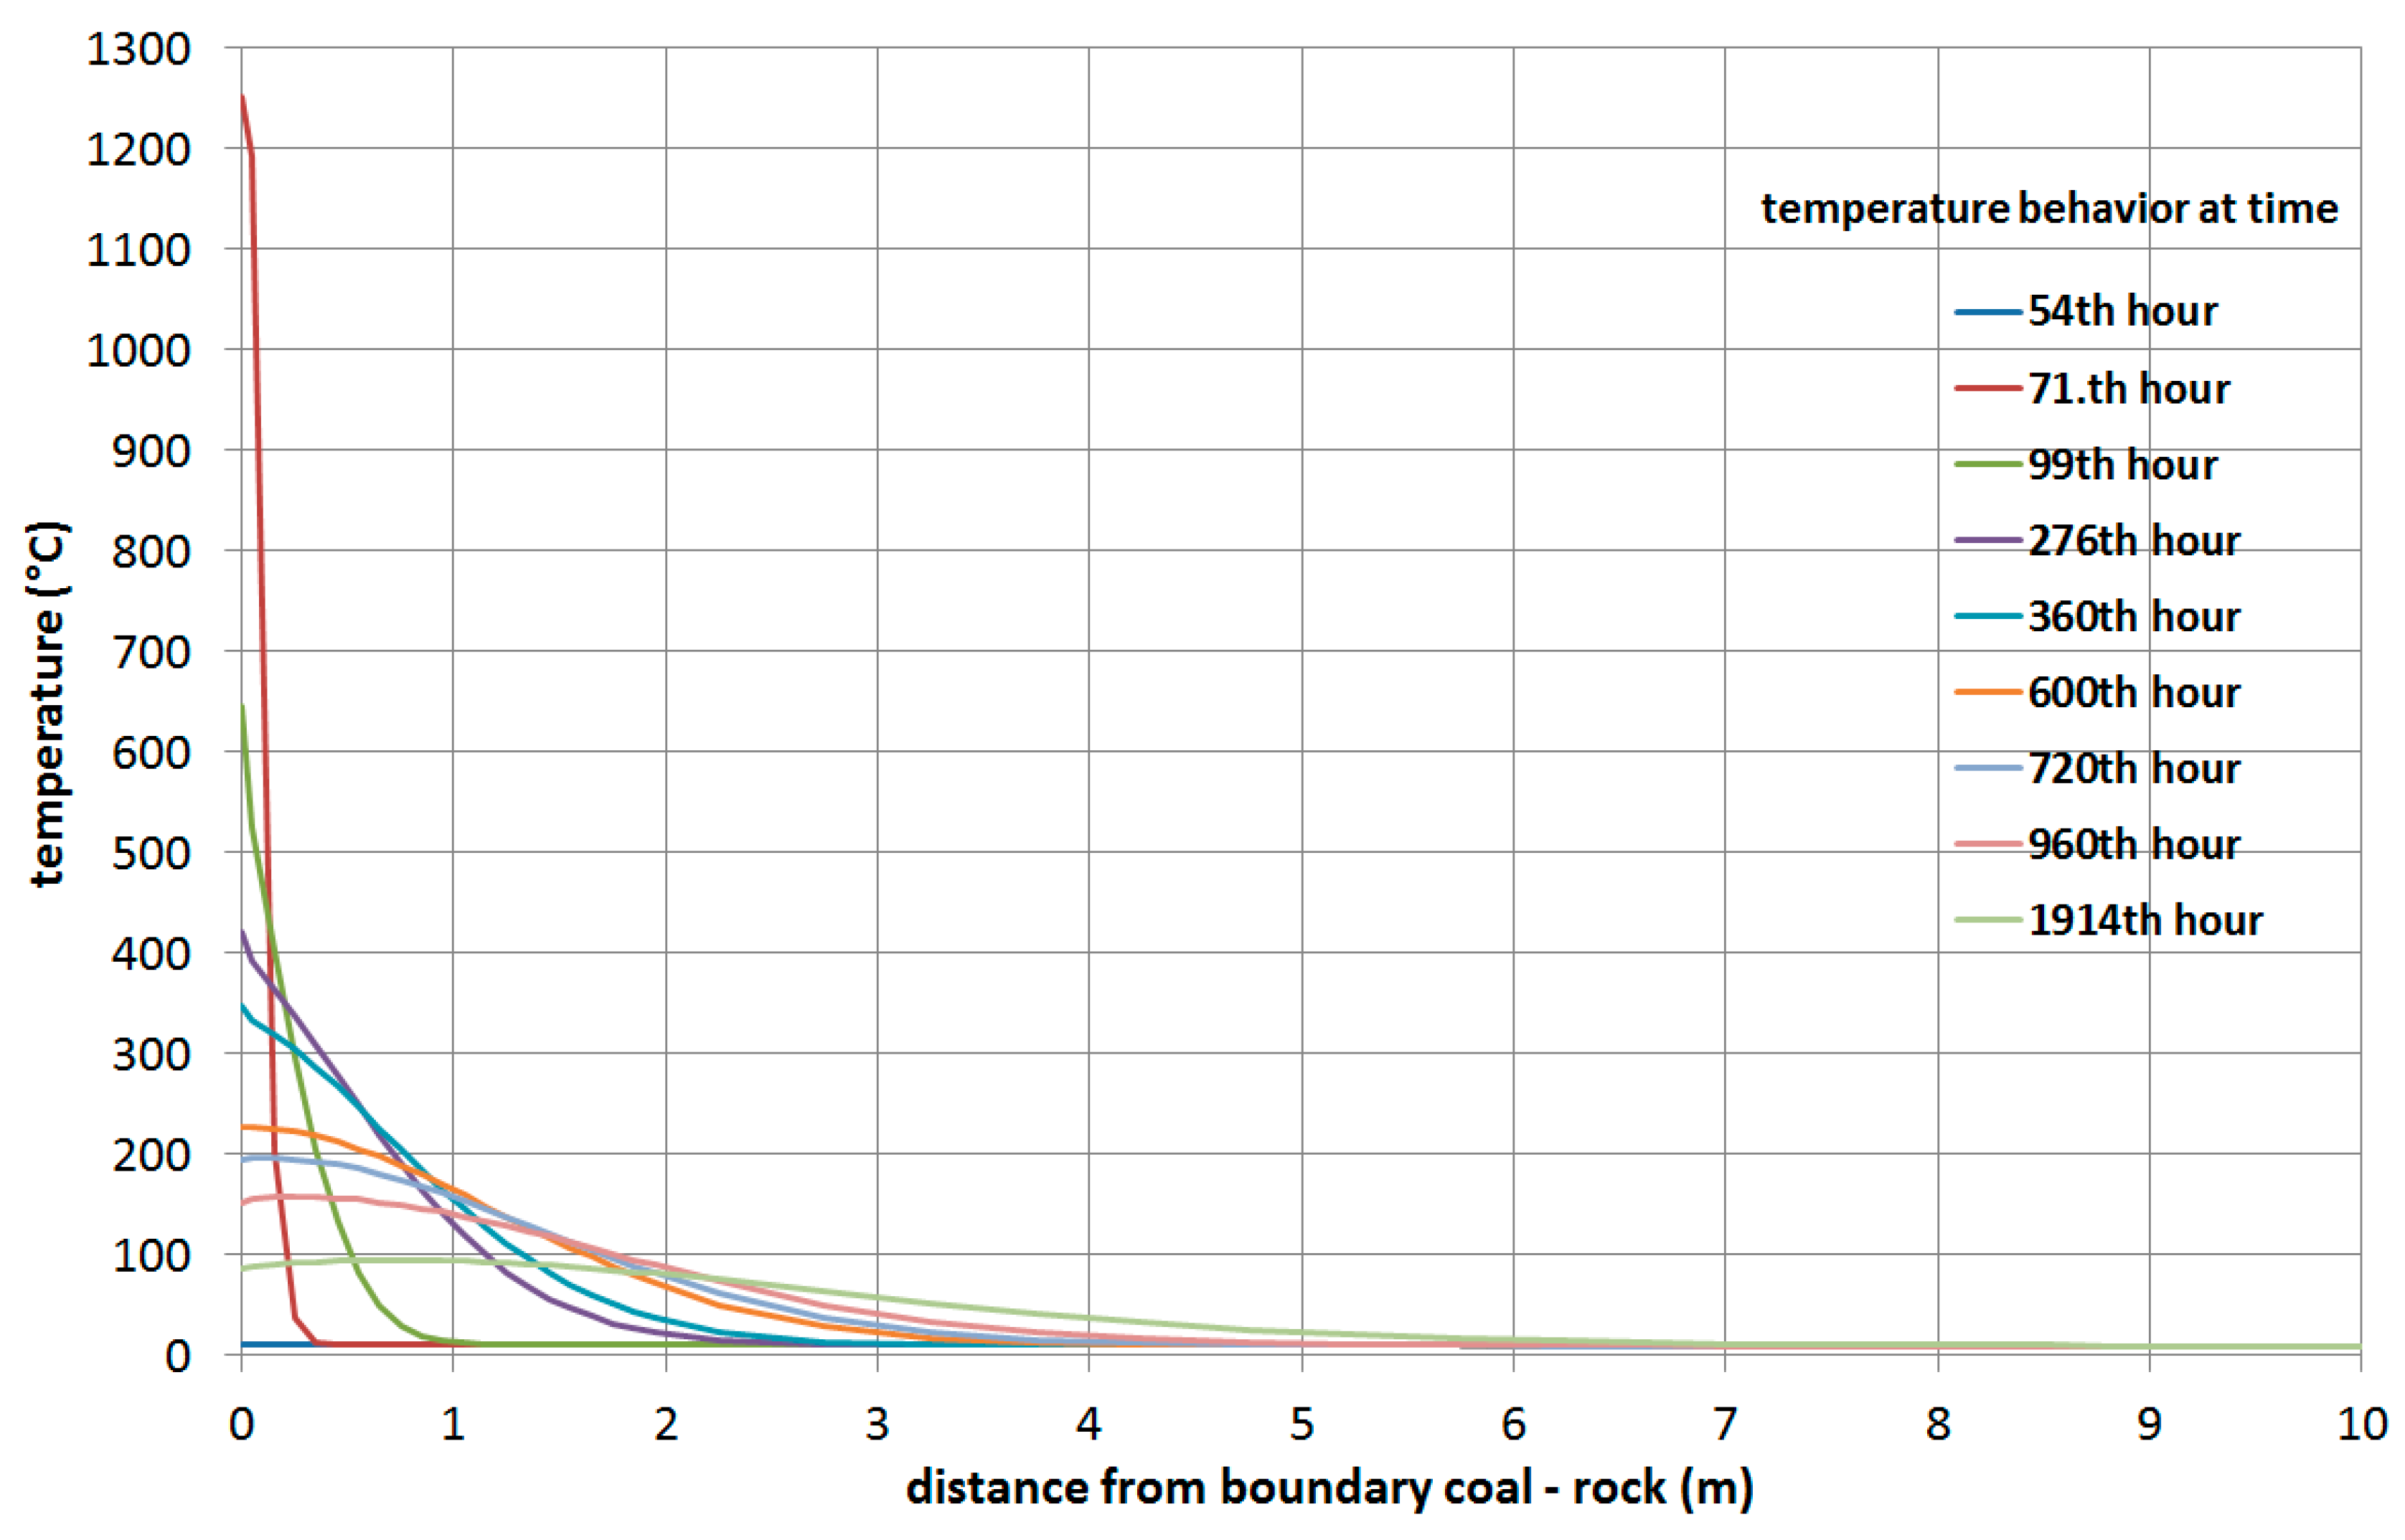
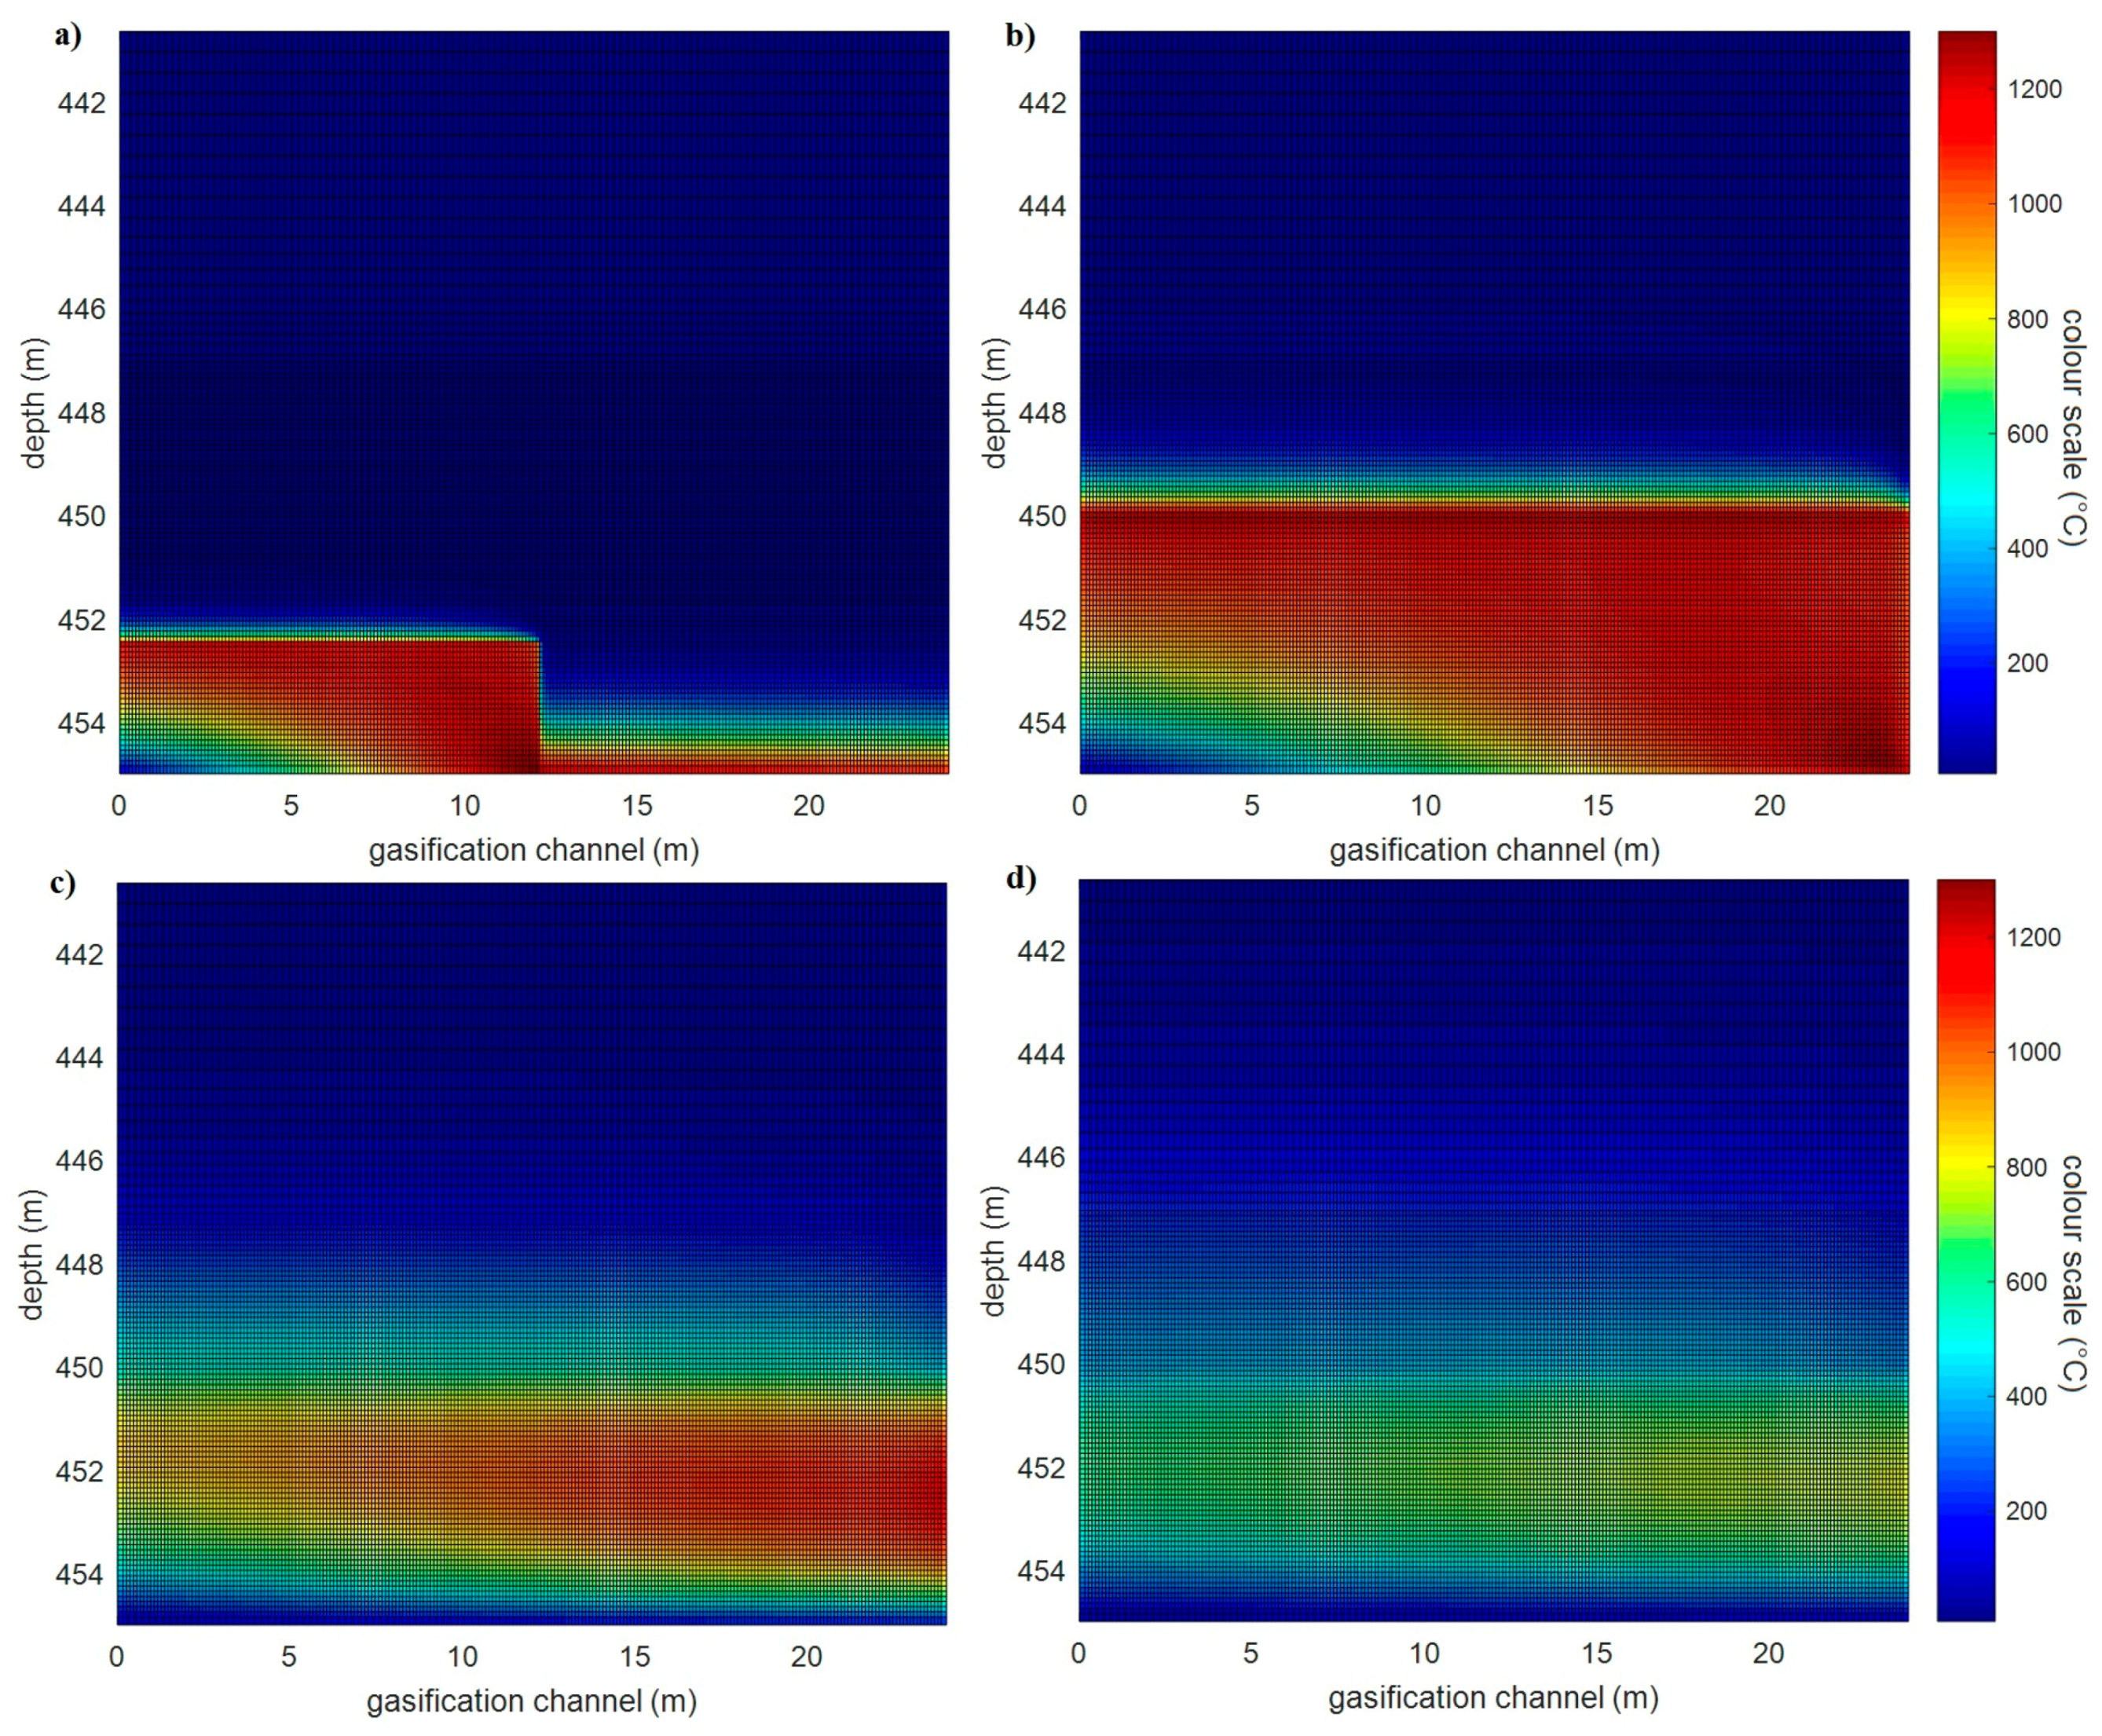
3.1.1. Simulation of the Barbara Experimental Mine

The structure of overburden and the thickness of each layer in the model was selected based on the borehole information [60] for the Barbara mine. The thermal—physical parameters (density, heat conductivity and specific heat capacity) were sought in variety of literature sources [71,72,73,74,75]. To eliminate swings of air temperature, air temperature above the surface of the underground coal gasifier was chosen as t 0   = 8.5   ° C —the average during of year as per recommendation [75]. This temperature is an input to Equation (3). The maximum temperature t m a x in the oxidation zone was identified as 1300   ° C . The analyses measuring temperatures in laboratory conditions confirmed that the maximum temperature reached appears to be 1300 ° C during multiple moments in the experiment performed. The ash from the underground coal gasifier in the Barbara experimental mine was analyzed after the completion of UCG by X-ray photoelectron spectroscopy (XPS). This analysis confirmed that minimally “ t m a x ” was 1300   ° C . Therefore, in this way, the “ t m a x ” was determined.
The total thickness of overburden was 20 m in the simulation process. The overburden consisted mainly of the following layers: Shale, Sandstone, Clay and Sand. The thermo-physical properties of individual layers, dimensions of overburden and the coal seam from the real coal seam marked as Barbara were used. Two-dimensional temperature fields were simulated before the start, during and after UCG. The total time of 2640 h was considered for the simulation. Simulations were performed with three different velocities of the movement of the gasification front in the underground coal gasifier. At first, the gasification process considered took place with 1 m/day velocity of the movement of the gasification front in the direction of the gasification channel (axis x ) in accordance with experiments. The gasification front movement for coal seam located under the earth’s surface at a depth of around 20 m is shown in Figure 9. This figure is the result of a simulation process considering 2 m thickness and 12 m length of coal seam.
The velocity of the movement of the gasification front in the direction of the depth (axis y ) from gasification channel to earth surface on the bases laboratory measurement was determined as follows:
  • The velocity of the movement of the gasification front was determined from individual measured temperatures on the coal seam for the x and y axes (The velocity in the x axis direction was larger than the velocity in the y axis direction) using laboratory measurement.
  • The ratio between velocity in the y axis and in the x axis direction was calculated.
  • The calculated ratio of the calculation of the velocity of the movement of the gasification front in the direction of the depth (y axis) in the real coal seam simulation was used. The velocity of the movement gasification front in direction in the y axis depth was created by multiplying the velocity of the movement of the gasification front in a direction on the x axis (gasification channel v x = 1 m/day) and the ratio calculated. The resulting value of the calculation was v y = 0.1757 m/day. These velocities were used for the first simulation.
The total velocities used in individual simulations are shown in Table 4 from UCG in the Barbara experimental mine. A variety of velocities were selected to enable evaluation of the temperature influence in overburden and on the earth’s surface. The velocity was 1 m/day in the x axis direction of the experiment performed but we also researched the influence of the velocities twice as high and twice as low.
The two-dimensional temperature fields of the first simulation process are shown in Figure 9. There is visible movement of the gasification front from the ignition point to the final point. The temperature 1300 °C at the final point of coal seam is reached on the 12nd day. It is a response to the velocity of the movement of the gasification front in the direction of gasification channel axis (1 m/day). The ignition point is already cooled by this time.
The heat flow density from the earth’s surface to the ambient environment for the selected times is shown in Figure 10. The selected times are marked by colored lines under the graphs in Figure 10 and others. There was a value of 70.4 mW/m2 based on the initial temperature condition at the start process and it was same after 300 h. The change of the heat flow density started in the 306th and it was finished in 342nd h.
The behavior of the temperature from the boundary of the coal and overburden to the earth’s surface in the gasification process is shown in Figure 11. This temperature was assumed in the center of overburden. This figure shows the temperature change at this place for the selected times. It is visible that temperatures above 600 °C are located at a distance circa 0–0.2 m from the boundary of the coal and overburden. The changes of the temperatures of overburden layers are visible into the distance circa 6.2 m from this boundary.
Two simulations were implemented for verification of the mathematical model with the same coal seam. The velocity of the movement of the gasification front (oxidation zone) was 0.5 m/day in both axes in the second simulation and 2 m/day in both axes in the third simulation. The two-dimensional temperature fields of the second simulation are shown in Figure 12 and the temperature fields of the third simulation are shown in Figure 13. The fastest heating and cooling of the coal seam was in third simulation with the highest velocity of the movement of the gasification front in both axes (depth and gasification channel). The time of coal seam heating is reduced with increasing velocity of the movement of the gasification front, thereby leading to the earlier cooling of the ignition point.
The heat flow density values from the earth’s surface to the ambient environment in the second and the third simulation are similar to the first simulation (the same maximum change in approximately the same time).
The behavior of the temperature from the boundary of coal and overburden to the earth’s surface in the gasification process is shown in Figure 14 (the second simulation) and in Figure 15 (the third simulation). This temperature was assumed in the center of overburden in the direction of the x axis as with the first simulation. It is visible that temperatures above 600 °C are located at circa 0.15–0.2 m from the boundary of coal and overburden as in the first simulation and the changes of the temperature of overburden layers are visible at circa 6.2 m from this boundary.
The maximum distances of the temperatures 300 and 500 °C from boundary of coal and overburden upwards for individual simulations are shown in Table 5 to show the place of the influence these critical temperatures.

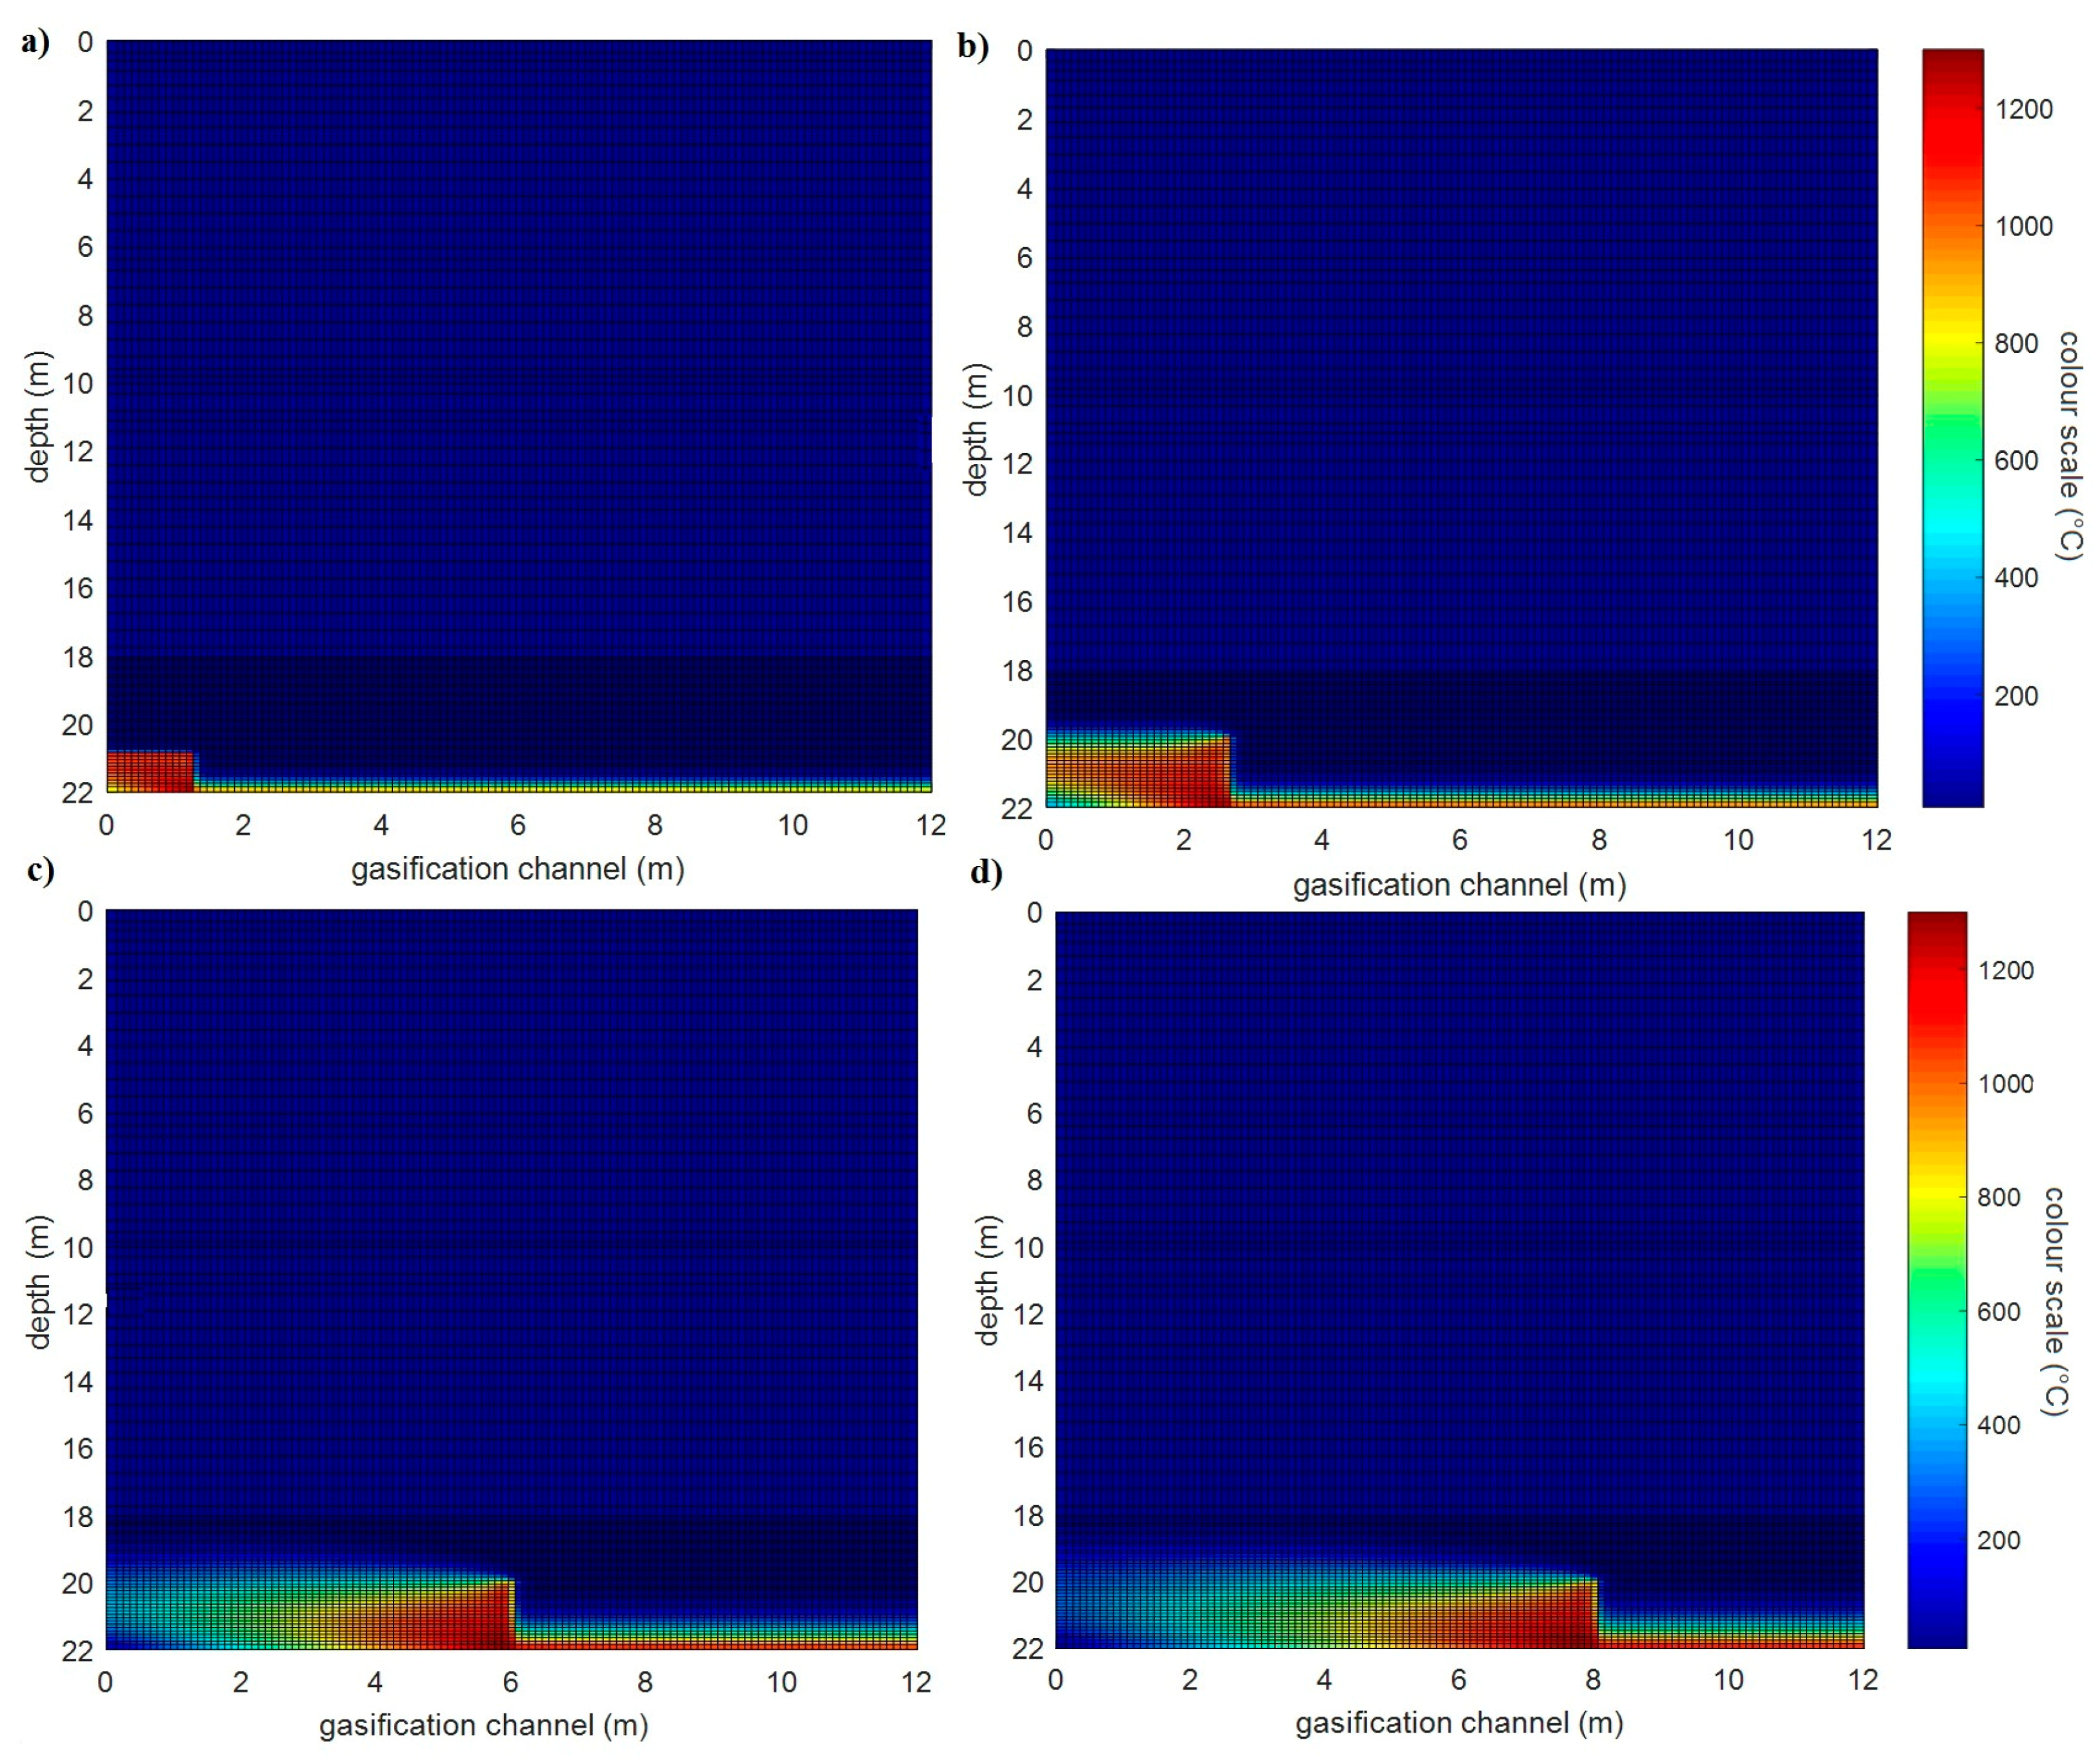
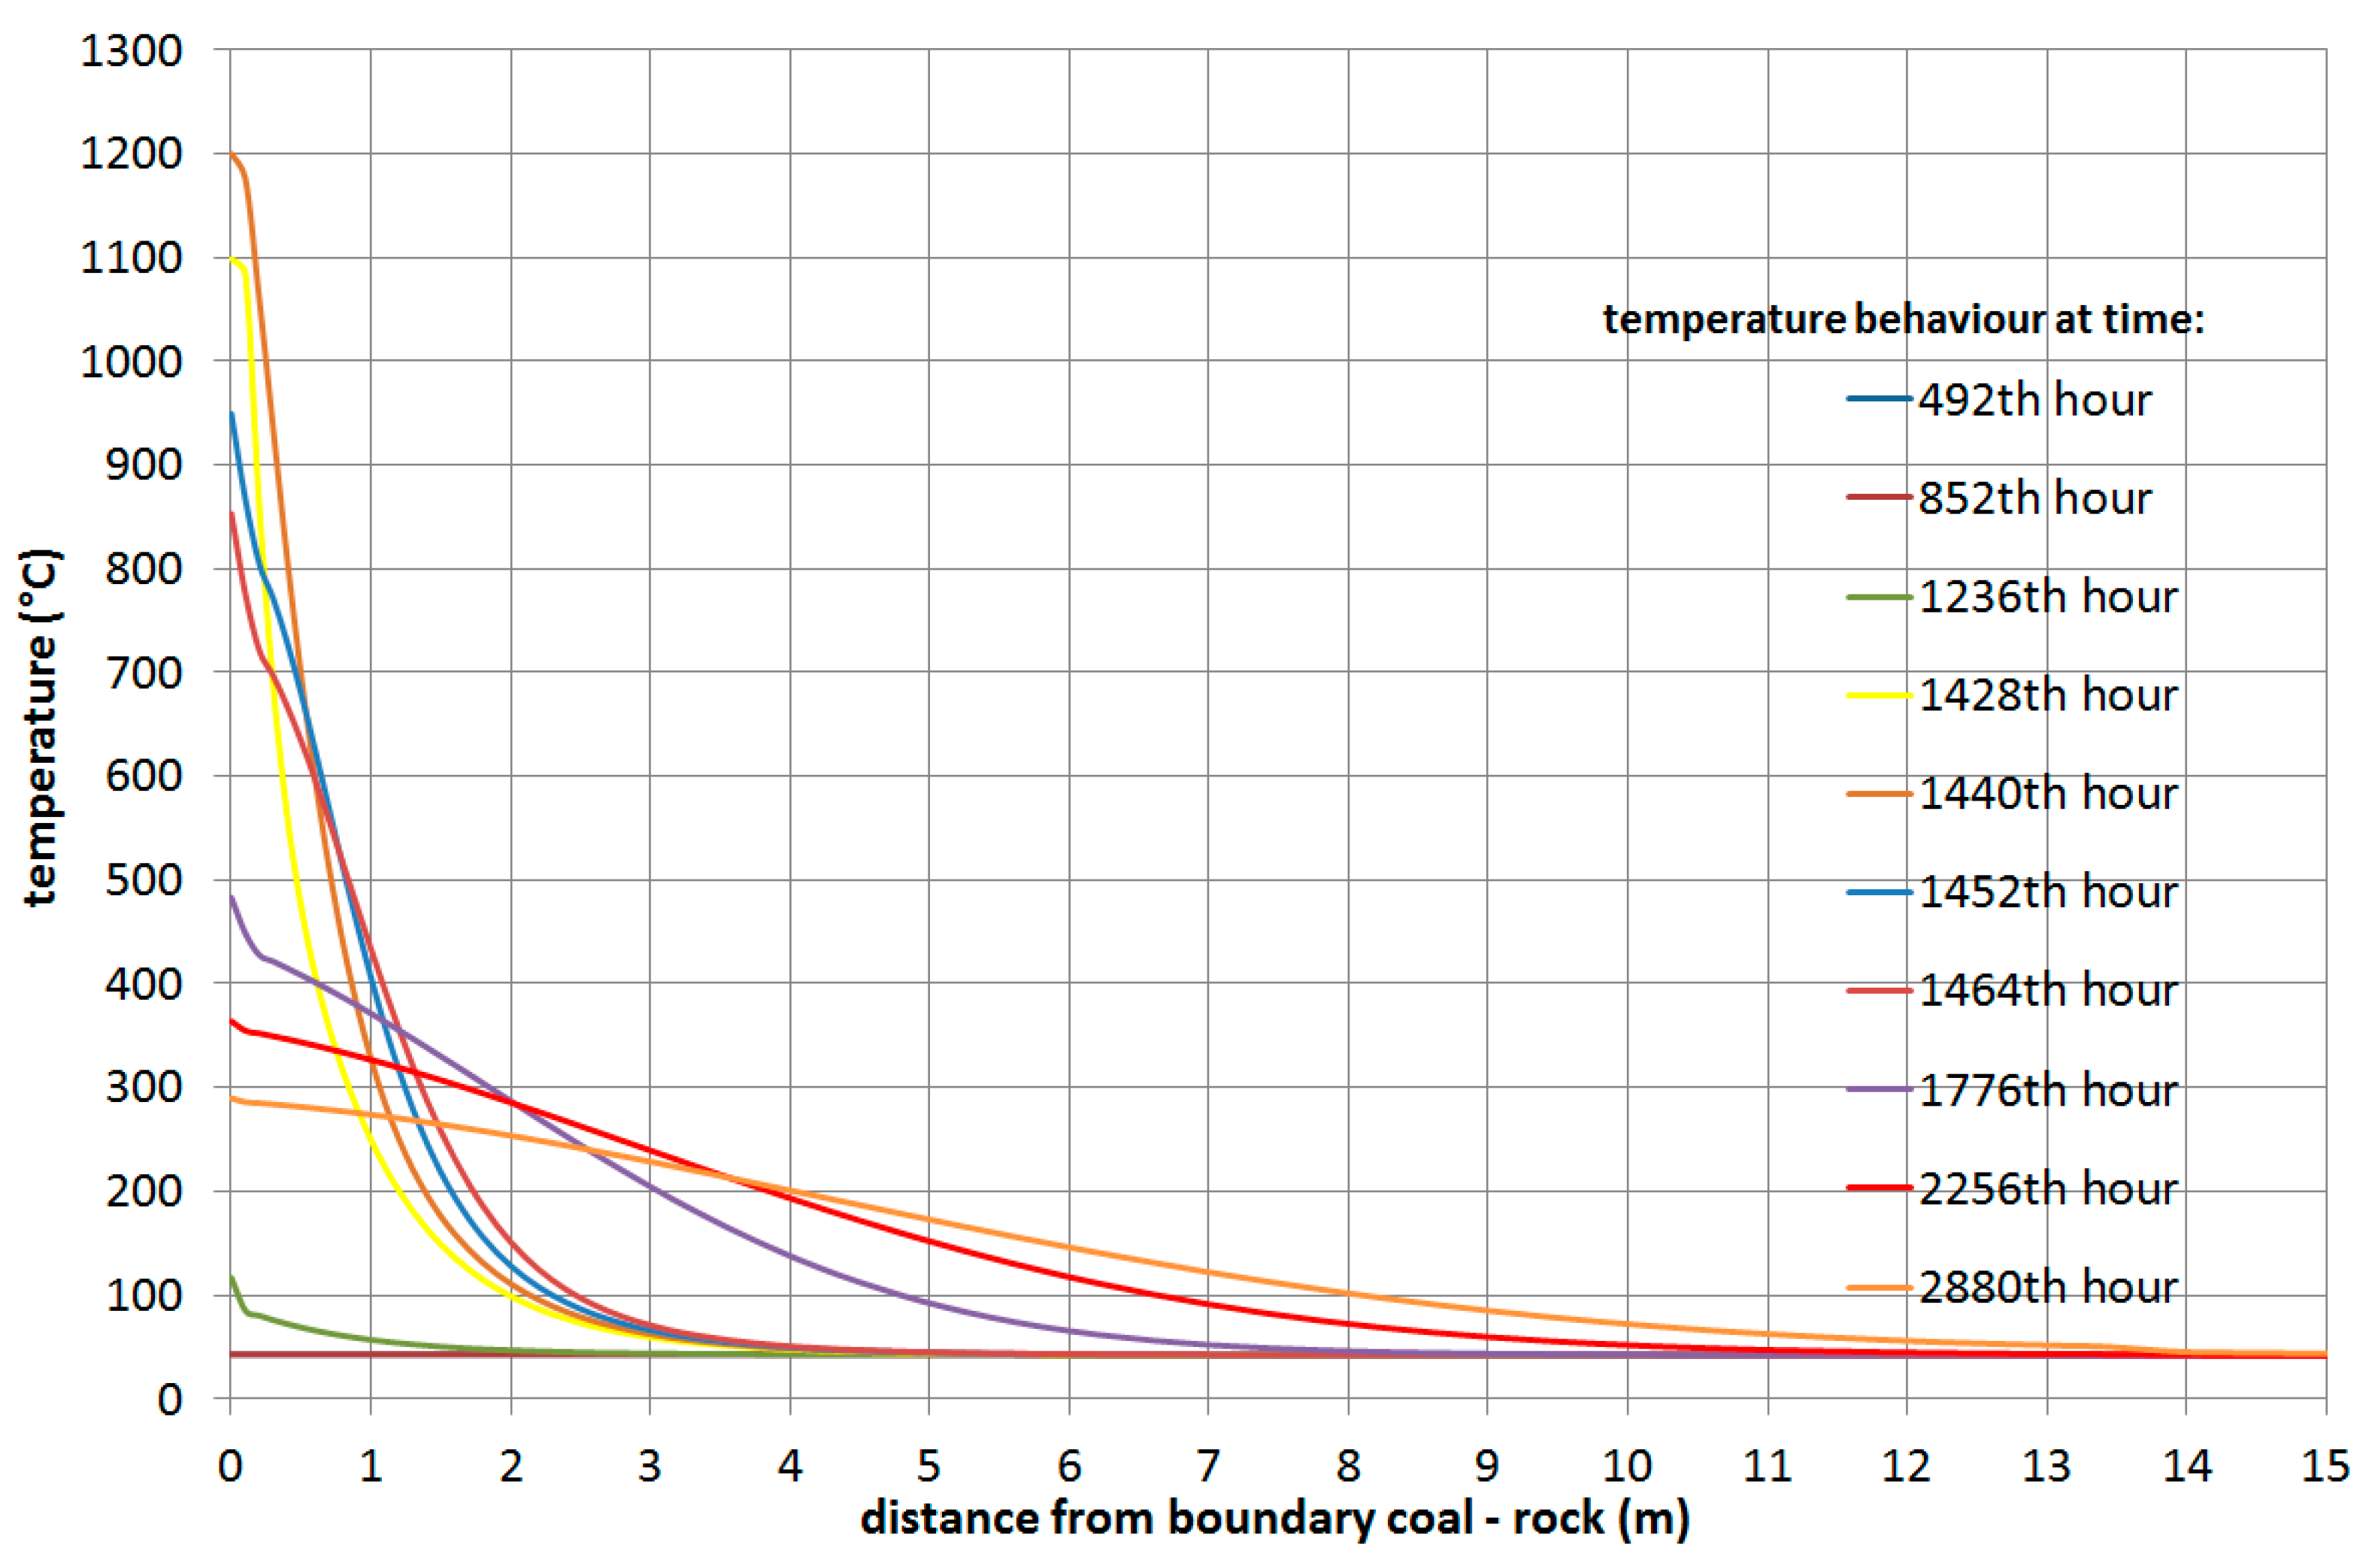
3.1.2. Simulation of the Wieczorek Experimental Mine

The total overburden thickness was 450 m in the simulation process. The overburden consisted of the following layers: Shale, Sandstone, Clay, Sand and their mixtures. The thermo-physical properties of individual layers, dimensions of overburden and as a coal seam was used for Wieczorek mine conditions. The thickness of the real coal seam was 5 m and the length was 24 m. The real experiment on the Wieczorek experimental mine took place over 1440 h, but the simulation time was 2880 h for the reason of assessment of the impact of the gasification process after its completion. The velocity of movement of the gasification front was calculated for the gasified time (1440 h) for the total coal seam. The calculated velocity of movement of the gasification front in direction axis x was 0.4 m/day and in direction on axis y was 0.08333 m/day. The velocities of movement gasification front calculated according to Equations (7) and (8) was considered, where the numerator is the size of the gasified coal bed in the direction of the x axis (24 m) or y (5 m) and the denominator is the gasified time of the whole coal seam (60 days)
v x x C S τ G T
v y y C S τ G T
where x C S is length of coal seam (m), y C S is height of coal seam (m) and τ G T is the gasified time of whole coal seam (day).
Again, two-dimensional temperature fields were simulated before start, during and after UCG. Two-dimensional temperature fields of this simulation process are shown in Figure 16. There is visible gasification front movement from the ignition point to the final point. The temperature 1300 °C at the final point is reached in 24th day.
The behavior of the temperature from boundary of coal and overburden to the earth’s surface in the gasification process is shown in Figure 17. This temperature was assumed in the center of overburden. This figure shows the temperature change at this place for the selected period. The maximum distance of the temperatures at 300 °C is 1.9 m and 500 °C is 0.8 m from boundary of coal and overburden upwards for the simulation on the Wieczorek experimental mine. The changes of the overburden layers temperatures are visible into the distance circa 14 m from this boundary. It is the temperature change from 42 °C to 45 °C at the distance 14 m from coal—overburden boundary.
The coal seam at parameters of the Wieczorek experimental mine (the size and the velocity of movement of the gasification front) should be located at a depth of 25.4 m. The maximal temperature changes are 0.1 °C in this depth.

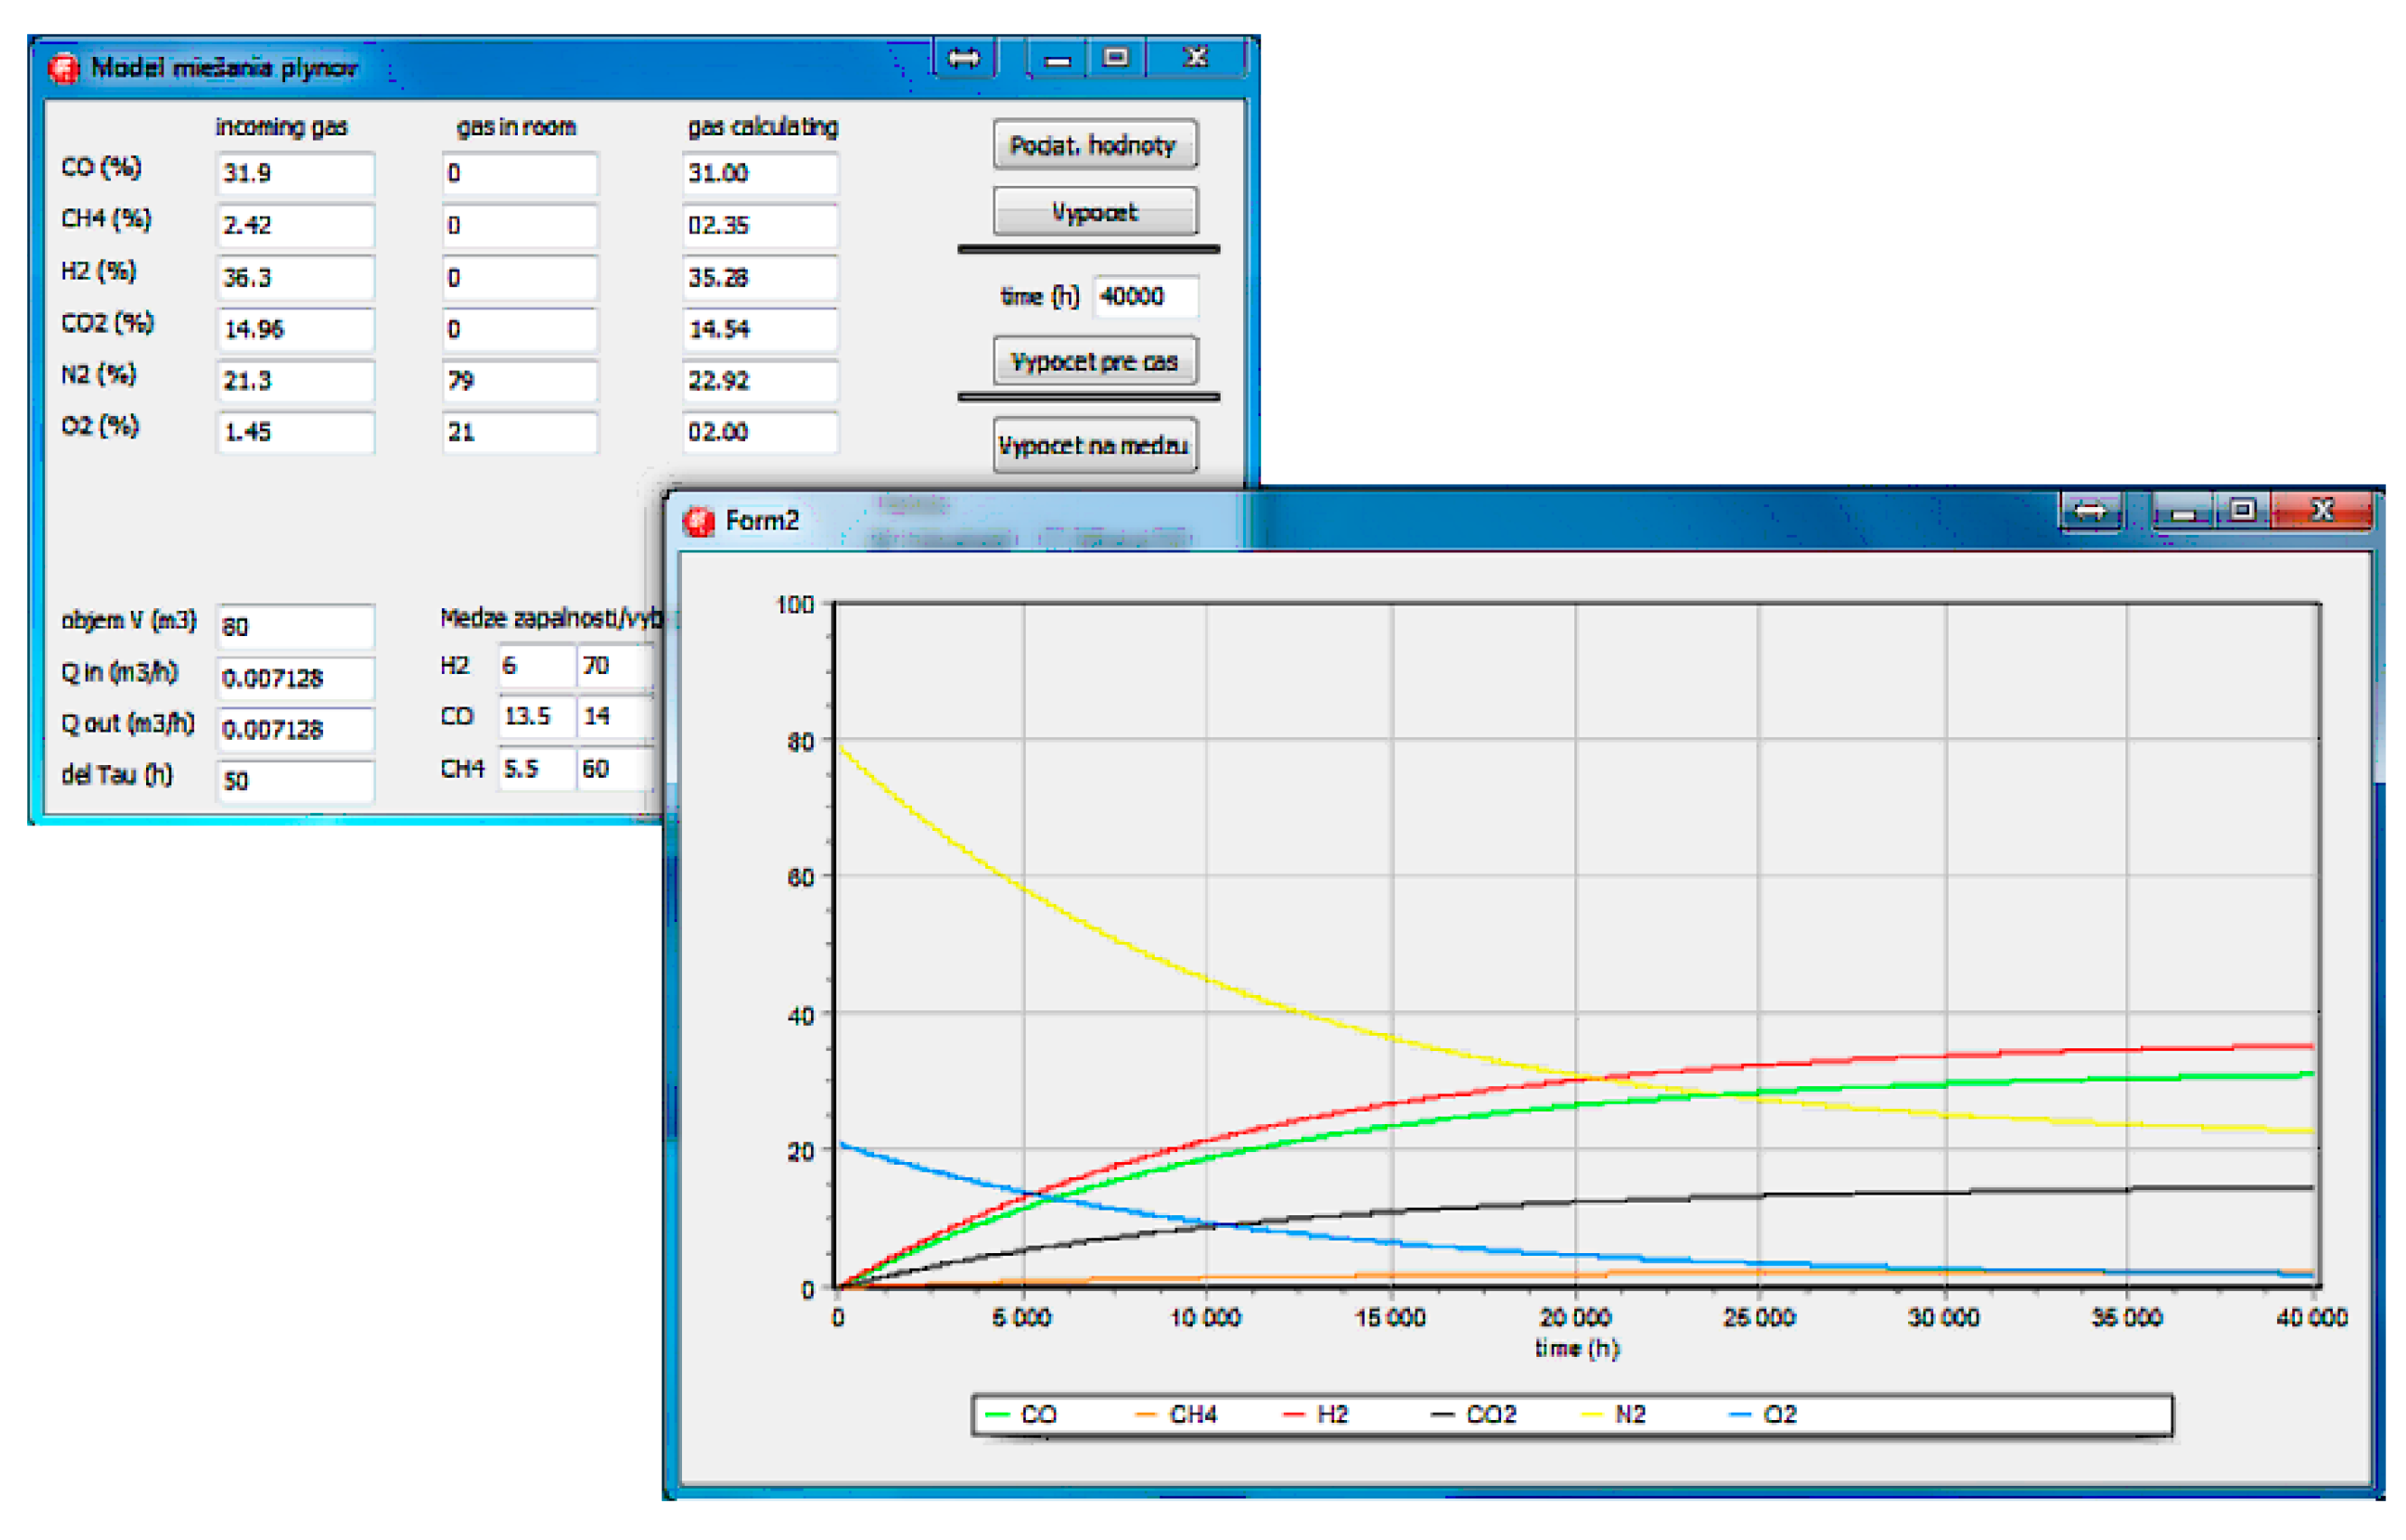
3.2. Analysis of a Dangerous Explosion and a Poisoning by Syngas

The simulation studies implemented on the simulation model for mixing of gases based on mathematical models (11), (12) were divided into two parts. In the first part we focused on the possibility of dangerous explosion of escaped syngas. A critical time was detected in which an explosion could occur. The minimum concentration of a particular combustible gas necessary to support its combustion in air is defined as the lower explosive limit (LEL) for that gas. Below this level, the mixture is too “lean” to burn. The maximum concentration of a gas that will burn in air is defined as the upper explosive limit (UEL). Above this level, the mixture is too “rich” to burn. The range between the LEL and UEL is known as the flammable range for that gas. In Table 6 the lower and upper explosive limits for components of syngas (H2, CO, CH4) are shown [76,77].
The second part of the simulation study is focused on CO poisoning. The effect of CO on the human body is cumulative and depends on the concentration and the duration of action. Table 7 shows information about the effect of CO on humans over time. We chose 0.1% CO as a critical value at which leads to death after 2 h [78,79].
Table 8 shows the average concentration of the components of syngas from experiments. One experiment was performed in laboratory conditions, two experiments were performed at the Barbara mine and one experiment at Wieczorek Colliery. In the Barbara experimental mine two experiments were performed with different average concentrations of the components of syngas (in Table 8 they are marked as Barbara 1 and Barbara 2) [80,81,82].
Simulations on the simulation model for mixing of gases were performed for data from all four experiments. We considered the leaking of the syngas to the surface to places that are vulnerable (Figure 18). Using the simulation model of syngas streaming through porous media the average velocity for syngas flowing from UCG cavity to surface through overburden was calculated [47]. Data from Table 8 and the composition of overburden (properties of rock strata) for the Barbara, Wieczorek and Cigel mines (composition of syngas is from laboratory experiment) were used as inputs in model of syngas leaking [46]. Inputs to the model for mixing of gasses are composition of syngas and volume flow of leaking syngas to surface. The critical time (in hours and in days) is calculated using the model for mixing of gases (syngas with air in room) for both scenarios, with gas leaking to the ground surface. This is the time at which the critical value (Table 6 and Table 7) for explosion or toxic effect (CO poisoning) is reached. We decided to make simulation studies for two sizes of rooms in which the mixing occurs. The first room is smaller with a volume of 80 m3 and is for example a cellar. The second considered room is a bigger. Its volume is 1600 m3 and it can be warehouse or house.

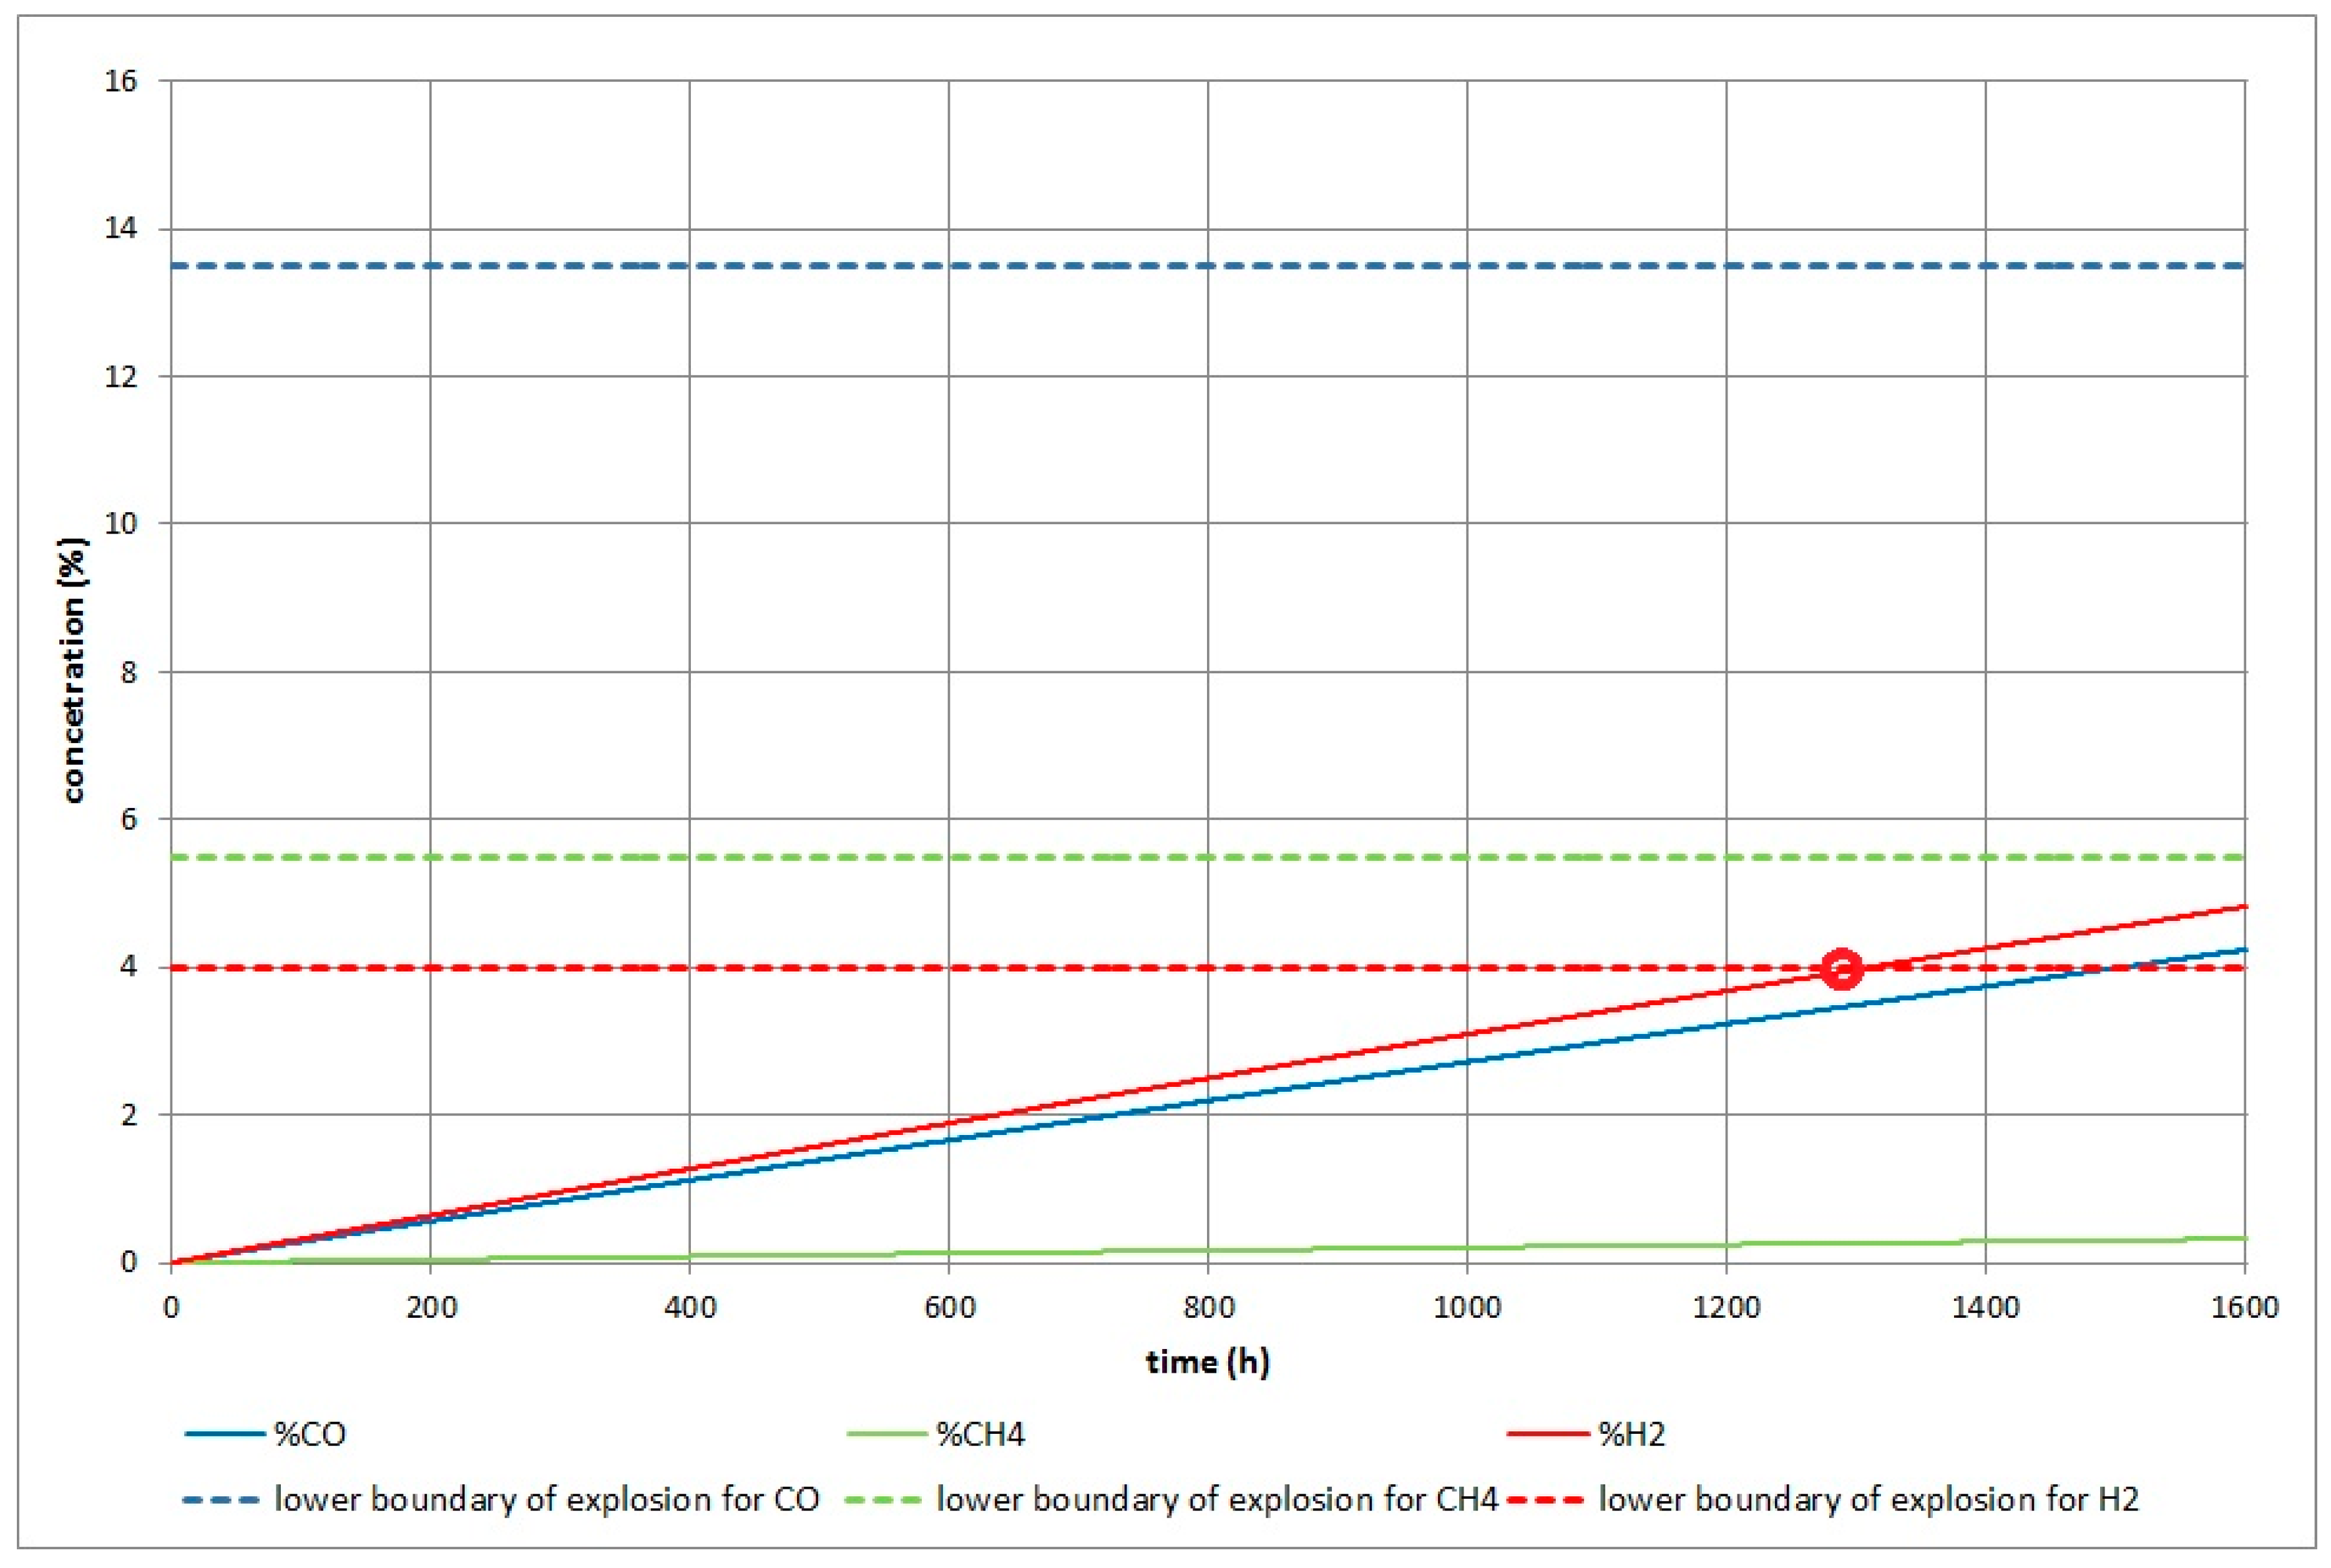
3.2.1. The Results of the Simulation for Dangerous Explosion

The results of the simulation studies for dangerous explosion (for four cases) are shown in Table 9 for the average flow of leaking syngas. Figure 19 shows the concentration of the gas components and the critical time for the possibility of an explosion after the simulation (volume of room 80 m3, exp. Barbara 1). The smallest value of the critical time for a dangerous explosion was obtained for experiment Barbara 1 (54 days). In this experiment, the highest average value of H2 concentration in syngas was compared to other experiments. The boundary of explosion was violated for concentration of H2. In the experiment only Cigel violated the boundary for methane. The methane content in syngas is highest in this experiment (Table 8).

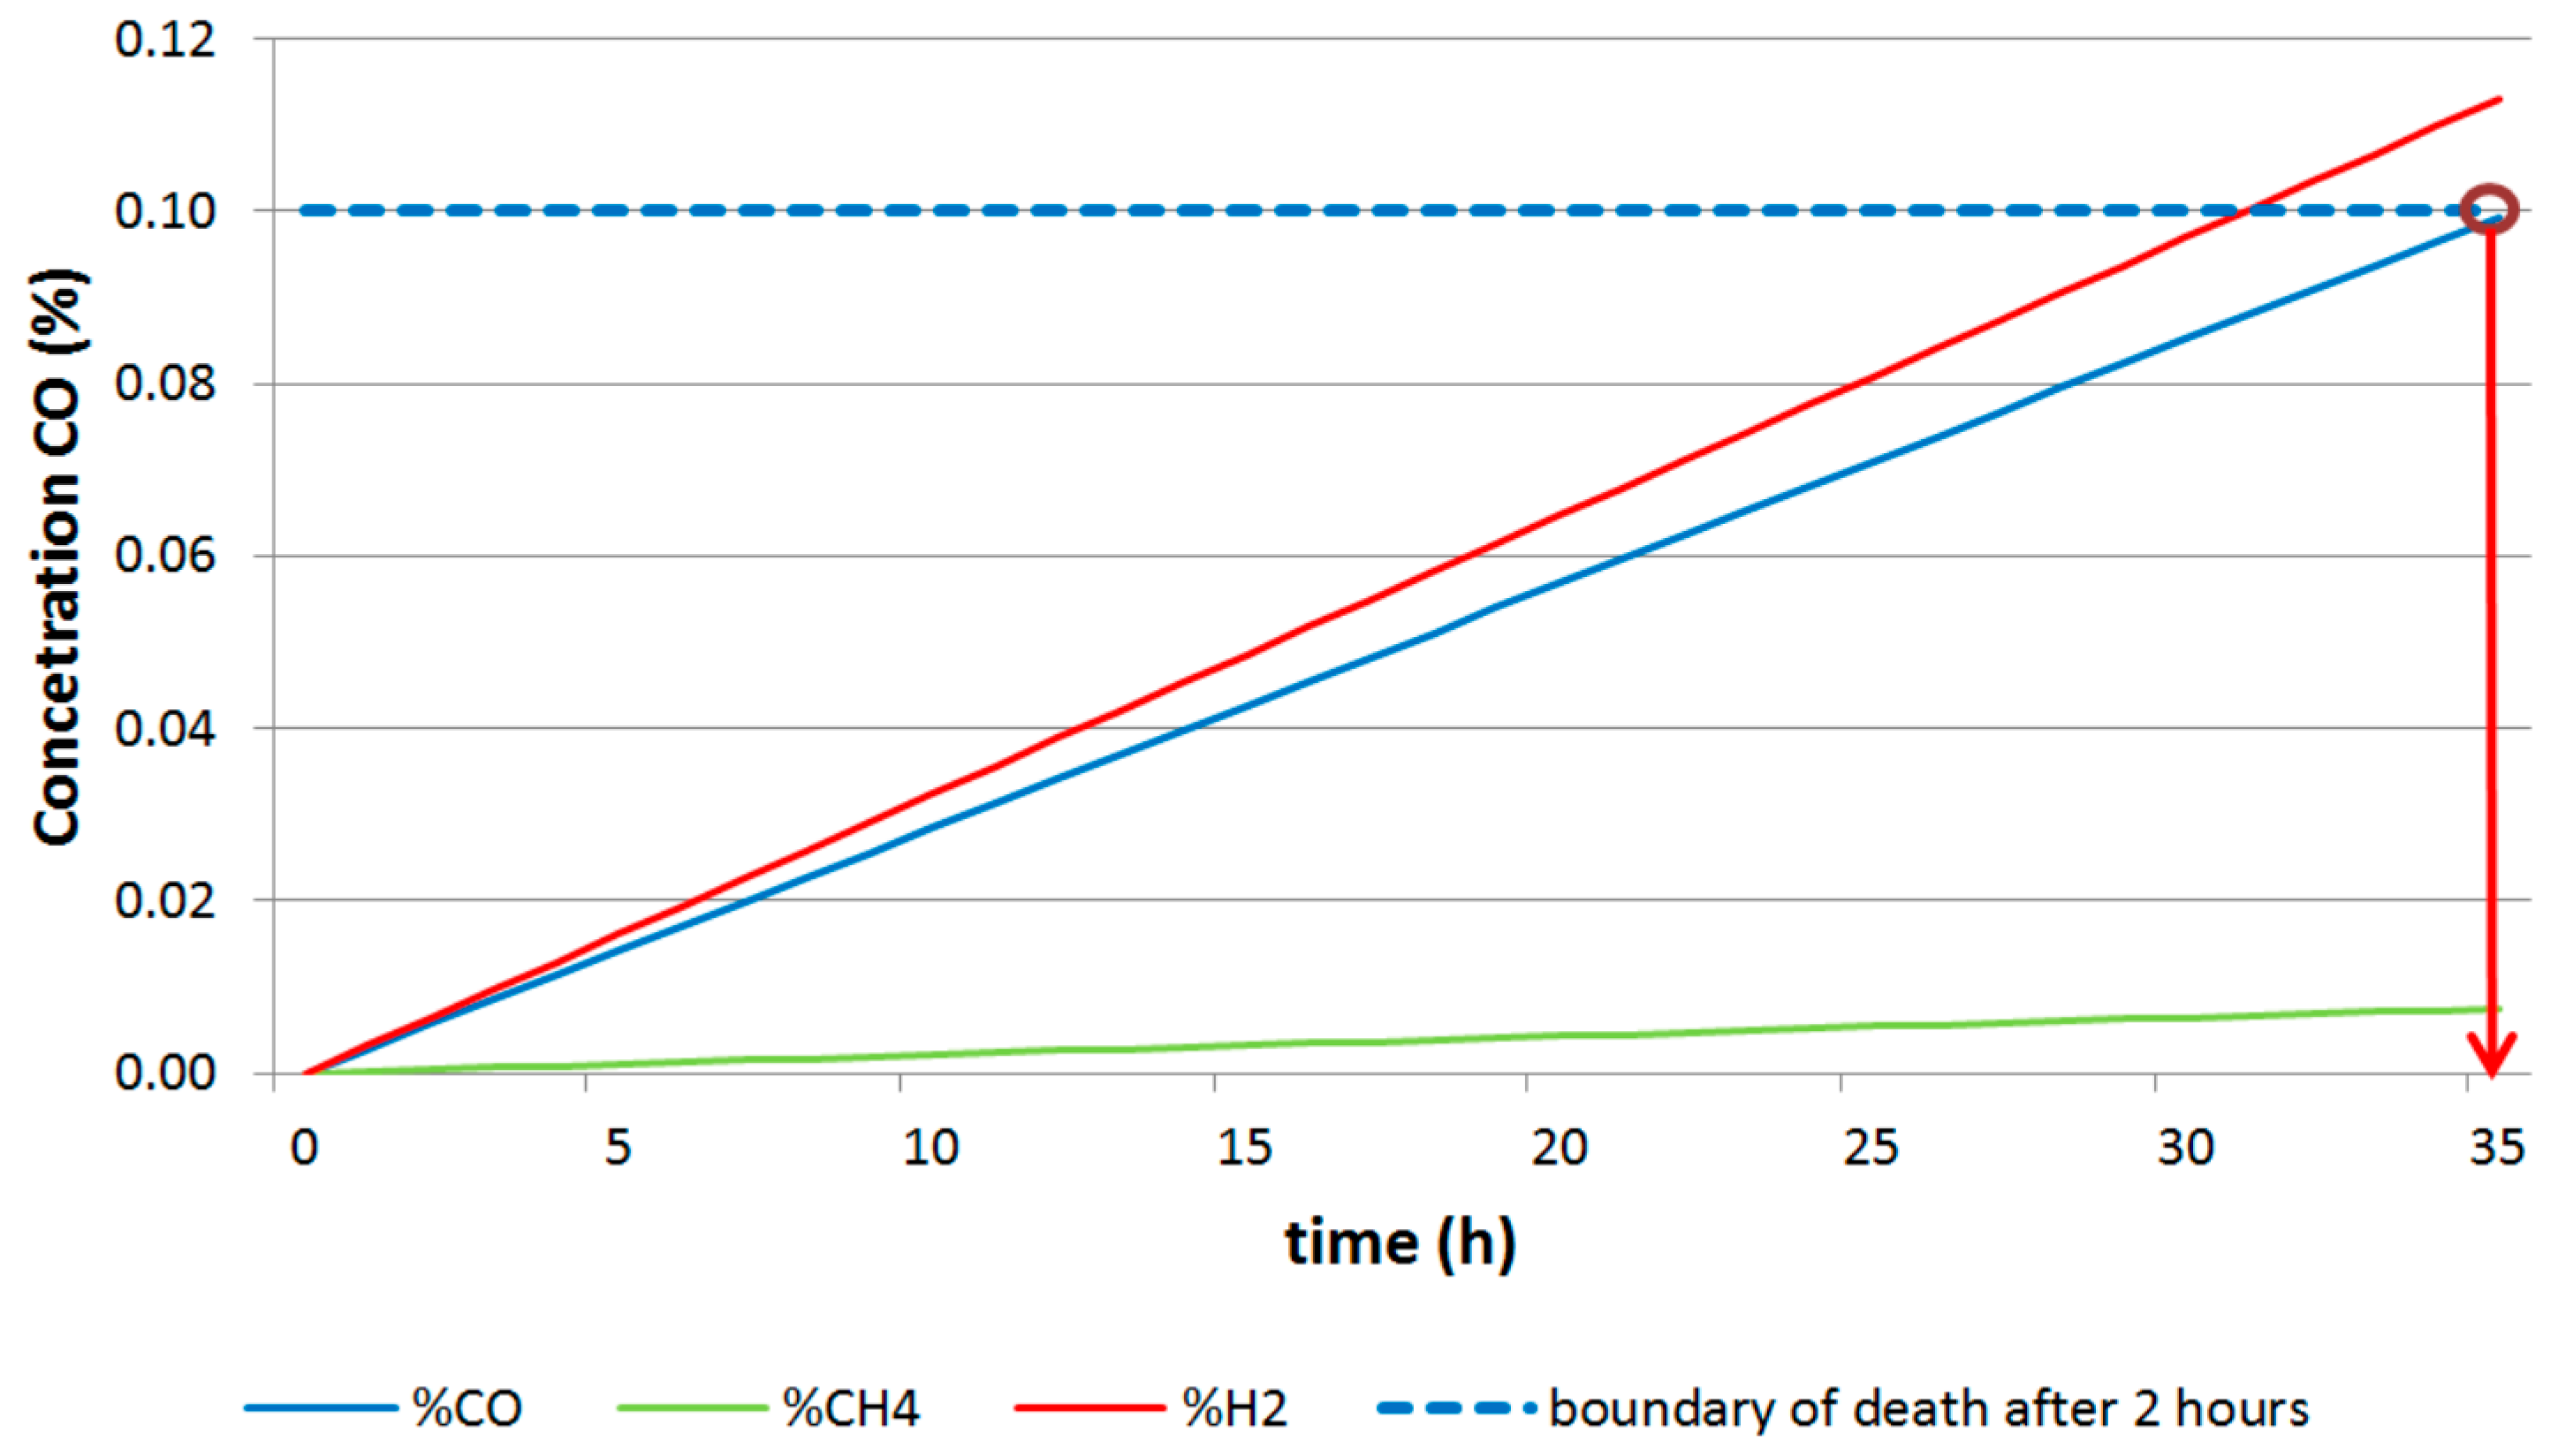
3.2.2. Results of the Simulation for CO Poisoning

The results of simulation studies for CO poisoning (for four cases) are shown in Table 10. We considered two critical value (limits) for CO poisoning. First critical value is 0.1% CO at which leads to death after 2 h and second critical value is 0.01% CO. The smallest value of the critical time (for limit CO = 0.01%), 3.6 h, for CO poisoning was obtained by the case Barbara 1. For limit CO = 0.1% is smallest critical time 35 h by the case Barbara 1 too. Figure 20 shows the determination of the critical time for the possibility for CO poisoning (volume of room 80 m3, exp. Barbara 1).

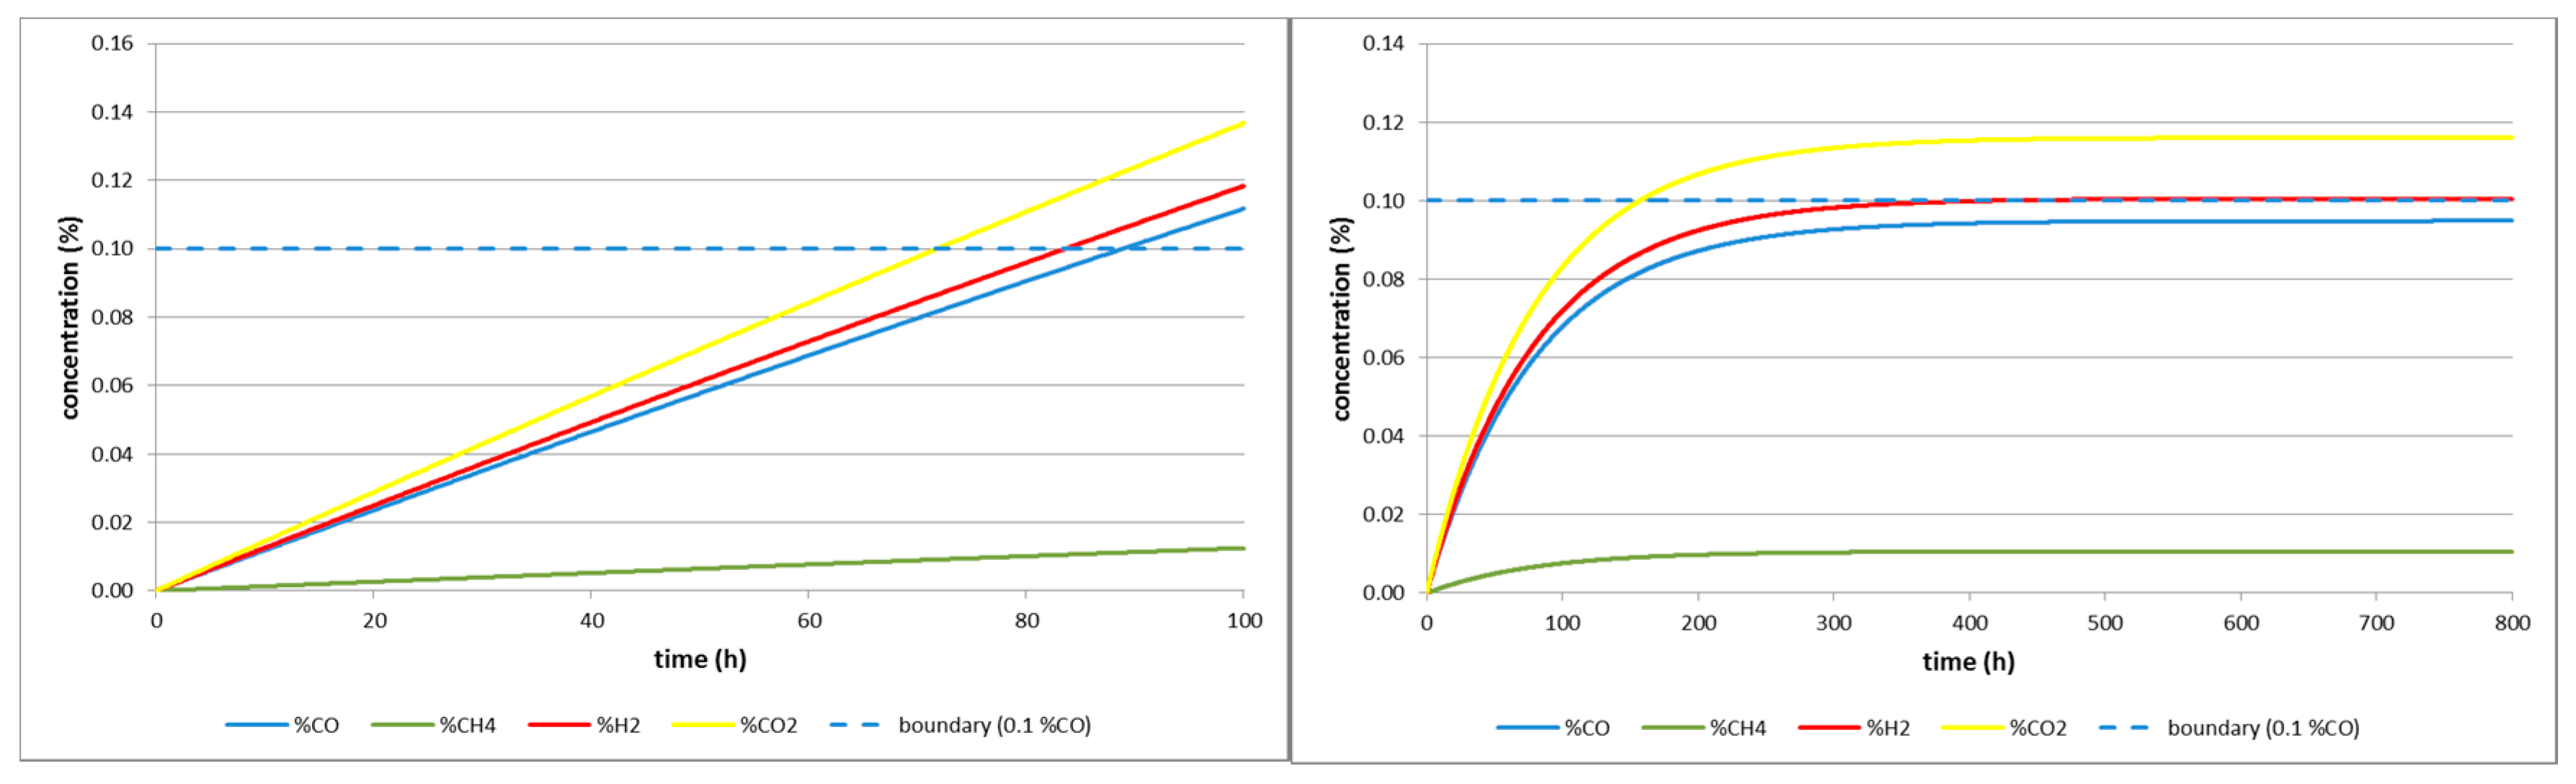
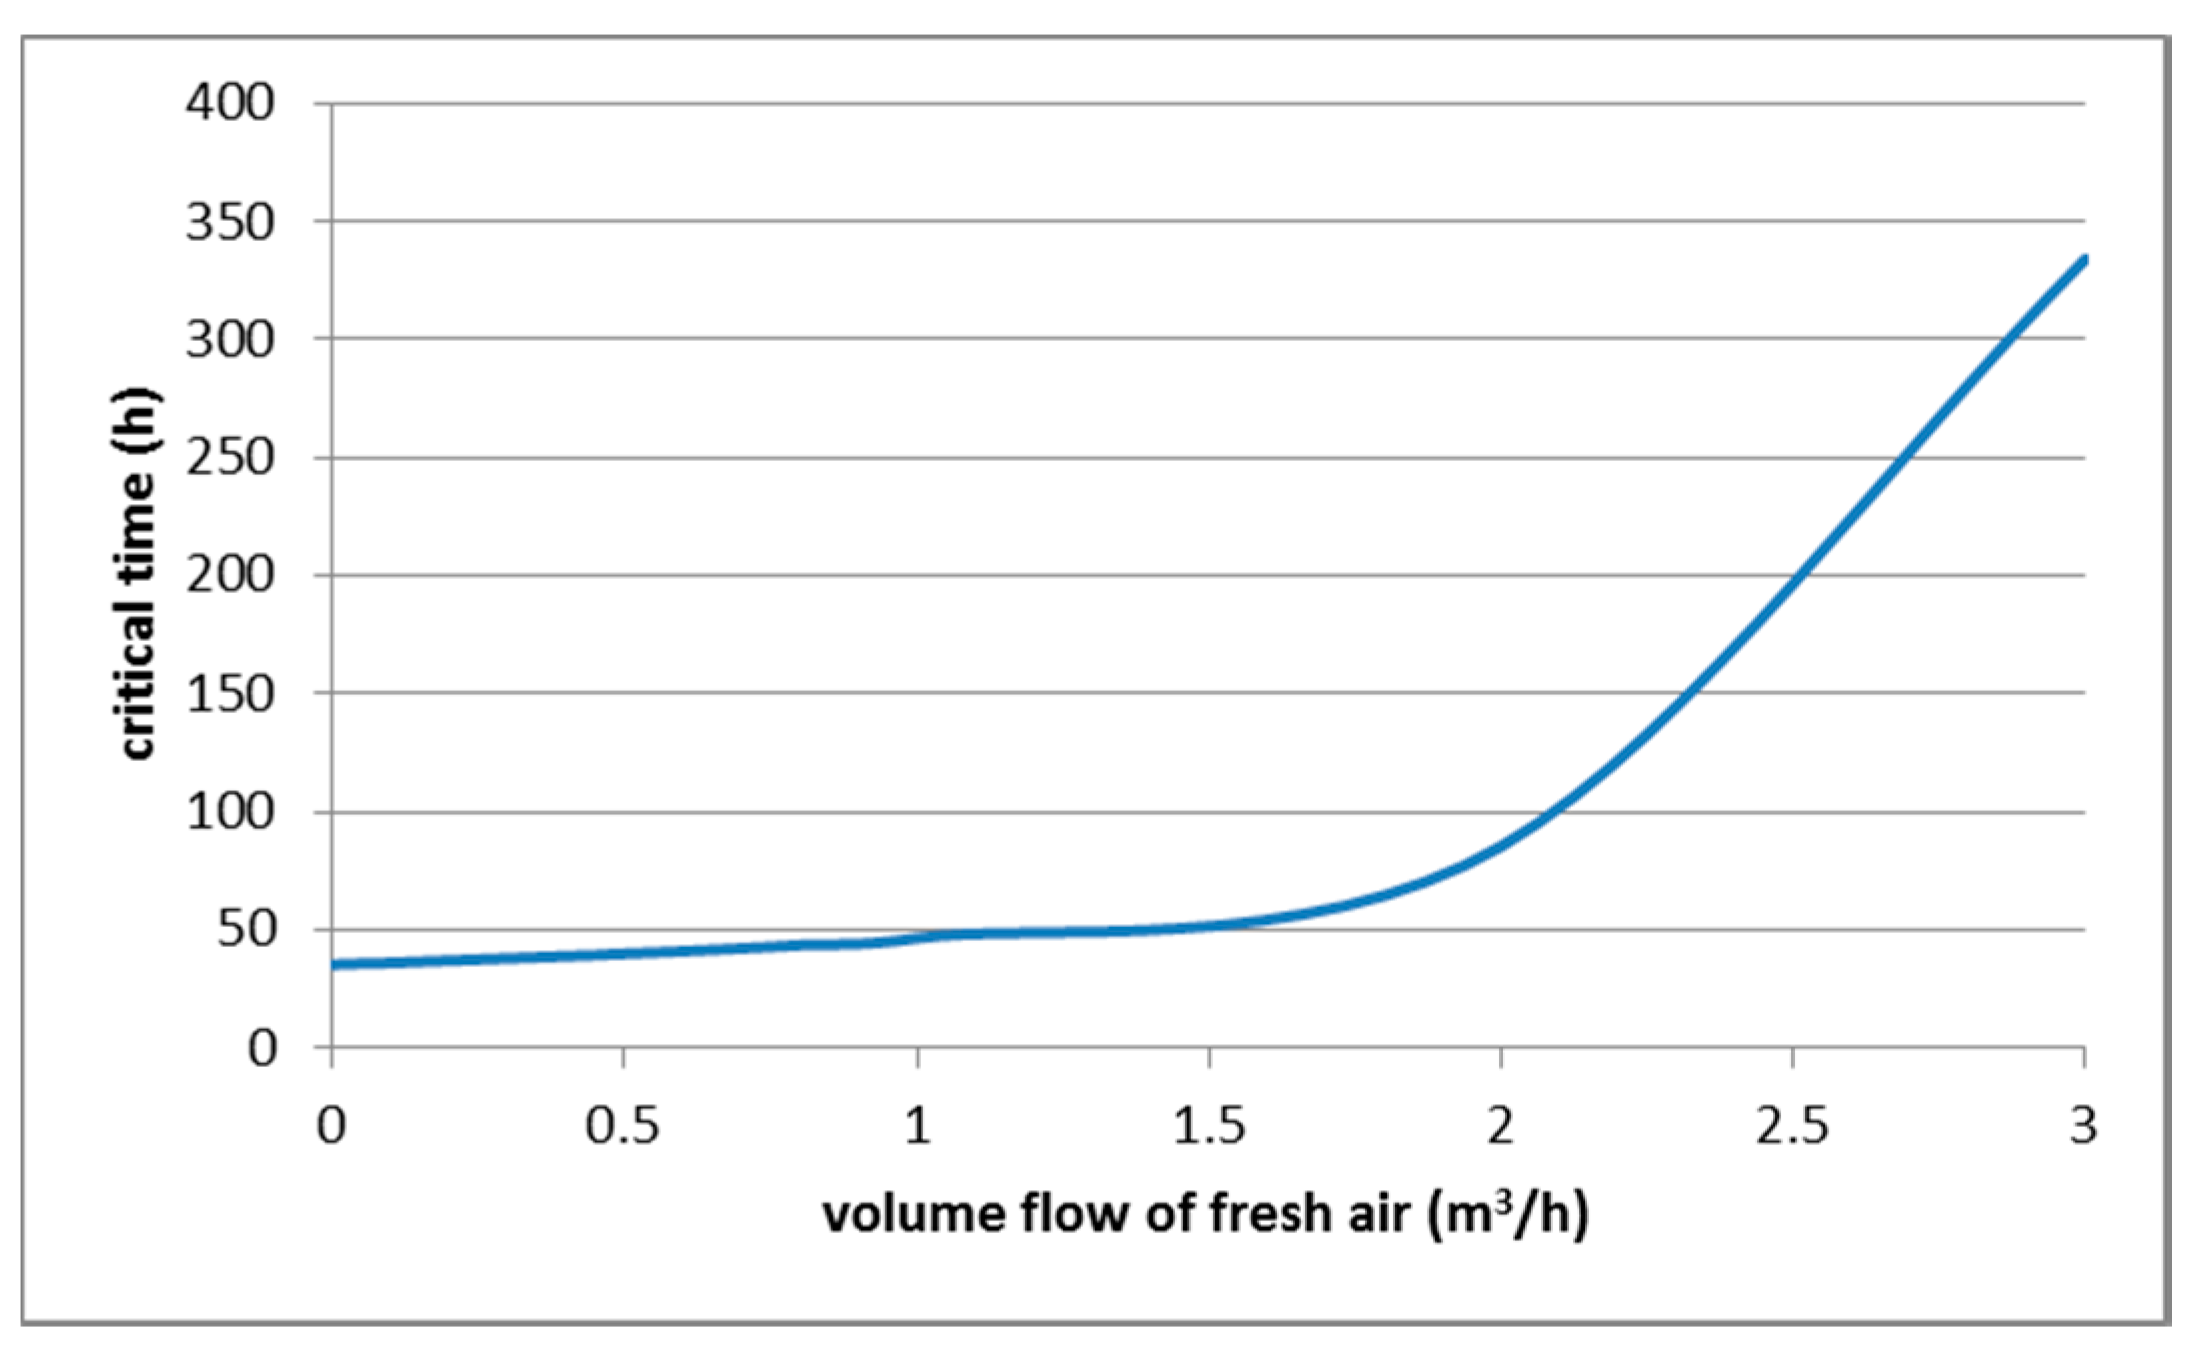
3.2.3. The Results of the Simulation on the Model with Fresh Air Intake

In the previous two cases of the simulation studies, we did not consider the flow of fresh air into the room. Only the leaking syngas from the UCG cavity flowed into the room and mixed with the air in the room. In this case, we implemented simulations with fresh airflow with a certain flow. Simulation studies were done for two experiments from the Barbara experimental mine for a volume flow of fresh air of 0.01, 0.03, 0.1 and 1 m3/h (Table 11). The critical time was determined for a dangerous explosion and CO poisoning for the listed flows of fresh air. From the results we can see that at a volume of airflow of 0.1 m3/h the boundary for an explosion is not reached during the whole experiment. The critical time for CO poisoning is when volume airflow is smaller as 0.1 m3/h i.e., approximately 35 h for the experiment Barbara 1 and 85 h for the experiment Barbara 2. The volume airflow of 1 m3/h is, for the critical time, greater by 10 h than for the volume airflow 0.1 m3/h in the Barbara 1 experiment and for Barbara 2 at this volume of airflow there is no danger of CO poisoning (Table 11).
Figure 21 shows concentration of syngas from the model of mixing gases with fresh air intake for determining critical time of CO poisoning. On the left side are results for the Barbara 1 experiment, at volume airflow of 0.1 m3/h. On the right side are results for the Barbara 1 experiment, at volume airflow 1 m3/h.

4. Discussion

There are in detail discussed two UCG environmental impacts (the heat effect and a syngas leaking) for shallow and deeper coal seams. The study of the temperature field distribution in heated surrounding rock, determination of the ranges of the heated surrounding rock and heat influence in the underground coal gasification process are addressed in paper [56]. That paper describes the simplified solution as an analytical solution of one-dimensional non-stationary heat conduction for multi-layer overburden layers for the first and fourth boundary conditions using the COMSOL program [56]. This paper analyzed the influence of the thermo-physical parameters and subsequent calculations of the ranges of burned surrounding rock and the heat influence on the surrounding rock. The coal seam model consisted of a coal layer with the following dimensions: the gasification channel length was 15 m and the coal layer thickness was 2 m, the overburden layer was 60 m. The calculation point for determining the heat influence was considered to be in the center of the coal part along the length of the gasification channel. The calculations showed that the extent of the temperature change in the overburden was 18.78 m from the boundary of coal and overburden to the earth’s surface [56]. In our case, the temperature changes were determined at up to approximately 6.2 m for all tested velocities of the gasification front movement for the simulation of the Barbara experimental mine and about 14 m from the boundary of the coal and overburden towards the Earth's surface in the case of simulation of the Wieczorek experimental mine. The influence of the different velocities of gasification front movement was demonstrated mainly at temperatures closer to the boundary of the coal and overburden, where at a lower velocity of gasification 0.5 m/day there are higher temperatures than at a velocity of 2 m/day. The in situ reactor heat acts for a longer time on the overburden layer. The difference between the results in the paper [56] and the results in our paper may be caused by different overburden layer composition, coal seam dimensions, and the different velocity of the gasification front movement. From the Figures of the two-dimensional temperature fields, the time changes of the heat flows and the temperature behaviors from the boundary of the coal and overburden into to the earth’s surface mentioned in Section 3.1 we can state that in our case there are negligible changes at the temperatures on the earth’s surface due to the UCG process. In the case of larger dimensions of the coal seam and its location closer to the earth’s surface, and also at slow velocity of the gasification front movement, we can assume that the effect of temperature change on the earth's surface will be higher. The influence of coal seam thickness is confirmed by the simulation on the Wieczorek experimental mine in which the temperature changes were more distant from the coal—overburden boundary as in the simulation on the Barbara experimental mine.
Subsidence of the surface depends on changes of the overburden’s mechanical properties. Based on the envelope curve property, it is suggested that the envelope curve could be used as the calculation basis of burnt surrounding rock range, coal-wall coking cycle range and heat influence range, and the yardstick and temperature thresholds are given as follows: the elastic modulus or tensile strength decrease is used as yardstick of surrounding rock burnt, the burnt temperature thresholds of mudstone and sandstone are 873.15 and 973.15 K respectively; coal char range in thermal condensation stage is defined as coking cycle range whose temperature threshold is 873.15 K [56]. These thresholds are not exceeded (see Table 5) in the investigated UCG experiments and surface subsidence was not observed in that time. In the analysis of the syngas leaking to the surface from the UCG process, two possible undesirable effects were assessed. The first is the possibility of explosion and the second is CO poisoning when mixing the syngas with air in a closed room. The simulation studies were implemented on a simulation model for mixing of gasses. The composition of the syngas was determined as the average gas composition of the four experimenters (Table 8). The simulation analysis was focused on the determination of the critical time of the possibility of explosion, or CO poisoning. The critical time is the time at which the lower limit of explosibility of some component in the mixed gas will be reached (Table 6), or the limit of CO content for poisoning (Table 7).
From the simulation results we can see that the lowest value of critical time for possibility of explosion was reached at the experiment at Barbara 1 (54 days for volume of room 80 m3). In this case, it exceeded the lower limit explosion for H2. From the point of view of content of syngas in individual experiments, the highest value of H2 is in this experiment, namely 36.3%. The Barbara experimental mine is less deep underground (20 m) than the Wieczorek mine (450 m). Volume flow of leaking syngas is bigger for Barbara mine as is for mine Wieczorek. In the Cigel experiment, the lower limit explosive for methane was reached, which is in syngas 7–8 times higher (14.7%) compared to other experiments. Critical time for possibility of explosion in this experiment is 3 697 days for a room volume of 80 m3 (Table 9).
When we analyze the critical time for CO poisoning, the lowest values were reached again in Barbara mine experiments (exp. Barbara 1—one day and exp. Barbara 2—four days). The Barbara 1 experiment has the highest CO average content in syngas, but in Barbara 2 experiment the CO content is comparable to the Wieczorek experiment. The critical time for experiment Wieczorek is much larger than the experiments from Barbara mine (80 days). As already mentioned, the leaking syngas from the Barbara has a larger volume flow (less depth), which is a result of a smaller value for critical time.
In the previous two cases of simulation studies, we did not consider the flow of fresh air into the room. Only the leaking syngas from UCG cavity flowed into the room and mixed with the air in the room. In the last case, simulations analysis determined the critical time of explosion and CO poisoning with fresh air intake into the room. Simulations were performed only for the two experiments from the Barbara mine. From the results we can see, that already at volume flow of fresh air 0.1 m3/h, the limits for explosion were not reached. The critical time for CO poisoning was greatly increased at volume flow of 1 m3/h of fresh air and in Barbara 2 this flow does not cause CO poisoning (Table 11). Influence of the volume flow of fresh air to critical time for CO poisoning is shown on Figure 22.
The closure of coal mines does not terminate their impact on the environment. Gas emissions into the atmosphere are the one of the problems. The closed “Gliwice II’’ shaft has been selected for a series of measurements to assess greenhouse gas emissions from the closed mine; however, only CO2 emission has been detected. During the conducted research, it was detected that the highest amount of carbon dioxide emission was VCO2 = 0.023 m3/s (which is 82.8 m3/h) [83]. By comparison the calculated CO2 emissions from experiments at the Barbara experimental mine are much lower than the emission values than in that paper. In the experiment Barbara 1, it is VCO2 = 2.95 × 10⁻⁷ m3/s (which is 1.06 × 10⁻³ m3/h) and at experiment Barbara 2 it is VCO2 = 3.25 × 10⁻⁷ m3/s (which is 1.17 × 10⁻³ m3/h). Calculated values of emissions CO2, CO and CH4 for experiment Barbara 1 and Barbara 2 are shown in Table 12.

5. Conclusions

Underground Coal Gasification, which is a process of in situ conversion of coal/lignite into syngas, could enable exploitation of the non-mineable resource. The UCG process is an improvement over the combination of conventional mining and surface combustion of coal. As the process is being carried out underground, there is lower particulate emission, lower water requirement, no waste (ash) generation, etc. This helps reduce surface subsidence, minimize the disturbance of the underground hydrosphere and lithosphere, and save a lot of space for tailings. However, there are environmental issues that arise from the process and can broadly be classified as surface and subsurface issues.
This paper mainly analyzes two particular impacts of UCG on the environment:
  • heat impact on temperature of the surface and surroundings of the UCG cavity,
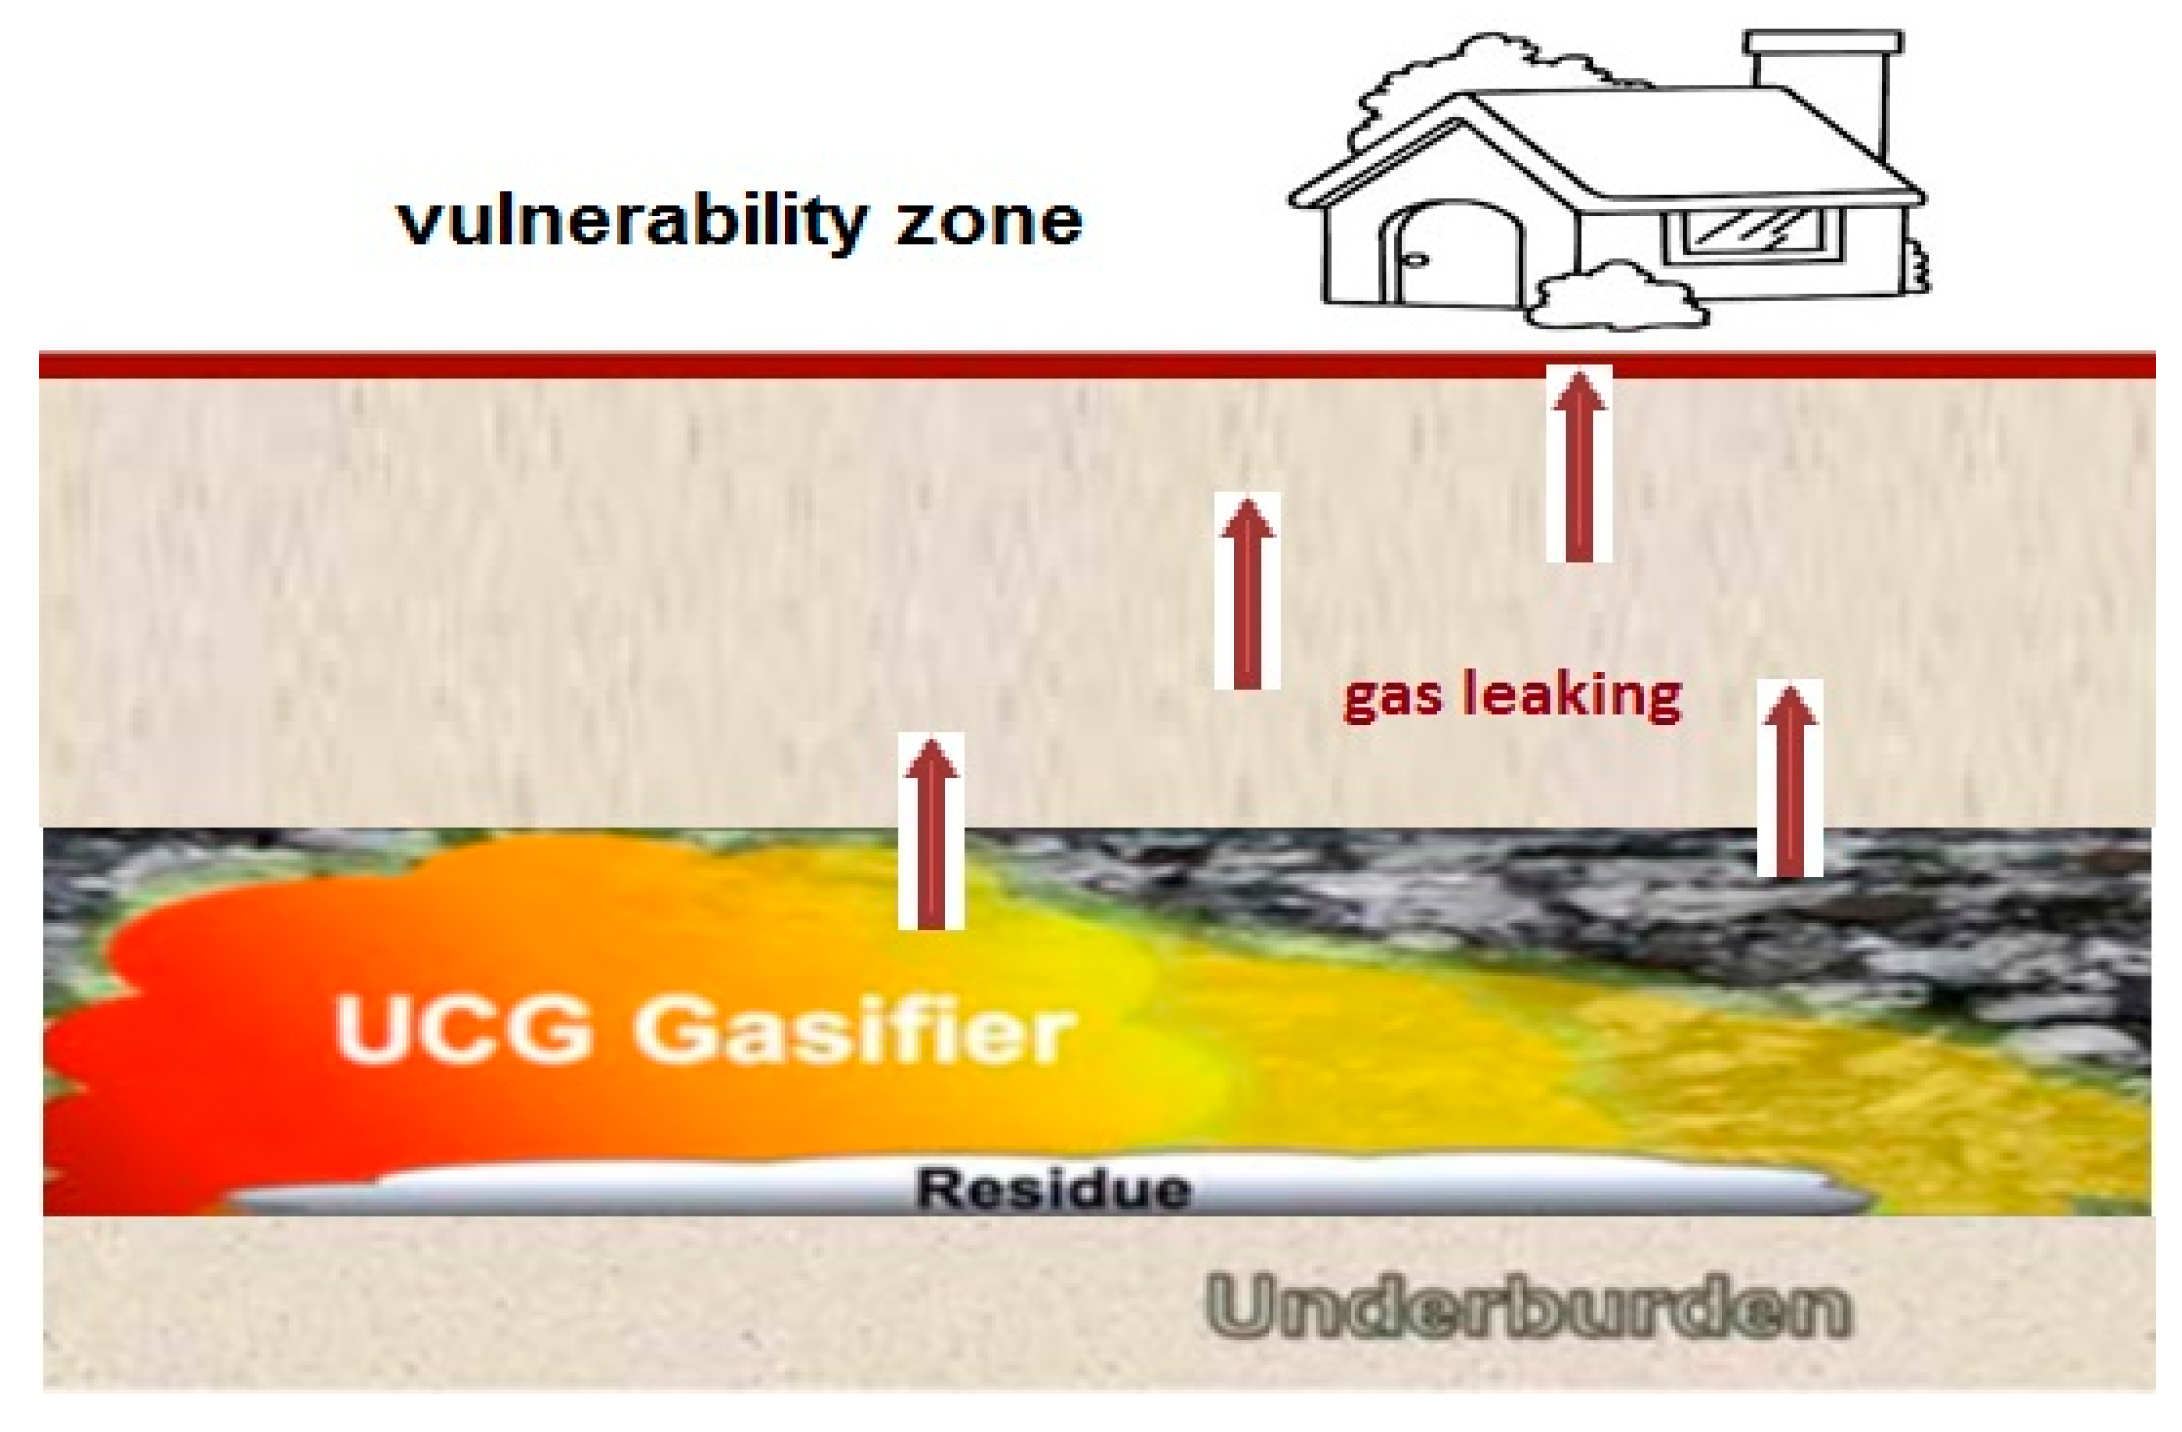
  • the possibility of explosion and CO poisoning by syngas leaking from UCG through the overburden into vulnerability zone on surface.
The numerical solutions of two-dimensional unstable heat conduction equations for multi-layer overlying strata are obtained by using the method of elementary balances, which meet the first and the fourth kinds of boundary conditions in the UCG stope. Conclusions from mathematical modelling and simulation studies are obtained as follows:
  • The high-temperature heat source of the flame working face moves directionally during the process of UCG, which makes the boundary temperature of surrounding rock to be a velocity function in the horizontal and vertical directions. The temperature in the roof increases at first and then decreases with time; the peak value of the temperature curve decreases gradually, and the position of the peak value moves into the interior of the roof.
  • In this paper, for simulations of temperature fields a simplified approach was used for a mathematical model. Heat transfer model (1–9) is possible to improve by exchange (1) by a model which describes the heat exchange between streaming water and overburden [84]. Of course, water physical parameters must be replaced by syngas leaking parameters. This access to the improving of the heat transfer model by heat transfer by convection and mass of syngas leaking is our aim in future.
  • The greater the thickness of the coal seams, the higher the temperature of the rock at the same distance from the UCG cavity. This note is clear from comparing simulations of the heat fields of gasification of deposits in the Barbara and Wieczorek mines.
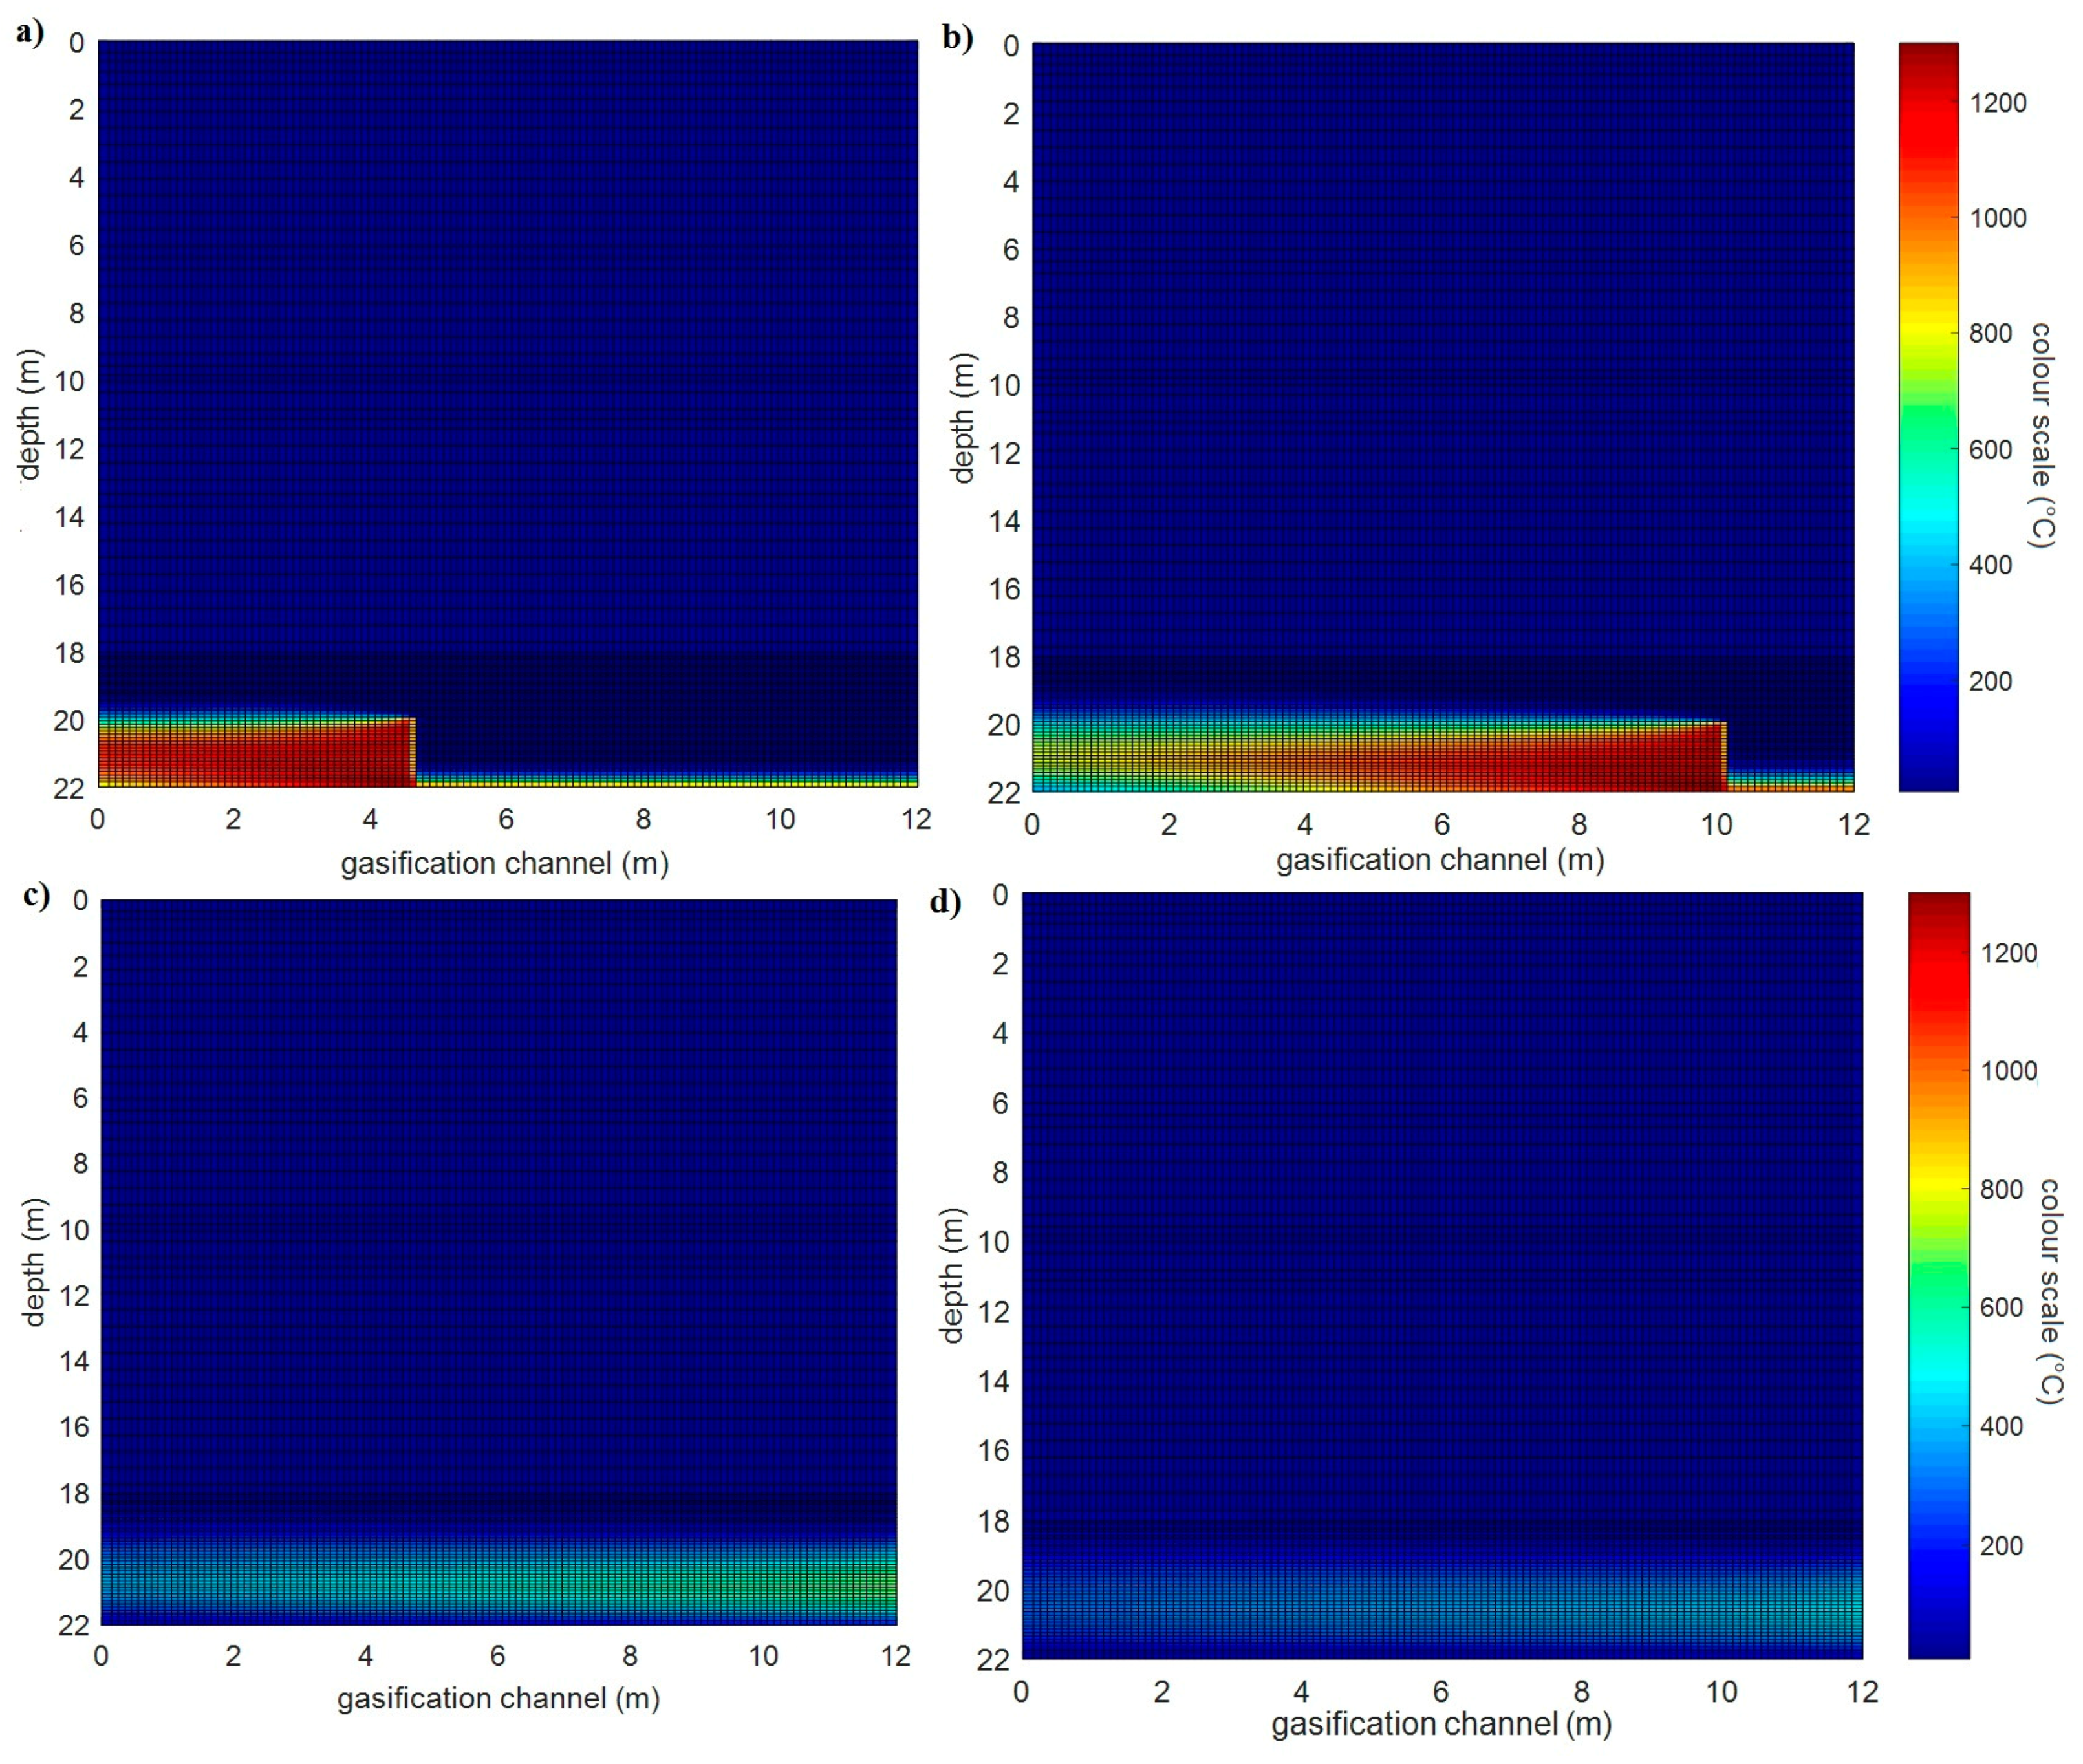
  • From analysis of the influence of velocity of movement of the gasification front in both directions, the following was observed: at greater velocities of movement of the gasification front in both directions, the rock temperatures are lower at equivalent distances from the UCG cavity.
Similar to in mines with more spontaneous gasification of coal, (e.g., the Cigel mine) there is also a risk of escape of gas into the vulnerable areas. Of course, it depends on permeability of rock layers and other parameters. Syngas consists of explosive and poisonous gases and therefore these dangerous phenomena were also evaluated. The analysis conducted had the following findings and recommendations:
  • In small unventilated areas a much more toxic and explosive atmosphere is produced than in large areas (e.g., halls, warehouses). Table 9 and Table 10 compare critical poisoning and explosion times after initialization for different volumes of enclosed working or living spaces. This critical time for poisoning or explosion with increasing volume of a room is prolonged linearly.
  • For this reason, in the affected areas, closed spaces should be regularly monitored and intensely ventilated during UCG (see Figure 21 and Figure 22).
  • The danger of explosion and poisoning with syngas is higher for shallow gasified coal deposits (Barbara) compared with deposits found at greater depths (Cigel and Wieczorek).
  • Depending on the permeability of the overburden, over-pressure or under-pressure of the underground gasification regime should be used. If the UCG technology enables operation at greater permeability, it allows operation with under-pressure, then this method of controlling the pressure ratios needs to be applied.
  • Syngas leakage will also increase the concentration of greenhouse gases in the air. However, carbon dioxide escapes into the air even from closed coal mines. An analysis of this negative environmental impact has shown that significantly less CO2 is released in the evaluated UCG experiments than in a closed coal mine [83]. This amount of leaked CO2 during UCG will be even lower if the recommendations in point 6 are implemented.
In conclusion, we can say that, as with any technology, UCG has a negative impact on the environment. Through years of research and practice, underground coal gasification technology has demonstrated advantages such as being safe, environmentally friendly, energy-efficient, and having superior use of resources. This technology can serve as the front-end support and guarantee for the coal-based chemical industry and for electricity and heat production.

Author Contributions

K.K. was head of both UCG projects in Slovakia, proposed the main idea, offered invaluable suggestions for data analysis and revised the manuscript thoroughly; M.L. created the simulation mixing gasses model, performed the simulations and made careful data analysis; M.D. created simulation two-dimensional temperature model and evaluated simulation cases. All authors performed UCG experiments and wrote this paper.

Acknowledgments

This work was supported by EC Research Programme of the Research Fund for Coal and Steel (Grant No. RFCR-CT-2013-00002, project COGAR) and National Science Agency of Slovakia (Grant No. VEGA 1/0273/17).

Conflicts of Interest

The authors declare no conflict of interest.

References

  1. Lyu, X.; Shi, A. Research on the Renewable Energy Industry Financing Efficiency Assessment and Mode Selection. Sustainability 2018, 10, 222. [Google Scholar] [CrossRef]
  2. Sajjad, M.; Rasul, M.G. Review on the Existing and Developing Underground Coal Gasification Techniques in Abandoned Coal Seam Gas Blocks: Australia and Global Context. In Proceedings of the 1st International e–Conference on Energies, Roma, Italy, 14–31 March 2014; pp. 1–16. Available online: http://sciforum.net/conference/ece-1 (accessed on 10 April 2018).
  3. Bhutto, A.W.; Bazmi, A.A.; Zahedi, G. Underground coal gasification: From fundamentals to applications. Prog. Energy Combust. Sci. 2013, 39, 189–214. [Google Scholar] [CrossRef]
  4. Couch, G.R. Underground Coal Gasification; Report No.: Contract No.: CCC/151IEA; Clean Coal Centre: London, UK, 2009. [Google Scholar]
  5. Hammond, G.P. Energy, environment and sustainable development: A UK perspective. Process Saf. Environ. Protect. 2000, 78, 304–323. [Google Scholar] [CrossRef]
  6. Royal Commission on Environmental Pollution. Twenty-Second Report: Energy—The Changing Climate, Cm 4749; The Stationery Office: London, UK, 2000; pp. 33–38. Available online: http://www.rcep.org.uk/reports/22-energy/22-nergyreport.pdf (accessed on 1 January 2011).
  7. Intergovernmental Panel on Climate Change (IPCC). IPCC Special Report on Carbon Dioxide and Storage; Cambridge University Press: Cambridge, UK, 2005; Available online: http://www.ipcc.ch/pdf/special-reports/srccs/srccs_wholereport.pdf (accessed on 1 January 2011).
  8. Hammond, G.P.; Waldron, R. Risk assessment of UK electricity supply in a rapidly evolving energy sector. Proc. Inst. Mech. Eng. A J. Power. Energy 2008, 222, 623–642. [Google Scholar] [CrossRef]
  9. Lendle, A.; Schaus, M. Sustainability Criteria in the EU Renewable. Energy Directive: Consistent with WTO Rules? ICTSD Information Note No. 2; International Centre for Trade and Sustainable Development: San Francisco, CA, USA, 2010. [Google Scholar]
  10. Fabra, N.; Matthes, F.C.; Newbery, D.; Colombier, M. The Energy Transition in Europe: Initial Lessons from Germany, the UK and France; Towards a Low Carbon European Power Sector; CERRE (Centre on Regulation in Europe): Brussels, Belgium, 2015. [Google Scholar]
  11. Deloitte, C. Energy Market Reform in Europe. European. Energy and Climate Policies: Achievements and Challenges to 2020 and Beyond; Deloitte Conseil: Paris, France, 2015. [Google Scholar]
  12. Onea, F.; Rusu, E. Sustainability of the Reanalysis Databases in Predicting the Wind and Wave Power along the European Coasts. Sustainability 2018, 10, 193. [Google Scholar] [CrossRef]
  13. EEA (European Environment Agency). Renewable Energy in Europe 2017. Recent Growthand Knock-On Effects; EEA Report No. 3/2017; EEA: Copenhagen, Denmark, 2017; ISBN 978-92-9213-848-6.
  14. Świądrowski, J.; Stańczyk, K. Environmental aspects of underground coal gasification. Chemik 2016, 70, 239–246. [Google Scholar]
  15. Mocek, P.; Gil, I. Analiza procesowa podziemnego zgazowania węgla w istniejącej i zlikwidowanej kopalni—Process analysis of underground coal gasification in existing and abandoned mine. Chemik 2015, 69, 827–839. [Google Scholar]
  16. Brown, K.M. In situ coal gasification: An emerging technology. J. Am. Soc. Min. Reclam. 2012, 1, 103–122. [Google Scholar] [CrossRef]
  17. Prabu, V.; Jayanti, S. Underground coal-air gasification based solid oxide fuel cell system. Appl. Energy 2012, 94, 406–414. [Google Scholar] [CrossRef]
  18. Prabu, V.; Jayanti, S. Integration of underground coal gasification with a solid oxide fuel cell system for clean coal utilization. Int. J. Hydrogen Energy 2012, 37, 1677–1688. [Google Scholar] [CrossRef]
  19. Yang, L.; Zhang, X.; Liu, S.; Yu, L.; Zhang, W. Field test of large-scale hydrogen manufacturing from underground coal gasification (UCG). Int. J. Hydrogen Energy 2008, 33, 1275–1285. [Google Scholar] [CrossRef]
  20. Stanczyk, K.; Smolinski, A.; Kapusta, K.; Wiatowski, M.; Swiadrowski, J.; Kotyrba, A.; Rogut, J. Dynamic experimental simulation of hydrogen oriented underground gasification of lignite. Fuel 2010, 89, 3307–3314. [Google Scholar] [CrossRef]
  21. Stanczyk, K.; Kapusta, K.; Wiatowski, M.; Swiadrowski, J.; Smolinski, A.; Rogut, J.; Kotyrba, A. Experimental simulation of hard coal underground gasification for hydrogen production. Fuel 2012, 91, 40–50. [Google Scholar] [CrossRef]
  22. Seifi, M.; Abedi, J.; Chen, Z. Application of porous medium approach to simulate UCG process. Fuel 2014, 116, 191–200. [Google Scholar] [CrossRef]
  23. Stanczyk, K.; Howaniec, N.; Smolinski, A.; Swiadrowski, J.; Kapusta, K.; Wiatowski, M.; Grabowski, J.; Rogut, J. Gasification of lignite and hard coal with air and oxygen enriched air in a pilot scale ex situ reactor for underground gasification. Fuel 2011, 90, 1953–1962. [Google Scholar] [CrossRef]
  24. Laciak, M.; Kačur, J.; Kostúr, K. The verification of thermodynamic model for ucg process. In Proceeding of the IEEE 17th International Carpathian Control Conference (ICCC), Tatranska Lomnica, Slovakia, 29 May–1 June 2016; pp. 424–428. [Google Scholar]
  25. Friedmann, S.J.; Upadhye, R.; Kong, F.M. Prospects for underground coal gasification in carbon-constrained world. Energy Procedia 2009, 1, 4551–4557. [Google Scholar] [CrossRef]
  26. Laciak, M.; Kostúr, K.; Durdán, M.; Kačur, J.; Flegner, P. The analysis of the underground coal gasification in experimental equipment. Energy 2016, 114, 332–343. [Google Scholar] [CrossRef]
  27. Gür, M.; Eskin, N.; Okutan, H.; Arısoy, A.; Böke, E.; Altıntaş, Ü.; Yıldız, A.; Büyükşirin, O.; Yıldırım, O.; Canbaz, E.D. Experimental Results of Underground Coal Gasification of Turkish Lignite in an Ex-Situ Reactor. Fuel 2017, 203, 997–1006. [Google Scholar] [CrossRef]
  28. Yang, D.; Koukouzas, N.; Green, M.; Sheng, Y. Recent development on underground coal gasification and subsequent CO2 storage. J. Energy Inst. 2016, 89, 469–484. [Google Scholar] [CrossRef]
  29. Mao, F. Underground coal gasification (UCG): A new trend of the supply-side economics of fossil fuels. Nat. Gas Ind. B 2016, 3, 312–322. [Google Scholar] [CrossRef]
  30. Liu, S.; Liu, J.; Yu, L. Environmental benefits of underground coal gasification. J. Environ. Sci. 2002, 14, 284–288. [Google Scholar]
  31. Khadse, A.; Qayyumi, M.; Mahajani, S.; Aghalayam, P. Underground coal gasification: A new clean coal utilization technique for India. Energy 2007, 32, 2061–2071. [Google Scholar] [CrossRef]
  32. Lloyd-Smith, M. Underground Coal Gasification (UCG), Report NTN (National Toxics Network) 2015, Bangalow, Australia. Available online: www.ntn.org.au (accessed on 7 May 2018).
  33. Smoliński, A.; Stańczyk, K.; Kapusta, K.; Howaniec, N. Analysis of the organic contaminants in the condensate produced in the in situ underground coal gasification process. Water Sci. Technol. 2013, 67, 644–650. [Google Scholar] [CrossRef] [PubMed]
  34. Fischer, D.D.; Boyd, R.M.; Schrider, L.A. Environmental Impact Studies Related to Underground Coal Gasification; Energy Research and Development Administration Laramie Energy Research Center, University Station Laramie: Laramie, WY, USA, 1975; p. 15. [Google Scholar]
  35. Imran, M.; Kumar, D.; Kumar, N.; Qayyum, A.; Saeed, A.; Bhatti, M.S. Environmental concerns of underground coal gasification. Renew. Sustain. Energy Rev. 2014, 31, 600–610. [Google Scholar] [CrossRef]
  36. Xu, B.; Chen, L.; Xing, B.; Li, L.; Zhang, L.; Wang, X.; Chen, H.; Yi, G.; Huang, G. The environmental effect of underground coal gasification semi-coke on confined groundwater Environmental Progress and Sustainable. Energy 2016, 35, 1584–1589. [Google Scholar]
  37. Sury, M.; White, M.; Kirton, J.; Carr, P.; Woodbridge, R.; Mostade, M.; Chappell, R.; Hartwell, D.; Hunt, D.; Rendell, N. Review of Environmental Issues of Underground Coal Gasification Report No. COAL R272 DTI/Pub URN 04/1880 2004, 24; FWS Consultants Ltd.: Spennymoor, UK, 2004; Available online: https://www.google.com/url?sa=t&rct=j&q=&esrc=s&source=web&cd=1&ved=0ahUKEwjvjsTkv_faAhULpJQKHel2CkoQFgguMAA&url=http%3A%2F%2Flarge.stanford.edu%2Fcourses%2F2014%2Fph240%2Fcui2%2Fdocs%2Ffile19154.pdf&usg=AOvVaw0Kpor-fCFMSp2fofCw7Xf_ (accessed on 7 May 2018).
  38. Xu, B.; Chen, L.; Li, L.; Xing, B.; Huang, G.; Wang, X.; Yi, G.; Su, Y.; Zhan, L. Removal Properties of Hexavalent Chromium and Hazardous Trace Elements in UCG Condensate Water by Semi-Cokes. Coke Chem. 2015, 58, 188–195. [Google Scholar] [CrossRef]
  39. Van den Hove, S.; Le Menestrel, M.; de Bettignies, H.-C. The oil industry and climate change: Strategies and ethical dilemmas. Clim. Policy 2002, 2, 3–18. [Google Scholar] [CrossRef]
  40. Skjaerseth, J.B.; Skodvin, T. Climate Change and the Oil Industry: Common Problems, Different Strategies. Glob. Environ. Politics 2001, 1, 43–64. [Google Scholar] [CrossRef]
  41. Wang, D.; Li, T. Carbon Emission Performance of Independent Oil and Natural Gas Producers in the United States. Sustainability 2018, 10, 110. [Google Scholar] [CrossRef]
  42. Hiatt, S.R.; Grandy, J.B.; Lee, B.H. Organizational Responses to Public and Private Politics: An Analysis of Climate Change Activists and U.S. Oil and Gas Firms. Organ. Sci. 2015, 26, 1769–1786. [Google Scholar] [CrossRef]
  43. Ding, T.; Ning, Y.; Zhang, Y. The Contribution of China’s Outward Foreign Direct Investment (OFDI) to the Reduction of Global CO2 Emissions. Sustainability 2017, 9, 741. [Google Scholar] [CrossRef]
  44. Burchart-Korol, D.; Krawczyk, P.; Czaplicka, K.; Smoliński, A. Eco-efficiency of underground coal gasification (UCG) for electricity production. Fuel 2016, 173, 239–246. [Google Scholar] [CrossRef]
  45. Roddy, D.J.; Younger, P.L. Underground coal gasification with CCS: A pathway to decarbonising industry. Energy Environ. Sci. 2010, 3, 400–407. [Google Scholar] [CrossRef]
  46. Kempka, T.; Fernández-Steeger, T.; Li, D.Y.; Schulten, M.; Schlüter, R.; Krooss, B.M. Carbon dioxide sorption capacities of coal gasification residues. Environ. Sci. Technol. 2011, 45, 1719–1723. [Google Scholar] [CrossRef] [PubMed]
  47. Hammond, G.P.; Ondo Akwea, S.S.; Williams, S. Techno-economic appraisal of fossil-fueled power generation systems with carbon dioxide capture and storage. Energy 2011, 36, 975–984. [Google Scholar] [CrossRef] [Green Version]
  48. Kostur, K. Modeling of flowing underground waters and leakage of syngas from Underground Coal Gasification. In Proceedings of the 17th International Carpathian Control Conference (ICCC), Tatranska Lomnica, Slovakia, 29 May–1 June 2016; pp. 352–357. [Google Scholar]
  49. Kuo, H.F.; Tsou, K.W. Modeling and Simulation of the Future Impacts of Urban Land Use Change on the Natural Environment by SLEUTH and Cluster Analysis. Sustainability 2018, 10, 72. [Google Scholar] [CrossRef]
  50. Yang, Y.; Zhang, X.; Lu, X.; Hu, J.; Pan, X.; Zhu, Q.; Su, W. Effects of Building Design Elements on Residential Thermal Environment. Sustainability 2018, 10, 57. [Google Scholar] [CrossRef]
  51. Skelhorn, C.; Lindley, S.; Levermore, G. The impact of vegetation types on air and surface temperatures in a temperatecity: A fine scale assessment in Manchester, UK. Landsc. Urban Plan. 2014, 121, 129–140. [Google Scholar] [CrossRef]
  52. Su, W.; Zhang, Y.; Yang, Y.; Ye, G. Examining the Impact of Greenspace Patternson Land Surface Temperature by Coupling LiDAR Data with a CFD Model. Sustainability 2014, 6, 6799–6814. [Google Scholar] [CrossRef]
  53. Kazak, D.N.I.; Pristash, V.N. Changes in rocks at high temperatures. In Geotechnological Methods; Plenum Publishing Corporation: Berlin, Germany, 1994; pp. 472–777. [Google Scholar]
  54. Kinoshita, N.; Yasuhara, H. Thermally induced behavior of the openings in rock mass affected by high temperatures. ASCE Int. J. Geomech. 2011, 11, 124–130. [Google Scholar] [CrossRef]
  55. Bing, L.; Hong, G.; Yong-wei, L. Theoretical analysis and experimental study on relation between rock permeability and temperature. Chin. J. Rock Mech. Eng. 2005, 24, 176–188. [Google Scholar]
  56. Lin, X.; Zuotang, W.; Wengang, H.; Guojun, K.; Xuefeng, L.; Peng, Z.; Jianhua, W. Temperature field distribution of burnt surrounding rock in UCG stope. Int. J. Min. Sci. Technol. 2014, 4, 573–580. [Google Scholar]
  57. Chen, L.; Chaohu, H.; Chen, J.; Jiting, X. A back analysis of the temperature field in the combustion volume space during underground coal gasification. Min. Sci. Technol. 2009, 21, 581–585. [Google Scholar] [CrossRef]
  58. Yang, L.; Liu, S. Numerical simulation on heat transfer in the process of underground coal gasification. Numerical Heat Transfer Part A: Applications. Int. J. Comput. Methodol. 2003, 44, 537–557. [Google Scholar]
  59. Wrana, A.; Rodriguez, A.; Schlueter, R.; Farret, R.; Syrek, B.; Kostúr, K. Underground Coal Gasification in Operating Mines and Areas of High Vulnerability, Midterm 2015 and Final 2017 Report; European Commission, RFCS: Brussels, Belgium, 2017. [Google Scholar]
  60. Kotyrba, A.; Kortas, Ł.; Stańczyk, K. Imaging the Underground Coal Gasification Zone with Microgravity Surveys. Acta Geophys. 2015, 63, 634–651. [Google Scholar] [CrossRef]
  61. Kaloustian, N.; Diab, Y. Effects of urbanization on the urban heat island in Beirut. Urban Clim. 2015, 14, 154–165. [Google Scholar] [CrossRef]
  62. Kikon, N.; Singh, P.; Singh, S.K.; Vyas, A. Assessment of urban heat islands (UHI) of Noida City, India using multi-temporal satellite data. Sustain. Cities Soc. 2016, 22, 19–28. [Google Scholar] [CrossRef]
  63. D’Alfano, F.R.; Olesen, B.W.; Palella, B.I. Povl Ole Fanger’s Impact Ten Years Later. Energy Build. 2017, 152, 243–249. [Google Scholar]
  64. Parsons, K. Human Thermal Environments: The Effects of Hot, Moderate and Cold Environments on Human Health, Comfort and Performance; CRC Press, Inc.: Boca Raton, FL, USA, 2014; pp. 67–68. [Google Scholar]
  65. Gilani, S.I.U.H.; Khan, M.H.; Pao, W. Thermal Comfort Analysis of PMV Model Prediction in Air Conditioned and Naturally Ventilated Buildings. Energy Procedia 2015, 75, 1373–1379. [Google Scholar] [CrossRef]
  66. Lu, Y.I.; Wang, L.G.; Tang, F.R.; He, Y. Fracture evolution of overlying strata over combustion cavity under thermal-mechanical interaction during underground coal gasification. J. Chin. Coal Soc. 2012, 37, 1292–1298. [Google Scholar]
  67. Lewis, T.; Villinger, H.; Davis, E. Thermal conductivity measurement of rock fragments using a pulsed needle probe. Can. J. Earth Sci. 1993, 30, 480–485. [Google Scholar] [CrossRef]
  68. Daggupati, S.; Mandapati, R.N.; Mahajani, S.; Ganesh, A.; Pal, A.K.; Sharma, R.K.; Aghalayam, P. A study on the temperature profile and heat transfer coefficients in underground coal gasification cavities. In Proceedings of the 27th Annual International Pittsburgh Coal Conference 2010, Istanbul, Turkey, 11 October 2010; Volume 3, pp. 2243–2256. [Google Scholar]
  69. Kostur, K. The Possibilities of Improving Underground Coal Gasification Processes. J. Energy Power Eng. 2011, 51041–51052. [Google Scholar]
  70. Karwasiecka, M. Porównanie oerodowiska geotermicznego w obrêbie basenów wêglonooenych lubelskiego i górnooel¥skiego zag£êbia wêglowego (The comparison of geothermal environment in the Upper Silesian Coal Basin and Lublin Coal Basin). Geologia 2008, 34, 335–357. [Google Scholar]
  71. Fuchs, S.; Schütz, F.; Förster, H.-J.; Förster, A. Evaluation of common mixing models for calculating bulk thermal conductivity of sedimentary rocks: Correction charts and new conversion equations. Geothermics 2013, 47, 40–52. [Google Scholar] [CrossRef]
  72. Najafi, M.; Jalali, S.M.E.; KhaloKakaie, R. Thermal-Mechanical Numerical Analysis of Stress Distribution in the vicinity of Underground Coal Gasification (UCG) Panels. Int. J. Coal Geol. 2014, 134, 1–16. [Google Scholar] [CrossRef]
  73. Wolf, K.H.; Bruining, H. Modelling the interaction between underground coal fires and their roof rocks. Fuel 2007, 86, 2761–2777. [Google Scholar] [CrossRef]
  74. Christopher, O.; Kempka, T. Thermo-Mechanical Simulations of Rock Behavior in Underground Coal Gasification Show Negligible Impact of Temperature-Dependent Parameters on Permeability Changes. Energies 2015, 8, 5800–5827. [Google Scholar]
  75. Wrana, A. Additional Data for Project COGAR. Internal Information, Katowice, 2016. Available online: http://meteo.gig.eu (accessed on 8 May 2018).
  76. Janásek, D.; Potoček, T.; Svetlík, J. Dangerous Substances, 1st ed.; University of Zilina: Zilina, Slovakia, 2004; pp. 13–24. ISBN 80-8070-243-8. [Google Scholar]
  77. Nassimi, A.M.; Jafari, M.; Farrokhpour, H.; Keshavarz, M.H. Constants of explosive limits. Chem. Eng. Sci. 2017, 73, 384–389. [Google Scholar] [CrossRef]
  78. Struttmann, T.; Scheerer, A.; Prince, T.S.; Goldstein, L.A. Unintentional Carbon Monoxide Poisoning From an Unlikely Source. J. Am. Board Fam. Med. 1998, 11, 481–484. [Google Scholar] [CrossRef]
  79. Struttmann, T.; Scheerer, A.; Prince, T.S.; Goldstein, L.A. Carbon Monoxide Poisoning. J. Emerg. Nurs. 2008, 34, 538–542. [Google Scholar] [CrossRef]
  80. Wiatowski, M.; Stańczyk, K.; Świadrowski, J.; Kapusta, K.; Cibulski, K.; Krause, E.; Grabovwki, J.; Rogut, J.; Howaniec, N.; Smolinski, A. Semi-technical underground coal gasification (UCG) using the shaft method in experimental mine Barbara. Fuel 2012, 99, 170–179. [Google Scholar] [CrossRef]
  81. Mocek, P.; Pieszczek, M.; Świadrowski, J.; Kapusta, K.; Wiatowski, M.; Stańczyk, K. Pilot-scale underground coal gasification (UCG) experiment in an operating Mine “Wieczorek” in Poland. Energy 2016, 111, 313–321. [Google Scholar] [CrossRef]
  82. Kapusta, K.; Wiatowski, M.; Stańczyk, K. An experimental ex-situ study of the suitability of a high moisture ortho-lignite for underground coal gasification (UCG) process. Fuel 2016, 179, 150–155. [Google Scholar] [CrossRef]
  83. Wrona, P.; Różański, Z.; Pach, G.; Suponik, T.; Popczyk, M. Closed coal mine shaft as a source of carbon dioxide emissions. Environ. Earth Sci. 2016, 75, 1–12. [Google Scholar] [CrossRef]
  84. Kostúr, K. Mathematical modeling temperature’s fields in overburden during underground coal gasification. In Proceeding of the IEEE 15th International Carpathian Control Conference (ICCC), Velke Karlovice, Czech Republic, 28–30 May 2014; pp. 248–253. [Google Scholar]
Figure 1. Principle of Underground Coal Gasification (Legend: 1—Injection borehole, 2—Production borehole, 3—Overburden, 4—Water table, 5—Coal seam, 6—UCG cavity, 7—Sag of roof, 8—Streaming of oxidizing gases, 9—Direction of gasifying, 10—Direction of syngas streaming).
Sustainability 10 01512 g001
Figure 2. The scheme of geo-reactor ex situ.
Sustainability 10 01512 g002
Figure 3. The scheme of the geo-reactor in situ [60].
Sustainability 10 01512 g003
Figure 4. Scheme of the moving boundaries of the piston gasification front for τ 1 < τ 2.
Sustainability 10 01512 g004
Figure 5. Scheme of the moving boundaries of piston gasification front for τ 1 < τ 2.
Sustainability 10 01512 g005
Figure 6. Comparison of measured Temperature with that predicted by simulation model.
Sustainability 10 01512 g006
Figure 7. Principle of model for mixing of gases.
Sustainability 10 01512 g007
Figure 8. Input and output from the simulation model for mixing of gases.
Sustainability 10 01512 g008
Figure 9. The gasification front movement for coal seam at depth 20 m in time the (a) 54th h; (b) 120th h; (c) 282nd h; (d) 378th h.
Sustainability 10 01512 g009
Figure 10. The heat flow density from the earth’s surface to the ambient environment.
Sustainability 10 01512 g010
Figure 11. The behavior of the temperatures in range 0–10 m from boundary coal—overburden to the ground surface for the first simulation ( v x = 1 m/day, v y = 0.1757 m/day)
Sustainability 10 01512 g011
Figure 12. The temperature field of the coal seam and overburden for the velocity 0.5 m/day m in time the (a) 54th h; (b) 120th h; (c) 282nd h; (d) 378th h.
Sustainability 10 01512 g012
Figure 13. The temperature field of the coal seam and overburden for the velocity 2 m/day m at time of the (a) 54th h; (b) 120th h; (c) 282nd h; (d) 378th h.
Sustainability 10 01512 g013
Figure 14. The behavior of the temperatures in range 0–10 m from boundary of coal and overburden to the surface for the velocity 0.5 m/day.
Sustainability 10 01512 g014
Figure 15. The behavior of the temperatures in range 0–10 m from boundary coal—overburden to the ground’s surface for the velocity 2 m/day.
Sustainability 10 01512 g015
Figure 16. The temperature field of the coal seam and overburden for the Wieczorek experimental mine at time (a) 720th h; (b) 1440th h; (c) 1596th h; (d) 1908th h.
Sustainability 10 01512 g016
Figure 17. The behavior of the temperatures in the range 0–15 m from the boundary of coal and overburden through to the ground surface for the Wieczorek experimental mine.
Sustainability 10 01512 g017
Figure 18. Syngas flowing from the UCG cavity to surface at the vulnerable zone.
Sustainability 10 01512 g018
Figure 19. Outputs of model for mixing of gasses for explosion (experiment Barbara 1).
Sustainability 10 01512 g019
Figure 20. Outputs of model for mixing of gasses for CO poisoning (exp. Barbara 1, limit CO = 0.1%).
Sustainability 10 01512 g020
Figure 21. The concentration of syngas from the model of mixing gases with fresh air intake for CO poisoning (Barbara 2 experiment, left side fresh air 0.1 m3/h and right side fresh air 1 m3/h).
Sustainability 10 01512 g021
Figure 22. Influence of volume flow of fresh air on the critical time for CO poisoning (exp. Barbara 1).
Sustainability 10 01512 g022
Table 1. Lignite sample analysis (Abbreviations: r—received, d—dry, daf—dry ash-free).
Proximate AnalysisElementary Analysis
Total moisture Wr38.2%Cdaf76.5%
Volatiles Vdaf50.1%Hdaf3.95%
Ash Ad9.4%Ndaf1.48%
Heat value16.1 MJ/kgTotal Sulphur S1.62%
Table 2. Coal sample analysis for the geo-reactor in situ.
Moisture wt. (%)6.39
Ash At (%)16.52
Volatile matter Vt (%)29.84
S total St (%)0.51
Elementary analysis
C (%)57.95
H (%)3.70
N (%)0.87
O (%)14.03
Table 3. Thermal—physical properties of individual layers.
LayerHeat Conductivity (W·m−1·K−1)Specific Heat Capacity (J·kg−1·K−1)Density (kg·m−3)
Coal0.410001500
Shale0.98002400
Sandstone18002400
Clay1.259201600
Sand0.268301900
Sandstone fine-grained4.3037572183
Sandstone coarse-grained1.739171868
Sand and Shale0.588152150
Clay and Shale1.0758602000
Grey sandstone3.0188061994
Table 4. Velocities of the movement of the gasification front.
SimulationVelocity in x Direction Velocity in y Direction Experiment Duration
(m/h)(m/Day)(m/h)(m/Day)(h)(Day)
10.041710.00730.175728812
20.02080.50.02080.557624
30.083320.083321446
Table 5. Maximum distance of the temperatures 300 and 500 °C.
Temperature (°C)Distance from Boundary Coal—Overburden (m)
The First SimulationThe Second SimulationThe Third Simulation
3000.550.50.4
5000.230.150.1
Table 6. Lower and upper explosive limits.
ComponentLEL (%)UEL (%)
H24.070.0
CH45.560.0
CO13.514.0
Table 7. Limits for CO poisoning.
Effectvol % CO
no symptoms of poisoning after a long time0.01
headache after 2–3 h0.02
a distinct poisoning after 2–3 h0.03
a distinct poisoning after 1–2 h0.04
unconsciousness after 2–3 h0.043
hallucinations after 30–120 min0.05
unconsciousness after 1.5 h, death after 6 h0.087
death after 2 h0.1
death after 1 h0.15
death after 30 min0.3
death a few minutes0.44
immediate death0.79
Table 8. Average concentration of syngas from experiments.
Experiment%H2%CO%CH4%CO2%N2%O2
Cigel14.49.114.718.440.13.3
Barbara 136.331.92.414.921.31.5
Barbara 214.213.41.516.452.41.9
Wieczorek11.014.41.89.363.20.1
Table 9. Results of critical time for explosion on ground surface.
CaseVolume of Room (m3)Critical Time (h)Critical Time (Day)
Cigel8088,7323697
16001,774,62873,943
Barbara 180131054
160026,2061092
Barbara 2803714155
160074,2663094
Wieczorek80123,3835140
16002,467,650102,818
Table 10. Results of critical time for CO poisoning on ground surface.
CaseVolume of Room (m3)Critical Time (%CO = 0.1) (h)Critical Time (%CO = 0.01) (h)
Cigel803013300
160060,2595996
Barbara 180353.6
160070470.4
Barbara 280848.4
16001681167.6
Wieczorek801910189
160038,1003788
Table 11. Results of critical time for explosion and CO poisoning with fresh air intake.
Critical Time (h)
Volume Flow of Fresh Air
(m3/h)
Explosion
(exp. Barbara 1)
CO Poisoning
(exp. Barbara 1)
Explosion
(exp. Barbara 2)
CO Poisoning
(exp. Barbara 2)
0202735.3616284
0.01236435.4-84.6
0.03425135.5-85.5
0.1-36.1-88.9
1-46.5 -
Table 12. Calculated values of emissions CO2, CO, CH4 from experiments Barbara mine.
Emission (×10−7 m3/s)
ExperimentCO2COCH4
Barbara 12.956.320.47
Barbara 23.252.650.29

