Article

Climate Change Communication in an Online Q&A Community: A Case Study of Quora

State Key Laboratory of Hydroscience and Engineering, Tsinghua University, Beijing 100084, China
*
Author to whom correspondence should be addressed.
Sustainability 2018, 10(5), 1509; https://doi.org/10.3390/su10051509
Submission received: 3 April 2018 / Revised: 5 May 2018 / Accepted: 7 May 2018 / Published: 10 May 2018

Abstract

:
An emerging research trend in climate change studies is to use user-generated-data collected from social media to investigate the public opinion and science communication of climate change issues. This study collected data from the social Q&A website Quora to explore the key factors influencing the public preferences in climate change knowledge and opinions. Using web crawler, topic modeling, and count data regression modeling, this study quantitatively analyzed the effects of an answer’s textual and auxiliary features on the number of up-votes received by the answer. Compared with previous studies based on open-ended surveys of citizens, the topic modeling result indicates that Quora users are more likely to talk about the energy, human and societal issues, and scientific research rather than the natural phenomena of climate change. The regression modeling results show that: (i) answers with more emphasis on specific subjects, but not popular knowledge, about climate change can get significantly more up-votes; (ii) answers with more terms of daily dialogue will get significantly fewer up-votes; and (iii) answers written by an author with more followers, with a longer text, with more images, or belonging to a question with more followers, can get significantly more up-votes.

1. Introduction

Currently, an emerging research agenda is to use social media data to analyze the public opinion on climate change issues. Public perception of the existence of climate change and its impacts on the environment and society is an important issue with societal and political implications [1]. Public supports are also crucial for legislation and the implementation of mitigation policies to climate change [2]. However, although there is a consensus in the scientific community that climate change is mainly caused by human activities and is already having significant negative impacts on the environment and society [3], many studies report the lack of agreement within the general public that anthropogenic climate change is occurring [4]. This discrepancy between the scientific community and the general public on climate change is actually a science communication problem, which has stimulated many scholars to investigate the key factors influencing public attitudes or preferences on topics related to climate change [5].
Public opinion analytics is essential for a better understanding of the social environment and the dynamics of social changes. Among various sources of public opinion data, social media data is attracting great attention from researchers, as it provides highly valuable data about the public attitudes and opinions on controversial social events [6] and has been widely used to monitor and analyze public responses to natural or social phenomena [7]. For social science research, the nature of social media data is significantly different from the data collected by traditional questionnaire surveys [8]. Although the sample size of social media data is usually much larger than that of survey data, and the collection process of social media data is also much easier and cheaper [9,10], the utility of social media data is still limited by some constraints. First, social media data are usually collected by keyword search, introducing the possibility that the data may only contain the keywords and are not actually relevant to the research topic. In addition, social media data are usually textual data which are unstructured and difficult to analyze with traditional statistical methods. On the contrary, survey questionnaires are always elaborately designed to investigate an explicit research question, and the measurement systems (e.g., Likert scale) are also mature. Hence, the survey data are well-structured and can be easily processed by traditional statistical methods. As a result, social media data are regarded as “case-rich but variable-poor”, while survey data are regarded as “case-poor but variable-rich” [8]. Consequently, most social science studies based on social media data are descriptive analysis or with simple correlation analysis, rather than predictive or prescriptive analysis [11,12,13,14].
Recent studies on scientific communication, based on theories such as Mode-2 knowledge production or post-normal science, show that knowledge is created not only by qualified actors in official spaces such as universities [15], but also across multiple sites and by multiple actors [16,17]. With its increasing popularity, the Internet is now a major place for large-scale and complex discourses on climate change issues [18]. Blogs and social media have been recognized as an “alternative site of scientific knowledge production” and a “site of knowledge contestation” [19]. The high visibility of massive user-generated-content to the public and free comments from a large number of readers make these online services interactive [18] and ensure the involvement of the public speaking back to science, thus creating new public arenas where scientific information becomes more socially robust through contestation [20]. Due to the large availability to the public, blogs and social media are also used by climate scientists as a means of dissemination [21]. In sum, the online space “has become an increasingly important forum for climate change issues, both from a scientific and political standpoint, and for environmentalist campaigners and climate skeptics alike” [18].
Previous studies have investigated the online climate change communication in the blogosphere [18,19] and social media platforms such as Twitter and Facebook with big data technologies [1,22,23,24,25]. These web services were originally designed for personal emotion expressions and social needs. On these sites, users publish comments on or share information related to climate change issues with strong sentimental experience, and correspondingly other users also respond to these pieces of information emotionally rather than rationally. In addition, although climate change issues are often discussed on blogs or social media platforms, the relevant messages are highly scattered, even within a site, creating obstacles to data collection. Fully unstructured data also make it difficult to quantitatively analyze. As a result, previous studies using the big data from blogs, Twitter, or Facebook have mainly focused on descriptive analysis of online climate change discussions, such as social network analysis of bloggers [19], linguistic analysis of blog articles [18], and spatio-temporal distribution analysis of tweeting behaviors [23]. Predictive or prescriptive analysis, such as key factors influencing public preferences on climate change knowledge and opinions, cannot be comprehensively investigated with previous methods and data.
Fortunately, the recent emerging Question and Answer (Q&A) platform Quora provides a chance for a more in-depth investigation of predictive or prescriptive analysis in the field of public opinion and science communication. Quora is regarded as the so-called “online social Q&A community” in the informational jungle of the Internet [26]. It is designed to afford question-posing and answering, to support votes for expression preferences or supports to an answer, and to support collaboration through a social network [27]. This nature of social networking makes Quora different from regular Q&A systems such as the Enterprise Q&A system. The booming popularity and the high-quality content highlight the importance of the site in the field of online knowledge sharing. The vote mechanism provides the potential of measuring public preferences on certain opinions. Another important feature of Quora is that it requires users to provide their full name, including family name and given name, in registration. Although this requirement is not mandatory, it has constructed a real-name environment in Quora, reinforcing the representativeness of Quora’s data to reflect the public opinion. In addition, the ample auxiliary information, including author information, question information, and answer information, also augments the utility of Quora data for research in public opinion and science communication on climate change.
The aim of this study is to investigate the key factors influencing public preferences on climate change knowledge and opinions, with the user-generated-content data collected from Quora, particularly from the questions under the Climate Change topic in Quora. In this study, the measurement of public preference, which is always a thorny issue in traditional public opinion research [8], was naturally and quantitatively implemented by counting the up-vote number of an answer. Textual features extracted by topic modelling together with other features of each answer were integrated into a regression model to explain the influence of these features on the up-vote number of an answer. The results of the model reveal the mechanism of the science communication of climate change knowledge in social media sites, and the analytic framework in this study is expected to be widely applied as a methodological strategy in future social science studies, especially those involving online public opinion and science communication.

2. Materials and Methods

2.1. Data Collection

Quora is one of the most popular Q&A websites in the world. In March 2016, Quora revealed that it was seeing over 100 million monthly unique visitors to its Q&A social network, an increase of 22% from January 2016, when it reported having 80 million [28]. According to Alexa, in April 2016, Quora was ranked as the world’s 128th most popular website, with most of the visitors from India (39.9%), the U.S. (23.1%), the U.K. (2.9%), Canada (1.8%), and China (1.8%) [29]. Quora does not collect or present user demographic information. However, based on the statistical data from Alexa, compared to the general internet population, Quora has more male users, more highly-educated users, and more young users [29].
Climate change is always a hot topic in Quora, with many questions and answers, providing the possibility of using quantitative approaches to analyze the public opinion and science communication of climate change. Data for this study were collected by a Python web crawler. The crawler accessed the website on 28 March 2016 and collected all accessible questions, answers, and auxiliary information under the Climate Change topic in Quora. The total number of questions under the topic was about 6800 at that time, and the latest 3400 ones, which were accessible to the public, were collected. A question can receive several answers, which are presented under the page of the question. Figure 1 presents a snapshot of a question’s page in Quora. The page shows two types of information: question information and answer information. Question information includes the topic of the question, the text of the question, the number of followers of the question, view times of the question, creation date of the question, and the number of answers to the question. Answer information includes a brief introduction of the answer’s author, the view times of the answer, the creation date of the answer, the up-vote number of the answer, and the text of the answer. The data of authors’ activities and social statuses in the social network were also collected by accessing the profile page of the author, as shown in Figure 2. In total, 10,432 answers were collected, written by 3434 authors, to 2929 of the 3400 questions by that day. After removing common stopwords and four custom stopwords, including “climate”, “change”, “global”, and “warming” in answer texts, 10,393 answers remained and were used in topic modeling and regression modeling.

2.2. Regression Model for Count Data

The answer’s up-vote number was used to measure the public preference for the standpoints in the answer and was the dependent variable in the regression model. As Quora is an online social Q&A website with a real-name registration system, it is logical to think that most Quora users prudently vote for an answer and the up-vote number can effectively reflect the public preference for the answer. Because the up-vote number is a count variable (Meanup-vote number = 5.63, Minup-vote number = 0, Maxup-vote number = 2600, Std. Devup-vote number = 39.12), a Poisson regression model and a Negative binomial regression model were used to analyze the data.
In this case, Yi is defined as the up-vote number that answer i (i = 1, 2,…, N) has received. The Poisson regression model assumes that the variable Yi is distributed as shown in Equation (1):
P ( Y i = y i ) = e λ i λ i y i / y i ! ,
where λi is the mean and variance of Yi and is specified by a k-dimension vector, Xi = (xi1, xi2,…, xik), which includes all the k explanatory variables. The most commonly used formulation is to model the natural logarithm of λi as a linear function of the explanatory variables, as shown in Equation (2):
ln ( λ i ) = β 0 + β 1 x i 1 + β 2 x i 2 + + β n x i k .
The Poisson regression model has the constraint that the variance is equal to the sample mean. However, the sample of the dependent variable of this study is strongly skewed, which can cause over-dispersion in modeling. This feature makes the Poisson regression model unsuitable for modeling an answer up-vote number. In order to deal with the over-dispersion problem, this study employed the negative binomial regression model to model the data, which introduces a parameter to correct over-dispersion when the variance is much larger than the mean. The formulation of the negative binomial distribution is shown in Equation (3):
P ( Y i = y i ) = Γ ( y i + ϕ ) y i ! Γ ( ϕ ) ϕ ϕ λ i y i ( ϕ + λ i ) ϕ + y i ,
where Γ is the gamma function and the negative binomial distribution of Yi has a mean λi and a variance as shown in Equation (4):
var ( Y i ) = λ i + 1 ϕ λ i 2 ,
where ϕ is called the over-dispersion parameter. When ϕ + , the negative binomial distribution is the same as the Poisson distribution. Similar to the Poisson regression model, Equation (2) is used to link explanatory variables to the negative binomial distribution of the dependent variable. A maximum likelihood approach was used for the estimation of both models.

2.3. The Explanatory Variables

The aim of the regression analysis was to investigate the key factors influencing the up-vote number of an answer under the Climate Change topic in Quora. These key factors can be classified into two categories—namely, textual features and auxiliary features.

2.3.1. Textual Features

Science communication of climate change is “a complex and contentious topic that encompasses a spectrum of issues from the factual dissemination of scientific research to new models of public engagement whereby lay persons are encouraged to participate in science debates and policy” [32]. The collected answers frame the climate change issue from different perspectives, which can have implications for multiple values or considerations and thus can attract public support in different ways. Previous studies have also shown that individuals always selectively view and interpret information in ways which reinforce their already held beliefs [33,34]. Hence, different frames in an answer can influence the public preference on the answer, which is reflected by the answer’s up-vote number.
From a formative perspective, frames are constructed based on a coherently semantic structure of particular shared meaning [35]. Hence, it is possible to identify major frames by analyzing discriminating terms and their clustering in the text. Previous studies have demonstrated that computer-assisted text analysis methods can efficiently detect frames in a large corpus [36,37]. In this study, structural topic modeling (STM) [38] was used to extract major frames (topics) in the whole corpus and of each answer text. In STM, a corpus can be summarized as several topics. A topic is a distribution on a vocabulary, and a text is a distribution on topics. For example, an answer text related to the natural phenomena of climate change has two topics, including “Climate Change” and “Natural Phenomena”. The “Climate Change” topic has words related to climate change, such as “climate”, “change”, “global”, “warming”, and “earth”, with high probabilities. Meanwhile, the “Natural Phenomena” topic has words related to extreme natural phenomena, such as “flood”, “drought”, “glacier”, “sea-level”, and “rise”, with high probabilities.
Structural topic modeling is a highly automated approach. The only parameter needing to be determined in the model is the number of topics. Hence, multiple models with different numbers of topics were built to select a preferable one. As there is no acknowledged indicator for choosing the best model with the highest semantics, the choice relied more on qualitative analysis, which was based on authors’ inspection of the most frequent terms and close reading of the most representative texts of each topic to attain our preferred model. Finally, a ten-topic model was selected. Each topic in the ten-topic model was manually given a specific label to describe its practical significance. Appendix A presents sample results of alternative model specifications containing four, eight, and twelve topics.
Based on the results of structural topic modeling, a 10-dimensional vector representing the topic distribution for each answer text was obtained. However, this 10-dimensional vector cannot be directly used in regression modeling because of multicollinearity (for any answer text, the sum of the components in the 10-dimensional vector is always one). Hence, topic proportions were transformed into dummy variables. That is, a value of one was assigned to a dummy variable if the corresponding topic proportion was no less than 0.2. This threshold was chosen because it is double the average topic proportion of the 10 topics and it ensured that 99% of answers in the corpus could be explained by at least one topic [39]. The coefficient of each dummy variable indicated its effect on the up-vote number of an answer, compared with those answers that did not have such a prominent topic.

2.3.2. Auxiliary Features

In addition to the textual features, some auxiliary features related to answers were also included in the regression model. First was the follower number of the answer’s author. Answers written by Quora users are presented in their followers’ homepages, and are subsequently easily read by their followers. Additionally, in a knowledge sharing social networking website like Quora, followers can to some extent be regarded as fans of the followee, and are more likely to agree with and vote for the opinions of the followee [40]. Hence, more followers can bring more up-votes to the answers written by the followee. Second is the text length in terms of the number of characters. A longer answer may provide more details for the readers to be enlightened and to vote for it [41]. Third is the number of images in an answer. Images can increase the likelihood of understanding a message by providing more vivid and comprehensive information [42]. It is a common strategy for authors to use images in their articles to amuse readers in social networking websites. Hence, it can be expected that answers with more images will get more up-votes. Last but not least is the follower number of the question. More followers of a question mean that the question attracts more attention from Quora users. Thus, the answers under the question can also gain more exposure, and subsequently may get more up-votes. The number of days from the creation of the answer to the date of data collection was used as an offset to account for the time effect. Table 1 provides a summary of these auxiliary features. All these auxiliary features were scaled before modeling.
In order to test for multicollinearity of all the explanatory variables, the variance inflation factor (VIF) was computed using the method of Davis et al. [43], which is based on the correlation matrix from the information matrix of the variables. In the Poisson regression model, the VIF values of explanatory variables were less than 1.81, and in the negative binomial regression model, the VIF values of explanatory variables were less than 1.39. These values show that little multicollinearity existed among all explanatory variables.

3. Results

3.1. Major Topics in Answers

As indicated above, through manual inspection of the details of the established models, a structural topic model with 10 topics was found to be preferable in terms of both semantic coherence and exclusivity, compared to those with more or fewer topics. The selected 10-topic model is shown in Table 2, with the 15 most frequent terms, the proportion in the whole corpus, and the manually proposed label of each topic. Figure 3 presents the word clouds with the 25 most frequent terms for each topic to make the result easier to read and interpret.
Most topics in Table 2 apparently refer to the commonly discussed subjects related to climate change. For example, Topic 1 contains high-frequency terms such as “carbon”, “fuel”, “burn”, “dioxid-”, and “emiss-”, and clearly pertains to the fuel and carbon issue, which is always regarded as the major cause of anthropogenic global warming [44]. Thus, Topic 1 is labeled as “Fuel/Carbon”. Topic 4 contains similar terms as Topic 1, but is labeled as “energy”, as the high-frequency terms in Topic 4 (i.e., “energi-”, “power”, “cost”, “develop”, and “renew-”) reflect that this topic focuses on a more macro level than Topic 1 does. These two topics are relevant to energy and fuel, and account for 18.8% of the whole corpus.
Three topics, including Topic 3 (Human/Biodiversity), Topic 5 (Atmosphere/Weather), and Topic 7 (Hydrosphere), show more relevance to the influences of climate change on different aspects, including water, air, and species. They have a total proportion of 29.1%. Meanwhile, Topic 6 and Topic 9, together accounting for 21.2% of the corpus, focus on more societal issues relevant to climate change, including science communication and politics. Topic 10 discusses details of climate modeling, with many methodological terms, such as “model”, “data”, “predict”, and “trend”.
The remaining two topics, including Topic 2 (Livelihood) and Topic 8 (Future), contain high-frequency words that are commonly used in daily dialogues, rather than in specific subjects related to climate change. The two topics account for 22.7% of the whole corpus.

3.2. Regression Results

Table 3 presents the results of two count data regression models: the Poisson regression model and the negative binomial regression model. The following measures of fit were employed to quantify the model fit: Log likelihood, Akaike Information Criterion (AIC), and Bayesian Information Criterion (BIC). The results in Table 3 show that the negative binomial regression model fit the data better than the Poisson regression model, with a higher Log likelihood, a lower AIC value, and a lower BIC value. Hence, the following interpretations are mainly based on the results of the negative binomial regression model. These measures also indicate that the observed count data (i.e., the up-vote number of answers related to climate change in Quora) do have an over-dispersion problem. The estimated value of the over-dispersion parameter ϕ , described in Equation (4), is 0.5584. The better performance of negative binomial regression is consistent with prior studies arguing that negative binomial regression is more useful than the Poisson model in fitting over-dispersed datasets [26,45,46].
The effect of the explanatory variable on the dependent variable is determined by the regression coefficient β shown in Table 3. In both the Poisson regression model and the negative binomial regression model, a positive (negative) estimated value of the β coefficient for an explanatory variable indicates that an increase (decrease) in the variable leads to a higher expected count of up-votes, ceteris paribus. As the two count data models fit the natural logarithm of the up-vote number, the coefficients can be interpreted as follows: for a one-unit change in an independent variable, if other variables remain fixed, the natural logarithm of the dependent variable is expected to change by the value of the estimated coefficient. As is shown in the negative binomial regression results in Table 3, four auxiliary features, including scaled Author followers, scaled Text length, scaled Image number, and scaled Question followers, were positively correlated to the number of up-votes that an answer received, all with a significance level of p < 0.001. For example, the estimated coefficient for the scaled Text length was 0.195, which means that if other variables remain fixed, answers that have a one-unit longer text length on average obtain 1.215 (exp (0.195) = 1.215) times as many up-votes as the shorter ones.
With regard to the textual features, based on the results of the negative binomial regression model, there were eight topics significantly influencing the public preferences of an answer. Six topics, including Topic 1 (Carbon/Fuel), Topic 3 (Human/Biodiversity), Topic 4 (Energy), Topic 6 (Science Communication), Topic 9 (Politics), and Topic 10 (Climate Modeling), showed significantly positive effects on the extent to which an answer can get more up-votes. Two topics, including Topic 2 (Livelihood) and Topic 8 (Future/Impact), showed significantly negative effects in this regard. Meanwhile, Topic 5 (Atmosphere/Weather) and Topic 7 (Hydrosphere) had no significant effect on the number of up-votes obtained by an answer.

4. Discussion

In the near future, public participation in environmental issues will take place primarily via the Internet, and social media sites—which provide opportunities for implementing the interactions between policy makers and common people or knowledge producers and knowledge receivers—will be the major platform for online public participation [47,48]. With regard to climate change issues, a huge volume of public opinion data is posted on social media sites at present. These data have been widely used to describe the profile of online public opinions about climate change [1,18,19,23,25]. However, more in-depth studies with predictive or prescriptive analysis are rare. This study responds to the lack of such empirical cases by highlighting the utility of the combination of the structured and unstructured data collected from Quora. The analytic framework in this study solves several conceptual and computational problems in leveraging the data, including using the number of up-votes to measure public preferences on certain standpoints, employing the Poisson regression model and the negative binomial regression model to fit the count data and to transform unstructured text data into topical features which can be used in a regression model. The proposed framework is expected to be widely applied in future social science studies which intend to leverage the big data from social media sites.
In addition to the methodology’s significance, the results of topic modeling and regression modeling on the Quora data also have implications for better understanding the science communication and the public opinion on climate change:
The topic modeling results summarize the online public opinion on climate change in Quora, which is one of the most popular Q&A websites in the English world. The induced 10 topics distribute quite evenly in the whole corpus, with the most prevalent topic being Topic 2 (Livelihood), accounting for 12.4% in whole corpus, and the least prevalent topic being Topic 4 (Fuel/Carbon), accounting for 7.8%. Most of these topics also appear in previous studies based on open-ended surveys of citizens in the U.S. and the U.K. aiming to find effective images associated with global warming or climate change [49], however, with different proportions. For instance, natural phenomena related to climate change, such as ice melt, flooding, and abnormal weather, are prominent topics or effective images of citizens in the U.S. and the U.K. However, similar topics in Quora answers, including Topic 5 (Atmosphere/Weather) and Topic 7 (Hydrosphere), account for just 20.9% of the corpus. The proportion of topics focusing on energy and fuel and carbon emission issues (Topic 1 and Topic 4) is 18.8% in Quora answers, clearly larger than the proportions of the Greenhouse category in the U.S. and the U.K. (both less than 5%) [49]. In addition, human and societal topics, including Topic 2 (Livelihood), Topic 3 (Human/Biodiversity), Topic 8 (Future/Impact), and Topic 9 (Politics), account for about 40% in the corpus, against much lesser proportions of similar image categories in the U.S. and the U.K. The proportion of Science Communication (Topic 6) in Quora answers is 11.4%, much smaller than the U.S.’s naysayer category (23% in 2010) [50]. Meanwhile, scientific research on climate change—particularly with technical details of climate modeling—has a topic proportion of 8.0% in Quora answers, but seldom appears in citizens’ images related to climate change. To sum up, in such a knowledge sharing and social networking platform as Quora, users are more likely to talk about the energy, human and societal issues, and scientific research rather than natural phenomena on climate change, compared with the citizens’ responses to open-ended surveys in previous research.
The regression modeling results quantitatively reveal the effects of different features on the public preferences for an answer. In terms of textual features, only four topics, including Topic 2 (Livelihood), Topic 5 (Atmosphere/Weather), Topic 7 (Hydrosphere), and Topic 8 (Future), had negative effects on the number of up-votes, and only Topic 2’s and Topic 8’s effects were significant. A possible reason to explain this is that Topic 2 and Topic 8 do not focus on specific subjects relevant to climate change, which can be inferred from their high-frequency terms shown in Table 2. Answers with a high proportion of those everyday terms cannot provide substantial knowledge to the readers. Hence, these answers can hardly get many up-votes and may even bore the readers. With regard to Topic 5 and Topic 7, although these two topics describe specific subjects related to climate change, the changes in atmosphere, weather, and hydrosphere are, to some extent, popular knowledge about climate change [2,49,50], which cannot stimulate the Quora users to vote for the corresponding answers. Nevertheless, the estimated coefficients of Topic 5 and Topic 7 were very small in absolute value and their effects were also insignificant, showing that the prevalence of these two topics cannot significantly influence the voting behavior of Quora users.
Topics with significantly positive effects on the number of up-votes all discuss specific subjects related to climate change. The largest effect came from Topic 6 (Science Communication), with a β value of 0.451. It is not strange that the topic of science communication could attract more support from users in Quora, as Quora does operate as a platform for online science communication. As reported by Alexa, users in Quora are more educated than the general internet population and may have stronger beliefs of the scientific consensus on climate change issues. Hence, the discussion of science communication—especially the criticism of the deniers and the skeptics of climate change—may substantially resonate with those Quora users [33,34] and can get more up-votes. The second largest effect was from Topic 9 (Politics), with a β value of 0.348. Climate change issues are always a significant political agenda at different levels [51]. From an international perspective, although agreement was reached on the Kyoto Protocol to the United Nations Framework Convention on Climate Change with over 183 countries’ commitment by 2009, these countries may be unwilling to act unilaterally, because “in doing so they would pay the full price of abatement but gain only a fraction of the benefit” [52]. From a domestic perspective, decisions on policies to mitigate climate change are highly concerned with electoral interests, national discourses, and domestic political institutions [52]. The subtle linkage between climate change and politics may also be intriguing knowledge to Quora users. Other topics, including Topic 1 (Fuel/Carbon), Topic 3 (Human/Biodiversity), Topic 4 (Energy), and Topic 10 (Climate Modeling), are also specific subjects but not popular knowledge about climate change.
The effects of auxiliary features were all significantly positive. This is in line with our expectations indicated in Section 2.3.2. The remarkable feature was Author followers, which had the largest effect on the number of up-votes, highlighting the importance of social capital on science communication in such a social Q&A website as Quora [26,53]. For a knowledge contributor (answer author) in Quora, the interaction between their social capital (represented by the number of followers) and their peer recognition (represented by the total number of up-votes they received) is complex. Based on the attention economy theory proposed by Simon [54], users’ attention is a scarce resource in a social network. In order to get widespread attention from readers, knowledge contributors need both more followers and more up-votes, which are mutually reinforcing. In fact, as demonstrated in previous studies, contributors’ expectation of getting more attention, including followers and positive feedbacks (up-votes), motivates the development of knowledge or information sharing websites such as YouTube [55] and Twitter [56]. Hence, in order to promote science communication in social media, an in-depth understanding of this complex interaction is necessary and needs further research.
People will selectively read and understand information in ways that reinforce their already-constructed beliefs [3,34]. Previous studies with data collected from Twitter and Facebook show that the echo chamber effect is prominent in social media discussions, especially topics related to climate change [57,58,59]. Facebook and Twitter can be regarded as pure social media sites and were originally designed for social purposes. Although there are a large number of posts about climate change on Facebook and Twitter, these posts are short, scattered, and full of personal emotions, and the echo chamber effect is significant in these posts [59]. However, Quora has unique features, including a topic–question–answer structure, real name environment, and social status stimulation (a good answer will attract more readers to follow the author; thus, the author will have a higher discourse power in the community). These features make Quora a more proper platform to rationally discuss climate change issues rather than to emotionally express personal attitudes. Thus, Quora has the ability to disrupt the echo chambers in the online environment.

5. Conclusions

This study demonstrated the utility of the data collected from the online social Q&A community Quora for the investigation of science communication and public opinion, specifically on the knowledge of climate change. By integrating the technologies of web crawler, topic modeling, and count data regression model, a novel analytic framework was proposed to leverage the semi-structured dataset collected from Quora. The topic modeling result indicates that Quora users are more likely to talk about the energy, human and societal issues, and scientific research rather than natural phenomena of climate change, compared with the previous open-ended surveys of citizens in English speaking countries (the U.S. and the U.K.) [49]. The regression modeling results revealed that: (i) answers with more emphasis on specific subjects, but not popular knowledge, about climate change can get significantly more up-votes; (ii) answers with more terms of daily dialogue will get significantly fewer up-votes; and (iii) answers written by an author with more followers, with a longer text, with more images, or belonging to a question with more followers, can get significantly more up-votes. These results are useful in promoting the science communication of climate change in online social Q&A communities, which implement a decentralized knowledge production mode and will be the major platform for the public discussion of controversial environmental issues in the future.
As a novel investigation with a new dataset and new methodology, this study has some limitations. First, the lack of detailed demographic information of Quora users obscures the representativeness of the sample. We should admit that the sample of this study is biased. Even for users in Quora, those following the questions and voting on the answers about climate change might only be the ones who are seriously concerned with the issues. Thus, the result of this study reflects only a fraction of the public opinion. However, since Quora has been gaining more and more users, the full view of the Climate Change topic in Quora does have significance in the research field of public opinion and science communication of climate change. Second, the question information is almost absent (only reflected by Question followers) in the regression models. This may lead to a potential loss of important information. Third, some subjectivity exists in the processes of determining the topic number in topic modeling and determining the threshold of the transformation of the textual features. Hence, further research will focus on the corresponding aspects, as follows. The completion of demographic information, including gender and age, can be implemented by image recognition of user icons [60]. The involvement of question information can be introduced by a hierarchical regression model [61], which needs further classification of the questions. The subjectivity can be reduced by using more automated topic modeling approaches, such as hierarchical Dirichlet process [62]. We believe that the proposed methodology, including the valuable Q&A data and the quantitative analytic process, is expected to be widely used in future research on science communication and public opinion about climate change, as well as more general social issues.

Supplementary Materials

reproduction data and R code for this study can be found at https://doi.org/10.7910/DVN/UQZUPO.

Author Contributions

H.J. and M.Q. conceived and designed the research framework; H.J. performed the data collection and analysis; Q.W., B.X. and N.A. contributed to econometric tools; H.J. and D.Z. wrote the paper. All authors read and approved the manuscript.

Acknowledgments

This work was supported by the National Natural Science Foundation of China (General Program Nos. 51479100 and 51779124). The authors also thank the China Scholarship Council.

Conflicts of Interest

The authors declare no conflict of interest.

Appendix A

The following tables present examples of STM model runs with topic numbers set at four, eight, and twelve, as well as suggested topic labels.
Table A1. Model of four topics.
TopicMost Frequent TermsLabelProportion
1will, energi-, peopl-, countri-, power, fuel, carbon, emiss-, coal, cost, develop, fossil, problem, reduc-, oilenergy, fuel, carbon, energy policy0.265
2earth, atmospher-, heat, carbon, human, greenhous-, water, increas-, temperatur-, air, plant, natur-, ocean, planet, energi-earth, atmosphere, weather0.196
3will, year, ice, temperatur-, level, rise, sea, weather, increas-, water, area, time, age, ocean, chang-ice, sea level0.223
4scienc-, peopl- scientist, question, human, scientif-, model, data, will, evid-, answer-, thing, fact, theori-, polit-science, science communication0.317
Table A2. Model of eight topics.
TopicMost Frequent TermsLabelProportion
1carbon, energi-, fuel, fossil, coal, plant, power, gas, emiss-, solar, burn, electr-, generat-, sourc-, nuclearenergy, fuel, carbon0.112
2will, human, peopl-, live, life, chang-, planet, popul-, natur-, food, speci-, happen, earth, bad, impactimpacts on human life and the earth0.135
3countri-, will, develop-, cost, emiss-, econom-, govern, energi-, china, carbon, money, tax, nation, price, reduc-economy, policy0.108
4temperatur-, earth, atmospher-, year, increas-, heat, greenhouse-, ice, ocean, sun, age, time, cool, period, gaseearth, atmosphere, weather0.127
5peopl-, polit-, scienc-, issu-, denier, govern, republican, deni-, public, denial, industri-, politician, fact, real, fundpolitics, science communication0.126
6sea, water, rise, level, ice, area, weather, year, will, increas-, ocean, floodhydrosphere0.128
7thing, question, answer, good, time, point, problem, well, term, year, work, long, start, lot, peoplequestion, future0.138
8scientist, scienc-, model, data, scientif-, predict, evid-, theori-, ipcc, studi-, report, claim, observ-, agw, consensusclimate science0.126
Table A3. Model of twelve topics.
TopicMost Frequent TermsLabelProportion
1carbon, plant, dioxid-, tree, emiss-, forest, burn, air, pollut-, produc-, fuel, methan-, water, product, growcarbon cycling0.065
2peopl-, thing, problem, issu-, care, person, live, lot, good, work, feel, control, educ-, time, idealivelihood0.095
3atmospher-, earth, heat, greenhouse-, temperatur-, gase, sun, energi-, water, increas-, radiat-, surfac-, cool, gas, amountearth, atmosphere, weather0.077
4will, human, chang-, happen, natur, planet, life, earth, time, popul-, year, speci-, long, live, problemhuman, nature, species0.118
5energi-, power, fuel, coal, fossil, electr-, oil, renew-, generat-, solar, nuclear, will, car, cost, gasenergy0.083
6level, increas-, rise, sea, ocean, temperatur-, degre-, year, will, average-, rate, water, countri-, land, highermarine climate0.058
7scienc-, scientist, scientif-, polit-, denier, public, skeptic, republican, deni-, consensus, denial, claim, industri-, accept, opinionscience communication0.090
8ice, year, age, melt, period, temperatur-, warm, time, cold, warmer, arctic, ago, glacier, earth, polarice, temperature0.066
9water, area, flood, citi-, weather, drought, region, will, place, rain, storm, exterm-, winter, north, dayweather, water disaster0.072
10question, answer, point, reason, understand, fact, well, thing, read, man, interest, real, evid-, good, matterquestion0.102
11countri-, develop, govern, carbon, emiss-, econom-, money, nation, tax, cost, will, industry, market, china, compani-economy, policy0.091
12model, data, predict, temperatur-, report, theori-, scienc-, ipcc, year, scientist, measur-, observ, scientif-, studi-, weatherclimate modeling0.082

Appendix B

As Quora has rarely been investigated in academic research, we provide more details about this website as follows.
Quora is a Q&A site where questions are asked, answered, edited, and organized by its community of users. In addition to the Q&A function, Quora allows users to follow other users and to get an information feed from them, making Quora also operate as a social media platform. Its publisher, Quora Inc., is based in Mountain View, California. The company was co-founded by two former Facebook employees, Adam D’Angelo and Charlie Cheever, in 2009 and the website was launched on 21 June 2010.
In March 2010, Quora raised 11 million dollars in a series A funding, with Benchmark Capital as an investor. The series B funding of 50 million dollars was raised in May 2012, with Peter Thiel and Adam D’Angelo as investors. The series C funding of 80 million dollars at a 900-million-dollar valuation was raised in April 2014, with Tiger Global Management and Y Combinator as investors. The latest series D funding of 85 million dollars at a 1.8-billion-dollar valuation was raised in April 2017 with Collaborative Fund and Y Combinator as investors.
As a social Q&A website, Quora requires users to use their real names rather than an Internet pseudonym (nick name) in registration. Although strict verification is not required, nick names can be reported by other users in the community. In addition, users are encouraged to present personal photos and affiliations on their profiles in Quora. These measures intend to add credibility to answers. Some well-known people, such as Barack Obama, Hillary Clinton, and Jimmy Wales, also have accounts in Quora.

Appendix C

Example Questions and Answers about climate change in Quora.
Question 1: Would it be possible to produce a machine that could reduce CO2 into pure oxygen and carbon?
Answer: Absolutely! But it would take a great deal of energy, more than the energy you got by burning the fuel to begin with. So, it’s not a practical solution. But there is a lot of research along similar lines, trying to turn CO2 into other useful products.
This answer was written in 24 December 2015 and got 2 up-votes by 4 May 2018.
Question 2: How long does carbon dioxide (CO2) stay in the atmosphere?
Answer: This is a tricky question because of how the carbon cycle works.
  • Any individual molecule of CO2 may cycle in or out of the atmosphere relatively frequently. Vegetation and phytoplankton take in huge amounts of CO2 every year, and release much of that CO2 back to the atmosphere the same year. That CO2 hasn’t actually been “removed” from the atmosphere, it has only gone for a short trip and then returns.
  • The key issue from a climate change perspective is how long does it take for the large amount of added CO2 to leave the atmosphere for good. That actually takes place gradually over hundreds of years (before it’s mostly gone). That’s because the carbon has to find its way into permanent repositories of carbon that aren’t part of the annual carbon cycle. This could be into the deep ocean, or it could be mineralized…there are a number of ways CO2 leaves the “daily and yearly” cycle. But it does take a long time. That’s why people are concerned that climate change is effectively permanent, at least on the scale of a couple hundred years once we’ve made the leap.
This answer was written in 7 December 2015 and got 19 up-votes by 4 May 2018.
Question 3: What are the main results of COP 21?
Answer: Some interesting things happened on the way to the COP21 agreement:
  • All references to international aviation and maritime emissions disappeared from the final draft, apparently cutting these sectors loose. It’s quite a switch from years of efforts to pull these rapidly growing emissions into the global framework of an agreement. And they were in there in most of the drafts circulated up to the very end.
  • All references to black carbon and short-lived forcers have apparently disappeared. I suspect people will argue they’re included implicitly, but there has been such a big focus recently on trying to get countries to think about “quick action” measures on things like black carbon (which have a short-term greenhouse gas potential thousands of times greater than CO2) and methane that it’s surprising there is no reference.
This answer was written in 21 December 2015 and got 4 up-votes by 4 May 2018.
More examples can be found in the supplementary materials.

References

  1. Kirilenko, A.P.; Molodtsova, T.; Stepchenkova, S.O. People as sensors: Mass media and local temperature influence climate change discussion on Twitter. Glob. Environ. Chang. Hum. Policy Dimens. 2015, 30, 92–100. [Google Scholar] [CrossRef]
  2. Tvinnereim, E.; Flottum, K. Explaining topic prevalence in answers to open-ended survey questions about climate change. Nat. Clim. Chang. 2015, 5, 744. [Google Scholar] [CrossRef]
  3. Hart, P.S.; Nisbet, E.C.; Myers, T.A. Public attention to science and political news and support for climate change mitigation. Nat. Clim. Chang. 2015, 5, 541–545. [Google Scholar] [CrossRef]
  4. Oreskes, N. Beyond the ivory tower—The scientific consensus on climate change. Science 2004, 306, 1686. [Google Scholar] [CrossRef] [PubMed]
  5. Zhao, X.Q.; Leiserowitz, A.A.; Maibach, E.W.; Roser-Renouf, C. Attention to Science/Environment News Positively Predicts and Attention to Political News Negatively Predicts Global Warming Risk Perceptions and Policy Support. J. Commun. 2011, 61, 713–731. [Google Scholar] [CrossRef]
  6. Jiang, H.C.; Qiang, M.S.; Lin, P. Assessment of online public opinions on large infrastructure projects: A case study of the Three Gorges Project in China. Environ. Impact Assess. Rev. 2016, 61, 38–51. [Google Scholar] [CrossRef]
  7. Williams, S.A.; Terras, M.M.; Warwick, C. What do people study when they study Twitter? Classifying Twitter related academic papers. J. Doc. 2013, 69, 384–410. [Google Scholar] [CrossRef] [Green Version]
  8. Schober, M.F.; Pasek, J.; Guggenheim, L.; Lampe, C.; Conrad, F.G. Research Synthesis Social Media Analyses for Social Measurement. Public Opin. Q. 2016, 80, 180–211. [Google Scholar] [CrossRef] [PubMed]
  9. Groves, R.M. Three Eras of Survey Research. Public Opin. Q. 2011, 75, 861–871. [Google Scholar] [CrossRef]
  10. Presser, S.; McCulloch, S. The growth of survey research in the United States: Government-sponsored surveys, 1984–2004. Soc. Sci. Res. 2011, 40, 1019–1024. [Google Scholar] [CrossRef]
  11. Ashley, C.; Tuten, T. Creative Strategies in Social Media Marketing: An Exploratory Study of Branded Social Content and Consumer Engagement. Psychol. Mark. 2015, 32, 15–27. [Google Scholar] [CrossRef]
  12. Gainsbury, S.M.; Delfabbro, P.; King, D.L.; Hing, N. An Exploratory Study of Gambling Operators’ Use of Social Media and the Latent Messages Conveyed. J. Gambl. Stud. 2016, 32, 125–141. [Google Scholar] [CrossRef] [PubMed]
  13. Mavragani, A.; Tsagarakis, K.P. YES or NO: Predicting the 2015 GReferendum results using Google Trends. Technol. Forecast. Soc. Chang. 2016, 109, 1–5. [Google Scholar] [CrossRef]
  14. Van de Belt, T.H.; Engelen, L.J.; Verhoef, L.M.; van der Weide, M.J.A.; Schoonhoven, L.; Kool, R.B. Using Patient Experiences on Dutch Social Media to Supervise Health Care Services: Exploratory Study. J. Med. Int. Res. 2015, 17. [Google Scholar] [CrossRef] [PubMed] [Green Version]
  15. Martin, B.; Richards, E. Scientific knowledge, controversy, and public decision-making. In Handbook of Science and Technology Studies; Jasanoff, S., Markle, G.E., Petersen, J.C., Pinch, T., Eds.; Sage: Thousand Oaks, CA, USA, 1995; pp. 506–526. [Google Scholar]
  16. Funtowicz, S.O.; Ravetz, J.R. Science for the post-normal age. Futures 1993, 25, 739–755. [Google Scholar] [CrossRef]
  17. Nowotny, H.; Scott, P.; Gibbons, M. ‘Mode 2′ revisited: The new production of knowledge—Introduction. Minerva 2003, 41, 179–194. [Google Scholar] [CrossRef]
  18. Flottum, K.; Gjesdal, A.M.; Gjerstad, O.; Koteyko, N.; Salway, A. Representations of the future in English language blogs on climate change. Glob. Environ. Chang. Hum. Policy Dimens. 2014, 29, 213–222. [Google Scholar] [CrossRef]
  19. Sharman, A. Mapping the climate skeptical blogosphere. Glob. Environ. Chang. Hum. Policy Dimens. 2014, 26, 159–170. [Google Scholar] [CrossRef] [Green Version]
  20. Crompton, H. Mode 2 knowledge production: Evidence from orphan drug networks. Sci. Public Policy 2007, 34, 199–211. [Google Scholar] [CrossRef]
  21. Trench, B. Scientists’ Blogs: Glimpses Behind the Scenes. In The Sciences’ Media Connection—Public Communication and Its Repercussions; Rödder, S., Franzen, M., Weingart, P., Eds.; Springe: Berlin, Germany, 2012; Volume 28, pp. 273–289. [Google Scholar]
  22. Itkonen, J.V.A. Social ties and concern for global warming. Clim. Chang. 2015, 132, 173–192. [Google Scholar] [CrossRef]
  23. Kirilenko, A.P.; Stepchenkova, S.O. Public microblogging on climate change: One year of Twitter worldwide. Glob. Environ. Chang. Hum. Policy Dimens. 2014, 26, 171–182. [Google Scholar] [CrossRef]
  24. Papworth, S.K.; Nghiem, T.P.L.; Chimalakonda, D.; Posa, M.R.C.; Wijedasa, L.S.; Bickford, D.; Carrasco, L.R. Quantifying the role of online news in linking conservation research to Facebook and Twitter. Conserv. Biol. 2015, 29, 825–833. [Google Scholar] [CrossRef] [PubMed]
  25. Bennett, W.L.; Segerberg, A. Digital media and the personalization of collective action social technology and the organization of protests against the global economic crisis. Inf. Commun. Soc. 2011, 14, 770–799. [Google Scholar] [CrossRef]
  26. Jin, J.H.; Li, Y.J.; Zhong, X.J.; Zhai, L. Why users contribute knowledge to online communities: An empirical study of an online social Q&A community. Inf. Manag. 2015, 52, 840–849. [Google Scholar] [CrossRef]
  27. Rughinis, R.; Matei, S.; Marinescu-Nenciu, A.P.; Rughinis, C. Computer-Supported Collaborative Questioning. Regimes of Online Sociality on Quora. In Regimes of Online Sociality on Quora. In Proceedings of the 9th Iberian Conference on Information Systems and Technologies (Cisti 2014), Barcelona, Spain, 18–21 June 2014. [Google Scholar] [CrossRef]
  28. Yeung, K. Quora Now Has 100 Million Monthly Visitors up from 80 Million in January. Available online: http://venturebeat.com/2016/03/17/quora-now-has-100-million-monthly-visitors-up-from-80-million-in-january/ (accessed on 28 March 2016).
  29. Alexa Webpage: Web Traffic Statistics of Quora. Available online: http://www.alexa.com/siteinfo/www.quora.com (accessed on 15 April 2016).
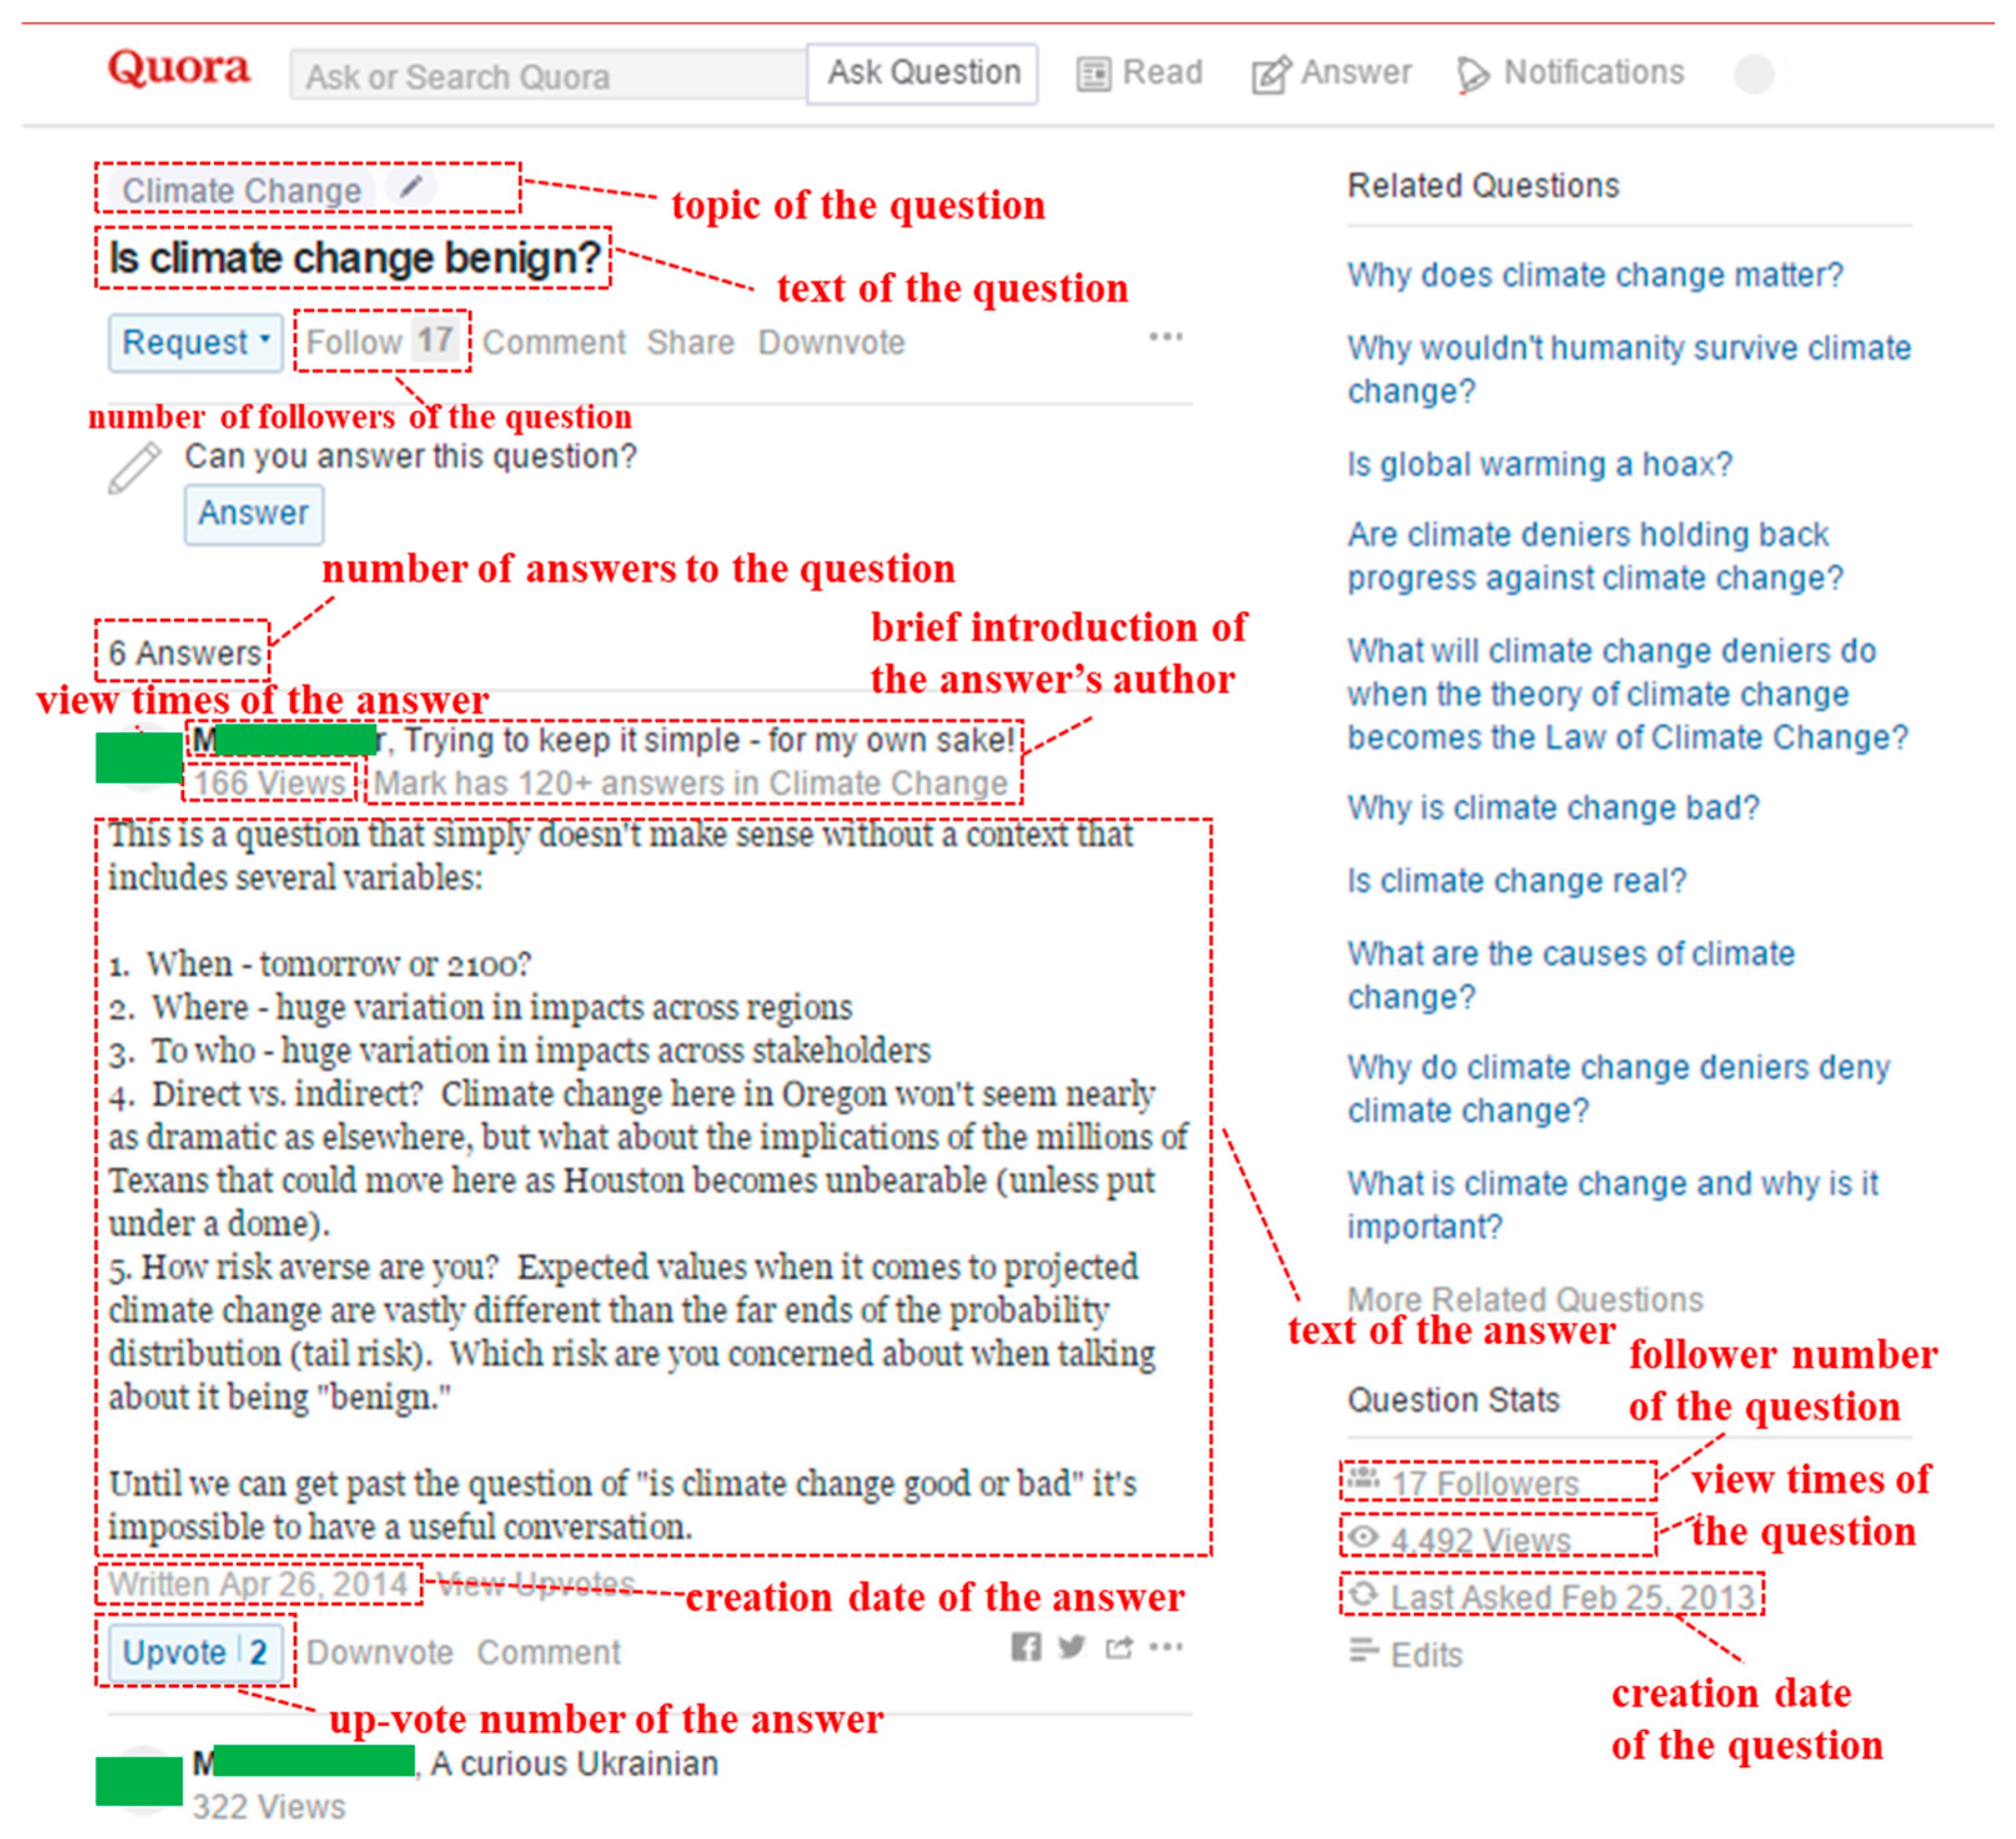
  30. Quora Webpage: Question Page of “Is Climate Change Benign”. Available online: https://www.quora.com/Is-climate-change-benign (accessed on 28 March 2016).
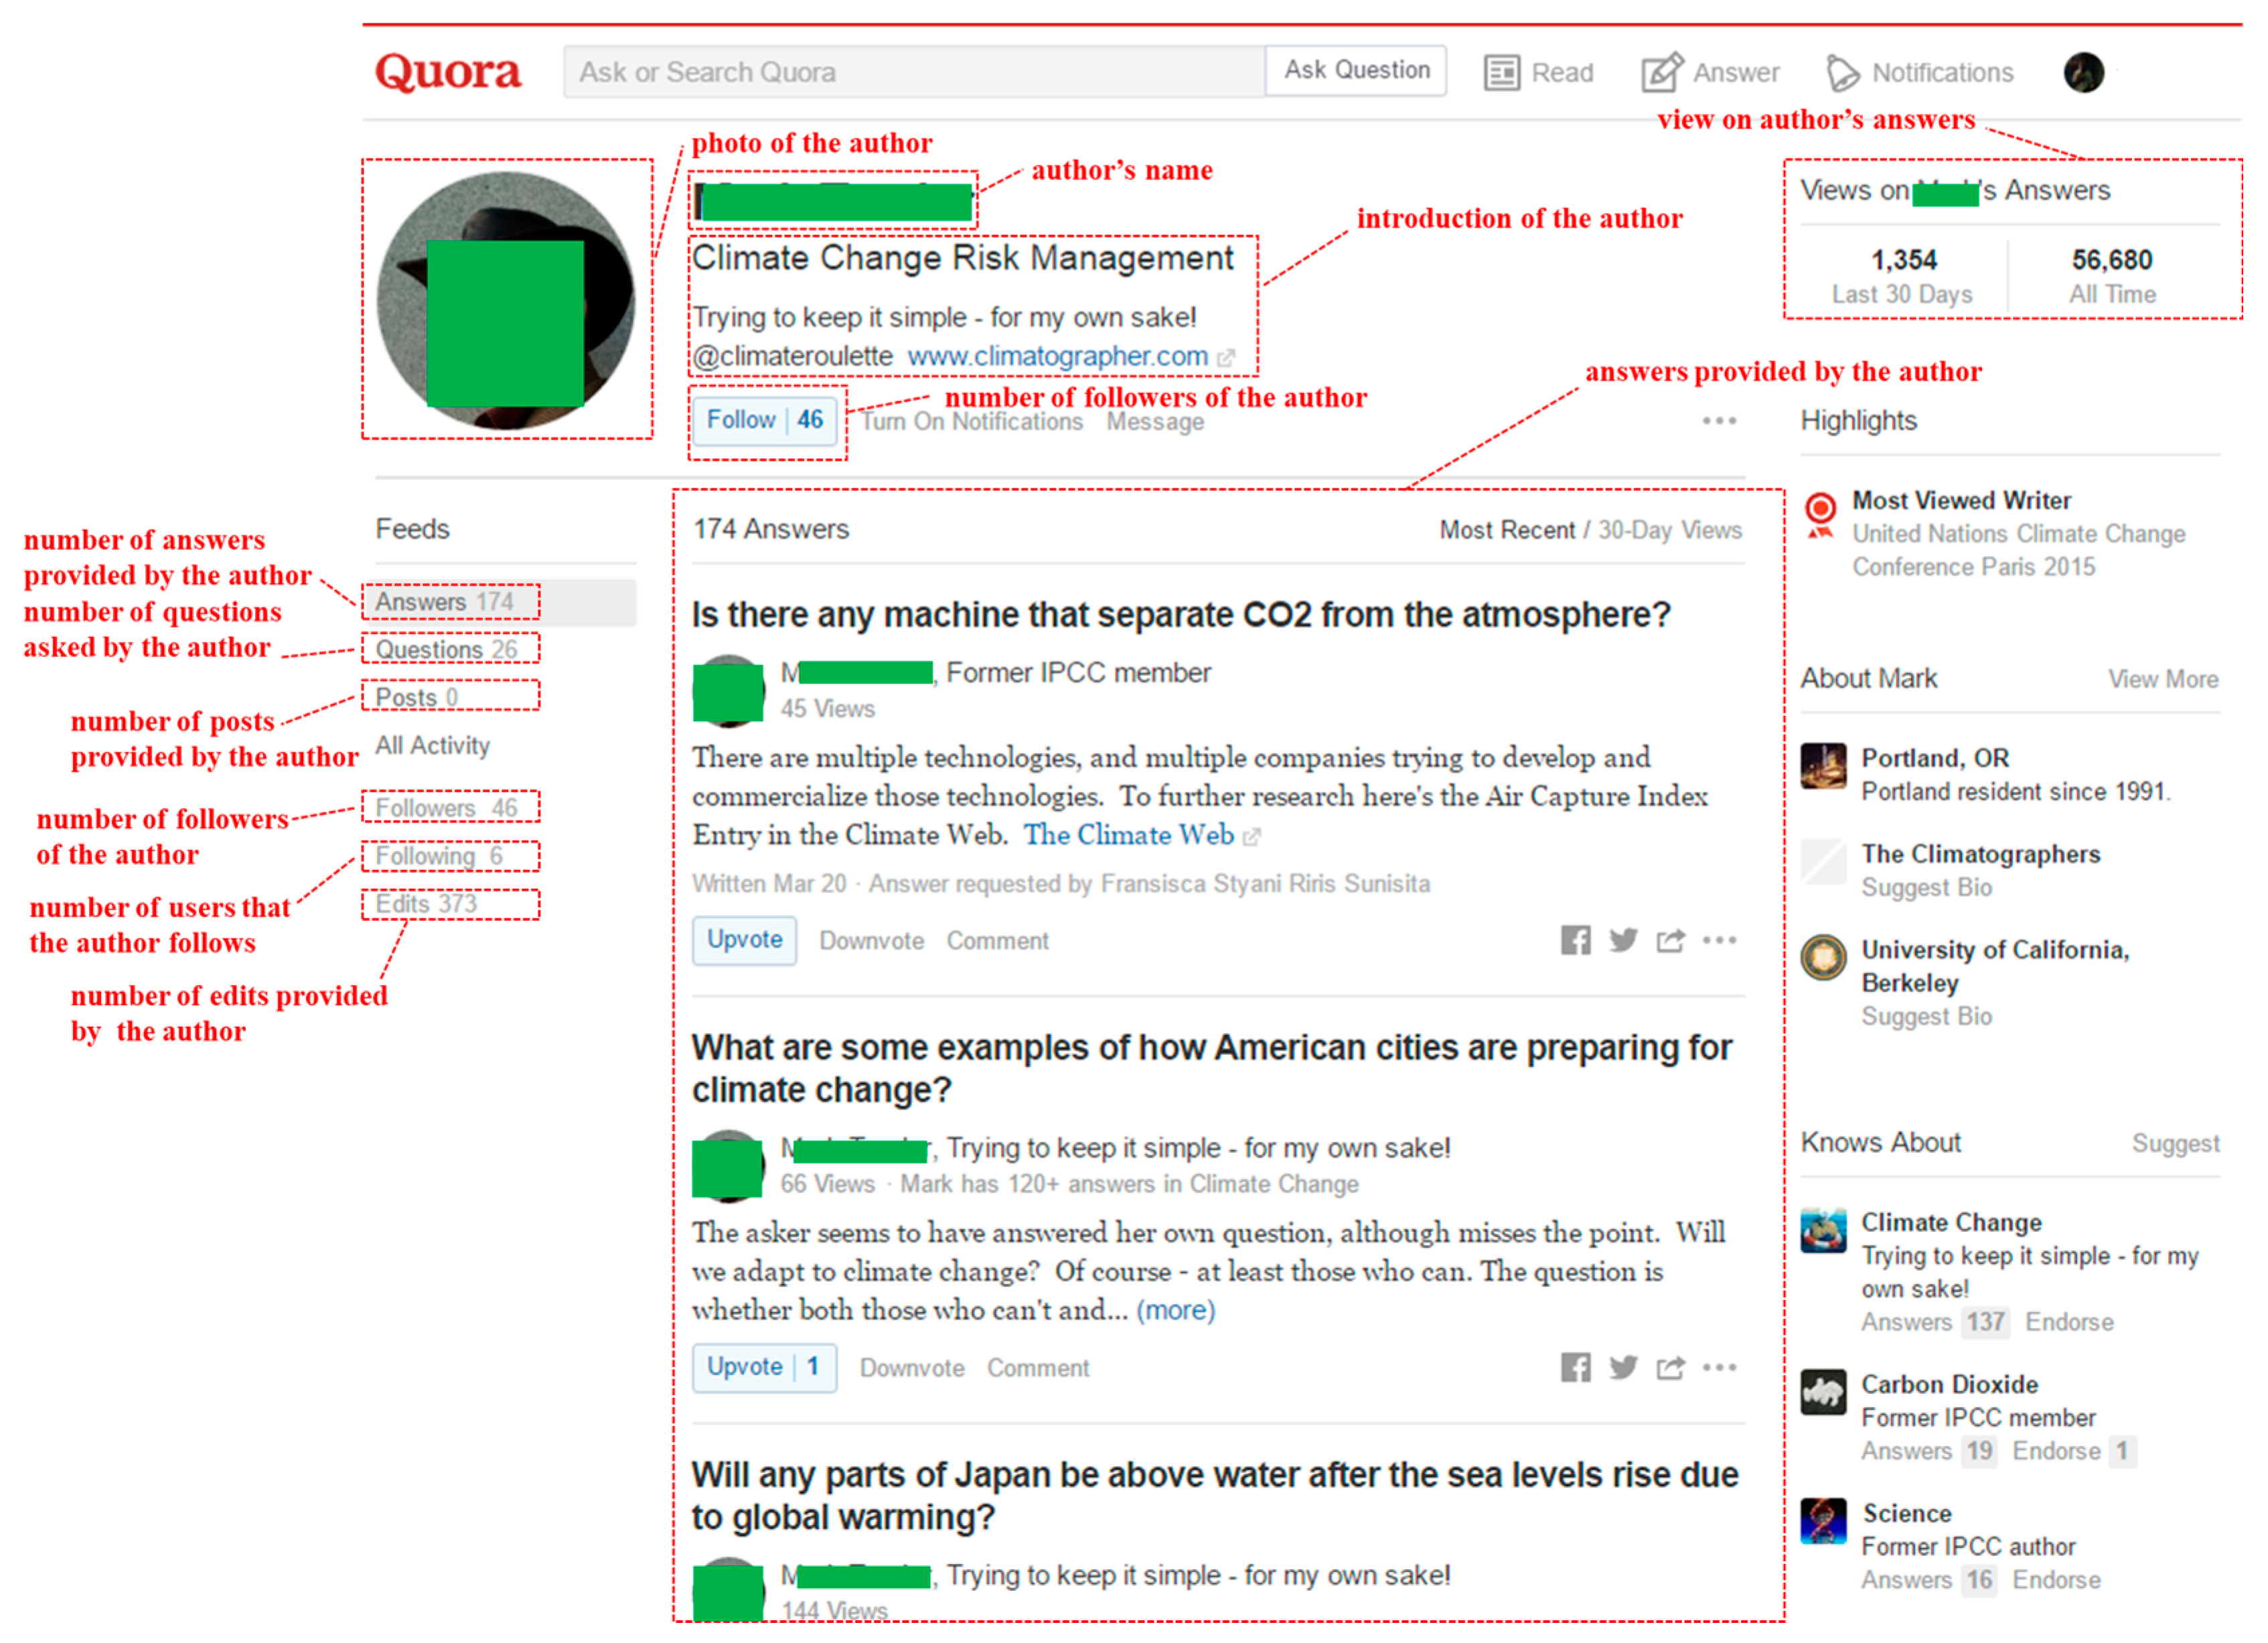
  31. Quora Webpage: An Author’s Profile in Quora. Available online: https://www.quora.com/profile/Mark-Trexler (accessed on 28 March 2016).
  32. Bubela, T.; Nisbet, M.C.; Borchelt, R.; Brunger, F.; Critchley, C.; Einsiedel, E.; Geller, G.; Gupta, A.; Hampel, J.; Hyde-Lay, R.; et al. Science communication reconsidered. Nat. Biotechnol. 2009, 27, 514–518. [Google Scholar] [CrossRef] [PubMed]
  33. Myers, T.A.; Maibach, E.W.; Roser-Renouf, C.; Akerlof, K.; Leiserowitz, A.A. The relationship between personal experience and belief in the reality of global warming. Nat. Clim. Chang. 2013, 3, 343–347. [Google Scholar] [CrossRef]
  34. Nisbet, E.C.; Hart, P.S.; Myers, T.; Ellithorpe, M. Attitude Change in Competitive Framing Environments? Open-/Closed-Mindedness, Framing Effects, and Climate Change. J. Commun. 2013, 63, 766–785. [Google Scholar] [CrossRef]
  35. Entman, R.M. Framing: Toward clarification of a fractured paradigm. J. Commun. 1993, 43, 51–58. [Google Scholar] [CrossRef]
  36. Giorgi, S.; Weber, K. Marks of Distinction: Framing and Audience Appreciation in the Context of Investment Advice. Adm. Sci. Q. 2015, 60, 333–367. [Google Scholar] [CrossRef]
  37. Jang, W.Y. News as propaganda: A comparative analysis of US and Korean press coverage of the Six-Party Talks, 2003–2007. Int. Commun. Gaz. 2013, 75, 188–204. [Google Scholar] [CrossRef]
  38. Roberts, M.E.; Stewart, B.M.; Tingley, D.; Lucas, C.; Leder-Luis, J.; Gadarian, S.K.; Albertson, B.; Rand, D.G. Structural Topic Models for Open-Ended Survey Responses. Am. J. Political Sci. 2014, 58, 1064–1082. [Google Scholar] [CrossRef]
  39. De Battisti, F.; Ferrara, A.; Salini, S. A decade of research in statistics: A topic model approach. Scientometrics 2015, 103, 413–433. [Google Scholar] [CrossRef]
  40. Marwick, A.E.; Boyd, D. I tweet honestly, I tweet passionately: Twitter users, context collapse, and the imagined audience. New Media Soc. 2011, 13, 114–133. [Google Scholar] [CrossRef]
  41. Su, Z.; Meng, T.G. Selective responsiveness: Online public demands and government responsiveness in authoritarian China. Soc. Sci. Res. 2016, 59, 52–67. [Google Scholar] [CrossRef] [PubMed]
  42. Houts, P.S.; Doak, C.C.; Doak, L.G.; Loscalzo, M.J. The role of pictures in improving health communication: A review of research on attention, comprehension, recall, and adherence. Patient Educ. Couns. 2006, 64, 393–394. [Google Scholar] [CrossRef]
  43. Davis, C.; Hyde, J.; Bangdiwala, S.; Nelson, J. An example of dependencies among variables in a conditional logistic regression. In Modern Statistical Methods in Chronic Disease Epidemiology; Moolgavkar, S., Prentice, R., Eds.; Wiley: New York, NY, USA, 1986; pp. 140–147. [Google Scholar]
  44. Intergovernmental Panel on Climate Change (IPCC). Climate Change 2014: Synthesis Report. Contribution of Working Groups I, II and III to the Fifth Assessment Report of the Intergovernmental Panel on Climate Change; Core Writing Team, Pachauri, R.K., Meyer, L.A., Eds.; IPCC: Geneva, Switzerland, 2014; p. 151.
  45. Jabr, W.; Mookerjee, R.; Tan, Y.; Mookerjee, V.S. Leveraging Philanthropic Behavior for Customer Support: The Case of User Support Forums. MIS Q. 2014, 38, 187–208. [Google Scholar] [CrossRef]
  46. Miaou, S.-P. The relationship between truck accidents and geometric design of road sections: Poisson versus negative binomial regressions. Accid. Anal. Prev. 1994, 26, 471–482. [Google Scholar] [CrossRef]
  47. Bertot, J.C.; Jaeger, P.T.; Hansen, D. The impact of polices on government social media usage: Issues, challenges, and recommendations. Gov. Inf. Q. 2012, 29, 30–40. [Google Scholar] [CrossRef]
  48. Bonson, E.; Torres, L.; Royo, S.; Flores, F. Local e-government 2.0: Social media and corporate transparency in municipalities. Gov. Inf. Q. 2012, 29, 123–132. [Google Scholar] [CrossRef]
  49. Lorenzoni, I.; Leiserowitz, A.; Doria, M.D.; Poortinga, W.; Pidgeon, N.F. Cross-national comparisons of image associations with “global warming’’ and “climate change’’ among laypeople in the United States of America and Great Britain. J. Risk Res. 2006, 9, 265–281. [Google Scholar] [CrossRef]
  50. Smith, N.; Leiserowitz, A. The Rise of Global Warming Skepticism: Exploring Affective Image Associations in the United States Over Time. Risk Anal. 2012, 32, 1021–1032. [Google Scholar] [CrossRef] [PubMed]
  51. Gillard, R. Unravelling the United Kingdom’s climate policy consensus: The power of ideas, discourse and institutions. Glob. Environ. Chang. Hum. Policy Dimens. 2016, 40, 26–36. [Google Scholar] [CrossRef]
  52. Harrison, K.; Sundstrom, L.M. The comparative politics of climate change. Glob. Environ. Politics 2007, 7, 1–18. [Google Scholar] [CrossRef]
  53. Wasko, M.M.; Faraj, S. Why should I share? Examining social capital and knowledge contribution in electronic networks of practice. MIS Q. 2005, 29, 35–57. [Google Scholar] [CrossRef]
  54. Simon, H.A. Designing Organizations for an Information-Rich World. Comput. Commun. Public Interest 1971, 70, 37–72. [Google Scholar]
  55. Huberman, B.A.; Romero, D.M.; Wu, F. Crowdsourcing, attention and productivity. J. Inf. Science 2009, 35, 758–765. [Google Scholar] [CrossRef]
  56. Rui, H.X.; Whinston, A. Information or attention? An empirical study of user contribution on Twitter. Inf. Syst. E-Bus. Manag. 2012, 10, 309–324. [Google Scholar] [CrossRef]
  57. Jacobson, S.; Myung, E.; Johnson, S.L. Open media or echo chamber: The use of links in audience discussions on the Facebook pages of partisan news organizations. Inf. Commun. Soc. 2016, 19, 875–891. [Google Scholar] [CrossRef]
  58. Pearce, W.; Holmberg, K.; Hellsten, I.; Nerlich, B. Climate change on Twitter: Topics, communities and conversations about the 2013 IPCC Working Group 1 report. PLoS ONE 2014, 9, e94785. [Google Scholar] [CrossRef] [PubMed]
  59. Williams, H.T.; McMurray, J.R.; Kurz, T.; Lambert, F.H. Network analysis reveals open forums and echo chambers in social media discussions of climate change. Glob. Environ. Chang. 2015, 32, 126–138. [Google Scholar] [CrossRef] [Green Version]
  60. Yadav, D.; Vatsa, M.; Singh, R.; Tistarelli, M. Bacteria Foraging Fusion For Face Recognition Across Age Progression. In Proceedings of the 2013 IEEE Conference on Computer Vision and Pattern Recognition Workshops (Cvprw), Portland, OR, USA, 23–28 June 2013; pp. 173–179. [Google Scholar] [CrossRef]
  61. Rutter, C.M.; Gatsonis, C.A. A hierarchical regression approach to meta-analysis of diagnostic test accuracy evaluations. Stat. Med. 2001, 20, 2865–2884. [Google Scholar] [CrossRef] [PubMed]
  62. Teh, Y.W.; Jordan, M.I.; Beal, M.J.; Blei, D.M. Hierarchical Dirichlet processes. J. Am. Stat. Assoc. 2006, 101, 1566–1581. [Google Scholar] [CrossRef]
Figure 1. A snapshot of a question’s page [30].
Sustainability 10 01509 g001
Figure 2. A snapshot of an author’s profile [31].
Sustainability 10 01509 g002
Figure 3. Word clouds for each topic with the 25 most frequent terms.
Sustainability 10 01509 g003
Table 1. Summary statistics for auxiliary features.
Variable NameDescriptionMeanMinMaxStd. Dev.
Author followersfollower number of the author15720157,2285244
Text lengthnumber of characters of answer text966619,2751146
Image numbernumber of images in the answer0.130200.64
Question followersfollower number of the question11026231
Existing daysnumber of existing days of the answer26812101191
Table 2. Most frequent terms by induced topic, with suggested labels and proportions.
TopicMost Frequent TermsLabelProportion
1carbon, plant, fuel, burn, dioxid-, tree, fossil, air, gas, water, emiss-, atmospher-, produc-, methan-, forestFuel/Carbon0.078
2people, thing, problem, will, good, live, lot, happen, better, bad, person, keep, planet, work, startLivelihood0.124
3will, human, food, popul-, speci-, adapt, increas-, extinct, surviv-, resourc-, countri-, life, war, natur-, environ-Human/Biodiversity0.082
4energi-, power, cost, emiss-, countri-, carbon, develop, coal, fuel, electr-, reduc-, renew-, solar-, technolog-, generat-Energy0.110
5earth, atmospher-, temperatur-, heat, year, increas-, greenhous-, ice, sun, age, ocean, cool, human, gase, energi-Atmosphere/Weather0.100
6scienc-, scientist, scientif-, evid-, theori-, fact, question, human, claim, denier, skeptic, agw, consensus, understand, argumentScience Communication0.114
7sea, rise, water, level, ice, will, area, year, ocean, melt, weather, flood, increas-, winter, temperatur-Hydrosphere0.109
8will, year, time, long, question, answer, term, point, impact, futur-, effect, current, continu-, system, shortFuture0.103
9govern, polit-, money, issu-, industri-, republican, public, fund, compani-, politician, conserv-, polici-, American, state, actionPolitics0.098
10model, data, predict, temperatur-, year, measur-, report, ipcc, weather, record, trend, http, observ-, increas-, eventClimate Modeling0.080
Note: Labels of each topic were suggested qualitatively based on the content of the terms and associated answer texts. Hyphens indicate stemming.
Table 3. Model parameter estimation.
VariablesPoisson ModelNegative Binomial Model
βZ-ValueβZ-Value
Intercept−4.530 ***−361.068−4.188 ***−104.342
Topic 10.628 ***49.2120.105 *2.068
Topic 2−0.145 ***−10.222−0.212 ***−5.090
Topic 30.143 ***8.8990.228 ***4.732
Topic 40.384 ***28.3250.138 **3.051
Topic 5−0.003−0.239−0.027−0.601
Topic 60.085 ***6.5300.451 ***10.454
Topic 70.238 ***18.149−0.073−1.606
Topic 8−0.258 ***−12.633−0.144 **−2.684
Topic 90.615 ***48.6250.348 ***7.978
Topic 100.505 ***36.2550.187 ***3.746
Author followers0.234 ***398.6050.625 ***46.722
Text length0.195 ***75.2940.334 ***23.505
Image number0.099 ***64.8320.102 ***7.308
Question followers0.056 ***24.0630.102 ***7.464
Sample size10,39310,393
Log likelihood−84,785−25,313
AIC169,60050,658
BIC169,70950,774
Note: * p < 0.05. ** p < 0.01. *** p < 0.001. AIC: Akaike Information Criterion; BIC: Bayesian Information Criterion.

