Abstract
Current phosphorus (P) use in European countries is highly dependent on mineral P imports and not sustainably managed. In order to identify and implement measures for sustainable P management, a comprehensive understanding of national P flows and stocks and their temporal dynamics is essential. We conduct a substance flow analysis (SFA) of the Swiss P system of the year 2015, and study the dynamics of the national P system by looking into its development since 1989. Furthermore, we investigate how political-legislative interventions affected the P system during this period. The results show that between 1989 and 2015, the P efficiency in Swiss agriculture increased from 59% to 94%, mainly due to a considerable reduction of fertilization in the agricultural subsystem. At the same time, Switzerland's P import dependency decreased from 33% to 24% between 1989 and 2002 because of a reduction of mineral fertilizer import and use. Between 2002 and 2015, the import dependency stagnated because further improvements in P use efficiency in agriculture were outweighed by a decrease of P recycling and an increase of P losses in the waste management system. By embedding these temporal dynamics in their political-legislative context, we found that top-down interventions such as incentives for a balanced nutrient budget in agriculture, restrictions of the use of animal by-products in the agri-food system or the ban of direct sewage sludge recycling in agriculture significantly affected and shaped the national P system. Our analysis provides profound quantitative and qualitative insights into past and present P management in Switzerland and is followed by part 2 of the paper, where we analyze possible future pathways of P management.
1. Introduction
The transition towards a circular economy (CE) has been receiving growing attention by governments, science, and society [1,2,3,4]. The CE “focuses on recycling, limiting and re-using the physical inputs to the economy, and using waste as a resource leading to reduced primary resource consumption” [5] (p. 11). One resource that is expected to play an important role in this transition is phosphorus (P). P is an essential and non-substitutable nutrient and (when it comes to mineral resources) an unevenly distributed resource worldwide (cf., [6,7,8,9]). Regions without large phosphate rock reserves such as Europe might face scarcities of available, affordable, and high-quality mineral P in the long term. As a consequence, a more sustainable management of P at a national level based on reduced demand, efficient use and closed loops has gained a prominent role in recent CE debates [10,11,12,13]. On the EU level, the European Commission has stressed that the sustainable supply of P is a key requisite for global food security and added phosphate rock and P to the list of Critical Raw Materials [14,15,16]. On a national level, several governments have taken legal action for improving P management. For instance, the governments in Switzerland and Germany decided to stipulate P recycling from the waste sector by obliging wastewater treatment plants (WWTP) to technically recover P from wastewater, sewage sludge or sewage sludge ashes: in Switzerland, the Ordinance on Avoidance and Disposal of Waste (VVEA) requires the recovery of P from wastewater, sewage sludge and sewage sludge ashes and the material utilization of P in meat and bone meal as of 2026 [17]. In Germany, the amendment of the national Sewage Sludge Ordinance implemented in 2017 obliges wastewater treatment plants bigger than 50,000 population equivalents to implement P recovery within the next 12 to 15 years [18].
A profound understanding of the P system, its flows, stocks, processes, and temporal dynamics is an indispensable prerequisite for identifying and implementing management options for a CE of P. The systematic quantification of flows and stocks in resource systems via material (MFA) or substance flow analyses (SFA) provides the knowledge base for CE-related decision-making for more sustainable resource futures [19,20,21,22,23]. Numerous SFAs of P have been published over the past decade (for overviews cf., [24,25,26]). Those studies differ with regard to their geographical focus (cities, regions, countries, world), temporal scale (single-, multi-year, time-continuous), system entities (e.g., whole P system or agri-food system only) and goals (descriptive, normative, predictive, explorative). However, scholars have stressed the necessity of multi-year SFAs conducted for the same area and under the same conditions [23,24]. This should allow to analyze temporal dynamics of P systems and to understand how factors such as political decisions, socio-economic developments, technological innovations, or ecological conditions shape P flows, stocks, and the overall system structures.
While most national SFAs of P in European countries or Europe-aggregated studies primarily focus on presenting the quantitative status quo of P flows and stocks (cf. [13,27,28,29,30,31,32]), the temporal dynamics of a P system have not yet been linked with political-legislative interventions. In Switzerland, four single-year SFAs on a national level have been conducted for the years 1989 [33], 2002 [33], 2005 [34], and 2011 [35], whereas the temporal dynamics of the P system have not yet been systematically compared. These dynamics could be of particular interest, since between the 1980s and today the Swiss government has been undertaking a variety of political-legislative measures in agriculture, consumption, and waste management, which either directly aimed at altering the national P system or should have indirectly affected individual P flows and stocks. Thus, questions arise as to whether P flows, stocks, and processes in the Swiss P system have changed since 1989 and how policy interventions had an impact on the national P system.
In order to find answers to these questions, we conducted an inter-temporal comparative analysis using the single-year SFAs mentioned and performed an additional SFA for the year 2015. Based on this historical analysis, we assess how stable the Swiss P system has been over the past decades and analyze to what extent political-legislative interventions have altered the system structure, its flows and stocks. Thus, we go a step beyond the current yearly SFA analyses. First, we provide insights into how different interventions shaped the Swiss P system. Second, our results are of great value for the assessment of CE measures in the context of sustainable resource management, because future policy interventions for implementing a CE in European countries can build upon these experiences made in the past.
Thus, our study aims to:
- (i)
- conduct a substance flow analysis of the Swiss P budget of the year 2015;
- (ii)
- analyze the dynamics of the system by comparing the Swiss P system of the years 1989, 2002, 2005, 2011, and 2015 based on selected indicators; and
- (iii)
- investigate how political-legislative interventions have affected the national P budget since the 1980s.
The study is followed by part two of the paper [36], where we extend the analysis of the past and present from this study to the future by developing and assessing socio-technical scenarios for P use in Switzerland.
2. Materials and Methods
2.1. Substance Flow Analysis
The Swiss P flows were analyzed using an SFA [21,37,38]. SFA is a method for “a systematic assessment of the flows and stocks of materials within a system defined in space and time” [21] (p. 3) focusing on substances, i.e., chemical compounds or elements [37]. Based on the principle of mass conservation, the method uses a systems approach comprising processes, flows, stocks, and clearly defined system boundaries.
We calculated the flows and stocks of the Swiss P system for the year 2015 by applying the P monitoring tool developed by Binder et al. [34] and STAN 2.5 software (TU Vienna, Vienna, Austria) [39]. The monitoring tool was extensively revised and adapted to changes in data availability (see also Section 2.4.2).
2.2. Flow System Analysis
The geographical system boundary of the SFA model is the Swiss national border. The model builds upon the system model developed by Binder et al. [34] and consists of the following main processes: (i) animal husbandry, including production and provision of animal-based food; (ii) cultivation, including production and provisioning of plant-based food as well as paper and wood industries; (iii) chemical industry, including production of detergents and other chemical products; (iv) households and business (H&B), including all processes associated with the consumption of food, chemical products and wood- and paper-based products, as well as private gardens; (v) waste management, including the processing and disposal of all solid and liquid wastes; and (vi) waterbodies, including all surface waters in Switzerland, i.e., streams, rivers and lakes. Each main process can be considered as a subsystem consisting of its own sub-processes and internal flows.
The model contains four P stocks (neglecting the two small stocks forestry and private gardens, see Supplementary Materials for more information): (i) plant production, including all agricultural soils; (ii), cement plants, including sewage sludge as well as meat and bone meal incinerated in the cement plant and bound in cement after the cement production process; (iii) landfill type D, mainly including slag from municipal solid waste incineration (MSWI) and ash residues from mono-incineration (MI); and (iv) landfill type C, where fly ashes from MSWI and MI are landfilled.
Flows into and out of the system are considered as imports and exports, respectively. They comprise (i) foreign trade of fodder, food, animals, mineral fertilizer, chemical products, wood, paper, and waste (animal by-products, sewage sludge, and fly ashes); and (ii) in- and outflows of water (particularly surface water). For an overview and detailed description of all flows and stocks in the main system and the subsystems, see Binder et al. [34] and Supplementary Materials, Tables S1–S7.
2.3. Inter-Temporal Comparison
For our inter-temporal analysis, we refer to the studies by Lamprecht et al. [33], Binder et al. [34] and Binder and Jedelhauser [35] and conducted a new SFA for the year 2015. We focused our comparison on three systemic units of the national P system: (i) the main system, (ii) the subsystem cultivation and (iii) the subsystem waste management. We emphasized these subsystems as they have been subject to fundamental changes since 1989 and are most relevant for assessing and defining Swiss P management strategies.
For each systemic unit, we developed one indicator that allows for an efficient measurement and assessment of the key characteristics of the (sub-)system. In the main system, the Total Import Dependency (TID) relates P net imports (to the P-demanding processes animal husbandry, cultivation and chemical industry) to total inputs (to these processes). We calculated the TID in each year a according to the following Equation (1):
In the subsystem cultivation, the P efficiency plant production (PEP) is the total amount of domestic fodder and plant-based food production in relation to fertilizer input to soils (manure, mineral fertilizer, organic recycling fertilizer, and sewage sludge) calculated in each year a according to Equation (2):
In the subsystem waste management, the P losses waste management (PLW) is the rate of P losses in the waste sector. By ‘losses’ we refer to losses in cement plants and landfills, exported P, and P in the WWTP effluent. We calculated the PLW in each year a according to Equation (3):
Whereas the TID helps to assess the self-sufficiency of the overall Swiss P system, the other two indicators refer to specific points within the P management system: the PEP corresponds to P efficiency in crop farming and the PLW illustrates the efficiency of the waste management sector in terms of domestic P recycling. Our indicators draw on a variety of MFAs and SFAs that applied similar indicators for the analysis of P import dependencies [23,40], P efficiencies in soils [13,25,41,42], and P losses [43,44].
2.4. Data
2.4.1. Data Collection and Sources
Data used for the calculation of the Swiss P flows of the year 2015 can be divided into three groups: (i) official data from the Swiss Statistical Office and official publications from federal offices and associations; (ii) data provided by private companies; and (iii) data based on expert judgements. For the present study, official data encompass (re)collected data for the year 2015: data on agriculture are based on an annual publication by the Swiss Farmers’ Union [45] and on a study by Hürdler et al. [46]. Data in the waste management sector are mainly based on publications by the FOEN [47,48,49]. Data on animal by-products was collected from a private company dealing with the disposal of animal waste [50]. Data based on expert judgements include P concentrations of various flows as well as flows in the waste management sector [48,51,52,53]. For quantitatively less important or temporally stable flows, data from the previous SFA by Binder et al. [34] were used and, where necessary, adapted to population size. These flows include inputs and outputs of the chemical industry as well as flows of the paper and wood industry. An overview of all flows and their data sources is listed in the Supplementary Materials, Table S8.
2.4.2. Data Processing
To process the input data, we used the P monitoring tool developed by Binder et al. [34]. The tool processes the input data and structures them in a way STAN 2.5 can read them. It is based on 57 need-to-have and 68 nice-to-have data points, covering the most important flows in the Swiss P system and which are, in principle, sufficient to calculate the whole SFA model. Flows not calculated based on need-to-have and nice-to-have input data values were also adapted to the new data structure and thus considerably improved in accuracy. This leads to three different data classes that were then transferred to STAN 2.5: (i) up-to-date values based on need-to-have and/or nice-to-have input data; (ii) other up-to-date values calculated separately; (iii) values adopted from Binder et al. [34] and adapted to population size where necessary. The flow and stock data were calculated with STAN 2.5 (TU Vienna, Vienna, Austria) and visualized with e!Sankey® (ifu Hamburg GmbH, Hamburg, Germany) [54].
2.4.3. Data Quality and Uncertainty
The availability of high-quality data is essential for a profound analysis of material and substance flow systems [55], but at the same time a lack of data is often one of the main obstacles for multi-year SFA studies [24]. In Switzerland, the study by Binder et al. [34] was a major leap in acquiring extensive knowledge and data on the Swiss P system. It extended former models by Lamprecht [56] by increasing flow resolution, adding new flows, and including an uncertainty assessment. In the course of the SFA for the year 2015, again a significant amount of new data, especially for cultivation, animal husbandry, and waterbodies were collected. Thus, data availability and quality can be considered as good with only few areas remaining where further data improvement in future assessments is needed. These areas include animal by-products (blood from slaughter and catering leftovers), municipal solid waste, and the chemical industry.
To perform the inter-temporal analysis, the individual annual SFAs must be comparable, i.e., based on the same data sources, system boundaries and model structure. As the three latest SFAs for the reference years 2006, 2011, and 2015 all used the P monitoring tool, they are largely comparable. The SFAs by Lamprecht et al. [33] for the years 1989 and 2002 slightly vary in terms of data quality and flow resolution. However, the overall structure and the key flows identified are identical to the other SFAs. For individual cases, flow values of former studies (e.g., farmyard manure, plant-based fodder) were adapted for the comparative analysis, resulting in enhanced comparability.
In the present study, uncertainties for each flow and stock were assessed based on the approach by Binder et al. [34], where uncertainties are differentiated by data source. In a further step, STAN 2.5 reconciles all flows and stocks based on their uncertainty value [57]. However, we do not highlight the uncertainty assessment in this paper, since our indicator-based analysis focuses on inter-temporal changes of key P flows, which are expected to have similar (and low) uncertainties in all included SFAs. For more information on uncertainties of flows and stocks, see Binder et al. [34] and Supplementary Materials, Table S1–S7.
3. Results
For better readability we rounded the flow values and do not provide uncertainty intervals in the text of the results section. See Figure 1, Tables S1–S7 in the Supplementary Materials and Section 2.4.3 for more detailed information and data on flows and/or uncertainties.
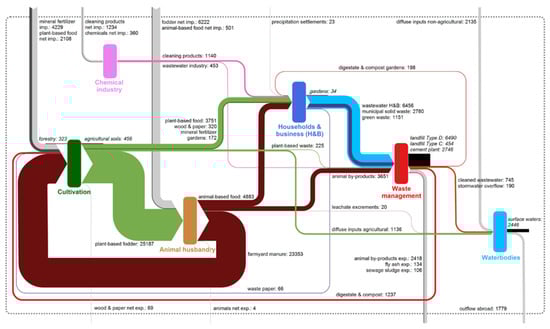
Figure 1.
Swiss phosphorous (P) system 2015. All values are in t P (stocks in italics). Import and export flows are in grey.
3.1. Swiss P System—Current State
Switzerland is a net importer of P with an annual P surplus, i.e., total imports minus total exports, of 10,200 t P (Figure 1). Diffuse P inputs from non-agricultural areas (2100 t P) are not included in this calculation as they are not actively imported by human action. The main net P import flows are inputs to agriculture via fodder (6200 t P) and mineral fertilizer (4200 t P). Net food imports comprise 2600 t P (plant-based: 2100 t P; animal-based: 500 t P). The only substantial P net export flow is via animal by-products. The total of 2400 t P is almost equivalent to the amount of total net imports in food. The total dependence of the Swiss P system on P imports, i.e., TID, is 22.7% (see Section 3.2.1 for a more detailed analysis of the indicator).
In the main system, the quantitatively biggest flows are plant-based fodder (25,200 t P) and manure (23,400 t P), which build an internal P cycle in the agriculture sector that is closed by more than 90%. P in manure is the most important fertilizer input to the cultivation subsystem: 81% of total P inputs to soils are via manure, 15% via mineral fertilizer, and 4% via recycled organic fertilizers. The main P outputs from cultivation are plant-based fodder for animal husbandry (82% of total outputs, closing the aforementioned cycle) and plant-based food for consumption in households and business (12%). Losses to surface water from agricultural land comprise 1100 t P, while waste from the production of plant-based food is negligible (200 t P). The annual stock increase in agricultural soils is 500 t P resulting in a P efficiency in plant production, i.e., PEP, of 94% (see Section 3.2.2 for a more detailed analysis of the indicator).
In the subsystem animal husbandry, the P demand is mainly supplied by domestic plant-based fodder (80%), while fodder imports cover the remaining 20%. P outputs from the subsystem are manure (73%), animal-based food (15%), and animal by-products (11%), which is also the only flow from animal husbandry to waste management. No stocks were assumed in the subsystem.
The subsystem chemical industry is fully dependent on P imports, as there are no domestic mineral P resources and no industry-oriented P recycling flows. A total of 1600 t P is processed in the subsystem. Seventy-two percent are consumed as chemical products in households and business, the remaining 28% leave the system via industrial wastewater. The numbers presented in this section mainly comprise P in cleaning products, whereas P in other industrial applications could not be calculated due to low data availability (see Section 2.4.3). Therefore, the total P amounts of this subsystem are likely to be underestimated.
In the subsystem households and business, the main P inputs are plant-based (3800 t P) and animal-based food (4900 t P), which account for 82% of total P inputs. Since the subsystem contains only one marginal stock (garden: annual storage < 100 t P), 99% of total P leaves the subsystem via waste flows. Wastewater is the biggest output (6500 t P) containing P from urine (52%), faeces (29%), and cleaning products (18%). Other relevant P waste outputs are via municipal solid waste (2800 t P) and green waste (1200 t P). There is an internal P cycle for green household waste, which is locally recycled as compost in private gardens (400 t P).
In the subsystem waste management, the main P inputs are through wastewater (47% of total inputs), animal by-products (25%), municipal solid waste (19%), and green waste (9%). Sixty-six percent of these inputs are stored in landfills or bound in cement (total storage: 9700 t P), the remaining 34% leave the subsystem via exports (18%), secondary fertilizer (10%), and effluent to surface water (6%). Classifying exports and river effluent as losses, the rate of P losses in waste management, i.e., PLW, thus amounts to 90% (see Section 3.2.3 for a more detailed analysis of the indicator).
Concerning sewage sludge treatment, there are currently three routes in waste management: 18% of total sewage sludge from WWTPs is incinerated by MSWI plants (1100 t P), 54% by MI (3200 t P) and 26% by cement plants (1600 t P). After incineration of the P-containing materials in one of the three different routes, P is then landfilled (71%), bound in cement (28%), or exported as fly ash (1%). Hence, 100% of P is lost after incineration, i.e., not available for current P recovery and recycling approaches. Furthermore, 900 t P is lost to surface water via WWTP effluent. Animal by-products either are incinerated in cement plants (32%), fermented and recycled as secondary fertilizer (2%), or exported (66%). Besides the small fraction of animal by-products that is fermented, the only flow that is recycled from waste management is separately collected green waste from cultivation and households and business. After composting and fermentation, it is fully recycled as organic fertilizer for agriculture (1200 t P) and gardens (200 t P).
A total of 4200 t P reaches the subsystem surface water via diffuse P inputs from non-agricultural areas (51%), agricultural areas (27%) and WWTP effluent (22%). Fifty-eight percent of total inflows accumulate in Swiss lakes, while the remaining 42% leave the national system in rivers.
3.2. Inter-Temporal Comparison
3.2.1. Main System
Between 1989 and 2002, the TID of the Swiss P system considerably decreased from 33% to 24% but has been relatively stable since then (Figure 2). The development until 2002 was primarily due to a reduction of total P net imports to the system, which almost halved. The main reason for this was the decrease of mineral fertilizer imports from 17,000 t P in 1989 to 6400 t P in 2002. Between 2002 and 2015, annual P net imports remained relatively stable at approximately 15,000 t P. In this period, further reductions of mineral fertilizer net imports (4200 t P in 2015) were outweighed by the increase of P net imports in food (2600 t P in 2015 compared to 1500 t P in 2002) and fodder (6200 t P in 2015 compared to 5000 t P in 2002).
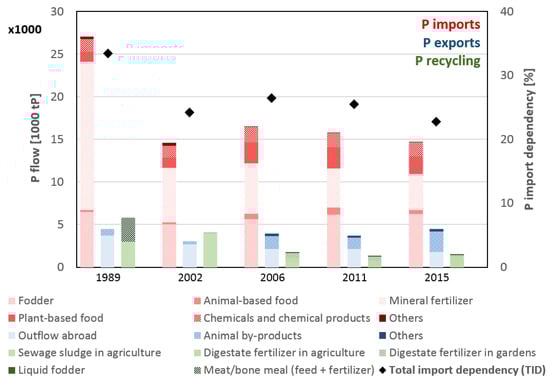
Figure 2.
P net imports (red), P net exports (blue), P recycling flows (green) with regard to the total Swiss P system (in 1000 t P/year) and total import dependency (TID) indicator value (in %).
The TID of the Swiss P system is further influenced by recycling flows, whose total amount of P decreased by more than 70% in the study period (from 5700 t P in 1989 to 1500 t P in 2015). This was due to the decrease of the recycling of sewage sludge as organic fertilizer and meat and bone meal as animal feed, which dropped by 100% and 97% respectively. Today’s P recycling in Switzerland is mainly based on the recycling of green waste as organic fertilizer after composting or fermentation. Not considered as recycled P in Figure 2 are manure and plant-based fodder, which build an internal P cycle in the agriculture sector that is closed by more than 90%. These two flows have remained relatively constant since 1989 (see also Figure 3) and play a major role in keeping the TID of Switzerland at a relatively low level.
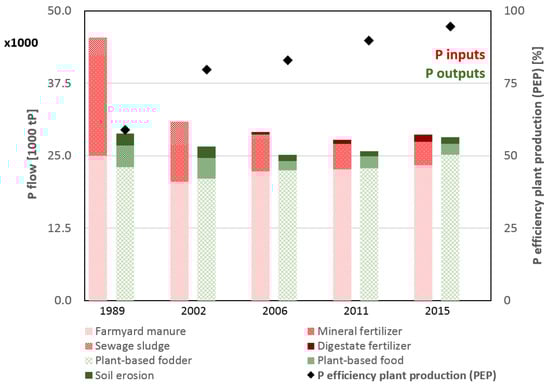
Figure 3.
P inputs (red) to and P outputs (green) from the Swiss P subsystem cultivation (in 1000 t P/year) and P efficiency plant production (PEP) indicator value (in %).
Taking a closer look at the import dependencies of the subsystems, our historical analysis reveals that P imports to cultivation considerably decreased in the study period, whereas P imports to animal husbandry and chemical industry remained at a constant level. As mineral fertilizer imports decreased between 1989 and 2015, the share of mineral fertilizer imports in total P inputs to cultivation also decreased from 37% in 1989 to between 14% (2015) and 20% (2002). In contrast, P imports to animal husbandry accounted for 20–24% of total P inputs to the subsystem and chemical industry was 100% dependent on imports over the whole study period due to the lack of domestic primary or secondary mineral P sources. However, when analysing and interpreting import dependencies of individual subsystems, it is important to note that the close interrelations between subsystems limit the informative value of the calculated percentages. For instance, the share of P imports (mineral fertilizer and plant-based food) in total P inputs to cultivation (20% in 2015) does not imply that the import dependency of the subsystem cultivation is 20%, because other P inputs, e.g., manure, are also (partially) based on P imports, e.g., via fodder imports. The calculations above provide valuable insights for inter-temporal comparisons of how the input–output-structure of subsystems changed over time. TID, however, is the only indicator that allows for the assessment of the overall import dependency of total P use in Switzerland.
3.2.2. Cultivation
In the study period, the efficiency of the subsystem cultivation considerably improved: the PEP indicator increased from 59% in 1989 to 94% in 2015 (Figure 3). The annual P storage in the subsystem, i.e., the annual P accumulation in agricultural soils, considerably decreased during the same time. Whereas in 1989, P stocks in soils grew by 18,000 t P, annual P storage gradually decreased to 4000 t P in 2002, 3400 t P in 2006, 1800 t P in 2011, and 500 t P in 2015. Per hectare of agricultural land [58], P accumulation in soils decreased from 16.9 kg in 1989 to 3.7 kg in 2002, 3.2 kg in 2006, 1.8 kg in 2011, and 0.4 kg in 2015.
The decrease of P inputs to the subsystem due to reduced mineral fertilizer imports and lower sewage sludge inputs to agricultural soils played a key role for its increase in efficiency (see Section 3.2.1). At the same time, the outputs remained relatively stable over the study period. In other words, fertilizer inputs in agriculture were considerably reduced while keeping similar crop yields. The slightly higher values in 1989 and 2002, in particular of plant-based food, are due to different data sources in the study by Lamprecht et al. [33]. The calculations for 2006, 2011, and 2015 are in agreement with other studies on P in plant-based food flows [59,60]. In all five reference years, plant-based fodder accounted for at least 85% of food-related outputs from cultivation. The increase in plant-based food and fodder between 2006 and 2015 (+12%) corresponds to the population growth in Switzerland during that period (+11%). Furthermore, the gradual increase in plant-based fodder production between 2006 and 2015 is in line with the increase in manure production in animal husbandry during the same period.
3.2.3. Waste Management
Total P losses in waste management considerably increased from 9000 t P in 1989 to 13,300 t P in 2015 indicating that the management of P-containing waste underwent significant changes. The PLW indicator increased from 64% in 1989 to 90% in 2015 (Figure 4). It is worthwhile mentioning that total P losses in waste management make up 90% of total P net imports (14,700 t P) to the overall Swiss P system. Four different types of P losses can be identified: (i) P losses to landfills comprising fly ashes from MI and partially MSWI (landfill type C) as well as slag and ash residues from MI and MSWI (also including fly ashes) (landfill type D); (ii) the incineration of P-containing material in the cement industry; (iii) P exports in animal by-products and to a minor degree in fly ash and sewage sludge; and (iv) WWTP effluents. Due to a lack of detailed data, P losses to landfills and cement were subsumed under landfill type D for the years 1989 and 2002.
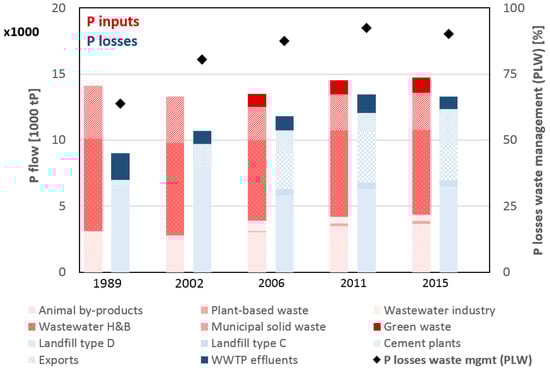
Figure 4.
P inputs (red) to and P losses (blue) within and from the Swiss P subsystem waste management (in 1000 t P/year) and P losses in waste management (PLW) indicator value in %. In 1989 and 2002, ‘wastewater Households and Business (H&B)’ also contains ‘wastewater industry’; and ‘municipal solid waste’ also includes ‘green waste’. WWTP = wastewater treatment plant.
The increase in total P losses is mainly due to landfilling and cement production, which increased by 50% in the study period. P losses via exports played a minor role in 1989 (6% of total losses) but since then have become a relevant output (11% in 2011; 20% in 2015). P losses in WWTP effluents were substantially reduced during the study period from 2000 t P in 1989 to 900 t P in 2015. Between 2011 and 2015, total P losses slightly decreased due to a reduction of P losses in cement production and WWTP effluents finding expression in a decrease of PLW from 93% to 90%.
On the input side, P flows to waste management decreased between 1989 (14,000 t P) and 2002 (13,300 t P) and then gradually increased until 2015 (14,700 t P). Since data availability for 1989 and 2002 were not as detailed as for the later studies, ‘wastewater H&B’ also contains wastewater from industry and ‘municipal solid waste’ includes green waste in these two years. Between 1989 and 2015, P in wastewater decreased by 7% despite a population growth of 26% in the same time period. The amount of P in municipal solid waste and green waste decreased by 13% between 1989 and 2002 and then increased almost back to the level of 1989. Something similar can be observed for P in animal by-products, which decreased slightly between 1989 (3100 t P) and 2002 (2800 t P) and then increased until 2015 (3700 t P) even above the level of 1989.
3.3. Political-Legislative Interventions and Their Implications for the Swiss P System since the 1980s
Since the 1980s, political-legislative changes in four areas have been affecting the Swiss P system: (i) P in laundry detergents; (ii) use of meat and bone meal; (iii) fertilization; and (iv) recycling of sewage sludge. Our analysis shows how each of these interventions had direct implications for P flows and stocks in the system affecting the indicators TID, PEP, and PLW (Figure 5).
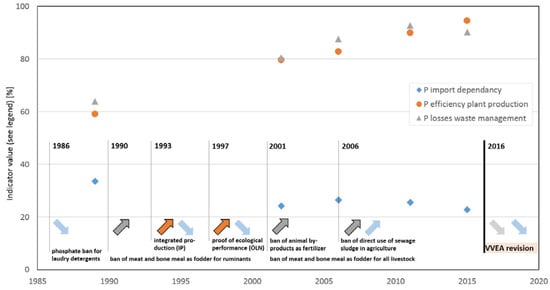
Figure 5.
Political-legislative interventions in Switzerland since the 1980s and their implications for the TID (blue), PEP (orange), and PLW (grey) indicators. The arrows indicate direct (bold framed) and indirect (transparent) implications, whereas arrows up represent an increase and arrows down a decrease of the respective indicator.
First, in 1986, due to heavy eutrophication of Swiss lakes, phosphate was banned for laundry detergents [61]. In the following years, this legislative intervention, in combination with improved P removal in Swiss WWTPs, resulted in lower P content in the effluent considerably reducing eutrophication in Swiss lakes [62,63]. Today, eutrophication mainly remains an issue in rivers and lakes surrounded by intensive stock farming and cultivation [64].
Second, the outbreak of the bovine spongiform encephalopathy (BSE) disease in Switzerland led to restrictions of the use of meat and bone meal resulting in a considerable increase of P losses. In 1990, the first Swiss BSE case was diagnosed. As a consequence, the use of meat and bone meal as animal feed for ruminants was banned [65,66]. This was the first step in a series of measures for combatting the animal disease: in 1996, specified risk material was fully removed from the feed chain [67]; in 2001, the ban of meat and bone meal as animal feed was extended to all livestock, and animal by-products were banned for fertilizer use [65,66]. While these measures minimized the risk for animal and human health and were key in eradicating BSE in Switzerland, they also had a substantial impact on the Swiss P system. P recycling of meat and bone meal was made impossible which is reflected in the increase of the PLW indicator, particularly caused by an eightfold increase in P exports via animal by-products between 2002 (300 t P) and 2015 (2400 t P).
Third, measures on improving the efficiency of fertilization in Switzerland led to an increase in P use efficiency in cultivation and a reduction of the dependency on mineral fertilizer imports. In the 1980s and 1990s, the negative implications of over-fertilization comprising huge mineral fertilizer imports, over-fertilized soils and increased eutrophication due to diffuse P inputs from agricultural areas into surface waters were major issues in Swiss agriculture. In 1993, the first ordinance on direct payments to the agricultural sector was put into force setting financial incentives for ecological and animal friendly farming within the “Integrated Production (IP)” program [68,69]. With regard to P, the criterion of a balanced nutrition budget of nitrogen and P inputs and outputs was vital. From 1999 on, IP was an essential requirement for farmers to receive direct payments (“proof of ecological performance (ÖLN)” [68,69]). These incentives were accompanied by a sensitization of the farmers in terms of fertilizing practices and production optimization contributing to considerably reduced P inputs to soils. Hence, the PEP increased from 59% (1989) to more than 80% (2002) and, as an indirect effect, the TID decreased from 33% (1989) to 24% (2002) mainly due to reduced mineral fertilizer imports.
Fourth, the ban of sewage sludge input into agriculture led to an increase of the P incinerated and landfilled in waste management causing an increase in P losses. After a lengthy decision process, the direct application of sewage sludge on agricultural land was prohibited in 2006 due to environmental and health-related concerns regarding heavy metals, pollutants and potential pathogens contained in sewage sludge [17]. Because of the legislative intervention, sewage sludge had to be treated as waste, making a domestic recycling impossible. The effects on the national P system already started during the antecedent transition period: the PLW further increased from 81% (2002) to 93% (2011).
Besides these political-legislative changes in the past, there will be further interventions in the future likely affecting the Swiss P system: (i) the Ordinance on Avoidance and Disposal of Waste (VVEA), which requires the recovery of P from wastewater, sewage sludge and sewage sludge ashes and the re-utilization of P in meat and bone meal as of 2026, targets to significantly reduce both PLW and TID [17]; (ii) in 2015, Switzerland received the highest status of “negligible BSE risk”, which may in the long run result in an easing of the current legislation regarding the use of animal by-products and thus may re-enable additional P recycling causing a decrease of both PLW and TID [66]; and (iii) in 2017, Switzerland adopted a legislative change from the European Union that practically extends the phosphate ban to dishwashing detergents [70]. This will further reduce the P amount reaching the wastewater stream and contribute to a reduction of P losses via WWTP effluents and sewage sludge (if landfilled or incinerated in cement production).
This historical overview stressed the impact of political-legislative measures on the Swiss P system. These measures either aimed at directly changing P use, e.g., by banning P in laundry detergents, or indirectly affected P flows by intervening in the use of P-containing materials, e.g., sewage sludge or meat and bone meal. Taking the indicators developed in this work, on the one hand, interventions in fertilizing practices led to an increase in the PEP. On the other hand, domestic P recycling pathways via sewage sludge and meat and bone meal have been restricted, thus increasing the PLW.
4. Discussion
4.1. Main Insights
Our analysis provided insights into three aspects of the Swiss P system. First, it showed the current state of P flows and stocks in the national system for the year 2015, pinpointing the most relevant flows in agriculture and the biggest annual stock accumulations in the waste sector from a quantitative perspective. As P in these stocks is unavailable for future P recycling, there is a need for a change in the management of P-rich materials in the waste sector, particularly sewage sludge and animal by-products. Second, the inter-temporal comparison of five SFAs between the years 1989 and 2015 showed that the system’s dependence on P imports initially decreased considerably between 1989 and 2002 but has been relatively constant since then. P use efficiency in the subsystem cultivation and P losses in the subsystem waste management increased during the study period. By embedding these temporal dynamics in their political-legislative context, we, third, illustrated how different policy interventions affected the Swiss P system over time, both in the positive (higher efficiency), as well as negative (more losses) direction. More specifically, our analyses revealed that the interventions, particularly legislative ones, came along with impacts on P flows and stocks being a major driver of P management on a national level.
From a methodological perspective, the three indicators developed, i.e., TID, PEP, and PLW, proved to be valuable for analyzing both the status quo and the temporal dynamics of the Swiss P main system and the subsystems cultivation and waste management. Furthermore, they helped to systematically analyze the quantitative impact of the political-legislative interventions. Our comparative analysis further demonstrated the importance of having comparable SFAs as a basis. Since all the SFAs used in this analysis built on one another, a comprehensive comparative analysis was enabled. We thus consider that the blueprint as proposed by Jedelhauser and Binder [25] could be used as a basis for fostering comparative analyses in space and time.
4.2. Circular Economy Context
From a normative CE perspective, the results show an ambivalent picture of P management in Switzerland. As explained above, a CE comprises both creating material cycles via re-use and recycling, and limiting the material input to society. With regard to limiting the P inputs, improved P efficiency in soil management (PEP indicator) considerably decreased mineral fertilizer imports and reduced the system’s dependency on P imports (TID indicator). Regarding P re-use and recycling, however, the total volume of circular P flows decreased due to changes in legislation related to the management of sewage sludge and animal by-products. As a consequence, today’s Swiss P system is less circular than it was 15 to 30 years ago and is instead characterized by a linear structure with P mainly ending up as losses to landfills and the cement industry.
Based on our results, the question arises as to which general insights for CE-oriented resource management can be provided using the case of P flows and stocks in Switzerland. We derive two conclusions: First, resource management is a multi-dimensional challenge. The policy interventions with regard to sewage sludge and meat and bone meal made these materials no longer being considered as a resource but as waste that had to be incinerated and disposed of. The resource perspective of the CE was eclipsed by health-related and environmental issues hampering P cycling but guaranteeing a safe disposal of potentially hazardous materials. This shows that a circular P management is not necessarily synonymous with a sustainable P management. P is contained in a variety of materials with different characteristics, roles, and meanings that are subject to diverging environmental, social, or economic interests. Decision-makers in the CE need to be aware of these interrelations, potential conflicts and trade-offs.
Second, our analyses illustrate the time scales in which political decisions related to resource management are made and when they have an effect on the system. On the one hand, the Swiss case shows that the implementation of the CE on national level is a lengthy process. From first studies (e.g., Binder et al. [34]) to the end of the VVEA transition phase in 2026, it will have taken almost 20 years until new P cycles based on P recovery from sewage sludge or sewage sludge ashes are implemented. This is in agreement with Boller [62], who stressed that it took more than 10 years of debate until the ban of P in laundry detergents came into effect in 1986. In other words, the time period between first scientific insights to legislative implementation can reach decades, while the latter is usually followed by a transition period that further delays practical implementation. On the other hand, the Swiss case shows the direct, and especially in acute health-related issues (e.g., BSE crisis), rather immediate impact of policy interventions on material and P use (e.g., animal by-products). Our analyses highlight the importance of integrative CE decision-making, as both long-term transformations of socio-technical systems and short-term interventions not only affect individual P flows, stocks, or subsystems, but also have an impact on the overall structure of the system, e.g., in terms of import dependency.
4.3. Limitations and Future Research
Even though a profound database of material and P flows was collected in the course of the different SFAs, some areas within the Swiss P system need further refinement in terms of data quality. Future research should focus on improving data on material and P flows in the chemical industry as uncertainties are currently still high and probably not all applications of P in the industry are represented in our analysis. Furthermore, uncertainties of P concentrations in municipal solid waste are relatively high, demanding improved approaches to monitor the composition of these materials.
With regard to our analysis of the political-legislative context, it is important to note that national policy interventions are not the only driver of changes in the P system but that P use is embedded in a multi-level context ranging from processes on the local micro-level to supranational trends on the macro-level. While policy interventions certainly triggered various developments in the past (e.g., regarding detergents, sewage sludge, or animal by-products), other trends are likely to be the result of a combination of different influencing factors including the political-legislative context but also social, economic, or ecological aspects. For instance, on the one hand, the incentives of the IP program contributed to a reduction of mineral fertilizer use by Swiss farmers. On the other hand, the decreased P use in mineral fertilizers in Switzerland is in line with the overall trend in Western and Central Europe [71], suggesting that factors such as price trends of mineral P, over-fertilization in the past, or a growing awareness and knowledge of efficient fertilization strategies are further possible factors that influence P use in agriculture.
When investigating on past or future pathways of national P systems, research should therefore focus on the complex interplay of P flows and stocks with social, technical, political, economic, and ecological factors. Part two of our contribution provides a first analysis by combining a SFA-based scenario analysis with insights from socio-technical transition studies to investigate possible future scenarios of Swiss P management [36].
Supplementary Materials
The detailed results and data sources of the SFA of P in Switzerland 2015 are available online at http://www.mdpi.com/2071-1050/10/5/1479/s1, Table S1: Swiss P system 2015; Table S2: Swiss P system 2015, sub-system animal husbandry; Table S3: Swiss P system 2015, sub-system cultivation; Table S4: Swiss P system 2015, sub-system chemical industry; Table S5: Swiss P system 2015, sub-system households & business; Table S6: Swiss P system 2015, sub-system waste management; Table S7: Swiss P system 2015, sub-system waterbodies; Table S8: Data sources of all P flows calculated in this study.
Author Contributions
C.R.B. conceived the study. J.M. collected and processed the data and, with support by M.J., conducted the SFA of 2015, the inter-temporal comparison, and the analysis of the political-legislative context. J.M. and M.J. wrote a large part of the paper under the guidance of C.R.B. who also revised the manuscript.
Acknowledgments
This research was part of the project “00.5035.P2I Q062-0017”, funded by the Swiss Federal Office for the Environment (FOEN). We thank in particular Dr. Kaarina Schenk, FOEN, for her critical remarks and inputs. This research was co-funded by Swiss Mobiliar. The authors wish to thank all experts from Eawag, Agroscope, Centravo AG, Zurich Office of Waste, Water, Energy and Air, Zurich University of Applied Sciences, Swiss Farmers’ Union, Swiss Federal Office for the Environment and Swiss Federal Food Safety and Veterinary Office for their support during the data collection process.
Conflicts of Interest
The authors declare no conflict of interest.
References
- European Commission. Closing the Loop: An EU Action Plan for the Circular Economy; European Commission: Brussels, Belgium, 2015. [Google Scholar]
- Geissdoerfer, M.; Savaget, P.; Bocken, N.M.; Hultink, E.J. The Circular Economy: A new sustainability paradigm? J. Clean. Prod. 2017, 143, 757–768. [Google Scholar] [CrossRef]
- Ghisellini, P.; Cialani, C.; Ulgiati, S. A review on circular economy: The expected transition to a balanced interplay of environmental and economic systems. J. Clean. Prod. 2016, 114, 11–32. [Google Scholar] [CrossRef]
- Rizos, V.; Tuokko, K.; Behrens, A. The Circular Economy: A Review of Definitions, Processes and Impacts; Research Report No 2017/8CEPS; Centre for European Policy Studies: Brussels, Belgium, 2017. [Google Scholar]
- European Environment Agency. Resource-Efficient Green Economy and EU Policies; Publications Office of the European Union: Luxembourg, 2014.
- Childers, D.L.; Corman, J.; Edwards, M.; Elser, J.J. Sustainability challenges of phosphorus and food: Solutions from closing the human phosphorus cycle. Bioscience 2011, 61, 117–124. [Google Scholar] [CrossRef]
- Scholz, R.W.; Roy, A.H.; Hellums, D.T. Sustainable phosphorus management: A transdisciplinary challenge. In Sustainable Phosphorus Management: A Global Transdisciplinary Roadmap; Scholz, R.W., Roy, A.H., Brand, F.S., Hellums, D.T., Ulrich, E., Eds.; Springer: Heidelberg/Berlin, Germany, 2014; pp. 1–128. [Google Scholar]
- USGS (United States Geological Survey). Mineral Commodity Summaries 2017; United States Geological Survey: Reston, VA, USA, 2017.
- Wyant, K.A.; Corman, J.E.; Elser, J.J. Phosphorus, Food, and Our Future; Oxford University Press: New York, NY, USA, 2013. [Google Scholar]
- De Ridder, M.; De Jong, S.; Polchar, J.; Lingemann, S. Risks and Opportunities in the Global Phosphate Rock Market: Robust Strategies in Times of Uncertainty; The Hague Centre for Strategic Studies: The Hague, The Netherlands, 2012. [Google Scholar]
- Ellen MacArthur Foundation; SUN; McKinsey Center for Business and Environment. Growth Within: A Circular Economy Vision for a Competitive Europe. Ellen MacArthur Foundation: Isle of Wight, United Kingdom, 2015. Available online: https://www.ellenmacarthurfoundation.org/publications/growth-within-a-circular-economy-vision-for-a-competitive-europe (accessed on 11 December 2017).
- Nesme, T.; Withers, P.J. Sustainable strategies towards a phosphorus circular economy. Nutr. Cycl. Agroecosyst. 2016, 104, 259–264. [Google Scholar] [CrossRef]
- Van Dijk, K.C.; Lesschen, J.P.; Oenema, O. Phosphorus flows and balances of the European Union Member States. Sci. Total Environ. 2016, 542, 1078–1093. [Google Scholar] [CrossRef] [PubMed]
- European Commission. Roadmap to a Resource Efficient Europe; European Commission: Brussels, Belgium, 2011. [Google Scholar]
- European Commission. 20 Critical Raw Materials—Major Challenge for EU Industry. 2014. Available online: http://europa.eu/rapid/press-release_IP-14-599_en.htm (accessed on 11 December 2017).
- European Commission. Communication from the Commission to the European Parliament, the Council, the European Economic and Social Committee and the Committee of the Regions on the 2017 List of Critical Raw Materials for the EU; European Commission: Brussels, Belgium, 2017. [Google Scholar]
- Schweizer Bundesrat. Verordnung Über die Vermeidung und die Entsorgung von Abfällen (VVEA); Ordinance on Avoidance and Disposal of Waste; Schweizer Bundesrat: Bern, Switzerland, 2015. [Google Scholar]
- BMU—Federal Ministry for the Environment, Nature Conservation, Building and Nuclear Safety. Klärschlammverordnung—AbfKlärV (Sewage Sludge Ordinance). 2017. Available online: http://www.bmub.bund.de/themen/wasser-abfall-boden/abfallwirtschaft/wasser-abfallwirtschaft-download/artikel/klaerschlammverordnung-abfklaerv/?tx_ttnews%5BbackPid%5D=608 (accessed on 8 March 2017).
- Binder, C.R.; Van Der Voet, E.; Rosselot, K.S. Implementing the results of material flow analysis. J. Ind. Ecol. 2009, 13, 643–649. [Google Scholar] [CrossRef]
- Brunner, P.H. Substance flow analysis as a decision support tool for phosphorus management. J. Ind. Ecol. 2010, 14, 870–873. [Google Scholar] [CrossRef]
- Brunner, P.H.; Rechberger, H. Practical Handbook of Material Flow Analysis; Lewis Publishers: Boca Raton, FL, USA, 2004. [Google Scholar]
- Zessner, M.; Lampert, C. The use of regional material balances in water quality management. Urban Water 2002, 4, 73–83. [Google Scholar] [CrossRef]
- Zoboli, O.; Laner, D.; Zessner, M.; Rechberger, H. Added values of time series in material flow analysis: The Austrian phosphorus budget from 1990 to 2011. J. Ind. Ecol. 2015, 20, 1334–1348. [Google Scholar] [CrossRef] [PubMed]
- Chowdhury, R.B.; Moore, G.A.; Weatherley, A.J.; Arora, M. A review of recent substance flow analyses of phosphorus to identify priority management areas at different geographical scales. Res. Conserv. Recycl. 2014, 83, 213–228. [Google Scholar] [CrossRef]
- Jedelhauser, M.; Binder, C.R. Losses and efficiencies of phosphorus on a national level: A comparison of European substance flow analyses. Res. Conserv. Recycl. 2015, 105, 294–310. [Google Scholar] [CrossRef]
- Wu, H.; Zhang, Y.; Yuan, Z.; Gao, L. A review of phosphorus management through the food system: Identifying the roadmap to ecological agriculture. J. Clean. Prod. 2016, 114, 45–54. [Google Scholar] [CrossRef]
- Antikainen, R.; Lemola, R.; Nousiainen, J.I.; Sokka, L.; Esala, M.; Huhtanen, P.; Rekolainen, S. Stocks and flows of nitrogen and phosphorus in the Finnish food production and consumption system. Agric. Ecosyst. Environ. 2005, 107, 287–305. [Google Scholar] [CrossRef]
- Antikainen, R.; Haapanen, R.; Lemola, R.; Nousiainen, J.I.; Rekolainen, S. Nitrogen and phosphorus flows in the Finnish agricultural and forest sectors, 1910–2000. Water Air Soil Pollut. 2008, 194, 163–177. [Google Scholar] [CrossRef]
- Egle, L.; Zoboli, O.; Thaler, S.; Rechberger, H.; Zessner, M. The Austrian P budget as a basis for resource optimization. Res. Conserv. Recycl. 2014, 83, 152–162. [Google Scholar] [CrossRef]
- Klinglmair, M.; Lemming, C.; Jensen, L.S.; Rechberger, H.; Astrup, T.F.; Scheutz, C. Phosphorus in Denmark: National and regional anthropogenic flows. Res. Conserv. Recycl. 2015, 105, 311–324. [Google Scholar] [CrossRef]
- Linderholm, K.; Mattsson, J.E.; Tillman, A.-M. Phosphorus flows to and from Swedish agriculture and food chain. Ambio 2012, 41, 883–893. [Google Scholar] [CrossRef] [PubMed]
- Ott, C.; Rechberger, H. The European phosphorus balance. Res. Conserv. Recycl. 2012, 60, 159–172. [Google Scholar] [CrossRef]
- Lamprecht, H.; Lang, D.J.; Binder, C.R.; Scholz, R.W. The trade-off between phosphorus recycling and health protection during the BSE crisis in Switzerland. GAIA Ecol. Perspect. Sci. Soc. 2011, 20, 112–121. [Google Scholar] [CrossRef]
- Binder, C.R.; De Baan, L.; Wittmer, D. Phosphorflüsse der Schweiz; Federal Office for the Environment (FOEN): Bern, Switzerland, 2009.
- Binder, C.R.; Jedelhauser, M. Aktualisierung der Phosphorflüsse der Schweiz für das Jahr 2011 im Auftrag des Bundesamts für Umwelt (BAFU); Final Report; Binder/Signer/Fiechter—Institut für Nachhaltigkeit (IFN): Zollikon, Switzerland, 2014. [Google Scholar]
- Jedelhauser, M.; Mehr, J.; Binder, C.R. The Swiss phosphorus budget—Part 2: Socio-technical scenarios for future pathways towards a circular phosphorus economy. Sustainability 2018, submitted. [Google Scholar]
- Baccini, P.; Brunner, P.H. Metabolism of the Anthroposphere. Analysis, Evaluation, Design; MIT Press: Cambridge, MA, USA, 2012. [Google Scholar]
- Baccini, P.; Bader, H.-P. Regionaler Stoffhaushalt. Erfassung, Bewertung und Steuerung; Spektrum Akademischer Verlag: Heidelberg/Berlin, Germany, 1996. [Google Scholar]
- Cencic, O.; Rechberger, H. Material flow analysis with software STAN. J. Environ. Eng. Manag. 2008, 18, 3. [Google Scholar]
- Keil, L.; Folberth, C.; Jedelhauser, M.; Binder, C.R. Time-continuous phosphorus flows in the Indian agri-food sector: Long-term drivers and management options. J. Ind. Ecol. 2017, in press. [Google Scholar] [CrossRef]
- Álvarez, J.; Roca, M.; Valderrama, C.; Cortina, J.L. A phosphorous flow analysis in Spain. Sci. Total Environ. 2018, 612, 995–1006. [Google Scholar] [CrossRef] [PubMed]
- Cooper, J.; Carliell-Marquet, C. A substance flow analysis of phosphorus in the UK food production and consumption system. Res. Conserv. Recycl. 2013, 74, 82–100. [Google Scholar] [CrossRef]
- Scholz, R.W.; Wellmer, F.-W. Losses and use efficiencies along the phosphorus cycle—Part 2: Understanding the concept of efficiency. Res. Conserv. Recycl. 2015, 105, 259–274. [Google Scholar] [CrossRef]
- Senthilkumar, K.; Mollier, A.; Delmas, M.; Pellerin, S.; Nesme, T. Phosphorus recovery and recycling from waste: An appraisal based on a French case study. Res. Conserv. Recycl. 2014, 87, 97–108. [Google Scholar] [CrossRef]
- Agristat. Statistische Erhebungen und Schätzungen über Landwirtschaft und Ernährung 2015; Schweizer Bauernverband: Brugg, Switzerland, 2016. [Google Scholar]
- Hürdler, J.; Prasuhn, V.; Spiess, E. Abschätzung Diffuser Stickstoff und Phosphoreinträge in die Gewässer der Schweiz, MODIFFUS 3.0. Bericht im Auftrag des Bundesamtes für Umwelt (BAFU); Agroscope: Zurich, Switzerland, 2015. [Google Scholar]
- Federal Office for the Environment (FOEN). Abfallmengen und Recycling 2015 im Überblick; FOEN: Bern, Switzerland, 2017.
- Mandaliev, P.; Schleiss, K. Kompostier–und Vergärungsanlagen. Erhebung in der Schweiz und in Liechtenstein; Federal Office for the Environment (FOEN): Bern, Switzerland, 2016.
- Morf, L. Chemische Zusammensetzung Verbrannter Siedlungsabfälle. Untersuchungen im Einzugsgebiet der KVA Thurgau; Federal Office for the Environment (FOEN): Bern, Switzerland, 2006.
- Züttel, P. (Centravo, Lyss, Switzerland). Personal communication, 2017.
- Hiltbrunner, D. (Federal Office for the Environment, Bern, Switzerland). Personal communication, 2017.
- Mandaliev, P. (Federal Office for the Environment, Bern, Switzerland). Personal communication, 2017.
- Zimmerli, U. (Federal Food Safety and Veterinary Office, Bern, Switzerland). Personal communication, 2017.
- Ifu Hamburg. e!Sankey. 2017. Available online: https://www.ifu.com/e-sankey (accessed on 12 November 2017).
- Schwab, O.; Zoboli, O.; Rechberger, H. A data characterization framework for material flow analysis. J. Ind. Ecol. 2017, 21, 16–25. [Google Scholar] [CrossRef]
- Lamprecht, H. Beitrag von Knochen am Phosphorhaushalt der Schweiz und Phosphorrecycling unter dem Einfluss der BSE-Problematik. Master’s Thesis, ETH Zurich, Zurich, Switzerland, 2004. [Google Scholar]
- Fellner, J.; Aschenbrenner, P.; Cencic, O.; Rechberger, H. Determination of the biogenic and fossil organic matter content of refuse-derived fuels based on elementary analyses. Fuel 2011, 90, 3164–3171. [Google Scholar] [CrossRef]
- Federal Statistical Office (FSO). Landwirtschaftliche Nutzfläche. Ohne Sömmerungsweiden. 2017. Available online: https://www.bfs.admin.ch/bfs/de/home/statistiken/land-forstwirtschaft/landwirtschaft.assetdetail. 2348889.html (accessed on 13 December 2017).
- Braun, M.; Hurni, P.; Spiess, E. Phosphor-und Stickstoffüberschüsse in der Landwirtschaft und Para-Landwirtschaft: Abschätzung für die Schweiz und das Rheineinzugsgebiet der Schweiz Unterhalb der Seen; Eidgenössische Forschungsanstalt für Agrikulturchemie und Umwelthygiene Liebefeld (FAC): Liebefeld-Bern, Switzerland, 1994. [Google Scholar]
- Spiess, E. Nährstoffbilanz der Schweizerischen Landwirtschaft für die Jahre 1975 bis 1995; Eidgenössische Forschungsanstalt für Agrarökologie und Landbau Zürich-Reckenholz (FAL): Zurich-Reckenholz, Switzerland, 1999. [Google Scholar]
- Schweizer Bundesrat. Verordnung Über Wasch-, Spül- und Reinigungsmittel (Waschmittel–Verordnung); Ordinance on (Laundry) Detergents, Washing-up Liquids, and Cleaning Agents; Schweizer Bundesrat: Bern, Switzerland, 1986. [Google Scholar]
- Boller, M. Source control and source separation: The Swiss experience. In Source Separation and Decentralization for Wastewater Management; Larsen, T.A., Udert, K.M., Lienert, J., Eds.; IWA Publishing: London, UK, 2013; pp. 439–446. [Google Scholar]
- Hermann, L. Rückgewinnung von Phosphor aus der Abwasserreinigung. Eine Bestands–Aufnahme; Federal Office for the Environment: Bern, Switzerland, 2009.
- Federal Office for the Environment (FOEN). Dossier: Folgeprobleme des Hohen Tierbestandes: Tiermast Frisst Landschaft; FOEN: Bern, The Switzerland, 2016.
- Schweizer Bundesrat. Verordnung über die Entsorgung von Tierischen Nebenprodukten (VTNP); Ordinance on the Disposal of Animal by-Products; Schweizer Bundesrat: Bern, Switzerland, 2011. [Google Scholar]
- Federal Food Safety and Veterinary Office (FSVO). BSE in der Schweiz: Chronologie und Zusammenfassung der Massnahmen; FSVO: Bern, Switzerland, 2015.
- Schweizer Bundesrat. Tierseuchenverordnung (TSV); Ordinance on animal diseases; Schweizer Bundesrat: Bern, Switzerland, 1995. [Google Scholar]
- Schweizer Bundesrat. Verordnung über die Direktzahlungen an die Landwirtschaft (Direkt–zahlungs–verordnung, DZV); Ordinance on Direct Payments to the Agricultural Sector; Schweizer Bundesrat: Bern, Switzerland, 2013. [Google Scholar]
- Menzi, H.; Spiess, E. Der Phosphoreinsatz in der Schweizer Landwirtschaft ist Effizienter Geworden. Presented at IALB Tagung Effizienz in der Land–und Ernährungswirtschaft, Solothurn, Switzerland, 15 June 2015. [Google Scholar]
- Schweizer Bundesrat. Verordnung zur Reduktion von Risiken beim Umgang mit Bestimmten Besonders Gefährlichen Stoffen, Zubereitungen und Gegenständen (Chemikalien-Risikoreduktions-Verordnung, ChemRRV); Ordinance on Risk Reduction of Chemicals; Schweizer Bundesrat: Bern, The Switzerland, 2018. [Google Scholar]
- IFA (International Fertilizer Association). Ifa Data 2017. Available online: http://ifadata.fertilizer.org/ucSearch.aspx (accessed on 13 December 2017).
© 2018 by the authors. Licensee MDPI, Basel, Switzerland. This article is an open access article distributed under the terms and conditions of the Creative Commons Attribution (CC BY) license (http://creativecommons.org/licenses/by/4.0/).