Accuracy Assessment of Multi-Source Gridded Population Distribution Datasets in China


Abstract
1. Introduction
2. Materials and Methods
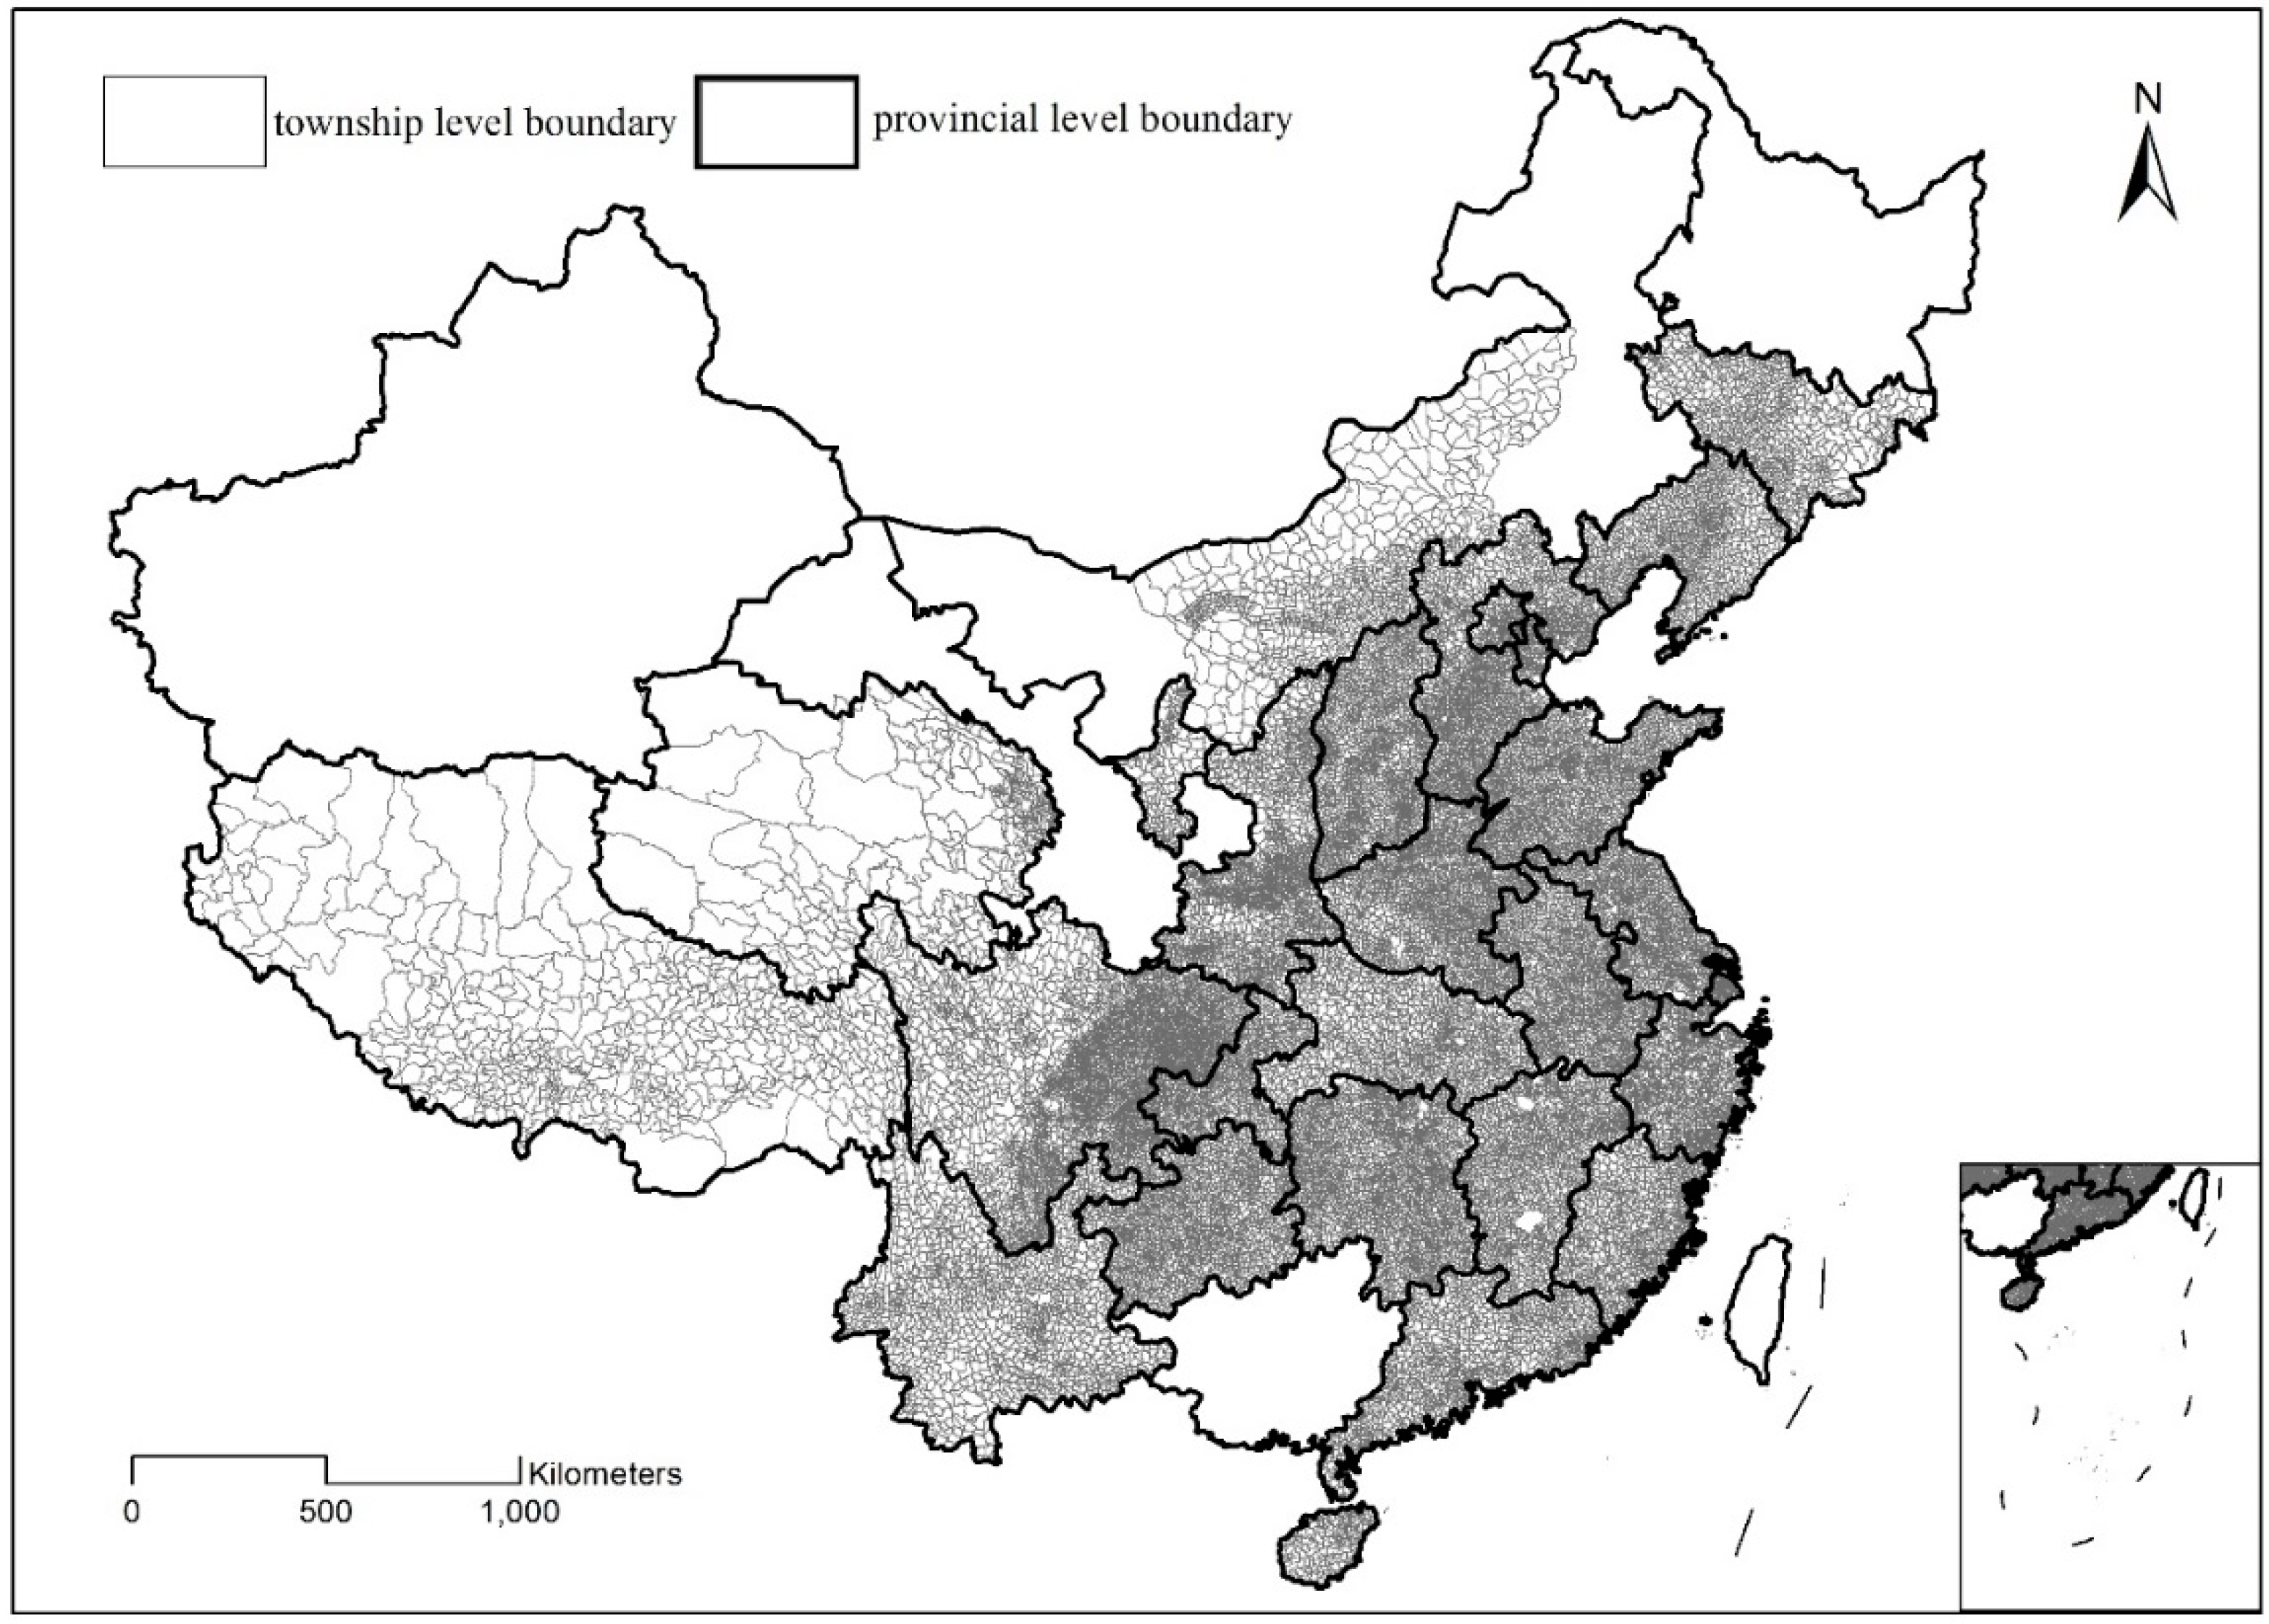
2.1. Vector Boundary and Census Data at the Township Level
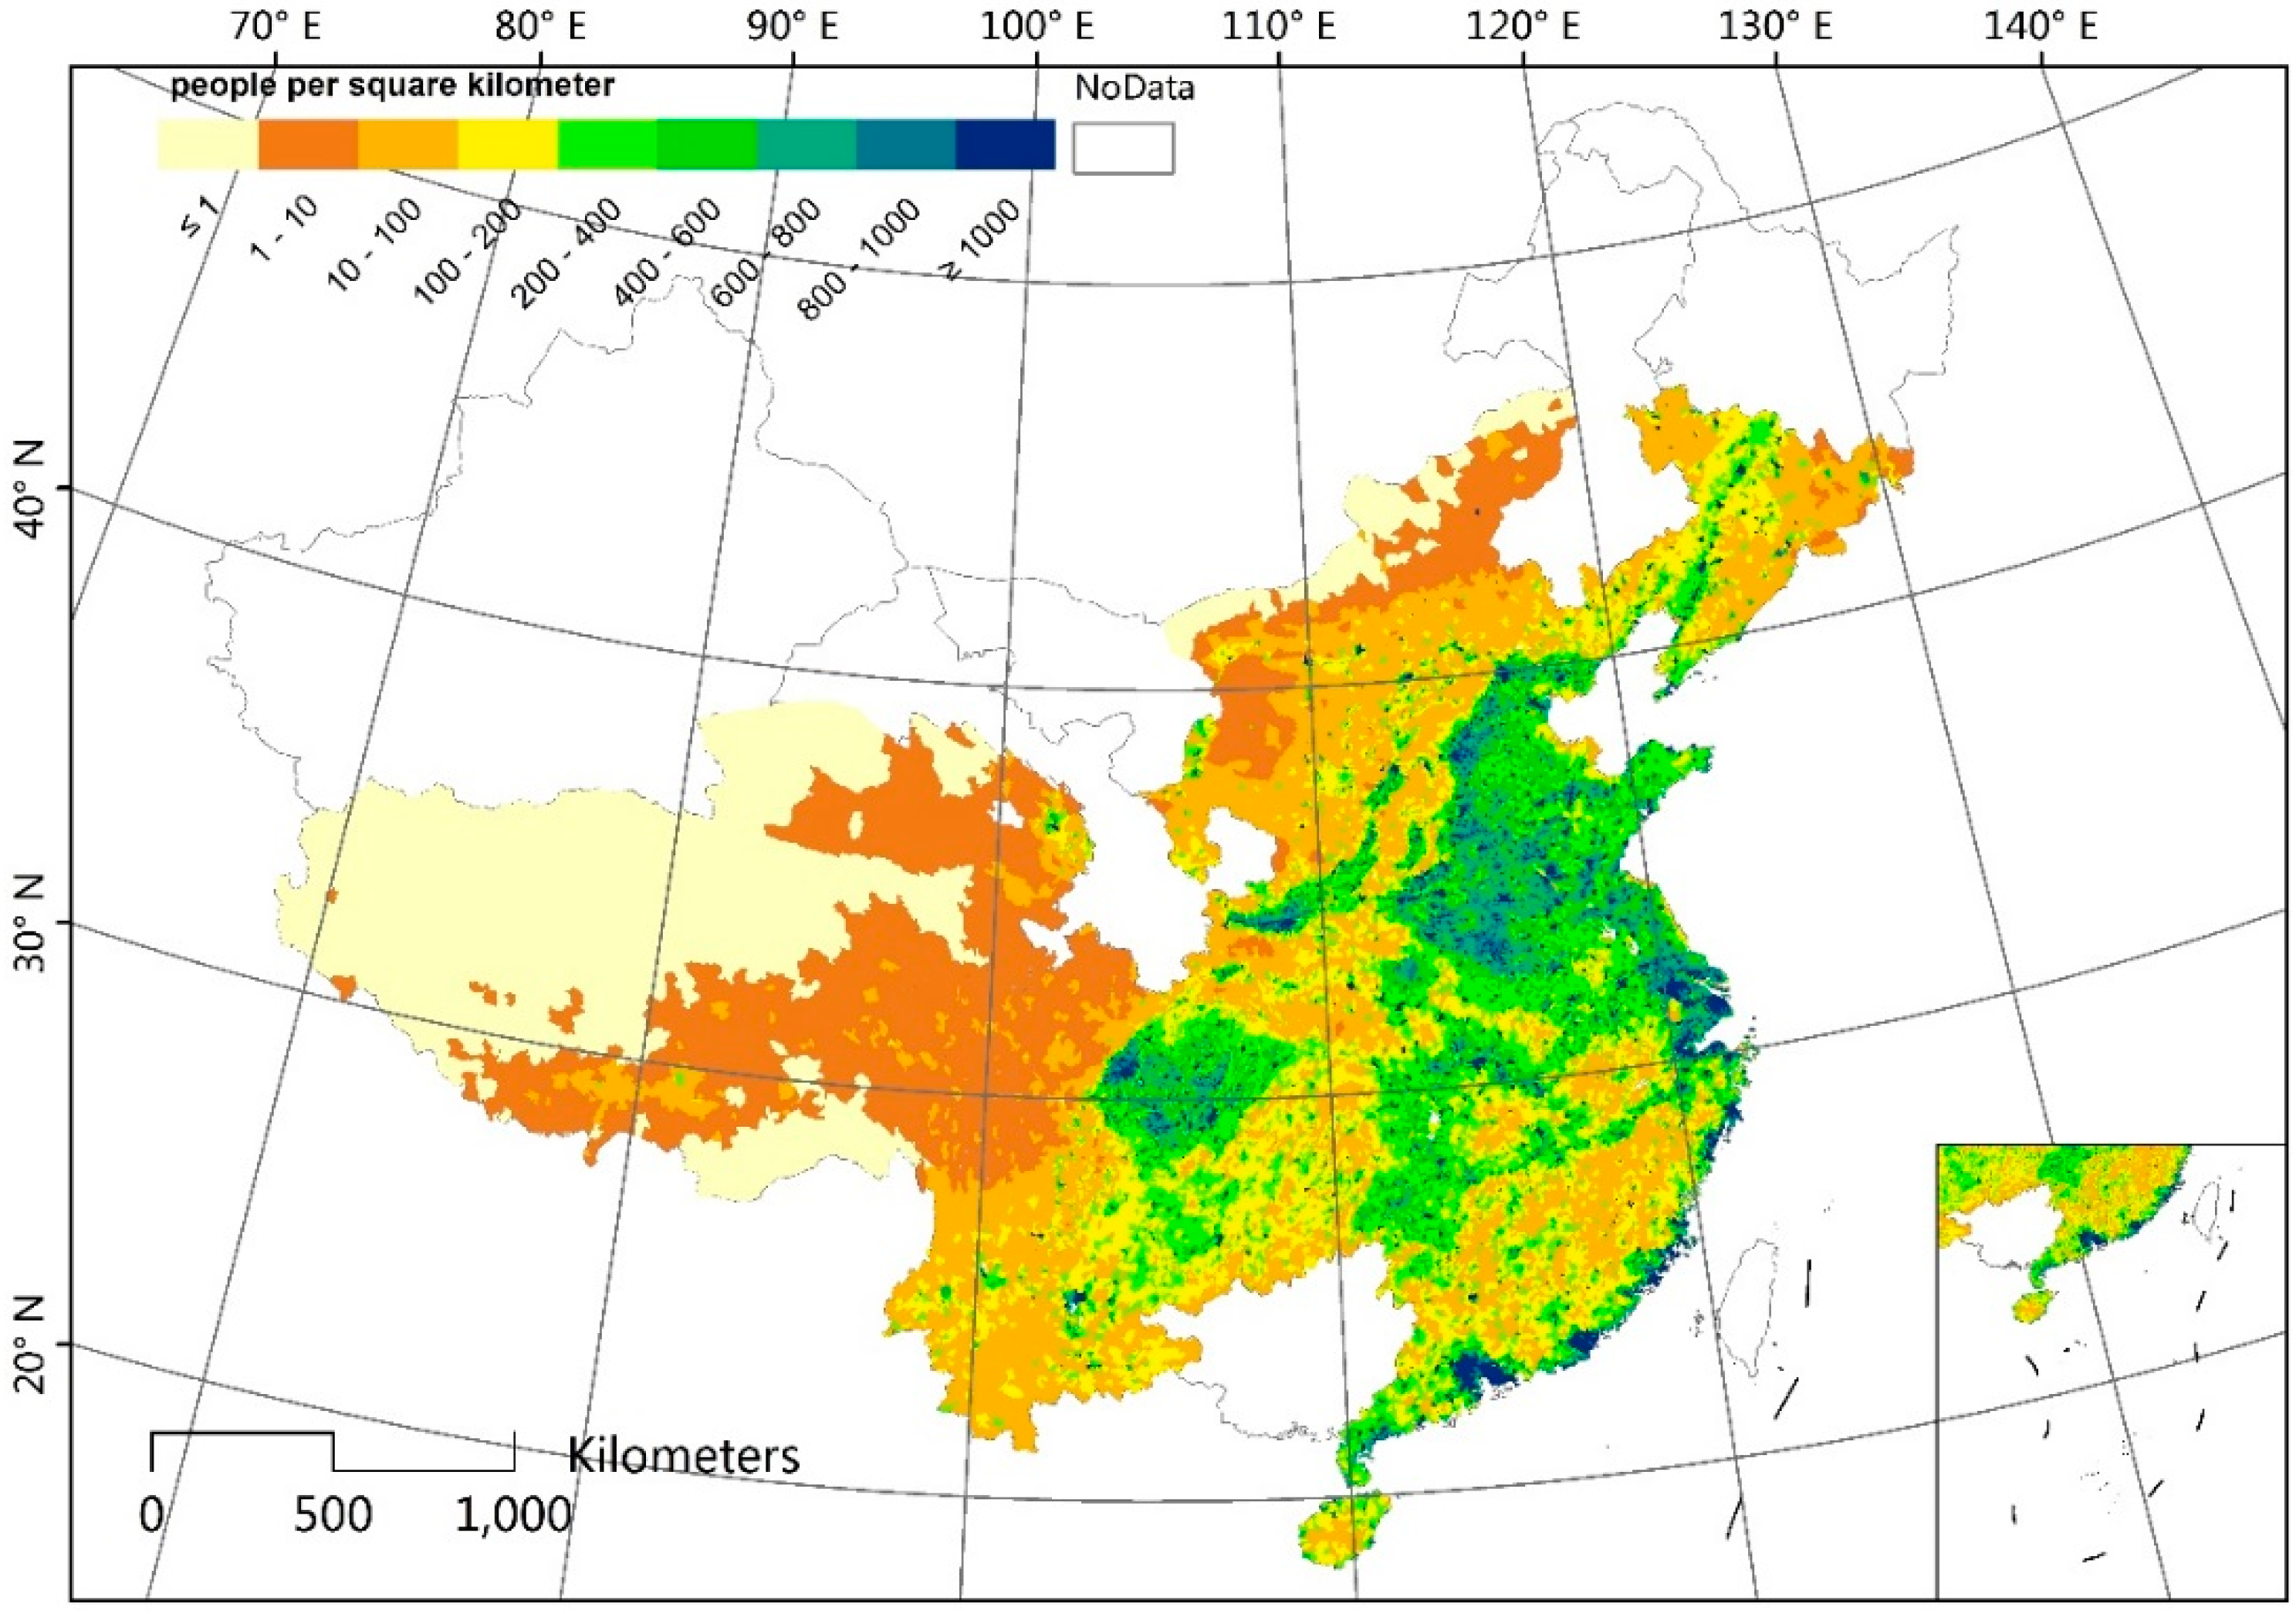
2.2. Gridded Population Distribution Datasets and Pretreatment
2.3. Accuracy Assessment Method
3. Results
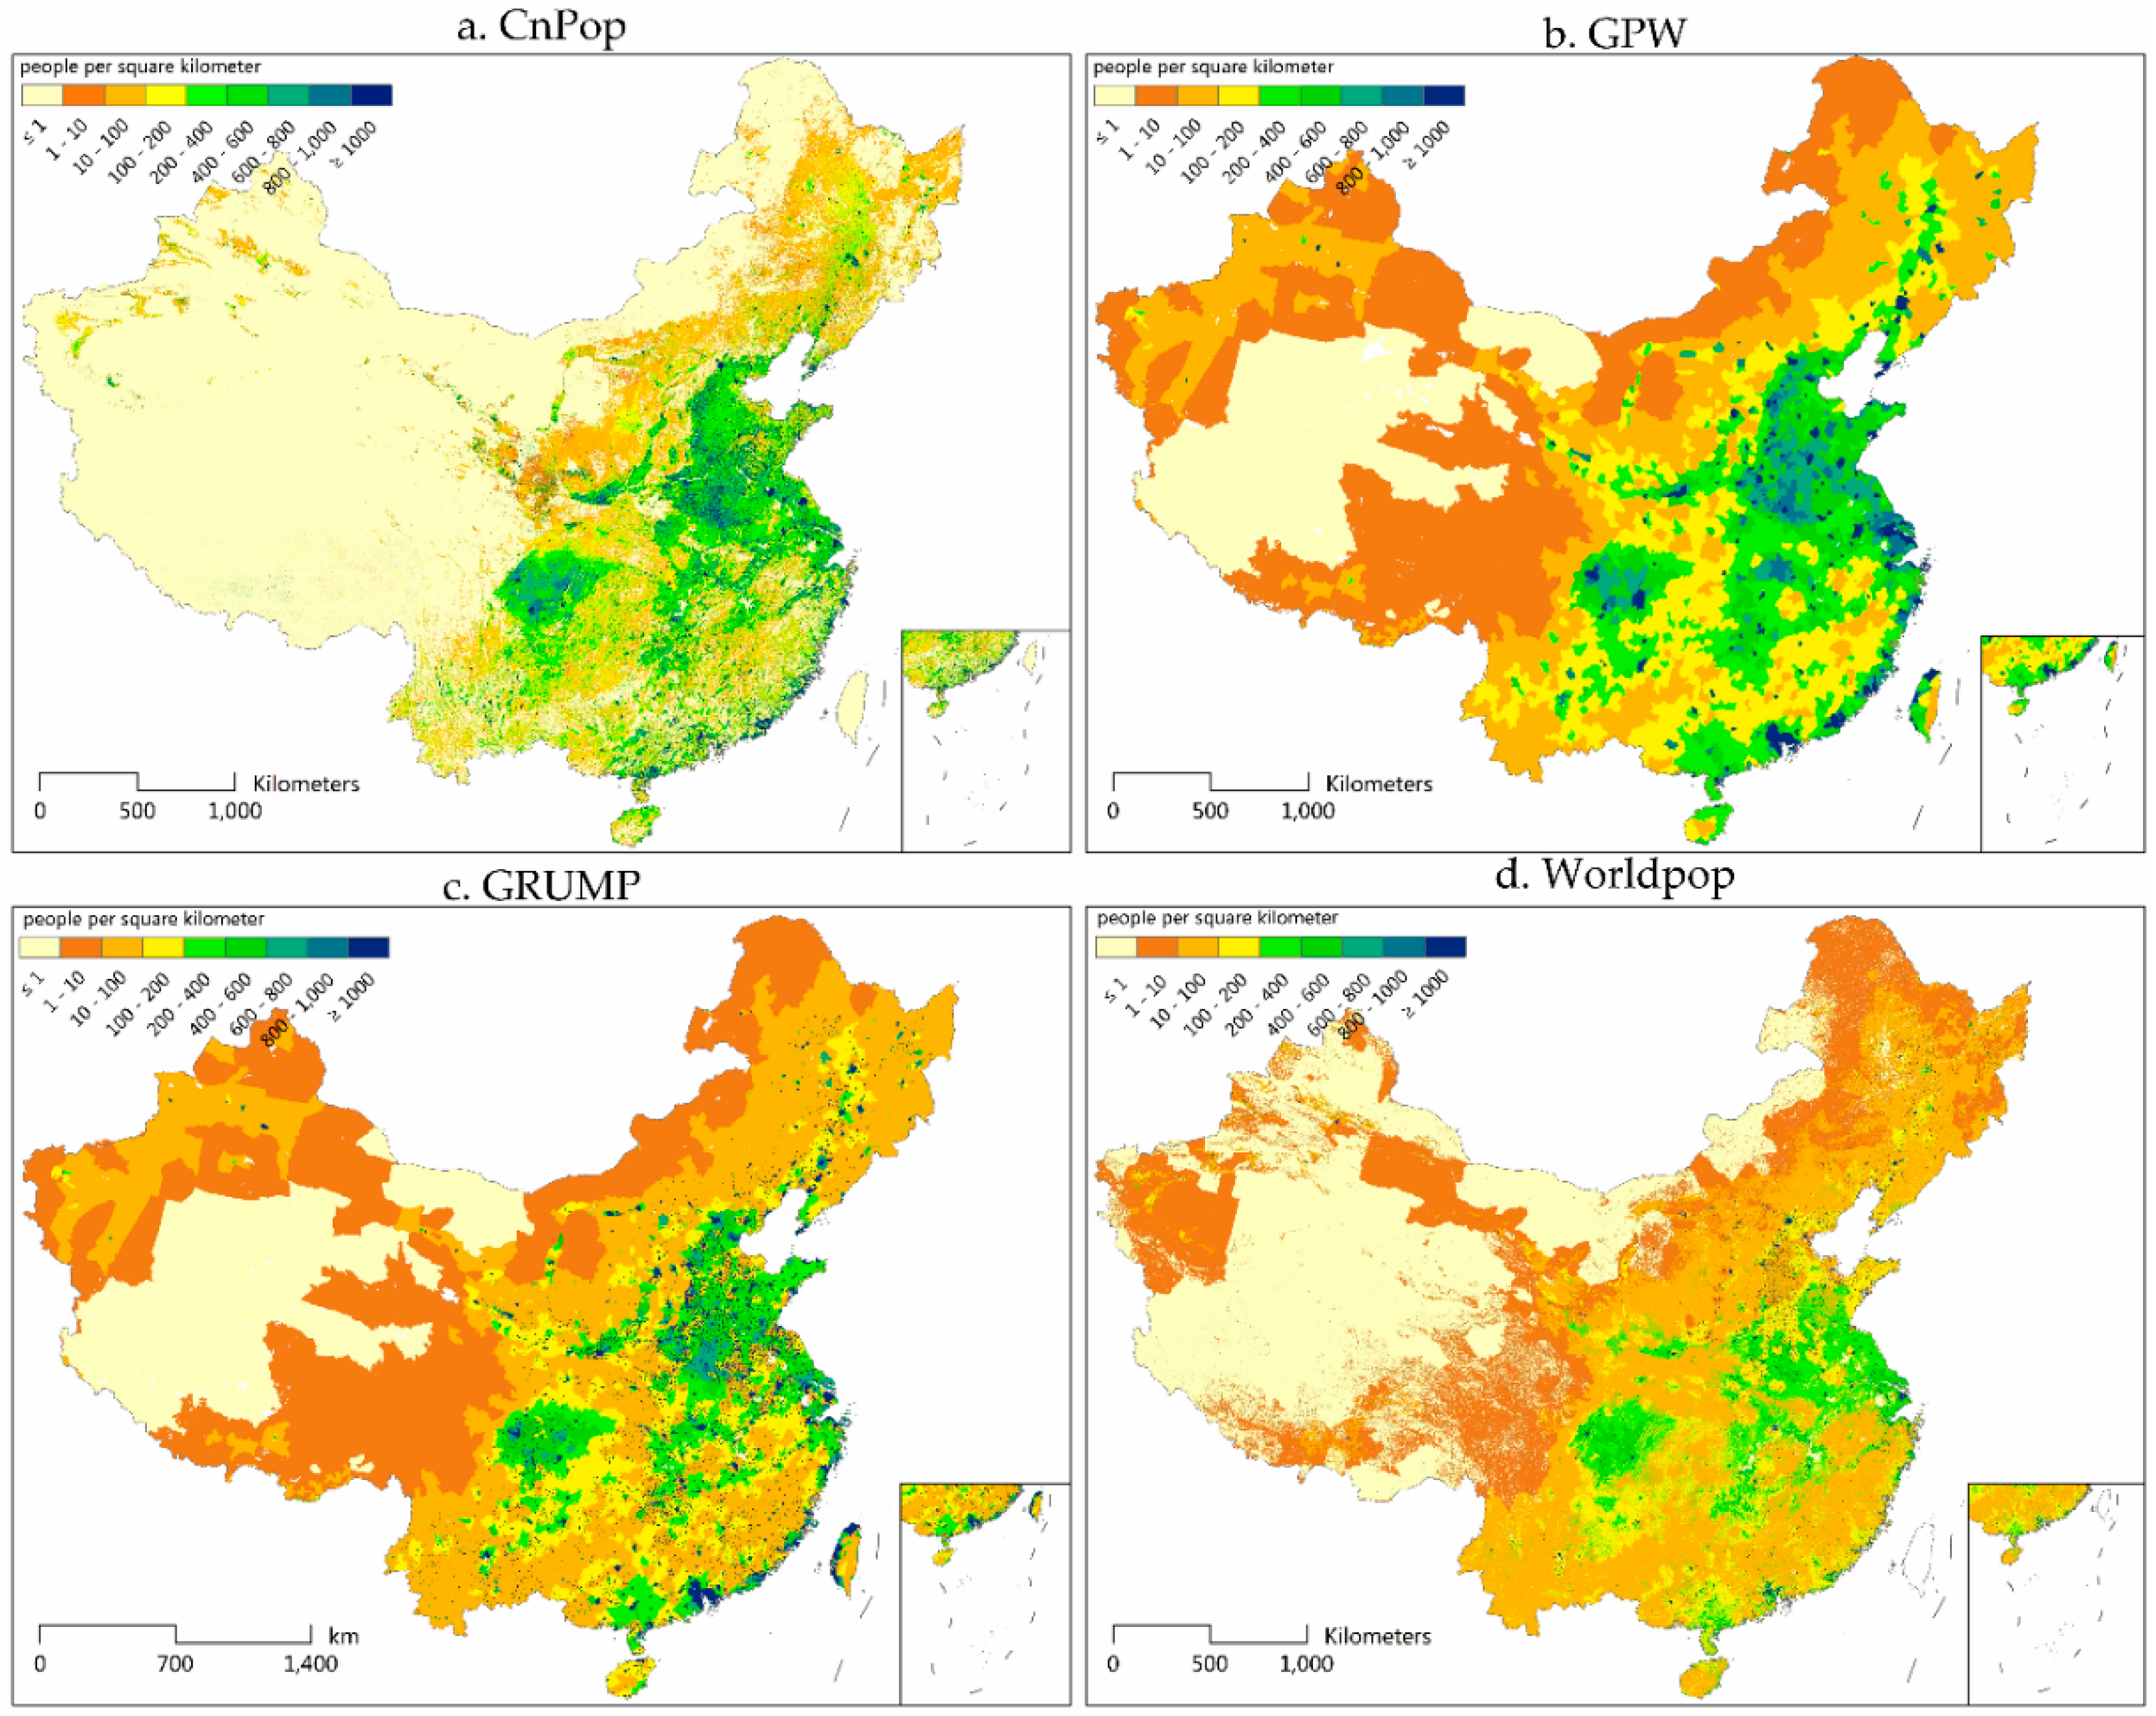
3.1. Visual Inspection of Mapping Performance
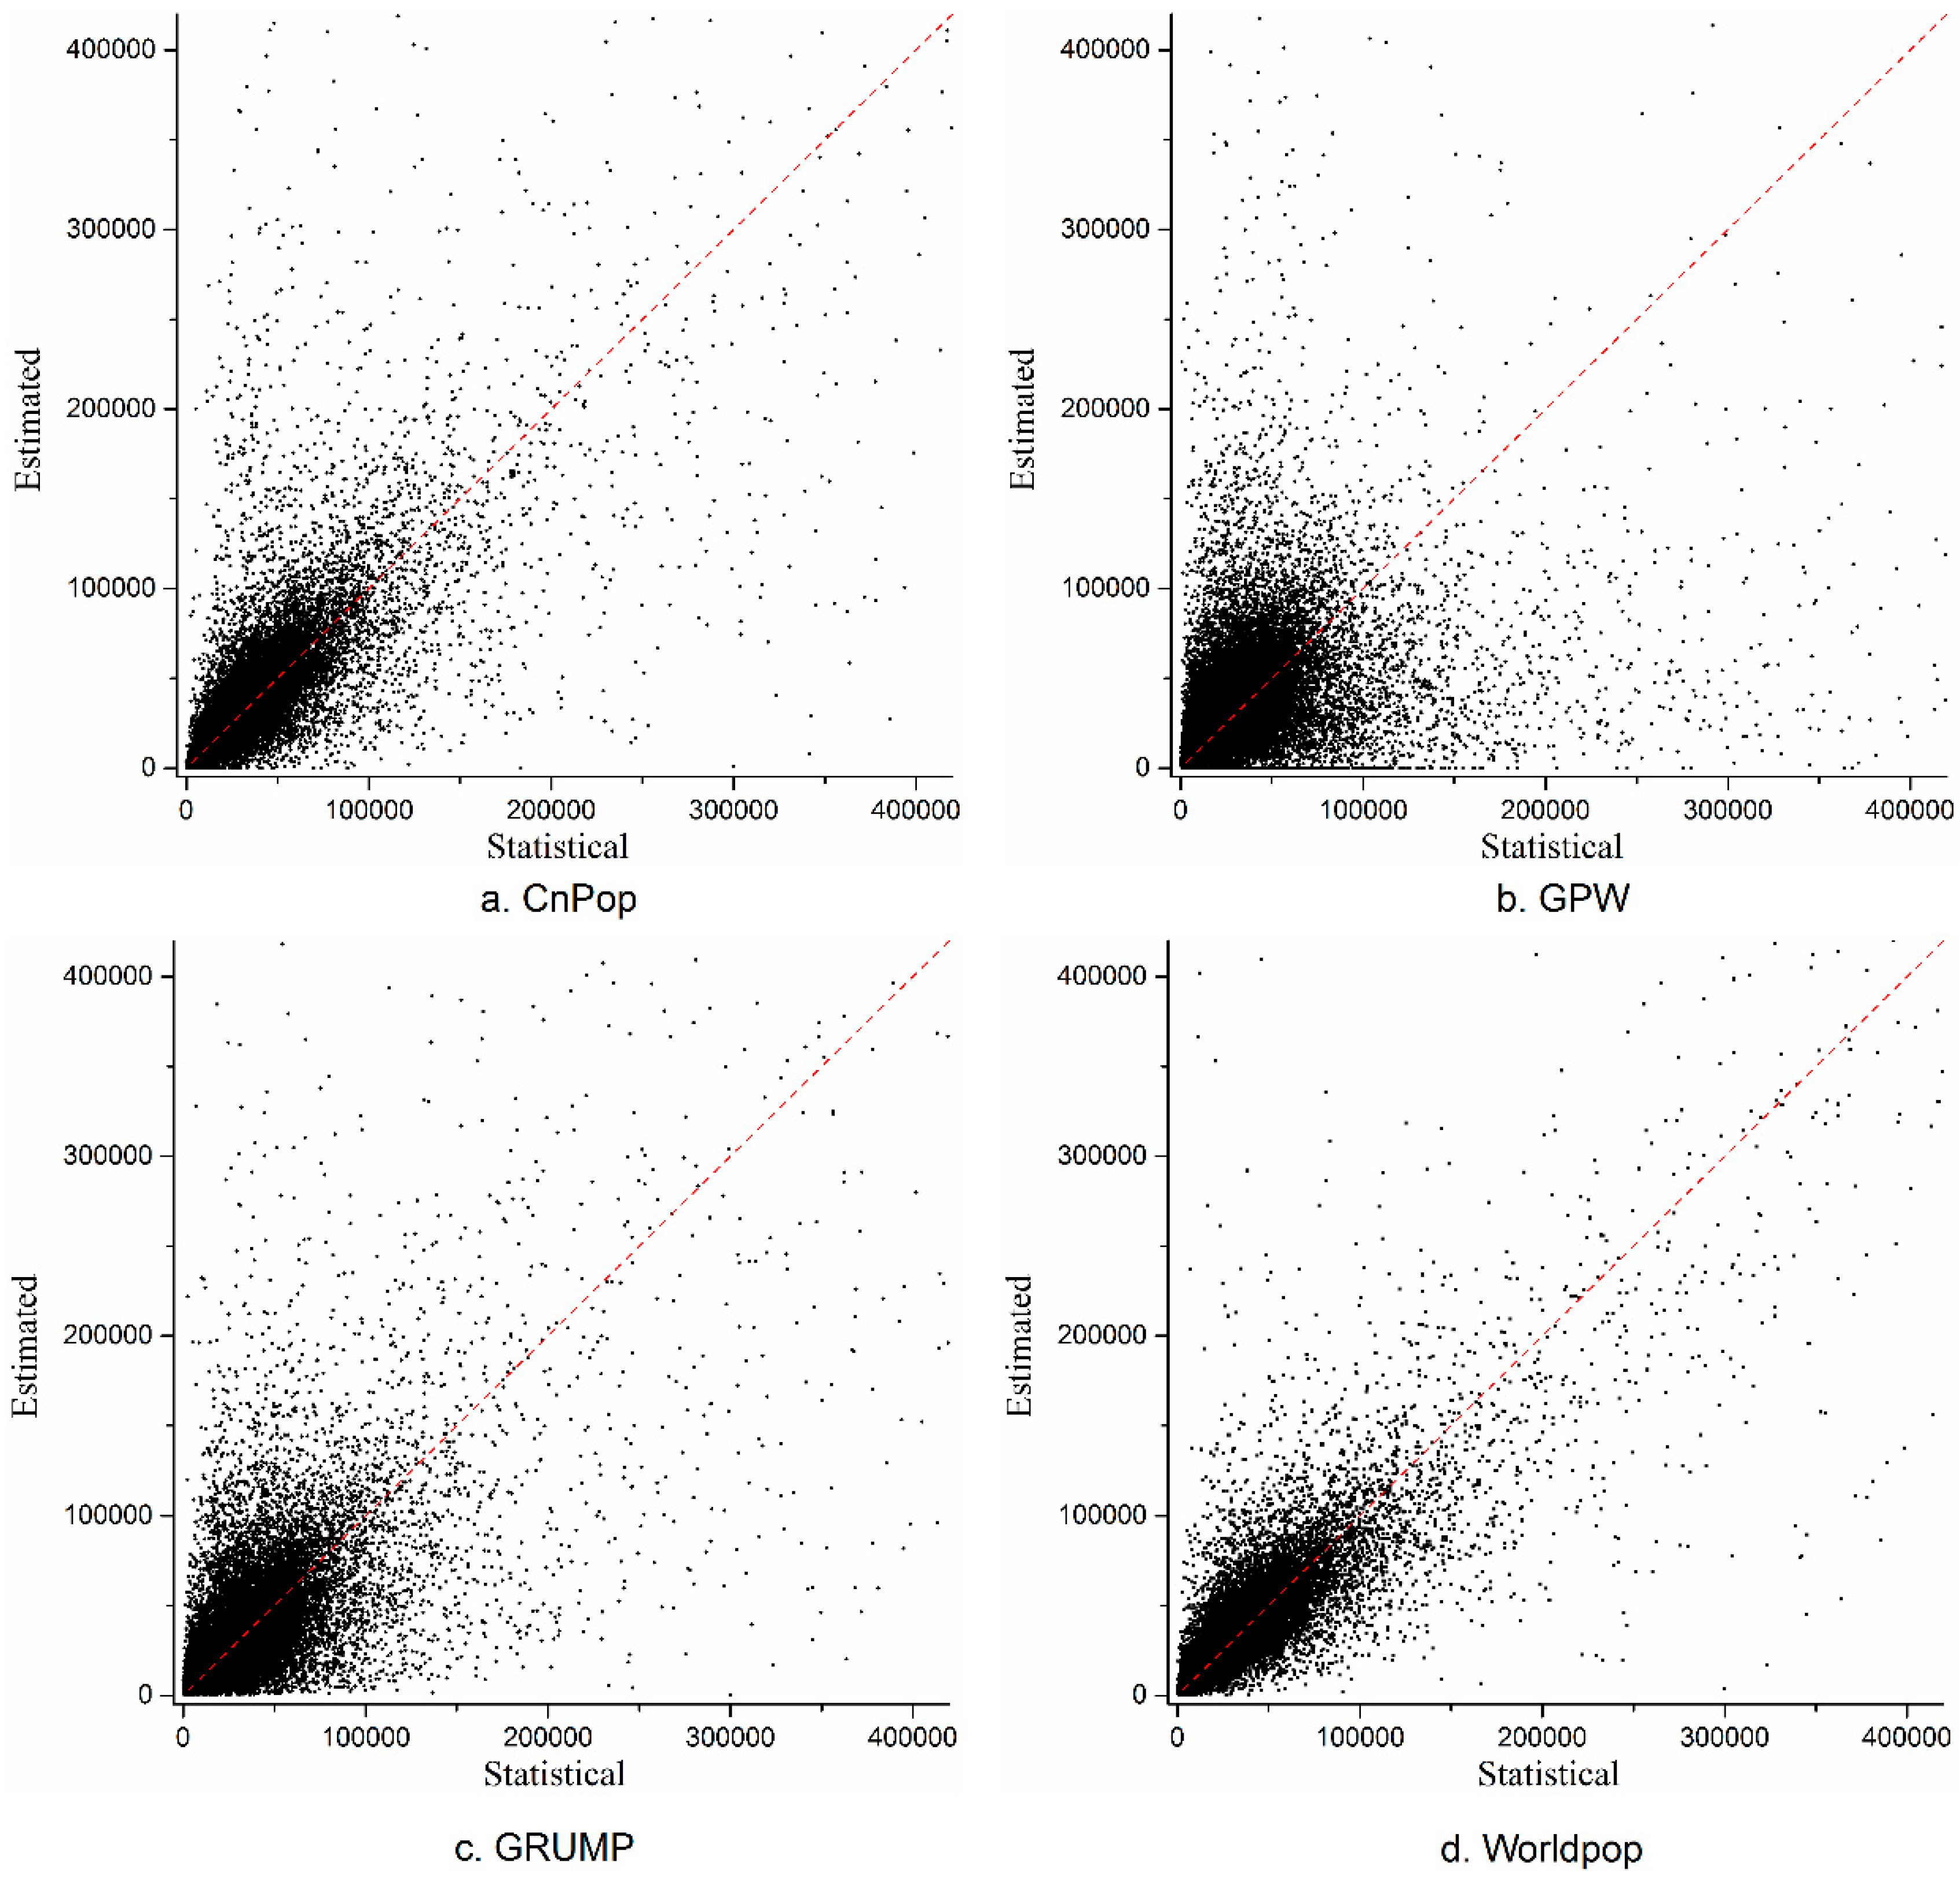
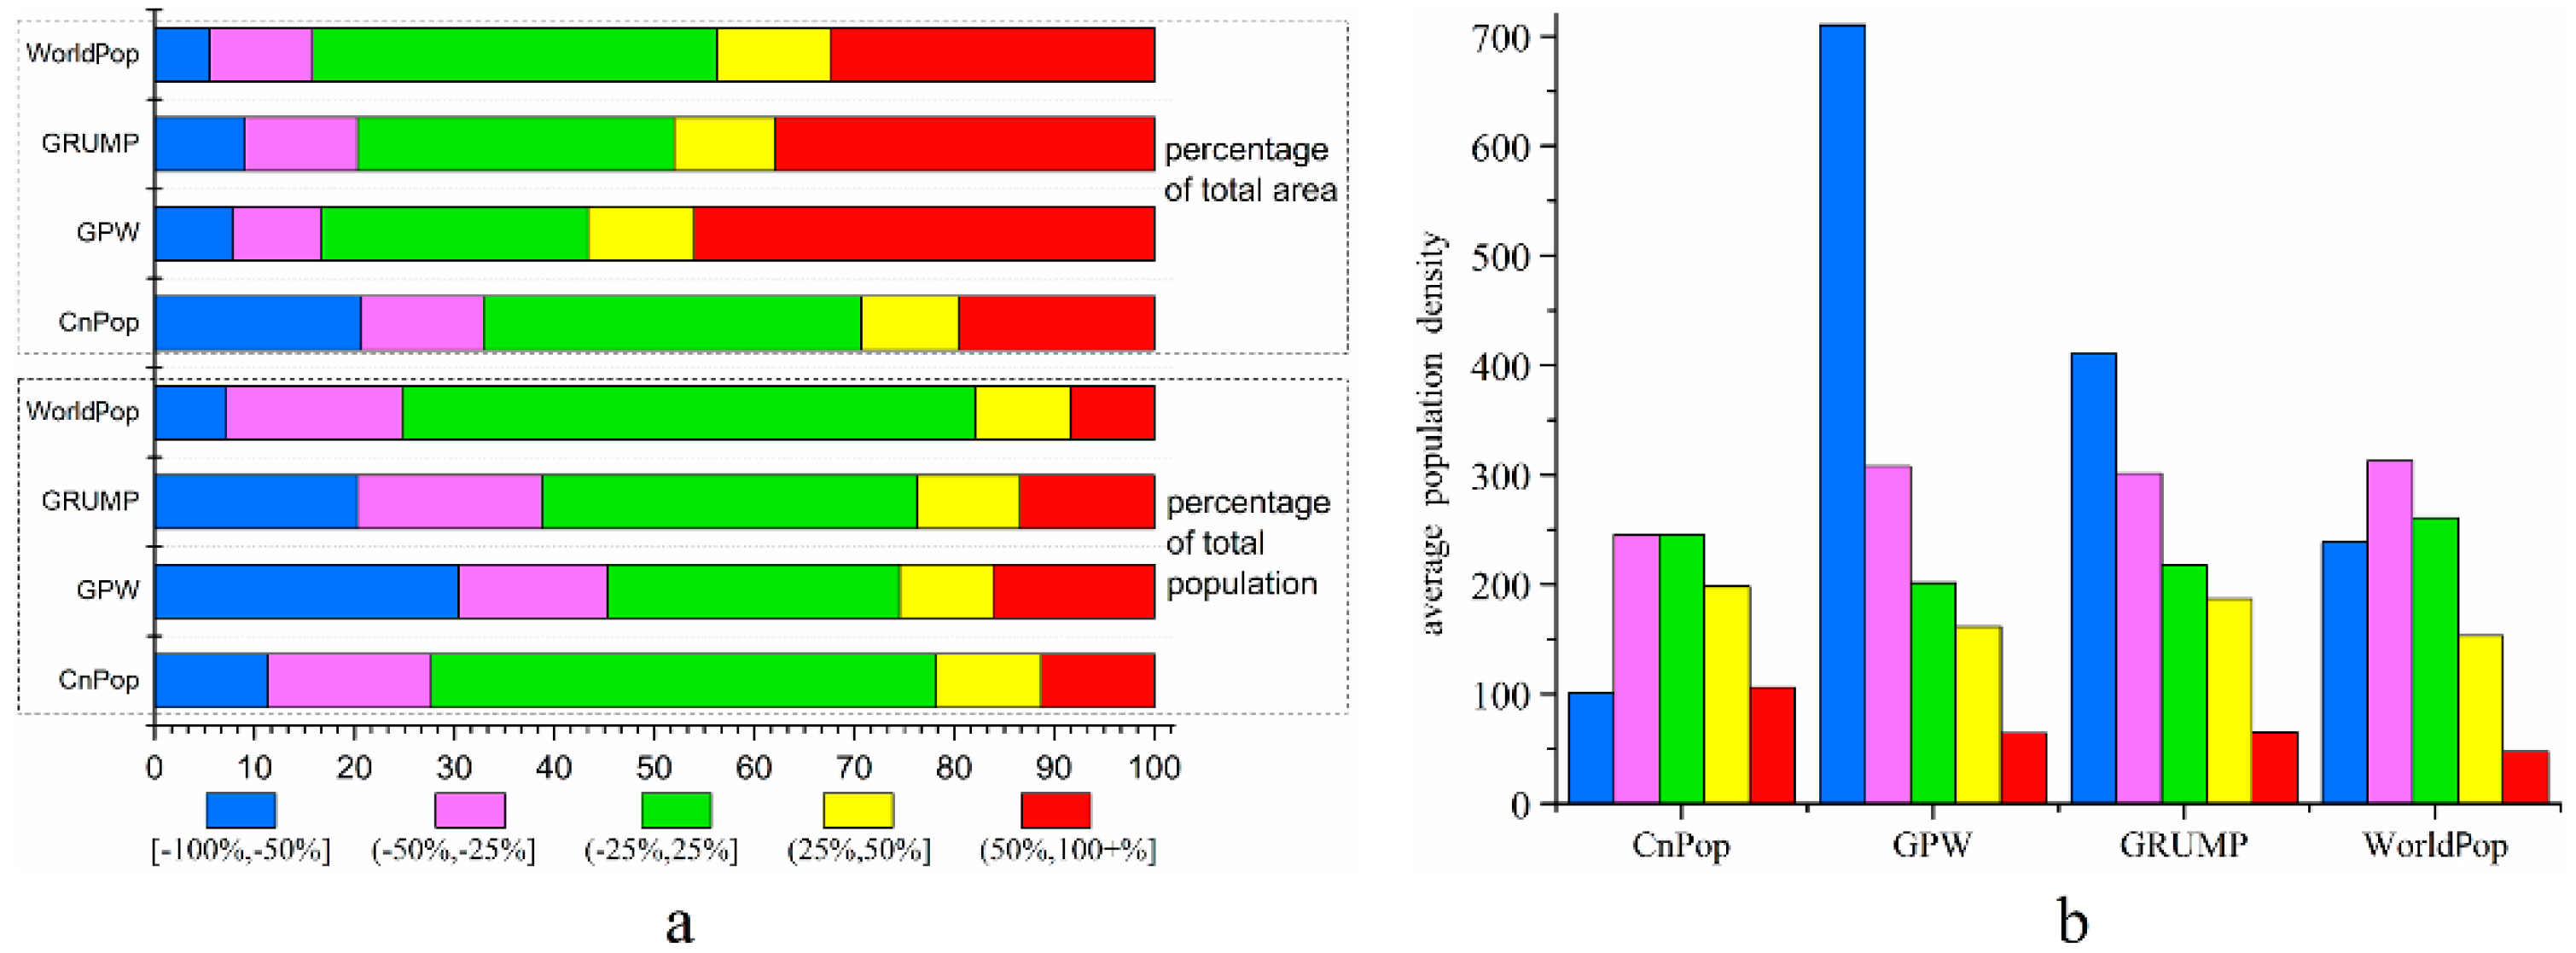
3.2. Statistical Analysis
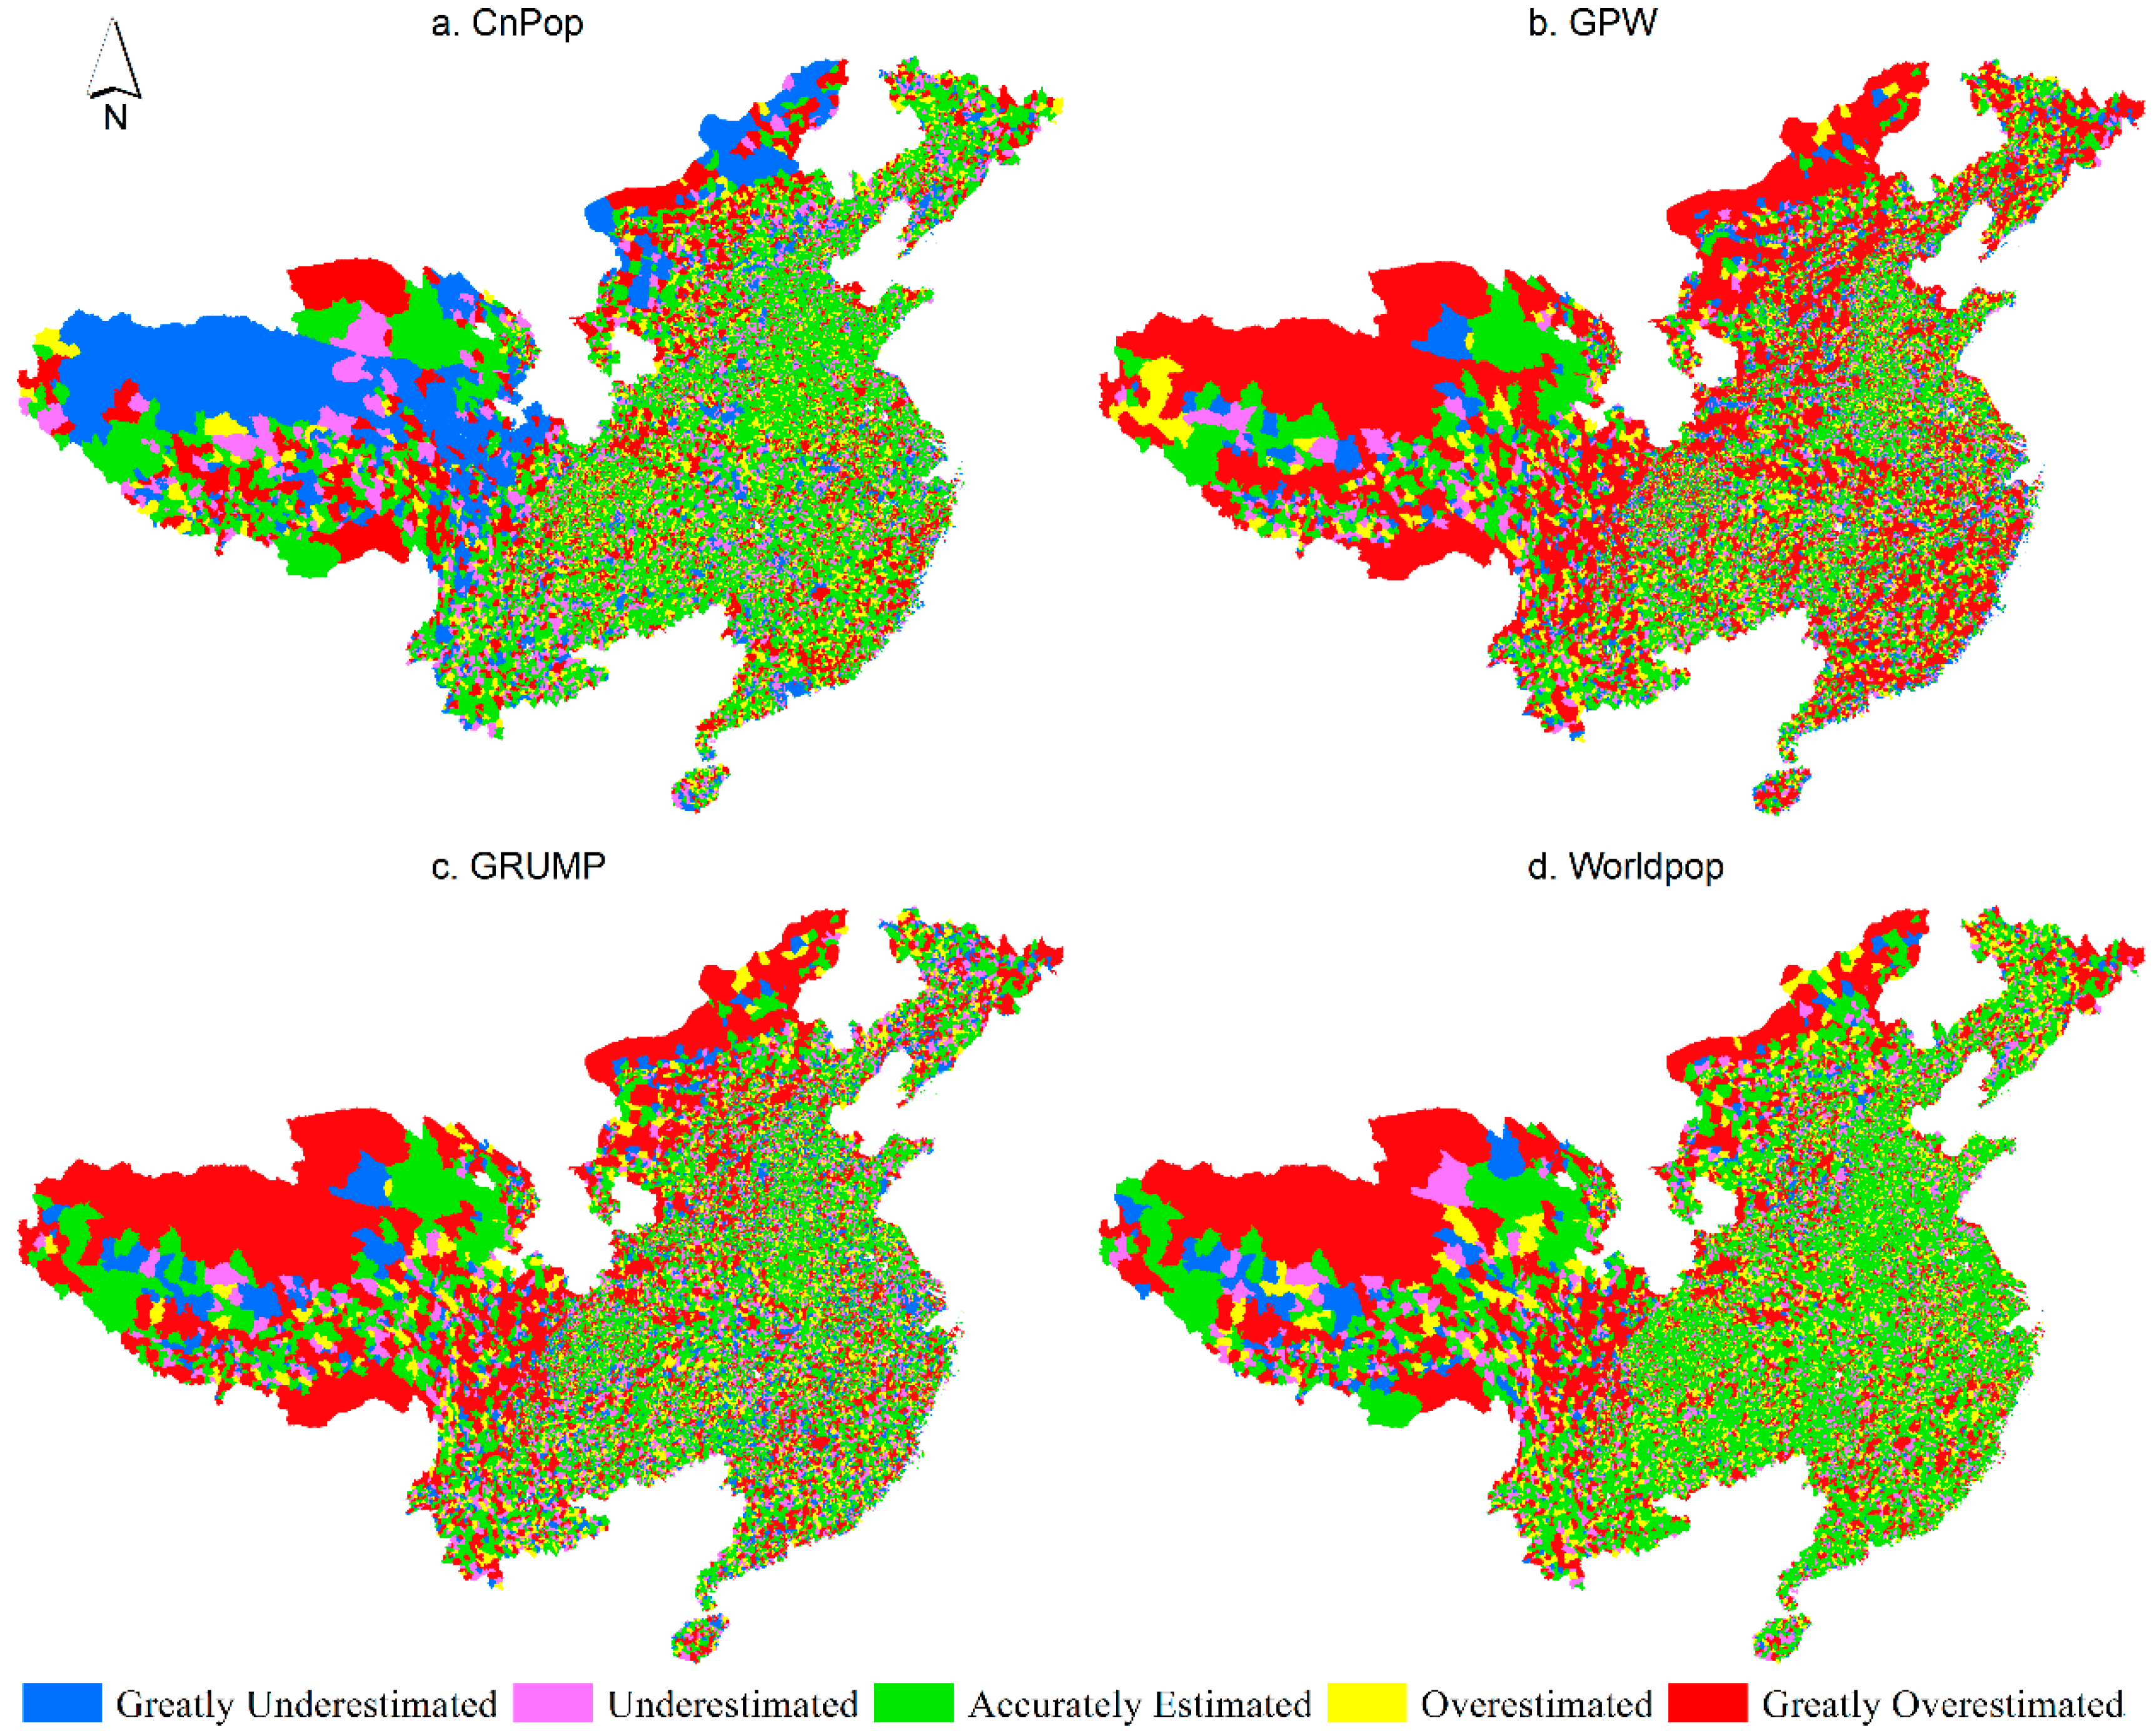
3.3. Mapping and Analysis of Relative Estimation Error
4. Discussion
5. Conclusions
Author Contributions
Funding
Acknowledgments
Conflicts of Interest
References
- Lee, R. The outlook for population growth. Science 1946, 333, 1–3. [Google Scholar] [CrossRef] [PubMed]
- United Nations, Department of Economic and Social Affairs, Population Division. World Population Prospects: The 2017 Revision, Key Findings and Advance Tables. ESA/P/WP/248. 2017. Available online: https://esa.un.org/unpd/wpp/Publications/Files/WPP2017_KeyFindings.pdf (accessed on 28 January 2018).
- Hay, S.I.; Guerra, C.A.; Gething, P.W.; Patil, A.P.; Tatem, A.J.; Noor, A.M.; Kabaria, C.W.; Manh, B.H.; Elyazar, I.R.; Brooker, S.; et al. A world malaria map: Plasmodium falciparum endemicity in 2007. PLoS Med. 2009, 6, e1000048. [Google Scholar] [CrossRef]
- Fang, J.; Sun, S.; Shi, P.; Wang, J. Assessment and Mapping of Potential Storm Surge Impacts on Global Population and Economy. Int. J. Disaster Risk Sci. 2014, 5, 323–331. [Google Scholar] [CrossRef]
- Chen, M.; Li, Y.; Gong, Y.; Lu, D.; Zhang, H. The population distribution and trend of urbanization pattern on two sides of Hu Huanyong population line: A tentative response to Premier Li Keqiang. Acta Geogr. Sin. 2016, 71, 179–193. [Google Scholar] [CrossRef]
- Wu, X.; Yang, J.; Zhang, H. Analyzing Spatial Autocorrelation of Population Distribution in Different Spatial Weights: A Case of China. Geomat. World 2017, 24, 32–38. [Google Scholar]
- Briggs, D.J.; Gulliver, J.; Fecht, D.; Vienneau, D.M. Dasymetric modelling of small-area population distribution using land cover and light emissions data. Remote Sens. Environ. 2007, 108, 451–466. [Google Scholar] [CrossRef]
- Zeng, C.; Zhou, Y.; Wang, S.; Yan, F.; Zhao, Q. Population spatialization in China based on night-time imagery and land use data. Int. J. Remote Sens. 2011, 32, 9599–9620. [Google Scholar] [CrossRef]
- Patel, N.N.; Stevens, F.R.; Huang, Z.; Gaughan, A.E.; Elyazar, I.; Tatem, A.J. Improving Large Area Population Mapping Using Geotweet Densities. Trans GIS 2017, 21, 317–331. [Google Scholar] [CrossRef] [PubMed]
- Deichmann, U.; Balk, D.; Yetman, G. Transforming Population Data for Interdisciplinary Usages: From Census to Grid. In Population Health Metrics-Popul Health Metrics; Center for International Earth Science Information Network: Washington, DC, USA, 2001. [Google Scholar]
- Balk, D.L.; Deichmann, U.; Yetman, G.; Pozzi, F.; Hay, S.I.; Nelson, A. Determining global population distribution: Methods, applications and data. Adv. Parasitol. 2006, 62, 119–156. [Google Scholar] [CrossRef] [PubMed]
- Dobson, J.E.; Bright, E.A.; Coleman, P.R.; Durfee, R.C.; Worley, B.A. LandScan: A Global Population Database for Estimating Populations at Risk. Photogramm. Eng. Remote Sens. 2000, 66, 849–857. [Google Scholar]
- Nelson, A. African Population Database Documentation. Available online: https://na.unep.net/siouxfalls/globalpop/africa/Africa_index.html (accessed on 28 January 2018).
- Deichmann, U. A Review of Spatial Population Database Design and Modeling. In Gis Proceedings of ACM International Symposium on Advances in Geographic Information Systems; National Center for Geographic Information and Analysis (NCGIA), University of California: Santa Barbara, CA, USA, 1996; pp. 47–52. [Google Scholar]
- Linard, C.; Alegana, V.A.; Noor, A.M.; Snow, R.W.; Tatem, A.J. A high resolution spatial population database of Somalia for disease risk mapping. Int. J. Health Geogr. 2010, 9, 45. [Google Scholar] [CrossRef] [PubMed]
- Linard, C.; Tatem, A.J. Large-scale spatial population databases in infectious disease research. Int. J. Health Geogr. 2012, 11, 7. [Google Scholar] [CrossRef] [PubMed]
- Stevens, F.R.; Gaughan, A.E.; Linard, C.; Tatem, A.J. Disaggregating Census Data for Population Mapping Using Random Forests with Remotely-Sensed and Ancillary Data. PLoS ONE 2015, 10, e0107042. [Google Scholar] [CrossRef] [PubMed]
- Jiang, D.; Yang, X.; Wang, N.; Liu, H. Study on spatial distribution of population based on remote sensing and GIS. Adv. Earth Sci. 2002, 17, 734–738. [Google Scholar]
- Zhuo, L.; Ichinose, T.; Zheng, J.; Chen, J.; Shi, P.J.; Li, X. Modelling the population density of China at the pixel level based on DMSP/OLS non-radiance-calibrated night-time light images. Int. J. Remote Sens. 2009, 30, 1003–1018. [Google Scholar] [CrossRef]
- Bhaduri, B.; Bright, E.; Coleman, P.; Dobson, J. LandScan: Locating people is what matters. Geoinfomatics 2002, 5, 34–37. [Google Scholar]
- Hay, S.I.; Noor, A.M.; Nelson, A.; Tatem, A.J. The accuracy of human population maps for public health application. Trop. Med. Int. Health 2005, 10, 1073–1086. [Google Scholar] [CrossRef] [PubMed]
- Ferguson, N.M.; Cummings, D.; Cauchemez, S.; Fraser, C.; Riley, S.; Meeyai, A.; Iamsirithaworn, S.; Burke, D. Strategies for containing an emerging influenza pandemic in Southeast Asia. Nature 2005, 437, 209–214. [Google Scholar] [CrossRef] [PubMed]
- Guerra, C.A.; Snow, R.W.; Hay, S.I. Defining the Global Spatial Limits of Malaria Transmission in 2005. Adv. Parasitol. 2006, 62, 157–179. [Google Scholar] [CrossRef] [PubMed]
- Rogers, D.J.; Wilson, A.J.; Hay, S.I.; Graham, A.J. The Global Distribution of Yellow Fever and Dengue. Adv. Parasitol. 2006, 62, 181–220. [Google Scholar] [CrossRef] [PubMed]
- Rao, D.M.; Chernyakhovsky, A.; Rao, V. Modeling and analysis of global epidemiology of avian influenza. Environ. Model. Softw. 2009, 24, 124–134. [Google Scholar] [CrossRef]
- Storeygard, A.; Balk, D.; Levy, M.; Deane, G. The Global Distribution of Infant Mortality: A subnational spatial view. Popul. Space Place 2008, 14, 209–229. [Google Scholar] [CrossRef] [PubMed]
- Balk, D.; Storeygard, A.; Levy, M.; Gaskell, J.; Sharma, M.; Flor, R. Child hunger in the developing world: An analysis of environmental and social correlates. Food Policy 2005, 30, 584–611. [Google Scholar] [CrossRef]
- Mcgranahan, G.; Balk, D.; Anderson, B. The rising tide: Assessing the risks of climate change and human settlements in low elevation coastal zones. Environ. Urban. 2007, 19, 17–37. [Google Scholar] [CrossRef]
- Mondal, P.; Tatem, A.J. Uncertainties in Measuring Populations Potentially Impacted by Sea Level Rise and Coastal Flooding. PLoS ONE 2012, 7, e48191. [Google Scholar] [CrossRef] [PubMed]
- Hall, O.; Stroh, E.; Paya, F. From Census to Grids: Comparing Gridded Population of the World with Swedish Census Records. Open Geogr. J. 2012, 5, 1–5. [Google Scholar] [CrossRef]
- Tatem, A.J.; Campiz, N.; Gething, P.W.; Snow, R.W.; Linard, G. The effects of spatial population dataset choice on estimates of population at risk of disease. Popul. Health Metr. 2011, 9, 4. [Google Scholar] [CrossRef] [PubMed]
- Wang, X.; Li, X.; Ma, M. Advance and Case Analysis in Population Spatial Distribution Based on Remote Sensing and GIS. Remote Sens. Technol. Appl. 2004, 19, 320–327. [Google Scholar]
- Gaughan, A.E.; Stevens, F.R.; Linard, C.; Jia, P.; Tatem, A.J. High Resolution Population Distribution Maps for Southeast Asia in 2010 and 2015. PLoS ONE 2013, 8, e55882. [Google Scholar] [CrossRef] [PubMed]
- Tatem, A.J.; Noor, A.M.; von Hagen, C.; Gregorio, A.D.; Hay, S.I. High resolution population maps for low income nations: Combining land cover and census in East Africa. PLoS ONE 2007, 2, e1298. [Google Scholar] [CrossRef] [PubMed]
- Long, H.; Li, Y.; Liu, Y.; Woods, M.; Zou, J. Accelerated restructuring in rural China fueled by ‘increasing vs. decreasing balance’ land-use policy for dealing with hollowed villages. Land Use Policy 2012, 29, 11–22. [Google Scholar] [CrossRef]
- Dong, C.; Liu, J.; Zhao, R.; Wang, G. An discussion on correlation of geographical parameter with spatial population distribution. Remote Sens. Inf. 2002, 4, 61–64. [Google Scholar]
- Liao, S.; Sun, J. GIS based spatialization of population census data in Qinghai-Tibet Plateau. Acta Geogr. Sin. 2003, 58, 25–33. [Google Scholar]
- Wang, G.; Bai, W.; Li, N.; Hu, H. Climate changes and its impact on tundra ecosystem in Qinghai-Tibet Plateau, China. Clim. Chang. 2011, 106, 463–482. [Google Scholar] [CrossRef]
- Jiao, J.; Zhang, Z.; Bai, W.; Jia, Y.; Wang, N. Assessing the Ecological Success of Restoration by Afforestation on the Chinese Loess Plateau. Restor. Ecol. 2012, 20, 240–249. [Google Scholar] [CrossRef]
- Xing-Yuan, M.; Xian-Guo, G.; Wen-Ge, D.; Ai-Qin, N.; Ti-Jun, Q.; Dian, W. Ectoparasites of Chevrier’s field mouse, Apodemus chevrieri, in a focus of plague in southwest China. Med. Vet. Entomol. 2010, 21, 297–300. [Google Scholar] [CrossRef]
- Wang, L.; Zhang, W.; Ding, F.; Sun, H.; Yu, S.; Li, S.; Chen, Z.; Huang, L.; Li, C. Deaths associated with Japanese encephalitis, China, 2005–2010. Clin. Infect. Dis. 2013, 56, 752–752. [Google Scholar] [CrossRef] [PubMed]
- Bai, Z.; Wang, J.; Yang, Y.; Sun, J. Characterizing spatial patterns of population distribution at township level across the 25 provinces in China. Acta Geogr. Sin. 2015, 70, 1229–1242. [Google Scholar] [CrossRef]


| Dataset | CnPop | GPWv3 | GRUMPv1 | WorldPop vα |
|---|---|---|---|---|
| Publication year | 2002 | 2005 | 2011 | 2013 |
| Years of estimation | 2000 | 1990, 1995, 2000 | 1990, 1995, 2000 | 2000, 2010 |
| Number of input units in China | 2869 | 2370 | 2370 | Unknown |
| Chinese population in 2000 | 1,265,830,000 | 1,275,130,000 | 1,275,130,000 | 1,269,975,000 |
| Demographic data source | China 5th Census | United Nations | United Nations | National Bureau of Statistics, China |
| Time of survey | 1 November 2000 | 1 July 2000 | 1 July 2000 | 1 July 2000 |
| Modeled inputs | Land use | None | Urban areas | Land cover, settlement |
| Spatial extent | Chinese mainland | Global | Global | Asia |
| Authors | RESDC, CAS, China | CIESIN & CIAT | CIESIN & IFPRI & World Bank & CIAT | Andrea E. Gaughan et al. |
| Gridded surface resolutions | 1 km | 2.5′ (~5 km) | 30″ (~1 km) | 3″ (~100 m) |
| Value Range | Category | Abbreviation |
|---|---|---|
| [−100%, −50%] | greatly underestimated | GU |
| (−50%, −25%] | underestimated | U |
| (−25%, 25%] | accurately estimated | AE |
| (25%, 50%] | overestimated | O |
| (50%, 100+%] | greatly overestimated | GO |
| RMSE | MAE | MAPE (%) | R | |
|---|---|---|---|---|
| CnPop | 37,990.16 | 12,264.92 | 42.77 | 0.772 |
| GPW | 61,606.62 | 19,925.40 | 85.93 | 0.499 |
| GRUMP | 41,447.49 | 15,402.66 | 60.96 | 0.740 |
| WorldPop | 24,262.21 | 9853.00 | 42.44 | 0.906 |
| REE Value Range | [−100%, −50%] | (−50%, −25%] | (−25%, 25%] | (25%, 50%] | (50%, 100+%] | |
|---|---|---|---|---|---|---|
| CnPop | Total population (people) | 125,509,487 | 179,923,286 | 557,420,811 | 116,418,616 | 124,608,720 |
| Percentage of total population (%) | 11.37 | 16.30 | 50.50 | 10.55 | 11.28 | |
| Total area (km2) | 1,245,388.12 | 734,952.73 | 2,275,487.36 | 587,808.42 | 1,174,534.8 | |
| Percentage of total area (%) | 20.69 | 12.21 | 37.81 | 9.77 | 19.52 | |
| Average population density (people/km2) | 100.78 | 244.82 | 244.97 | 198.06 | 106.09 | |
| GPW | Total population (people) | 335,862,720 | 164,011,060 | 322,615,055 | 103,708,031 | 177,684,054 |
| Percentage of total population (%) | 30.43 | 14.86 | 29.23 | 9.39 | 16.09 | |
| Total area (km2) | 472,853.9 | 532,821.3 | 1,602,648.4 | 642,171.13 | 2,767,676.7 | |
| Percentage of total area (%) | 7.86 | 8.85 | 26.63 | 10.67 | 45.99 | |
| Average population density (people/2) | 710.29 | 307.82 | 201.3 | 161.5 | 64.2 | |
| GRUMP | Total population (people) | 223,913,755 | 203,927,695 | 414,412,191 | 113,818,686 | 147,808,593 |
| Percentage of total population (%) | 20.29 | 18.47 | 37.54 | 10.31 | 13.39 | |
| Total area (km2) | 545,491.24 | 676,933.94 | 1,906,016 | 609,758.4 | 2,279,971.8 | |
| Percentage of total area (%) | 9.06 | 11.25 | 31.67 | 10.13 | 37.89 | |
| Average population density (people/2) | 410.48 | 301.25 | 217.42 | 186.66 | 64.83 | |
| WorldPop | Total population (people) | 79,459,225 | 193,561,962 | 633,672,424 | 104,920,150 | 92,267,159 |
| Percentage of total population (%) | 7.2 | 17.54 | 57.4 | 9.5 | 8.36 | |
| Total area (km2) | 333,542.24 | 619,301.2 | 2,429,326.28 | 685,434.02 | 1,950,567.73 | |
| Percentage of total area (%) | 5.54 | 10.29 | 40.37 | 11.39 | 32.41 | |
| Average population density (people/km2) | 238.23 | 312.55 | 260.84 | 153.07 | 47.3 | |
© 2018 by the authors. Licensee MDPI, Basel, Switzerland. This article is an open access article distributed under the terms and conditions of the Creative Commons Attribution (CC BY) license (http://creativecommons.org/licenses/by/4.0/).
Share and Cite
Bai, Z.; Wang, J.; Wang, M.; Gao, M.; Sun, J. Accuracy Assessment of Multi-Source Gridded Population Distribution Datasets in China. Sustainability 2018, 10, 1363. https://doi.org/10.3390/su10051363
Bai Z, Wang J, Wang M, Gao M, Sun J. Accuracy Assessment of Multi-Source Gridded Population Distribution Datasets in China. Sustainability. 2018; 10(5):1363. https://doi.org/10.3390/su10051363
Chicago/Turabian StyleBai, Zhongqiang, Juanle Wang, Mingming Wang, Mengxu Gao, and Jiulin Sun. 2018. "Accuracy Assessment of Multi-Source Gridded Population Distribution Datasets in China" Sustainability 10, no. 5: 1363. https://doi.org/10.3390/su10051363
APA StyleBai, Z., Wang, J., Wang, M., Gao, M., & Sun, J. (2018). Accuracy Assessment of Multi-Source Gridded Population Distribution Datasets in China. Sustainability, 10(5), 1363. https://doi.org/10.3390/su10051363