Article

A Sustainable Land Utilization Pattern for Confirming Integrity of Economic and Ecological Objectives under Uncertainties

1
School of Labor Economic, Capital University of Economics and Business, Beijing 100072, China
2
College of Environmental Economics, Shanxi University of Finance and Economic, Taiyuan 030006, China
3
College of Water Resources & Civil Engineering, China Agriculture University, Beijing 100083, China
4
Department of Civil Engineering, McMaster University, Hamilton, ON L8S 4L7, Canada
5
Faculty of Engineering, University of Regina, Regina, SK S4S 0A2, Canada
*
Authors to whom correspondence should be addressed.
Sustainability 2018, 10(5), 1307; https://doi.org/10.3390/su10051307
Submission received: 1 February 2018 / Revised: 18 April 2018 / Accepted: 18 April 2018 / Published: 24 April 2018

Abstract

:
In this study, an integrated crop–forest system with market approach (ICFM) associated with recovering forest and withdrawing cultivation was developed for confirming regional integrity of economic and ecological objectives under uncertainties. A mixed quadratic stochastic-fuzzy programming method (QSF) was proposed for planning an ICFM issue under uncertainties. QSF can not only deal with spatial and temporal variations of meteorological condition, but also handle uncertainties expressed in terms of probability distributions and fuzzy sets. Meanwhile, it can also tackle nonlinear relationships between land resource plan and economic data. The developed QSF was applied to an ICFM issue in Xixian county, China. The results of adverse effects from irrigation, ecological effects from forest, land utilization with market approach and optimal system benefits were obtained. It can facilitate policymakers to adjust current land utilization with market approach to improve the productivities of land resources. The tradeoff between crop irrigation and forest protection can prompt generation of optimized plans with consideration of economic and ecological objectives, which can be availed to generate strategies for confirming integrity of socio-economic and eco-environmental sustainability.

1. Introduction

Over the past half century, the high-speed development of agriculture has greatly contributed to food safety, which could improve human lives. More land resources such as forest have been over-exploited into irrigated land to satisfy the accelerated demand for food production; meanwhile, woods have been felled for urban construction. However, over reclamation and cultivation could disturb the balance of groundcover; meanwhile, over-fertilization and irrational planting schedule have brought great stresses to water and environment, leading to land degradation [1,2]. In recent years, land degradation has caused frequent detrimental phenomena such as sand storms, detritus streams, water deficits and water pollutions, which have challenged policymakers worldwide. To regain the frail ecological function of land resources, an integrated crop–forest system (ICF) project associated with recovering forest and withdrawing cultivation has been advocated in the context of rapid development of agriculture. However, the tradeoff between irrigative development and forest protection has aggravated the difficulty of ICF project promotion. On the one hand, ICF can be beneficial to regain ecological services from land (e.g., erosion control, recreation opportunity, soil and water conservation), leading to more intangible ecological returns to human beings [3,4]. On the other hand, in the short run, an ICF project may reduce the direct benefit of economy due to withdrawing reclamation, which results in it being disputed. Therefore, an effective method such as market approach can be joined into a land resources reallocation issue to improve economic productivity of land usage [5]. In an ICF with market approach (ICFM), land users may face the higher penalties or losses of land degradation; thus, they would consider withdrawing cultivation into forest land based on being given maximum environmental allowance, with aim to reduce these penalties or losses. Through a market approach, the land resources can be encouraged from lower value (or higher loss) to higher one (or lower loss), which can improve the productivity of land resources. Meanwhile, the land users may regulate their fertilizations and planting schedules to reduce the penalties for pollution discharges or losses of land degradation. It can also facilitate policymakers to adjust current irrigative structure and land utilization pattern in a more sustainable manner with consideration of economic and ecological objectives.
However, a practical ICFM issue is often complicated with numbers of uncertainties associated with economic development, environmental protection, marketable regulation, effective governance, and technical factors [6,7,8,9]. For example, regional meteorological condition can impact ecological function of land resources, which can be deemed as spatial and temporal variations (e.g., water flows for plantation) existing in system components. Meanwhile, intricate factors such as market discipline and social-economic development would influence the processes of land planning, leading to vagueness [10]. Moreover, the interactions between uncertain system components such as recourse actions between expected target and available land resource can be embodied into an implication of an ICFM issue, which would increase the complexity of ICFM system [11]. The above uncertainties and their interactions require policymakers to obtain a comprehensive, complex and ambitious plan.
Previously, many researchers worked on planning land resources with consideration of uncertainties associated with precise environmental load, stochastic water flow, fuzzy ecological effect, complex economic development and uncertain market regulation [12,13,14,15,16,17]. For instance, Perez-Garcia et al. [12] used Global Trade Model (GTM) and the Terrestrial Ecosystem Model (TEM) to estimate the potential effects of climate change on the scale of global forest land, which can provide ecological-economic aspects with uncertain economic, ecological and climate scenarios for policymakers. Hauk et al. [13] qualified the economic risk of short rotation woody crops (SRWC) to evaluate the economic diversification effects through Modern Portfolio theory, which can help to find an effective risk-management instrument and profitable crop in a farm scale. However, the above risk analysis methods have difficulty in reflecting the influence of random events and their corresponding effects. Therefore, a stochastic method is introduced to handle spatial and temporal uncertainties [14]. For example, Whelan et al. [15] described a stochastic phosphorus (P) transferring model in an agricultural land and water resources issue, with aim to quantify the effects of spatial variability in an effective manner. Han et al. [16] planned land and water resources through an interval-parameter linear optimization model with stochastic vertices, which can arrange irrigative schedule against risk in the Hetao irrigation region. Djanibekov and Khamzina [17] concentrated on the economic viability of afforestation on marginal irrigated croplands with stochastic method in irrigated drylands. Djanibekov and Villamor [18] developed a farm-level dynamic mean-variance model combined with a real options approach to identify the relationship between agroforest conservation with market-based instruments (MBIs) and risk aversion of farmers. However, the above stochastic methods cannot reflect the recourse actions between expected target and random events (such as spatio-temporal water flow), which can be introduced to stochastic programming (SP) to handle this issue in a practical land planning issue. For instance, Guo et al. [19] developed an interval fuzzy-stochastic programming for irrigation planning within an agriculture system under multiple uncertainties. Zeng et al. [20] proposed a two-stage stochastic programming to reflect recourse actions between expected irrigative targets and random variables, which is effective to deal with stochastic uncertainties expressed as probability distributions. However, SP has difficulty in handling information with vagueness and fuzziness, which requires fuzzy programming method (FP) to regarded ambiguous parameters [21,22]. For instance, Maqsood et al. [23] mixed fuzzy programming, interval-parameter programming and two-stage stochastic programming into a framework to plan water resources/ecological environment management under uncertainty. Altunkaynak and Sen [24] introduced fuzzy membership functions to evaluate the dynamic valuation of ecosystem services in Lake Van, eastern Turkey. Deng et al. [25] improved entropy-based fuzzy matter-element model to reflect objective fact in river health assessment, which can improve feasibility of assessment. Nevertheless, traditional FP can present confidence degree of event occurrence regarded as possibility distribution, which cannot satisfy the higher requirement of fuzziness expression, particularly in the situation of vagueness superposition. Therefore, credibility constrained programming (CCP) can be jointed into FP to improve the abilities of fuzziness expression through mixed possibility and necessity measures [22]. In addition, there are nonlinear relationships existing in land resource and economic parameters, which cannot be tackled by SP, FP, or CCP. Thus, quadratic programming (QP) can be introduced to reflect such nonlinearity to support for generation of global optimization under multiple uncertainties [6,11,20,26,27,28,29]. Unfortunately, few studies focus on mixing SP, FP, CCP and QP methods for planning land resources.
Therefore, this study developed a sustainable land utilization pattern with market approach (ICFM) for confirming regional integrity of economic and ecological objectives under uncertainties. A mixed quadratic stochastic-fuzzy programming method (QSF) was proposed for an ICFM issue to handle uncertainties and systemic complexities, which can not only handle uncertainties expressed as probability and possibility distributions, but also quantify nonlinearity among economic parameters and land resources. The proposed model was applied to a real case of a crop–forest system in Xixian county, China. Sound land utilization plans associated with reclamation withdraw and forest recovery were designed to satisfy regional economic and ecological objectives. Meanwhile, a market approach was considered for a land utilization plan to increase the economic productivity of land resources. The obtained results can facilitate policymakers to identify optimized irrigated crop and forest protection policies with a sustainable manner, achieving integrity of socio-economy and eco-environmental sustainability

2. Application

2.1. Study Area

Figure 1 presents Xixian county, part of Henan Province located in the upper Huaihe River Basin (113°15″ E–114°46” E, 31°31″ N–32°43″ N), with area of 10,191 km2. The study region is composed of 65% mountain area and 35% flat depression. Since it is situated in the transition zone between the northern subtropical region and the warm temperate zone, the area is suitable for crop plantation with the average annual precipitation being 645 mm. In the study region, endemic plants such as Taxodium, Ginko and Metasequoia grow well to support regional wood-processing industry. Meanwhile, irrigation for crops such as grains, oil plants, vegetables and fruits has been developed rapidly in recent years, which can improve the quality of human living in the study region.
On the context of population growth and urbanization, forest lands have been exploited as irrigated lands, which could satisfy increasing food demand and accelerated urbanization, but bringing about great water and environment stresses. For example, from 2000 to 2015, irrigated land area has increased 3.56 × 10³ km2, while water deficit of irrigating was 38.13 × 10⁶ m3 at its peak [30,31,32,33]. Meanwhile, excessive fertilization can aggravate severe soil loss and pollution emission, leading to the destruction of land function.

2.2. Construction of an Integrated Crop–Forest System

To remedy the damage from crop irrigation, an integrated crop–forest system (ICF) can be built (Figure 2).
In an ICF system, forest can play an important role in regaining ecological function, such as flood control, aquifer replenishment, sediment retention, and water filtration. A proper land utilization plan associated with recovering forest and withdrawing cultivation is required, where the adverse effects from crop irrigation can be transformed by forest system. For instance, excessive nitrogen/phosphorus discharges from excessive fertilization can be purified by the forest system through its purification capacity [17]. Meanwhile, economic forest plantation can bring about direct and indirect economic returns. Based on eco-compensation mechanisms, an ICF issue can be considered an effective manner to regain ecological function and achieve regional sustainability in Xixian county. However, limited land resources can restrict the implementation of crop–forest strategy. Therefore, a market-based approach can be introduced to improve the economic productivity of land exchange from low to high values.

2.3. Modeling Formulation

A policymaker has the following challenges: (a) A land allocation to crop irrigation can generate economic benefits but can also bring about adverse effects on ecological environment. How to balance the relationship between economy and environment can be deemed as a key point in regional sustainability in study region. (b) Since a land plan in ICF is associated with withdrawing reclamation and recovering forest, the tradeoff between the losses of damages to ecosystem from irrigation and the cost of withdrawing reclamation (including decreased crop planting scale and increased forest recovery) can facilitate policymakers to adjust current land plans. How to identify an optimal strategy for coordination of economic and ecological objectives can be an important issue in ICF. (c) Several factors such as trading cost or reclamation cost can influence the exertion of land reallocation with a market approach in a ICFM issue. (d) Many uncertainties and their interactions existing in a ICFM issue, which could aggravate the complexity of ICFM. How to develop an effective QSF method to identify uncertainties and handle their interactions is a necessary step to generate an irrational result against systemic risk.
max   f = B C t B D t L E t P S t + B W t
In this objective function, Model (1a) presents the maximum of system benefit in a ICFM issue. It equals the benefit from irrigated land and ecological effect minus the loss of water shortage, penalty of water pollution and water/soil loss (US$). B C t is the expected benefits from irrigative activity and forest protection (US$), which is shown in Model (1b). B D t is the losses of water deficit areas for crop irrigation and forest protection (US$), which is detailed in Model (1c). L E t is the losses of water/soil erosion due to irrigative activity (US$) [Model (1d)]. P S t is the penalties for environmental pollution [Model (1e)]. B W t is the benefits of ecological effect from land plan with market approach, which is presented in Model (1f). In this study, t is the subscript for planning periods, where three planning periods can be considered (t =1 Period 1, t = 2 Period 2, and t = 3 Period 3). Among them, one planning period is three years. Meanwhile, since crop irrigation and forest protection can be incorporated into a framework, three main types of crops [m = 1 grain plant (ha), m = 2 oil plants (ha), and m = 3 vegetables (ha)] and forests [n = 1 economic forest (ha), n = 2 shelter forest (ha), and n = 3 forest park (ha)] can be shown in an ICFM system. Therefore, m and n are the subscripts for main types of crops and forests.
B C t = t = 1 3 m = 1 3 ( b m t m × W M t m + c m t m ) × W M t m + t = 1 3 n = 1 3 ( b a t n × W E A t n + c a t n ) × W E A t n
Model (1b) presents expected benefit from a land plan incorporated with a forest system and an irrigation system. Since expected planning areas (or expected land demands) for crops and forests have been regulated in the beginning of planning period, expected benefit equals the net benefit parameter per area being allocated within the expected target area. W M t m and W E A t n are expected land demands for crop and forest area in period t (ha), respectively, which are the first-stage decision variables in an ICFM issue (ha). However, in a practical ICFM issue, there are various complex relationships between economic parameters and land plans, which can be expressed as nonlinearity. Therefore, a mixed quadratic stochastic-fuzzy programming method (QSF) can be introduced to handle nonlinear uncertain relationships between economic data and expected targets quadratically (e.g., ( b m t m × W M t m + c m t m ) × W M t m ) (US$), where b m t m and c m t m are the quadratic coefficients for W M t m (US$/ha). The nonlinear relationship between economic data and expected target ( W M t m ) can be calculated as a function (e.g., ( b m t m × W M t m + c m t m ) × W M t m ). b a t n and c a t n . are quadratic coefficients for W E A t n . Therefore, b m t m , c m t m , b a t n and c a t n are quadratic coefficients for first-stage decision variables (i.e., W M t m and W E A t n ). Similar principles are expressed in Models (1c)–(1f).
B D t = p = 1 5 p t p × { t = 1 3 m = 1 3 ( d m t m × S M t m + e m t m ) × S M t m × α t m + t = 1 3 n = 1 3 ( d a t n × S E A t n + e a t n ) × S E A t n × β t n }
Model (1c) shows the losses of water deficit areas ( S M t m and S E A t n ) for crop irrigation (grain plant, oil plant and vegetables) and forest protection (economic forest, shelter forest and forest park) (US$). S M t m and S E A t n are second-stage decision variables to rectify the first-stage decision variables through QSF method (as shown in the Appendix A). In general, after the land resources are pre-regulated to each user, if the water has not been delivered to the regulated land, water deficit occurs, leading to economic losses. In the study region, the requirement of water per area equals the planting scale multiplied by the coefficient of water utilization for irrigation and forest ( α t m and β t n ). α t m is the coefficient of water utilization for irrigative activity (ton/ha), and β t n is the coefficient of water utilization for forest protection (ton/ha). However, in a practical ICFM issue, water flows are often regarded as uneven levels, which can influence the exertions of economic and ecological functions. The seasonal water deficits can generate adverse effects on the regional development, reducing economic benefit. In Model (1c), p is the subscript for water flow levels, where five water levels (p = 1 low, p = 2 low-medium, p = 3 medium, p = 4 medium-high, and p = 5 high) are considered. d m t m , e m t m , d a t n and e a t n are the quadratic coefficients for S M t m and S E A t n , which indicate the nonlinear relationship between net loss of water deficit area and expected land demand (US$/ton). Therefore, d m t m , e m t m , d a t n and e a t n are the quadratic coefficients for second-stage decision variables.
L E t = p = 1 5 p t p × { t = 1 3 m = 1 4 [ e L S t m × ( W M t m S M t m ) + g L S t m ] × s l t m + t = 1 3 m = 1 4 [ e L W t m × ( W M t m S M t m ) + g L W t m ] × w r t m }
With high runoff, water and soil loss lead to losses (or reduced benefits). Models (1d) and (1e) present loss for water/soil erosion [Model (1d)]. In Model (5d), s l t m is the coefficient of soil loss from crop irrigation in period t (ton/ha) and w r t m is the coefficient of water loss from crop irrigation in period t (ton/ha). e L S t m and e L W t m are the quadratic coefficients of reduced benefit for soil and water erosion (US$/ton).
P S t = p = 1 5 p t p × { t = 1 3 m = 1 4 [ e C A t m N × ( W M t m S M t m ) + g C A t m N ] × s l t m × E N t m N + t = 1 3 m = 1 4 [ e C A t m P × ( W M t m S M t m ) + g C A t m P ] × s l t m × E P t m P }
Moreover, with high runoff and soil loss, excess total nitrogen (TN) and total phosphorus (TP) from crop irrigation are discharged into water body directly, leading to pollution. Model (1e) presents the penalty for environmental pollution (US$). E N t m N is the TN content in lost soil due to irrigative activities in period t (%). E P t m P is the TP content in lost soil (%). e L S t m , g L S t m , e L W t m and g L W t m are quadratic coefficients for soil and water erosion, which can present nonlinear relationships between economic loss of water/soil erosion and land reallocation (US$/ton). Similarly, e C A t m N , g C A t m N , e C A t m P and g C A t m P are quadratic coefficients of penalties for TN and TP discharges (US$/ton), which can reflect nonlinearity issues in an ICFM issue.
B W t = t = 1 3 n = 1 3 { e B A t m × [ ( D A t n N + D A t n p ) + S I A t n + W I A t n ] × W R A t n + g B A t n } + t = 1 3 n = 1 3 { e B E t n × [ ( D E t n N + D E t n p ) + S I E t n + W I E t n ] × W R E t n + g B E t n }
Since forest systems play an important part of regaining ecological functions (such as flood control, aquifer replenishment, sediment retention, and water filtration), benefit from forest recovery can prompt achieving ecological objectives in the study region. Model (1f) presents the benefit of ecological effect from land plan with market approach. In an ICFM issue, the policymakers (or farmers) have to choose to pay the penalty for environmental pollution or reduce the crop planting scale to reduce pollutant discharge [25,26]. In an ICFM issue, the market approach can support land from lower value to higher value, which is adapted to reclamation to reduce damage to environment. W R A t m and W R E t n are reallocated land resources for crop and forest area with a market approach, where the reallocated land resources can generate benefit due to withdrawing reclamation (ha). D A t n N , D A t n p , S I A t n and W I A t n are reduced amount of water/soil erosion and pollution from reclamation (ton/ha). Meanwhile, the reduced irrigative land can be transformed as forest land, which can generate indirect benefits due to ecological effect. D E t n N , D E t n p , S I E t n and W I E t n are increasing ecological effects due to forest recoveries (ton/ha). e B A t n , g B A t n , e B E t n and g B E t n are quadratic coefficients for reallocated land resources ( W R A t m and W R E t n ), which can reflect the nonlinear relationships between benefit from ecological effects (US$/ton) and reallocated land resources.
In addition, f constraints associated with relocated land resource, water quantity, water supply capacity, pollutant discharge and technique constraint can be formulated as follows.
  • Reallocated land resource with market approach:
    t = 1 3 m = 1 3 W R A t m + t = 1 3 n = 1 3 W R E t n T A t
    In a traditional land utilization plan, the actual land resources can be reallocated to each plant by the proportion based on expected target. The market approach can be introduced to prompt land resources from lower value to higher value by the law of value, which can support land reallocation optimally. Model (2a) shows land resources reallocation based on market approach, where the productivities of land resources can be improved by reallocated actions ( W R A t m and W R E t n ) based on total land resources ( T A t ) (ha). T A t is the total land resources in study region (ha).
  • Water quantity and water supply capacity for irrigative activities:
    C r { [ t = 1 3 m = 1 3 ( W M t m S M t m ) × α t m + t = 1 3 n = 1 3 ( W E A t n S E A t n ) × β t n ] [ ( t = 1 3 p = 1 5 Q F ˜ t p + t = 1 3 p = 1 5 Q G ˜ t p ) E t p t = 1 3 n = 1 3 ( 1 β t n ) × W R E t n × R E C t n × R O t n H t p ] } μ
    C r { [ ( t = 1 3 p = 1 5 Q F ˜ t p + t = 1 3 p = 1 5 Q G ˜ t p ) E t p t = 1 3 n = 1 3 ( 1 β t n ) × W R E t n × R E C t n × R O t n H t p ] C S M t p } μ
    C r { [ t = 1 3 m = 1 3 ( W R A t m S R A t m ) × α t m + t = 1 3 n = 1 3 ( W R E t n S R E t n ) × β t n ] [ ( t = 1 3 p = 1 5 Q F ˜ t p + t = 1 3 p = 1 5 Q G ˜ t p ) E t p t = 1 3 n = 1 3 ( 1 β t n ) × W R E t n × R E C t n × R O t n H t p ] } μ
    Model (2b) presents available water for irrigation and forest without market approach, where a land plan associated with water quantity based on regional water resource load can be expressed. If water cannot satisfy the expected land targets, water deficits occur, which are caused by uncertain water availabilities. Water availability equals available water from surface and underground ( Q F t p and Q G t p ) minus evaporation ( E t p ), watercourse loss ( H t p ) and minimum ecological requirement ( t = 1 3 n = 1 3 ( 1 β t n ) × W R E t n × R E C t n × R O t n ) (m3). Q F t p is the available water from surface (m3); Q G t p is the available water from underground (m3); E t p is the total evaporation in study region (m3); H t p is the watercourse loss (m3); R E C t is water conservation ability of forest per ha (m3/ha); and R O t is rainfall runoff coefficient (%). In Model (6b), since available water can be deemed as stochastic and random variables impacted by spatio-temporal factors, fuzzy measure Cr can be advocated to express such fuzziness, where μ is the credibility level through the QSF method (as shown in the Appendix A). Model (2c) shows the water supply capacity for irrigative activities in period t under probability p t p (m3). The model presents that maximum supply capacity (i.e., C S M t p ) can be restricted by water availability. A market approach can prompt the efficiency of land plan; limited water resources can restrict the development of crop planting and environmental protecting. Thus, Model (2d) presents available water for irrigation and forest protection through a market approach, where water deficits occur when water cannot be delivered to the reallocated land. S R A t m and S R E t n are the water shortage area (ha).
  • Pollution purification capacity through market approach:
    t = 1 3 m = 1 3 ( D A t m N + D A t m P ) ( N P t + N N t ) × p = 1 5 p t p × [ t = 1 3 m = 1 3 ( W R E t n S R E t n ) ]
  • Total nitrogen allowance:
    C r { p = 1 5 p t p × [ t = 1 3 m = 1 3 C A t m N × ( W R A t m S R A t m ) × s l t m × E N t m N ] ( 1 N N t ) T N P ˜ t p × ( 1 t p n t ) } μ
  • Total phosphorus allowance:
    C r { p = 1 5 p t p × [ t = 1 3 m = 1 3 C A t m P × ( W R A t m S R A t m ) × s l t m × E P t m P ] × ( 1 N P t ) T P P ˜ t p × ( 1 t p p t ) } μ
  • Soil and water conservation capacity:
    t = 1 3 m = 1 3 L M S t m × ( W R A t m S R A t m ) × s l L W T t m
    t = 1 3 m = 1 3 L M W t m × ( W R A t m S R A t m ) × w r t L S T t
    Model (2e) presents that capacity of purification from forest system (through ecological effect) with market approach hinges on the coefficient of purification (i.e., N P t , N N t ) under probability p t p (m3) in period t. D A t m N and D A t m P are the actual pollution purification capacities through ecological effect with a market approach (ton). N P t and N N t are the coefficient of purification with consideration of ecological effect, which can be obtained based on previous research works. Models (2f) and (2g) present that pollutant discharges from crop irrigation would impose restrictions on discharge allowance ( T N P t p and T P P t p ). T N P t p and T P P t p are maximum allowable TN and TP discharges from irrigation in period t (ton), which have been expressed as credibility fuzzy manners. In fact, actual nitrogen and phosphorus discharges would be original discharge from irrigative activities minus the values that being purification through ecological effect [as shown in Models (2f) and (2g)]. Since the capacity of water conservation and soil erosion of forest can relieve the adverse effect from irrigation, Models (2h) and (2i) present that the total capacities of water and soil conservation would be restricted by their maximum capacities ( L W T t p and L S T t p ) in study region. L M S t m and L M W t n are the coefficients of ecological effect for soil and water conservation from a forest system in period t (%). L W T t p and L S T t p are maximum allowances for water and soil erosion in period t (ton).
  • Non-negativity:
    W M t m > S M t m 0 ,    W E A t m > S E A t m 0
    Model (2j) is non-negativity restrictions.

2.4. Data Acquisition

Table 1 presents the economic data related to different expected land demand targets and water deficits, which can be expressed quadratically. The net benefit of land utilization and the loss of water deficit can be calculated according to regional statistical yearbook indirectly [30,31,32,33].
Table 2 presents modeling input such as allowance TN/TP permit, water and soil erosion rate and TN/TP discharge rate in study region according to previous research works.

3. Result Analysis

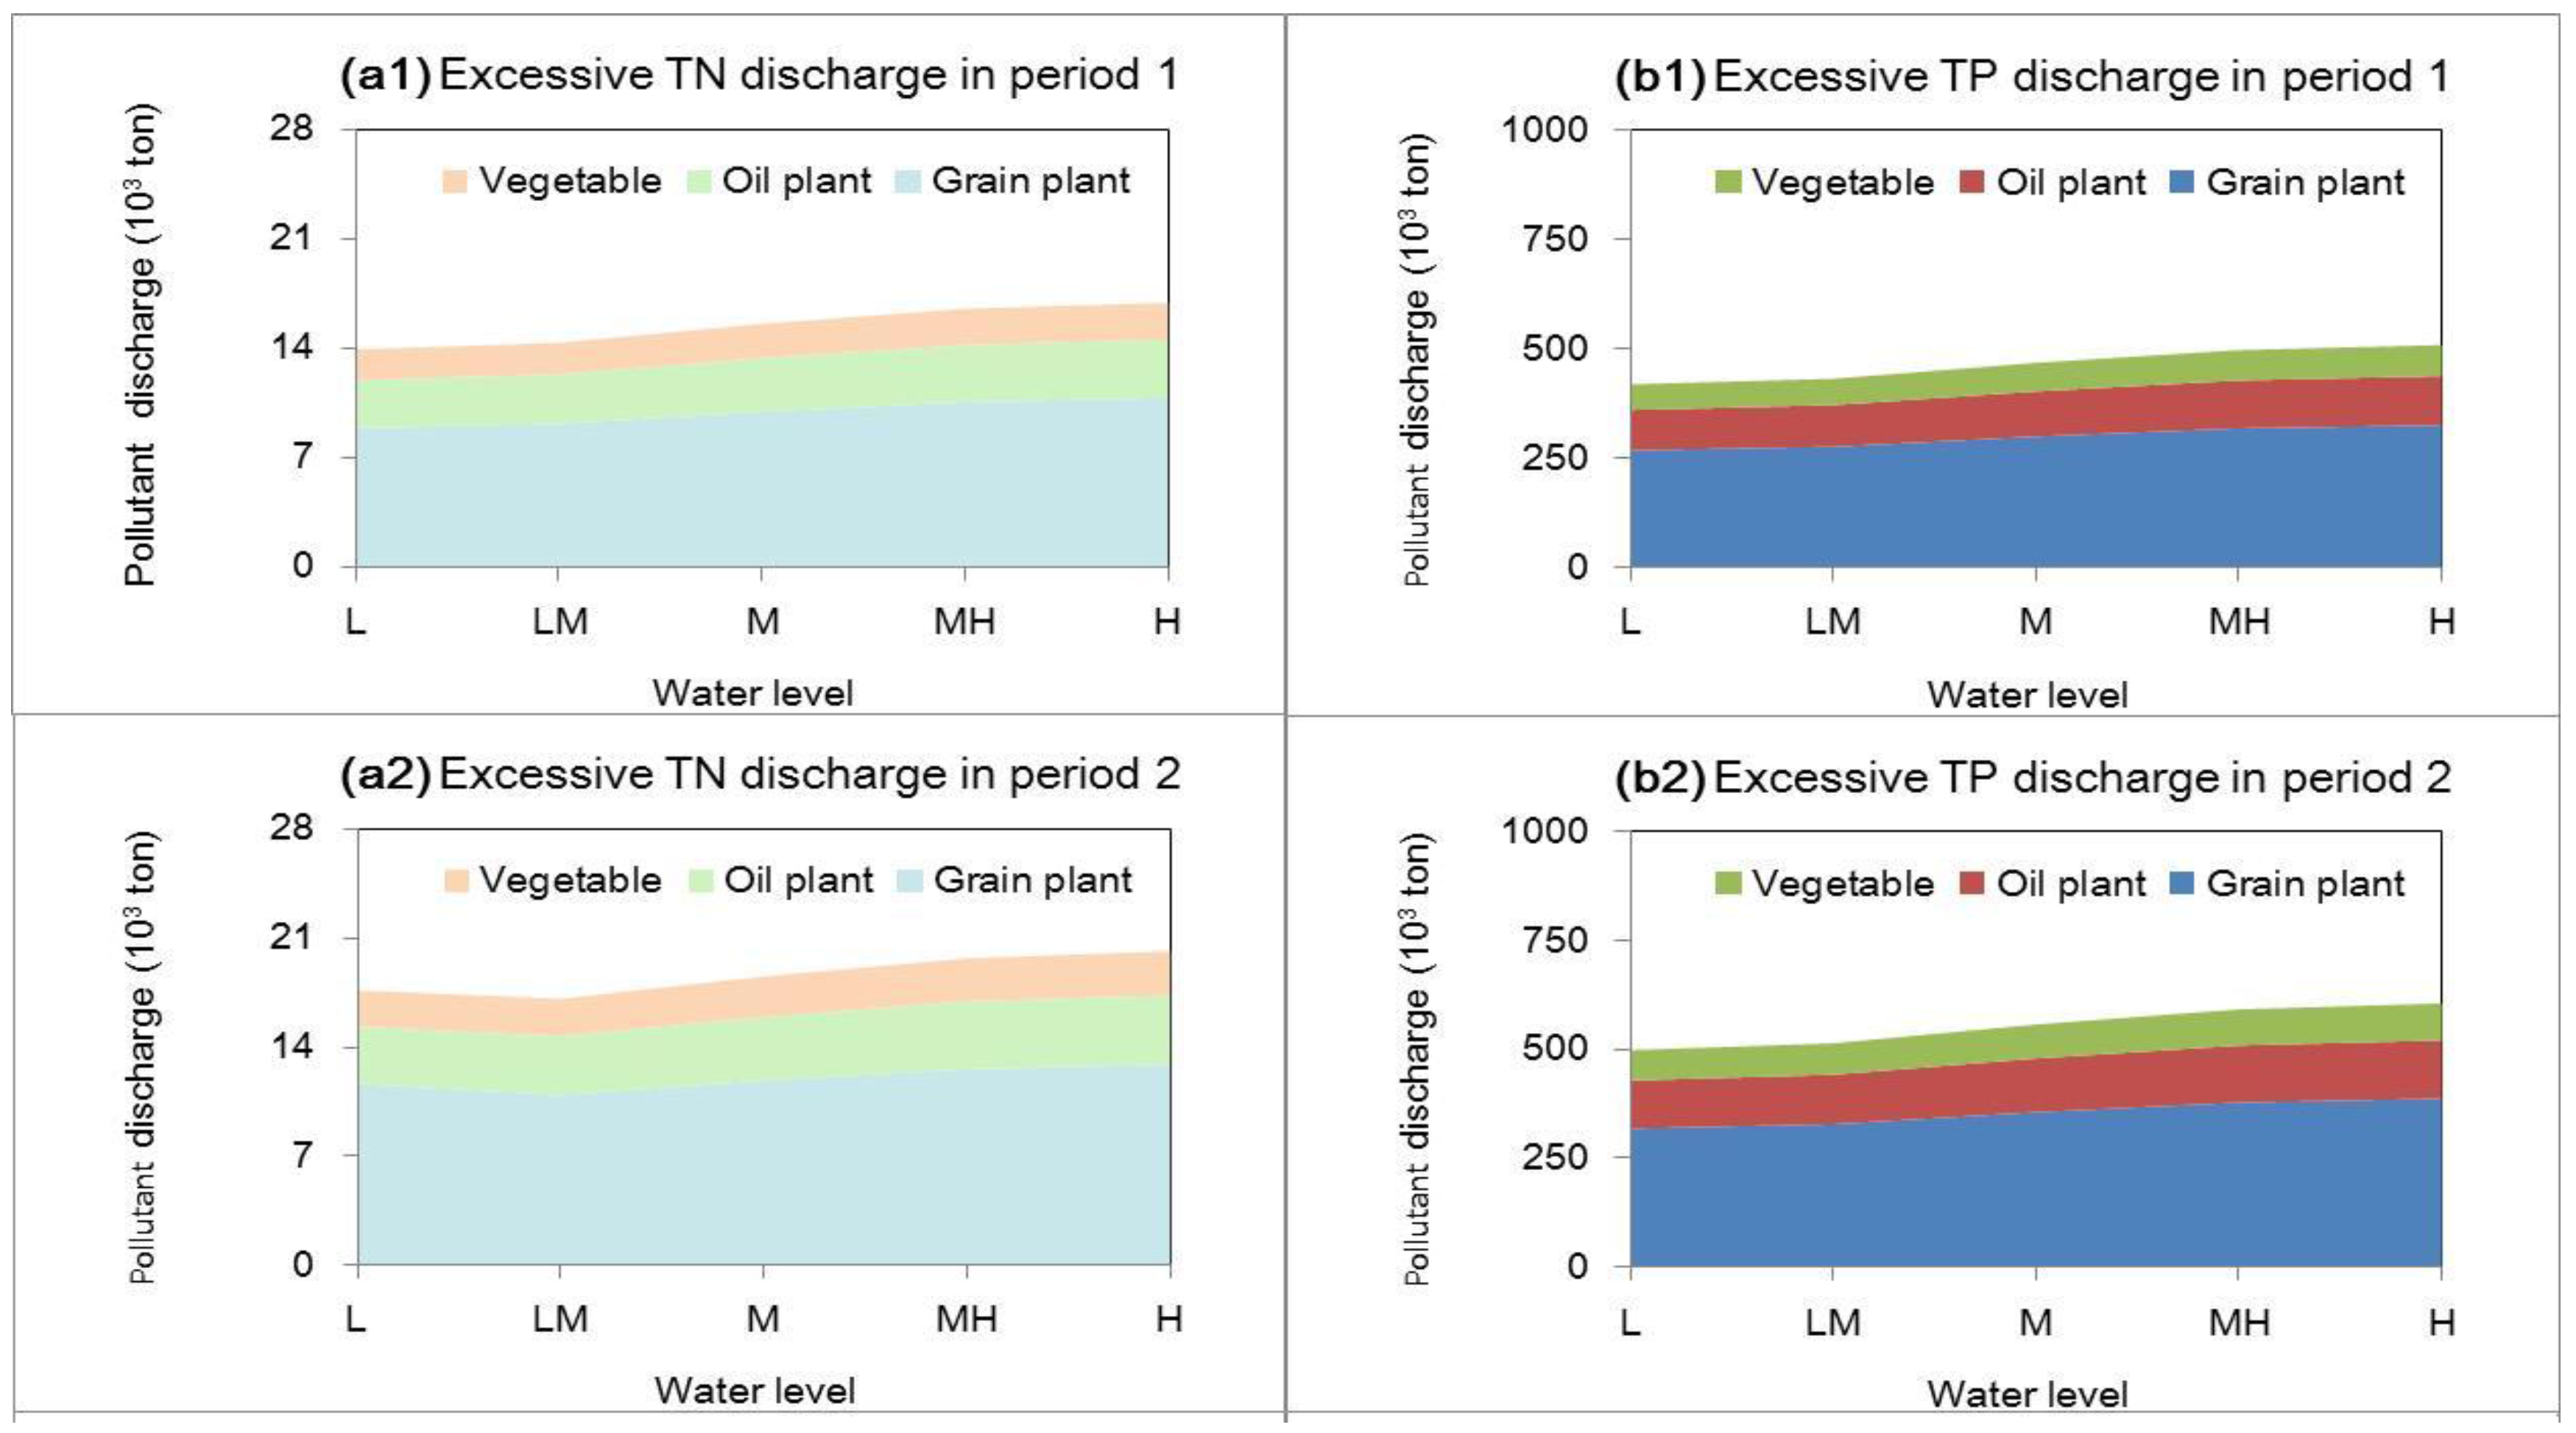
3.1. Adverse Effects from Crop Irrigation without Market Approach

Figure 3 presents the water deficits without market approach when η are 0.6 and 0.99, which displays that water deficits would vary under various expected land demand targets.. In the study region, since expected land demand has been regulated by policymakers, when available water cannot satisfy the expected land demand, irrigative production and forest protection cannot be conducted in the expected area, which can result in the reduction of output and economic losses. Results demonstrate that, if the pre-regulated land demand target is greater than the actual land that can be satisfied by water availability, water deficit can occur. Since approximately 60% of the total annual precipitation concentrates in the wet season, when water inflows are middle or low, the deficit would be strengthened. For example, in Period 1, water deficits of vegetable would be 3.17, 2.71, 1.41 0.41 and 0 × 106 m3 when water inflows are low, low-medium, medium, medium-high, and high levels, respectively, when η is 0.6. Meanwhile, the results display that deficits are influenced by various η-levels. The higher η-level (i.e., η = 0.99) would result in higher water deficits; by decreasing η-level, water deficits would drop (i.e., η = 0.6). For example, when water availability is low level in Period 3, water deficits of shelter forest would be 3.16 × 10⁶ m3 (η = 0.6) and 3.75 × 10⁶ m3 (η = 0.99). In comparison, the highest water deficit area would occur in grain plant due to its excessive planting scale. On the contrary, economic forest has a lowest water deficit, which indicates that expected land demand targets for economic forest would be rational in study region. Meanwhile, it implies that economic forest has a higher potential to be expanded due to its rational scale and higher ecological effect.
In study region, the overextended farming and irrational fertilization would generate excessive TN and TP pollutant discharges, which would bring about great stresses on regional environment. Thus, policymakers have regulated the maximum pollutant allowance according to regional environmental carrying capacity. Figure 4 shows excessive pollutant discharges without market approach when μ is 0.6. Several sensitive parameters of pollution discharge without market approach can be obtained, where water flow level, crop planation scale and corresponding pollutant discharge rate would influence the excessive pollution discharges. (a) Various water levels can generate changed capacities of pollutant diffusion. In general, a higher water availability level can produce a higher diffusion capacity. However, after more available water is allocated to irrigative activities, more pollutant would be discharged due to over-fertilization. For instance, when water levels are low and high in Period 3, the excessive TN from grain plant would be 12.01 and 14.32 × 10⁶ ton, respectively. (b) The results determine that the crop planation scale and corresponding pollutant discharge rate of varied crop planation can generate different amount of pollutant discharge. Meanwhile, various policy scenarios associated with changed allowable discharges can be considered. In the study region, based on calculation of environmental loads, policymakers have restricted maximum allowances ( T N P t p and T P P t p ) for TN and TP discharges. The results indicate that looser allowance would bring about a lower excess discharge, and vice versa.

3.2. Land Trade between Forest and Irrigation

Figure 5 displays the land transaction between forest and irrigation when μ is 0.6. The results present that, although irrigative land can produce economic benefit, it can also bring about environmental damage due to over-cultivation and over-fertilization, leading to environmental loss and penalty. Thus, a crop–forest system with market approach can be introduced to maximize the regional benefits with a sustainable and natural circulation mode, where the adverse impacts from irrigated production can be converted by forest reserve contribution. Based on the calculation from QSF, the following results are obtained: (a) In an ICFM issue, the crop irrigation deemed as a seller withdraws irrigative land due to its higher penalty of environmental damage. The results present that the greatest areas of withdrawing cultivation would occur in grain plant planting (achieving 1.14 × 10⁶ ha at maximum) due to its lower net economic benefit and higher emission compared to the other irrigated productions. (b) Forest can be considered a buyer to recover forest land to improve the system benefits from ecological effects. Among the three types of forest recovery methods, the economic forest has a better economic benefit and ecological return than shelter forest and ecological park. Under this situation, the highest recovered forest would be economic forest, which would reach 0.89 × 10⁶ ha at maximum. (c) The trend of land transition indicates that the current oversized planting scale in grain plant based on food security policy would generate a higher risk of environmental pollution, which easily leads to system failure. (d) The results present that the water availability levels would influence the land transactions between irrigated production and forest recovery. For instance, in Case 1, the area of withdrawing cultivation in oil planting would be 0.46, 0.22 and 0 × 106 ha when water levels are low, medium and high in Period 2, respectively. It indicates that land resources and water resources, both deemed important impact factors, could be incorporated into an ICFM project to adjust current policy in study region.

3.3. Ecological Effects and Corresponding Benefit from Market Approach

Figure 6 presents the ecological effects with market approach when μ levels are varied. The results indicate the forest system (including economic forest, shelter forest and forest park) has played important roles in soil intention, water conversation and pollution purification, leading to economic returns to human activities. Among them, shelter forest has a higher contribution to soil loss reduction, while the forest park has played an important role in water conversation. Moreover, economic plant has a higher contribution to pollution purification by self-purification capacity, which can generate the highest benefit.
Figure 7 presents the amounts of land trading and corresponding ecological benefits when μ is 0.6. In this study, the ecological benefits can be direct or indirect. Among them, withdrawing reclamation (i.e., seller) can bring about the direct benefit of ICFM, which can reduce penalty of water/soil loss and pollution discharge. For instance, withdrawing reclamation of grain plant (denoted as GP) would reduce the damage to environment, which would bring about 49.6% of the direct benefit at maximum. The indirect benefit would be from the improvement of ecological function (e.g., improvement of water quality and elevation of water/soil conservation) due to forest recovery. For example, in Period 3, forest park can bring about the highest indirect benefits from water conservation, achieving 46.7% of the total benefits. The synergy of direct and indirect environmental impacts can improve the regional ecological effects such as pollution purification, water and soil conservation.

3.4. System Benefit with and without Market Approach

Figure 8 presents the system benefits between market and non-market approaches. The results show that the system benefits can vary with η levels. For example, the system benefits would decrease from $1.01 × 10⁹ to $1.24 × 10⁹, with increasing η-necessity levels from 0.60 to 0.995. It means that a lower η level and increased uncertainty for the imprecise objective would correspond to an optimistic attitude on the expected system benefit, and vice versa. Meanwhile, the market approach is a more effective method for land planning, which can generate a higher benefit than that with non-market approach. For example, when η is 0.9, system benefits would be $1.08 × 10⁹ with market approach, while system benefits are $0.94 × 10⁹ without market approach.

4. Conclusions

This study developed a mixed quadratic stochastic-fuzzy programming method (QSF) for handling uncertainties in an integrated crop–forest system with market approach (ICFM) issue for coordinating irrigative activities and forest protection. QSF can not only deal with uncertainties expressed as probability and possibility distributions, but also handle nonlinearity with an effective manner. The proposed model was applied to a real case in Xixian county, China. Various results can be obtained as follows: (a) The results show that the current land policy has generated a higher water deficit due to increased irrigative exploitation. The highest water deficit for irrigation would achieve 23.43 × 10⁶ m3 (α = 0.6, ε = 0.99), leading to a loss. It means that the accelerated irrigative expansion has exceeded what water resources can afford. Thus, the adjusting the rate of agricultural development is an important issue for regional policymaker. (b) The results display that existing land utilization would produce excessive pollution to increase ecological risk in study region, where the highest excessive TP and TN discharges would reach 432.24 and 14.32 × 10³ ton. (c) The results indicate that strategies for ecological expansions (convert cultivated land into forest) can decrease the excessive pollutant discharges and water deficits, which can generate a higher system benefit than that without withdrawing farmland and recovering forest.
Meanwhile, through the calculation from a practical ICFM issue in Xixian county (China), the obtained results determine that market approach can prompt land change between crop and forest systems, with aim to avoid higher retreatment costs from over-expanded cultivation and irrational fertilization, while achieving higher benefits from ecological returns. Through application of Xixian county, we found that the largest withdrawing reclamation is grain plantation, which would bring about 49.6% of the direct ecological benefit at maximum. Meanwhile, various forest types would generate varied ecological function, which can bring about indirect benefit. Among them, forest park can bring about the highest indirect benefits from water conservation, achieving 46.7% of the total benefits. Shelter forest plays an important role in soil conservation. In an integrated crop–forest system with market approach (ICFM), market approach can grade land resources from lower to higher value, which can improve the productivities of land resources. Compared to a crop–forest system without market approach, it is found that the system benefit under market approach would be higher than that with non-market approach, which indicated that market would be a more effective method for land planning in study region.
Moreover, several discoveries have been made: (a) The tradeoff between the benefits of ecological function and economic objectives can support producing several results, with aim to achieve harmony between economic development and ecological protection. (b) Although market approach is an effective method to increase the economic productivity of land resources, the occurrences of market failure would impede the process of withdrawing reclamation and recovering forest. (c) Risk preferences of policymakers can influence the outcome against risk-violation in an ICFM issue. Therefore, many corresponding suggestions can be summarized as follows: (a) a proper strategy associated with irrigative development and forest protection can not only protect regional land functions, but also facilitate minimizing the adverse impacts from human activities; (b) the improvement of marketable productivity and regulation of market order can promote the efficiency of land plan with market approach; and (c) the consideration of risk can prompt the reliability of land utilization plans, which should be accounted for in a policy-making process.

Author Contributions

Z.X. and L.C. conceived and designed the model; T.Q. performed the experiments; L.Z. contributed modeling calculation; L.C. analyzed the result; and G.H. helped polish the paper.

Acknowledgments

This research was supported by the Youth Research Foundation of Shanxi University of Finance and Economics (Grant Nos. NQ-2017004), Beijing Social Science Fund (17SRC35) and the Field Project of CUEB. The authors are grateful to the editors and the anonymous reviewers for their insightful comments and suggestions.

Conflicts of Interest

The authors declare no conflict of interest.

Appendix A

In a decision-making issue, an expected target has been regulated before random event, which can be rectified by the occurrences of uncertainty (expressed as probability distribution). A two-stage stochastic programming can be built to reflect recourse actions between first-stage decision variables (i.e., expected targets) and second-stage variables (i.e., random events) periodically [6]. With the aim to minimize second-stage decision, a nonlinear program can be formulated as follows:
Max f = m = 1 M u m * w m n = 1 N E [ min v 0 Q ( v n , δ ) | R ( δ ) w m + S ( δ ) v n = g ( δ ) ]
s . t .   R ( δ ) w m + S ( δ ) v n = g ( δ )
m = 1 M a m n × w m c m n
w m 0
v n 0
where the first-stage decisions ( w is the first-stage decision variable and u is coefficient parameter) have been anticipated before the random or second-stage variables (i.e., v ) occur. where Q ( v n , δ ) is the second-stage cost function; { R ( δ ) , S ( δ ) , g ( δ ) | δ Ω } are model parameters with reasonable dimensions [21]. The p h denotes as the probability of realization of event; δ h , g m n and c n are cost, technical and right-hand side coefficients. The TSP can be transformed as a liner program, where the second-stage Q ( v n , δ ) can be linearized as a function of v n . Thus, model (A-1a) (i.e., Max f = m = 1 M u m * w m n = 1 N E [ min v 0 Q ( v n , δ ) | R ( δ ) w m + S ( δ ) v n = g ( δ ) ] ) can be represented as follows:
Max f = m = 1 M u m * w m h = 1 r n = 1 N p h * q ( v n h , δ h )
Let q ( v n , δ ) = b n * v n h + d n , where b n and d n are coefficient parameters of second-stage function Q ( v n , δ ) . b n and d n have a function relation to recourse variables (i.e., ( b n * v m h + d n ) ) to serve the purpose of showing unit penalty (i.e., unit loss) of land not being allocated. Therefore, a recourse action between first- and second-stage variables (i.e., w m and v h n ) would tend to higher unit system benefit and lower penalty of land resources, which result in optimal values of f . Thus, the model (A-2a) can be expressed as a linear manner with consideration of the probability of random event as follows:
Max f = m = 1 M u m * w m h = 1 r n = 1 N p h * ( b n v n h + d n ) * v n h
Although TSP can correct expected demand against any infeasibilities through a recourse action, it cannot reflect any fuzziness expressed as possibility distribution. Thus, fuzzy credibility constrained programming (FCP) can be introduced, where credibility constraints can be addressed through fuzzy sets in constraint to express relationship between satisfaction degree and system-failure risk as follows [11]:
Max f = m = 1 M u m * w m h = 1 r n = 1 N p h * ( b n v n h + d n ) * v n h
s . t .   R ( δ h ) w m + S ( δ h ) v n h = g ( δ h ) ,   δ h Ω
C r { m = 1 M a m n * w m c ˜ m n } α
w m 0
v n 0
Based on the concept of possibility, necessity and credibility, we have: P o s { ς s } = sup u s μ ( u ) , N e c { ς s } = 1 sup u > s μ ( u ) and C r { ς s } = 1 / 2 ( P o s { ς s } + N e c { ς s } ) . Where ς is a fuzzy variable with membership function μ, and let μ and r be real numbers. The possibility of a fuzzy event, characterized by ς s [22]. It is usually assumed that the credibility level should be greater than 0.5 in response to avoiding improper unsatisfactions and violated risks [11,23]. Thus, model (A-3c) can be transformed as the credibility measure when α > 0.5:
m = 1 M a m n × w m c m n 2 + ( 1 2 α ) × ( c m n 2 c m n 1 ) , n = 1 , 2 , , N 1

References and Notes

  1. Mensing, D.M.; Galatowitsch, S.M.; Tester, J.R. Anthropogenic effects on the biodiversity of riparian forests of a northern temperate landscape. J. Environ. Manag. 1998, 53, 349–377. [Google Scholar] [CrossRef]
  2. Rai, R.; Zhang, Y.; Paudel, B.; Li, S.; Khanal, N.R. A synthesis of studies on land use and land cover dynamics during 1930–2015 in Bangladesh. Sustainability 2017, 9, 1866. [Google Scholar] [CrossRef]
  3. Motesharrei, S.; Rivas, J.; Kalnay, E. Human and nature dynamics (HANDY): Modeling inequality and use of resources in the collapse or sustainability of societies. Ecol. Econ. 2014, 101, 90–102. [Google Scholar] [CrossRef]
  4. Weißhuhn, P.; Reckling, M.; Stachow, U.; Wiggering, H. Supporting agricultural ecosystem services through the integration of perennial polycultures into crop rotations. Sustainability 2017, 9, 2267. [Google Scholar] [CrossRef]
  5. Calatrava, J.; Garrido, A. Spot water markets and risk in water supply. Agric. Econ. 2005, 33, 131–143. [Google Scholar] [CrossRef]
  6. Li, Y.P.; Huang, G.H.; Xiao, H.N.; Qin, X.S. An inexact two-stage quadratic program for water resources planning. J. Environ. Inform. 2007, 10, 99–105. [Google Scholar]
  7. Abildtrup, J.; Garcia, S.; Stenger, A. The effect of forest land use on the cost of drinking water supply: A spatial econometric analysis. Ecol. Econ. 2013, 92, 126–136. [Google Scholar] [CrossRef]
  8. Ondei, S.; Prior, L.D.; Williamson, G.J.; Vigilante, T.; Bowman, D.M. Water, land, fire, and forest: Multi-scale determinants of rainforests in the Australian monsoon tropics. Ecol. Evol. 2017, 7, 1592–1604. [Google Scholar] [CrossRef] [PubMed]
  9. Samie, A.; Deng, X.; Jia, S.; Chen, D. Scenario-based simulation on dynamics of land-use-land-cover change in Punjab province, Pakistan. Sustainability 2017, 9, 1285. [Google Scholar] [CrossRef]
  10. Johnson, K.A.; Polasky, S.; Nelson, E.; Pennington, D. Uncertainty in ecosystem services valuation and implications for assessing land use tradeoffs: An agricultural case study in the Minnesota River Basin. Ecol. Econ. 2012, 79, 71–79. [Google Scholar] [CrossRef]
  11. Zeng, X.T.; Yang, X.L.; Yu, L.Y.; Chen, H.L. A mix inexact-quadratic fuzzy water resources management model of floodplain (IQT-WMMF) for regional sustainable development of Dahuangbaowa, China. Water 2015, 7, 2771–2795. [Google Scholar] [CrossRef]
  12. Perez-Garcia, J.; Joyce, L.A.; Mcguire, A.D. Temporal uncertainties of integrated ecological/economic assessments at the global and regional scales. For. Ecol. Manag. 2002, 162, 105–115. [Google Scholar] [CrossRef]
  13. Hauk, S.; Gandorfer, M.; Wittkopf, S.; Müller, U.K.; Knoke, T. Ecological diversification is risk reducing and economically profitable—The case of biomass production with short rotation woody crops in south German land-use portfolios. Biomass Bioenergy 2017, 98, 142–152. [Google Scholar] [CrossRef]
  14. Zeng, X.T.; Li, Y.P.; Huang, W.; Bao, A.M.; Chen, X. Two-stage credibility-constrained programming with Hurwicz criterion (TCP-CH) for planning water resources management. Eng. Appl. Artif. Intell. 2014, 35, 164–175. [Google Scholar] [CrossRef]
  15. Whelan, M.J.; Hope, E.G.; Fox, K. Stochastic modelling of phosphorus transfers from agricultural land to aquatic ecosystems. Water Sci. Technol. 2002, 45, 167–175. [Google Scholar] [PubMed]
  16. Han, Y.; Huang, Y.; Wang, G. Interval-parameter linear optimization model with stochastic vertices for land and water resources allocation under dual uncertainty. Environ. Eng. Sci. 2011, 28, 197–205. [Google Scholar] [CrossRef]
  17. Djanibekov, U.; Khamzina, A. Stochastic economic assessment of afforestation on marginal land in irrigated farming system. Environ. Resour. Econ. 2016, 63, 95–117. [Google Scholar] [CrossRef]
  18. Djanibekov, U.; Villamor, G.B. Market-based instruments for risk-averse farmers: Rubber agroforest conservation in Jambi Province, Indonesia. Environ. Dev. Econ. 2016, 22, 133–155. [Google Scholar] [CrossRef]
  19. Guo, P.; Huang, G.H.; Li, Y.P. Inexact Fuzzy-Stochastic Programming for Water Resources Management Under Multiple Uncertainties. Environ. Model. Assess. 2010, 15, 111–124. [Google Scholar] [CrossRef]
  20. Zeng, X.T.; Zhao, J.Y.; Yang, X.L.; Wang, X.; Xu, C.W.; Cui, L.; Zhou, Y. A land-indicator-based optimization model with trading mechanism in wetland ecosystem under uncertainties. Ecol. Indic. 2017, 74, 279–299. [Google Scholar] [CrossRef]
  21. Dunn, S.M.; Brown, I.; Sample, J.; Post, H. Relationships between climate, water resources, land use and diffuse pollution and the significance of uncertainty in climate change. J. Hydrol. 2012, 434–435, 19–35. [Google Scholar] [CrossRef]
  22. Inuiguchi, M.; Ramík, J. Possibilistic linear programming: A brief review of fuzzy mathematical programming and a comparison with stochastic programming in portfolio selection problem. Fuzzy Sets Syst. 2000, 111, 3–28. [Google Scholar] [CrossRef]
  23. Altunkaynak, A.; Sen, Z. Fuzzy logic model of lake water level fluctuations in Lake Van, Turkey. Theor. Appl. Climatol. 2007, 90, 227–233. [Google Scholar] [CrossRef]
  24. Maqsood, I.; Huang, G.H.; Yeomans, J.S. An interval-parameter fuzzy two-stage stochastic program for water resources management under uncertainty. Eur. J. Oper. Res. 2005, 167, 208–225. [Google Scholar] [CrossRef]
  25. Deng, X.; Xu, Y.; Han, L.; Yu, Z.; Yang, M. Assessment of river health based on an improved entropy-based fuzzy matter-element model in the Taihu Plain, China. Ecol. Indic. 2015, 57, 85–95. [Google Scholar] [CrossRef]
  26. Chena, M.J.; Huang, G.H. A derivative algorithm for inexact quadratic program-application to environmental decision-making under uncertainty. Eur. J. Oper. Res. 2001, 128, 570–586. [Google Scholar] [CrossRef]
  27. Huang, G.H.; Loucks, D.P. An inexact two-stage stochastic programming model for water resources management under uncertainty. Civ. Eng. Environ. Syst. 2000, 17, 95–118. [Google Scholar] [CrossRef]
  28. Liu, B.; Liu, Y.K. Expected value of fuzzy variable and fuzzy expected value models. IEEE Trans. Fuzzy Syst. 2002, 10, 445–450. [Google Scholar]
  29. Trumbo, C.W.; McComa, K.A. The Function of Credibility in Information Processing for Risk Perception. Risk Anal. 2003, 23, 343–353. [Google Scholar] [CrossRef] [PubMed]
  30. The statistical yearbook of Henan province (SYH), 2000, China, 2001.
  31. The statistical yearbook of Henan province (SYH), 2004, China, 2005.
  32. The statistical yearbook of Henan province (SYH), 2009, China, 2010.
  33. The statistical yearbook of Henan province (SYH), 2013, China, 2014.
Figure 1. Study region.
Sustainability 10 01307 g001
Figure 2. Framework of land utilization pattern with consideration of ecological effect under uncertainties.
Sustainability 10 01307 g002
Figure 3. Water deficits without market approach when μ are 0.6 and 0.99. (low water flow denoted as L, low-medium water flow denoted as LM, medium water flow denoted as M, medium water flow denoted as MH).
Sustainability 10 01307 g003
Figure 4. Excessive pollutant discharges without market approach when μ is 0.6. (total nitrogen denoted as TN, total phosphorus denoted as TP).
Sustainability 10 01307 g004aSustainability 10 01307 g004b
Figure 5. Land trades between forest and agriculture when μ is 0.6 (grain plant is denoted as CP, oil plants is denoted as OP, vegetable is denoted as VP, economic forest is denoted as EP, shelter forest is denoted as SP, and forest park is denoted as FP).
Sustainability 10 01307 g005
Figure 6. The ecological effects with market approach when μ is 0.6.
Sustainability 10 01307 g006
Figure 7. The amounts of land trading and corresponding ecological benefits when μ is 0.6 (note: pollutant purification is denoted as PP, soil conservation is denoted as SI and water conservation is denoted as WC).
Sustainability 10 01307 g007
Figure 8. System benefits between market and non-market approach.
Sustainability 10 01307 g008
Table 1. Economic data.
SectorPeriod
t = 1t = 2t = 3
Net Benefit ($103/ha)
Farming corpsGrain(11.0 ✕ W M t m + 210.7)(8.0 ✕ W M t m + 229.0)(9.0 ✕ W M t m + 255.0)
Oil plants(23.0 ✕ W M t m + 203.3)(5.0 ✕ W M t m + 257.0)(7.0 ✕ W M t m + 260.7)
Vegetable(9.0 ✕ W M t m + 225.0)(8.0 ✕ W M t m + 237.0)(9.0 ✕ W M t m + 265.0)
Forest systemEconomic forest(5.5 ✕ W E A t n + 181.6)(11.5 ✕ W E A t n + 198.6)(11.5 ✕ W E A t n + 254.7)
Shelter forest(75.5 ✕ W E A t n + 177.0)(75.5 ✕ W E A t n + 202.0)(85.5 ✕ W E A t n + 237.6)
Forest park(75.5 ✕ W E A t n + 184.0)(145.5 ✕ W E A t n + 188.6)(85.5 ✕ W E A t n + 227.0)
Penalty of Water Deficit ($103/ha)
Farming corpsGrain(6.5 ✕ S M t m + 316.67)(8.0 ✕ S M t m + 329.0)(9.0 ✕ S M t m + 355.0)
Oil plants(23.0 ✕ S M t m + 303.9)(5.0 ✕ S M t m + 35.07)(7.0 ✕ S M t m + 360.6)
Vegetable(7.5 ✕ S M t m + 336.0)(7.0 ✕ S M t m + 341.3)(9.0 ✕ S M t m + 357.6)
Forest systemEconomic forest(5.5 ✕ S E A t n + 281.6)(11.5 ✕ S E A t n + 298.7)(11 ✕ S E A t n + 354.6)
Shelter forest(7.0 ✕ S E A t n + 277.0)(7.0 ✕ S E A t n + 302.0)(8.5 ✕ S E A t n + 337.8)
Forest park(7.0 ✕ S E A t n + 284.0)(14.0 ✕ S E A t n + 288.6)(8.5 ✕ S E A t n + 327.0)
Note: W M t m and W E A t n are expected land demands for crop and forest in period t (ha); S M t m and S E A t n are water deficit areas due to uncertain water availability in period t (ha).
Table 2. Modeling input.
Period
t = 1t = 2t = 3
Maximum irrigation scale (ha)Grain plant163516781724
Oil plant165189222
Vegetable plant350388416
TP discharge rate of crop irrigation (10−3 ton/ha year)Grain plant9.89.910
Oil plant9.19.19.2
Vegetable plant10.210.310.2
TN discharge rate of crop irrigation (10−3 ton/ha year)Grain plant0.430.450.46
Oil plant0.450.450.45
Vegetable plant0.520.520.53
Maximum allowance total TP discharge (103 ton/year)2.352.432.56
Maximum allowance total TN discharge (103 ton/year)0.330.360.39
Note: TP is total phosphorus, and TN is total nitrogen.

