Article

An Integrated Approach to Evaluate Urban Adaptive Capacity to Climate Change

Tourism College of Hunan Normal University, No.36, Lushan Road, Changsha 410081, China
*
Author to whom correspondence should be addressed.
Sustainability 2018, 10(4), 1272; https://doi.org/10.3390/su10041272
Submission received: 28 February 2018 / Revised: 17 April 2018 / Accepted: 17 April 2018 / Published: 20 April 2018
(This article belongs to the Section Sustainable Urban and Rural Development)

Abstract

:
Climate change and accelerated urbanization have posed severe challenges to urban development, resulting in a growing series of climate and environmental problems that have a significant impact on industrial production and urban life. In a developing country such as China, more than 57% of the population lives in urban areas. It is vital for these cities to adapt to climate-induced risks. A better understanding of how to improve adaptive capacity could enhance the ability to achieve a desirable state when the city experiences stress. This paper used an integrated approach for evaluating the urban adaptive capacity to climate change. It developed the evaluation index system of urban adaptive capacity (UAC) based on the driver–pressure–state–impact–response model (DPSIR), and adopted grey relational analysis (GRA) and the entropy method to analyze the level of UAC in Changsha, the capital city of Hunan Province, from 2006 to 2015. The results revealed that the UAC of Changsha showed a significant increase from 2006 to 2015. Among the five first-grade indicators, the response dimension had the greatest influence on the improvement of UAC. The study may provide suggestions for adaptive capacity building and sustainable development in other urban areas.

1. Introduction

Climate change and accelerated urbanization have posed severe challenges to urban development, resulting in a growing series of climate and environmental problems that have significant impacts on industrial production and urban life. It is expected that most urban growth will be concentrated in the developing world, with the urban population rising from 47% in 2011 to 67% in 2050 [1]. In a developing country such as China, 57.35% of the population lives in urban areas. The concentration of human, financial and manufactured capital makes cities especially vulnerable to climate change [2,3]. Due to their heavy reliance on lifeline systems such as transportation and water supply and power systems, cities are particularly threatened by climate change [4]. Climate change could exert pressure on existing problems in urban areas. Vulnerability to environmental change exists not only in physical or ecological systems, but also in its social–economic interactions [5,6,7]. For instance, high population density increases urban demand for water, leading to water stress, especially in the period of drought. In the 21st century, the expansion of urban scale and population agglomeration had amplification effects on extreme weather and climate disasters in China [8]. It is vital for these cities to adapt to climate-induced risks. A better understanding of how to improve adaptive capacity could enhance the ability to achieve a desirable state when a city experiences climate stress.
Scholars and policymakers have not reached a consensus on the definition of the term ‘adaptive capacity’ [9,10]. This notion derives from natural sciences, particularly evolutionary biology. Adaptive capacity plays an important role in sustainability and global change research. The IPCC (2014) defines adaptive capacity (AC) as “the ability of systems, institutions, humans, and other organisms to adjust to potential damage, to take advantage of opportunities, or to respond to consequences” [11]. It is often considered to be a critical theoretical foundation for planning adaptations or reducing vulnerability to achieve sustainable development in the context of climate change. In the field of global science, relevant concepts including adaptive capacity, vulnerability, resilience have been explored widely. However, the relationship between these three concepts is still not well articulated [12]. Engle (2011) argued that two concepts of vulnerability and resilience are uniquely linked through adaptive capacity, which is integral to both the vulnerability and resilience frameworks as shown in Figure 1 [13]. This may help us understand the pivotal role of adaptive capacity in the global change science. While the concept remains contested, it is widely accepted that the enhancement of adaptive capacity reduces vulnerabilities and fosters resilience, thereby achieving sustainable development [14,15,16]. As an inherent characteristic of a system, adaptive capacity enables the system to adjust to climate change (including climate variability and extremes), to moderate potential damages, to take advantage of opportunities, or to cope with the consequences [17]. Inspired by resilience theory, some scholars presented proactive adaptation [18], which suggests the system moves into a new state, in spite of returning to a previous state. This perspective has been adopted in practice. For example, instead of striving for exploiting resources, promoting low-carbon economic development through tourism has been proven to be an effective transformation for resources-exhausted cities in China [19]. In conclusion, a system needs to adjust itself to change to return to initial stability, even achieve reorganization and renewal. Therefore, for urban areas, adaptive capacity refers to the ability of the urban system to respond to change and maintain its basic function, even transform itself. An urban system with more adaptive capacity has a greater chance to be resilient in the face of climate stress. As a result, it is of significance to assess urban adaptive capacity (UAC), which can foster positive real-world action that enhances the adaptive ability of a given system [20].
An increasing number of works have discussed the issue of adaptive capacity to climate change. This has varied from sectoral researches(e.g., for the European forest [21] and the Western Australian agriculture [22], fisheries [23], non-profit organizations [24] to different spatial scales studies (e.g., for the nation [25,26], river basins [27], municipality [28], community [29,30], individual [31]). It is noted that adaptive capacity can be generic or specific [32,33]. The generic indicators reflect a kind of comprehensive ability represented by education, income and health while the latter refers to the ability to respond to some particular climate risks such as floods or droughts. Within this study, we focus on the former. Furthermore, adaptive capacity is “an aggregated condition” [34,35]. The Intergovernmental Panel on Climate Change (IPCC) Third Assessment Report therefore identified several determinants of adaptive capacity [35]. In particular, there is a growing body of research on urban areas. For instance, Acosta et al. [36] (2013) constructed an index based on three components: awareness, ability and action for the European region. Later this was adopted in other studies (Greiving, 2011; Juhola et al., 2012) [37,38]. Pelling [39] used the adaptive cycle theory to analyze the adaptive capacity in two Mexican urban centers. Xie et al. [40] analyzed the adaptive capacity of 16 districts in Beijing. Jin [41] explored the regional discrepancy of coping capacity in China. It is fair to say these efforts have great implications for future studies.
In summary, existing research mainly either established index system in terms of social, economic and ecological dimensions, through the single index or efficiency measurement, or focused on one specific sector in the urban context, thereby being reluctant to comprehensively evaluate the complex situation of urban adaptive capacity. Adaptation is a complex social phenomenon in which climate risk is negotiated and acted upon in diverse social and environmental contexts [42]. One widely acknowledged lesson is that adaptations are rarely undertaken in response to climate change effects alone [43]. They could be “highly context and actor specific” [44]. In addition, adaptation strategies can range from short-term to longer-term activities [45]. Moreover, a city is a complex social-ecological system [46,47,48,49], which needs a systems approach to gain insights [50]. Thus, we consider a framework to support dynamic analysis of this complex coupled system. As a result, this paper establishes a comprehensive index system based on the driver–pressure–state–impact–response framework (DPSIR) as shown in Figure 2 [51]. The framework is regarded as a powerful tool that can provide a structural examination and present the indicators needed to support feedback for policy decisions [52]. The city is also a grey system for which information is partly uncertain [53,54]. Hence, both grey relational analysis (GRA) and the entropy method also have been adopted in this study. Grey relational analysis is derived from grey system theory, which provides a simple method to analyze systems, even if the information is incomplete or uncertain. However, shortcomings of the GRA have been confirmed such as a tendency controlled by a relation measure value of a certain point, and information lost [55]. Therefore, in order to embody the characteristics of each relation measure value, each indicator needs to be given a certain weight. As an objective weighting method, the entropy method was introduced to ensure objectivity and fully consider the information provided by the evaluation index. Based on this, many scholars have combined entropy weight theory with the grey relation method to carry out research. This integrated approach has been adopted in the research field of urban ecosystems [56], land quality [57] and air quality [58], and is recognized as an efficient method to explore environment-related issues.
The objectives of the study are: (1) to propose a comprehensive evaluation method of UAC; (2) to reveal dynamic trends in the development of UAC in Changsha; and (3) to provide references for more rational decisions in urban climate change adaptation. The remainder of this paper is organized as follows: Section 2 describes the method and study area; Section 3 presents results and discussions; and the conclusions are summarized in Section 4.

2. Study Area and Method

2.1. Study Area

Changsha was chosen as the case study for this research for two reasons. First, it plays an important role in the node cities of the Yangtze River and its economic belt. For Changsha, adapting to climate change is of great significance for achieving regional sustainable development. Second, great progress had been made in ecological development including conserving resources and protecting the environment. It is rational to explore this successful experience, which is of great significance to the practices of climate adaptation in other cities.
Changsha is located in the mid-eastern part of Hunan Province, which lies between 111°53′ and −114°15′ E and 27°51′ and 28°44′ N, as shown in Figure 3. The land area is 118,190 km2, of which 1909.86 square kilometers are urban. The area is a continental subtropical seasonal humid climate with an annual average temperature of 17.2 degrees Celsius and average annual rainfall of 1361.6 mm. The city is not only the economic core growth pole, but also the model of sustainable development in Hunan. In 2017, the total GDP of Changsha was 10,535.51 billion yuan, an increase of 9% compared with that of last year, accounting for 30.5% of total GDP in Hunan. With economic development, the issue of environment has been paid greater attention in this area. In December 2007, the Changsha–Zhuzhou–Xiangtan urban agglomeration was approved by the State Council as a comprehensive pilot zone for building a “Two-Oriented” society (resource-conserving and environment-friendly). “Two-Oriented” society requires the development of “decoupling” between energy consumption and pollution discharge, which also calls for the coordination of the social economy, population, resources and environment. A great number of initiatives and projects were initiated to promote urban ecological quality and the built environment. In 2016, Changsha City was named the “2016 China Sustainable City”. It can be regarded as an encouraging achievement in the initial period.
However, the challenges that climate change pose to Changsha need to be addressed seriously. On the one hand, average climate conditions such as temperature, precipitation and humidity are confirmed in Changsha as shown in Table 1. It was found that the temperature in Changsha has shown a rising trend during the last 56 years, which has been particularly obvious in the last 20 years [59]. On the other hand, the frequency, intensity and severity of climate extremes are increasing [60,61]. Rainstorm and heatwaves are the two major environmental problems cities face currently. A study of Changsha revealed that the number of torrential rain days has increased in the last 35 years [62]. Other research indicated the frequency and intensity of heatwaves show a stepwise variation characteristic in the last 64 years, and after 2000, have been increasing significantly; the intensity is also strengthening [63]. Expenditure on natural disaster relief in Hunan shows an increasing trend as shown in Figure 4 except for 1998 (in 1998, Xiangjiang River in Changsha reached a record of 39.18 meters set by a massive flood, while it reached a record of 39.51 m in 2017), which may be empirical evidence attesting to the severity of the climate extremes.

2.2. Index System and Data Collection

The establishment of an evaluation index system for UAC is a key issue in the study of urban climate change adaptation. This article develops an index system based on the DPSIR framework. It is a framework developed by the European Environmental Agency (EEA), aiming to explore the interactions between human society and the ecological environment [64]. This model has been verified as having an advantage in comprehending the cause and persistence of environmental problems [65]. It is generally accepted that the city is a complex adaptive system coupled with a social and ecological system [50,66,67]. As the largest interface between man and nature, the city needs to tackle a series of challenges, from social to environmental aspects. One promise of this analytical framework is that it can help to understand the dynamic structure of the complex system and connect conceptual explorations across social and natural sciences [68,69,70]. The driving forces mainly result from people’s needs for food, water and land. Hence, such a framework normally refers to human social–economic activities, which will put pressure on the environment. The pressures are the effects on the surrounding resources and environment as a result of production and consumption activities/processes. Consecutively, the pressures lead to changes in the state of the environment, which is understood as the environmental quality in relation to physical, biological and chemical conditions. The changes induce environmental or economic impacts on human systems or on ecosystems. Responses from society or policymakers mean taking a series of institutional, economic and administrative measures to minimize these impacts.
Based on principles that are scientific, representative, objective, dynamic and feasible, this paper selects five first-grade indicators in terms of Driver, Pressure, State, Impact, Response, including 33 second-grade indicators to evaluate the urban adaptive capacity to climate change in Changsha (Table 2). The index of Driver includes rate of population growth, rate of urbanization and rate of GDP growth. These three indicators reflect the need for urban development, which are the potential cause of the change in the urban environment. The Pressure dimension includes seven second-grade indicators: x 4 ~ x 7 reflect the pressure exerted by human’s production/consumption activities. Changes in land use are represented by built-up area and urban construction land-use areas. Population density is considered to be a pressure on traffic, housing and other social-ecological resources. The State indicator includes eight secondary indexes: these selected indicators reflect the state of the ecological environment such as percent of air quality days, per capita water availability, green area coverage rate in a developed area, per capita cultivated area, and area of natural reserves. Taking the area of natural reserves as an example, this is built for coordinating the relationship between human and nature, which ensures reasonable and orderly spatial development in urban area. In addition, economic conditions are represented by the proportion of the added value of tertiary industry in GDP and the customer price index. The Impact indicator consists of seven secondary indexes: the economic impact is represented by four indicators including income of urban households, per capita total retail sales of consumer goods, rate of unemployment, and household savings deposits. As for physical impact, two indicators are considered such as Total floor space of dilapidated buildings at year-end and per capita floor space of residential buildings. Output of grain reflects the impact on the food supply. The Response indicator consists of eight secondary indexes: the level of urban educational development could contribute to climate adaptation, which is represented by the number of students in higher education. Economic resources, fixed assets and financial funds are an important part of the evaluation of adaptive capacity [71], which are represented by environmental protection expenditure, and public budget expenditure. Technology and basic infrastructure are considered important factors enhancing the adaptive capacity to climate change. A total of five typical indictors are selected including ratio of waste water treatment by sewage disposal, percentage of solid wastes utilized, number of beds per person, number of mobile telephone users at the year-end, number of internet users.
The required data came from the Hunan Statistics Yearbook, the China Urban Statistical Yearbook, the China Urban Construction Statistics Yearbook, the Statistical Bulletin of National Economy and Social Development, and the Water Resources Bulletin (Hunan Statistics Bureau, 2006–2015).

2.3. The Entropy Method

This study applies the entropy method to calculate the weight of these indicators, which can minimize and avoid the subjective factors and some objective limitations, and then evaluates the adaptive capacity to climate change through the weighted sum method. The concept of entropy was originally derived from the thermodynamics concept in physics, mainly reflecting the degree of chaos of the system, which has been widely used in the field of sustainable development evaluation and socio-economic research [72,73,74]. According to information theory, entropy is a measurement of the disorderly degree of a system, and information is a measurement of ordering. In the index data matrix X, the greater the degree of discretization of the data, the smaller the information entropy, the greater the amount of information it provides, and the greater the impact of the index has on the comprehensive evaluation, and hence its weight should be greater, and vice versa. The main steps are as follows:
Normalization of data: when the larger the index value the more favorable the system, the calculation method of a positive index value is adopted: X i j = X i j m i n { X j } max { X j } m i n { X j } ; when the smaller the index value the more favorable the system, the calculation method of a negative index value is adopted: X i j = m a x { X i j } X i j max { X j } m i n { X j } .
Calculate the weight of the item j of year i :   Y i j = X i j / X i j .
Calculate index’s information entropy: e j = k i = 1 m ( Y i j × ln Y i j ) , k = 1 ln m ,0 e i 1 .
Calculate the information entropy redundancy: d j = 1 e j
The weight of index: w i = d i / j = 1 n d j
The mark of each index: S i j = w i × X i j
The overall mark of the year i : S i = j n S i j
In the formula: X i j represents the value of the item j of year i , m i n { X j } and m a x { X j } indicate the maximum and minimum value of item j among all years, respectively, of which m as the number of years to be evaluated, n as the number of indexes to be evaluated.

2.4. Grey Relational Analysis (GRA)

Grey relational analysis (GRA) was developed to analyze the dynamic trend of a system development created by Deng. As one of the most widely used models of grey system theory, it focuses on “the partial information is known, and the partial information is unknown”, “small sample and poor information” uncertainty system [75]. Its advantage is the quantitative comparison analysis of influence factors in the system’s dynamic development trend [76]. GRA has been applied to many research fields such as ecology, economy and environment etc. [45,46,47]. Due to the latent nature of adaptive capacity and its dynamic characteristic, it is rational to apply GRA to analyze the urban adaptive capacity to climate change. The calculation steps are as follows:
(1)
Select the optimum value from the sample and construct the reference sequence:
x 0 = { x 0 ( k ) | k = 1 , 2 , n } = ( x 0 ( 1 ) , x 0 ( 2 ) , x 0 ( n ) )
The compared sequence is,
x i = { x i ( k ) | k = 1 , 2 , n } = ( x i ( 1 ) , x i ( 2 ) , x i ( n ) ) , i = 1 , 2 , m
(2)
Then the formula of the grey relational grade for the compared series x i in terms of weight w k is as follows,
r i = k = 1 n ξ i ( k ) × w k
In which, w k is the k-th weight of ξ 0 i = ξ ( x 0 ( k ) , x i ( k ) ) and
ξ ( x 0 ( k ) , x i ( k ) ) = m i n i , k | x 0 ( k ) x i ( k ) | + ρ m a x i , k | x 0 ( k ) x i ( k ) | | x 0 ( k ) x i ( k ) | + ρ m a x i , k | x 0 ( k ) x i ( k ) |
The grey relational grades of the different compared series provide a ranking of the alternatives, in which a higher value determines a better alternative. According to the grey relational grade, the development of urban adaptive capacity was divided into four classes (Table 3).

3. Results and Discussions

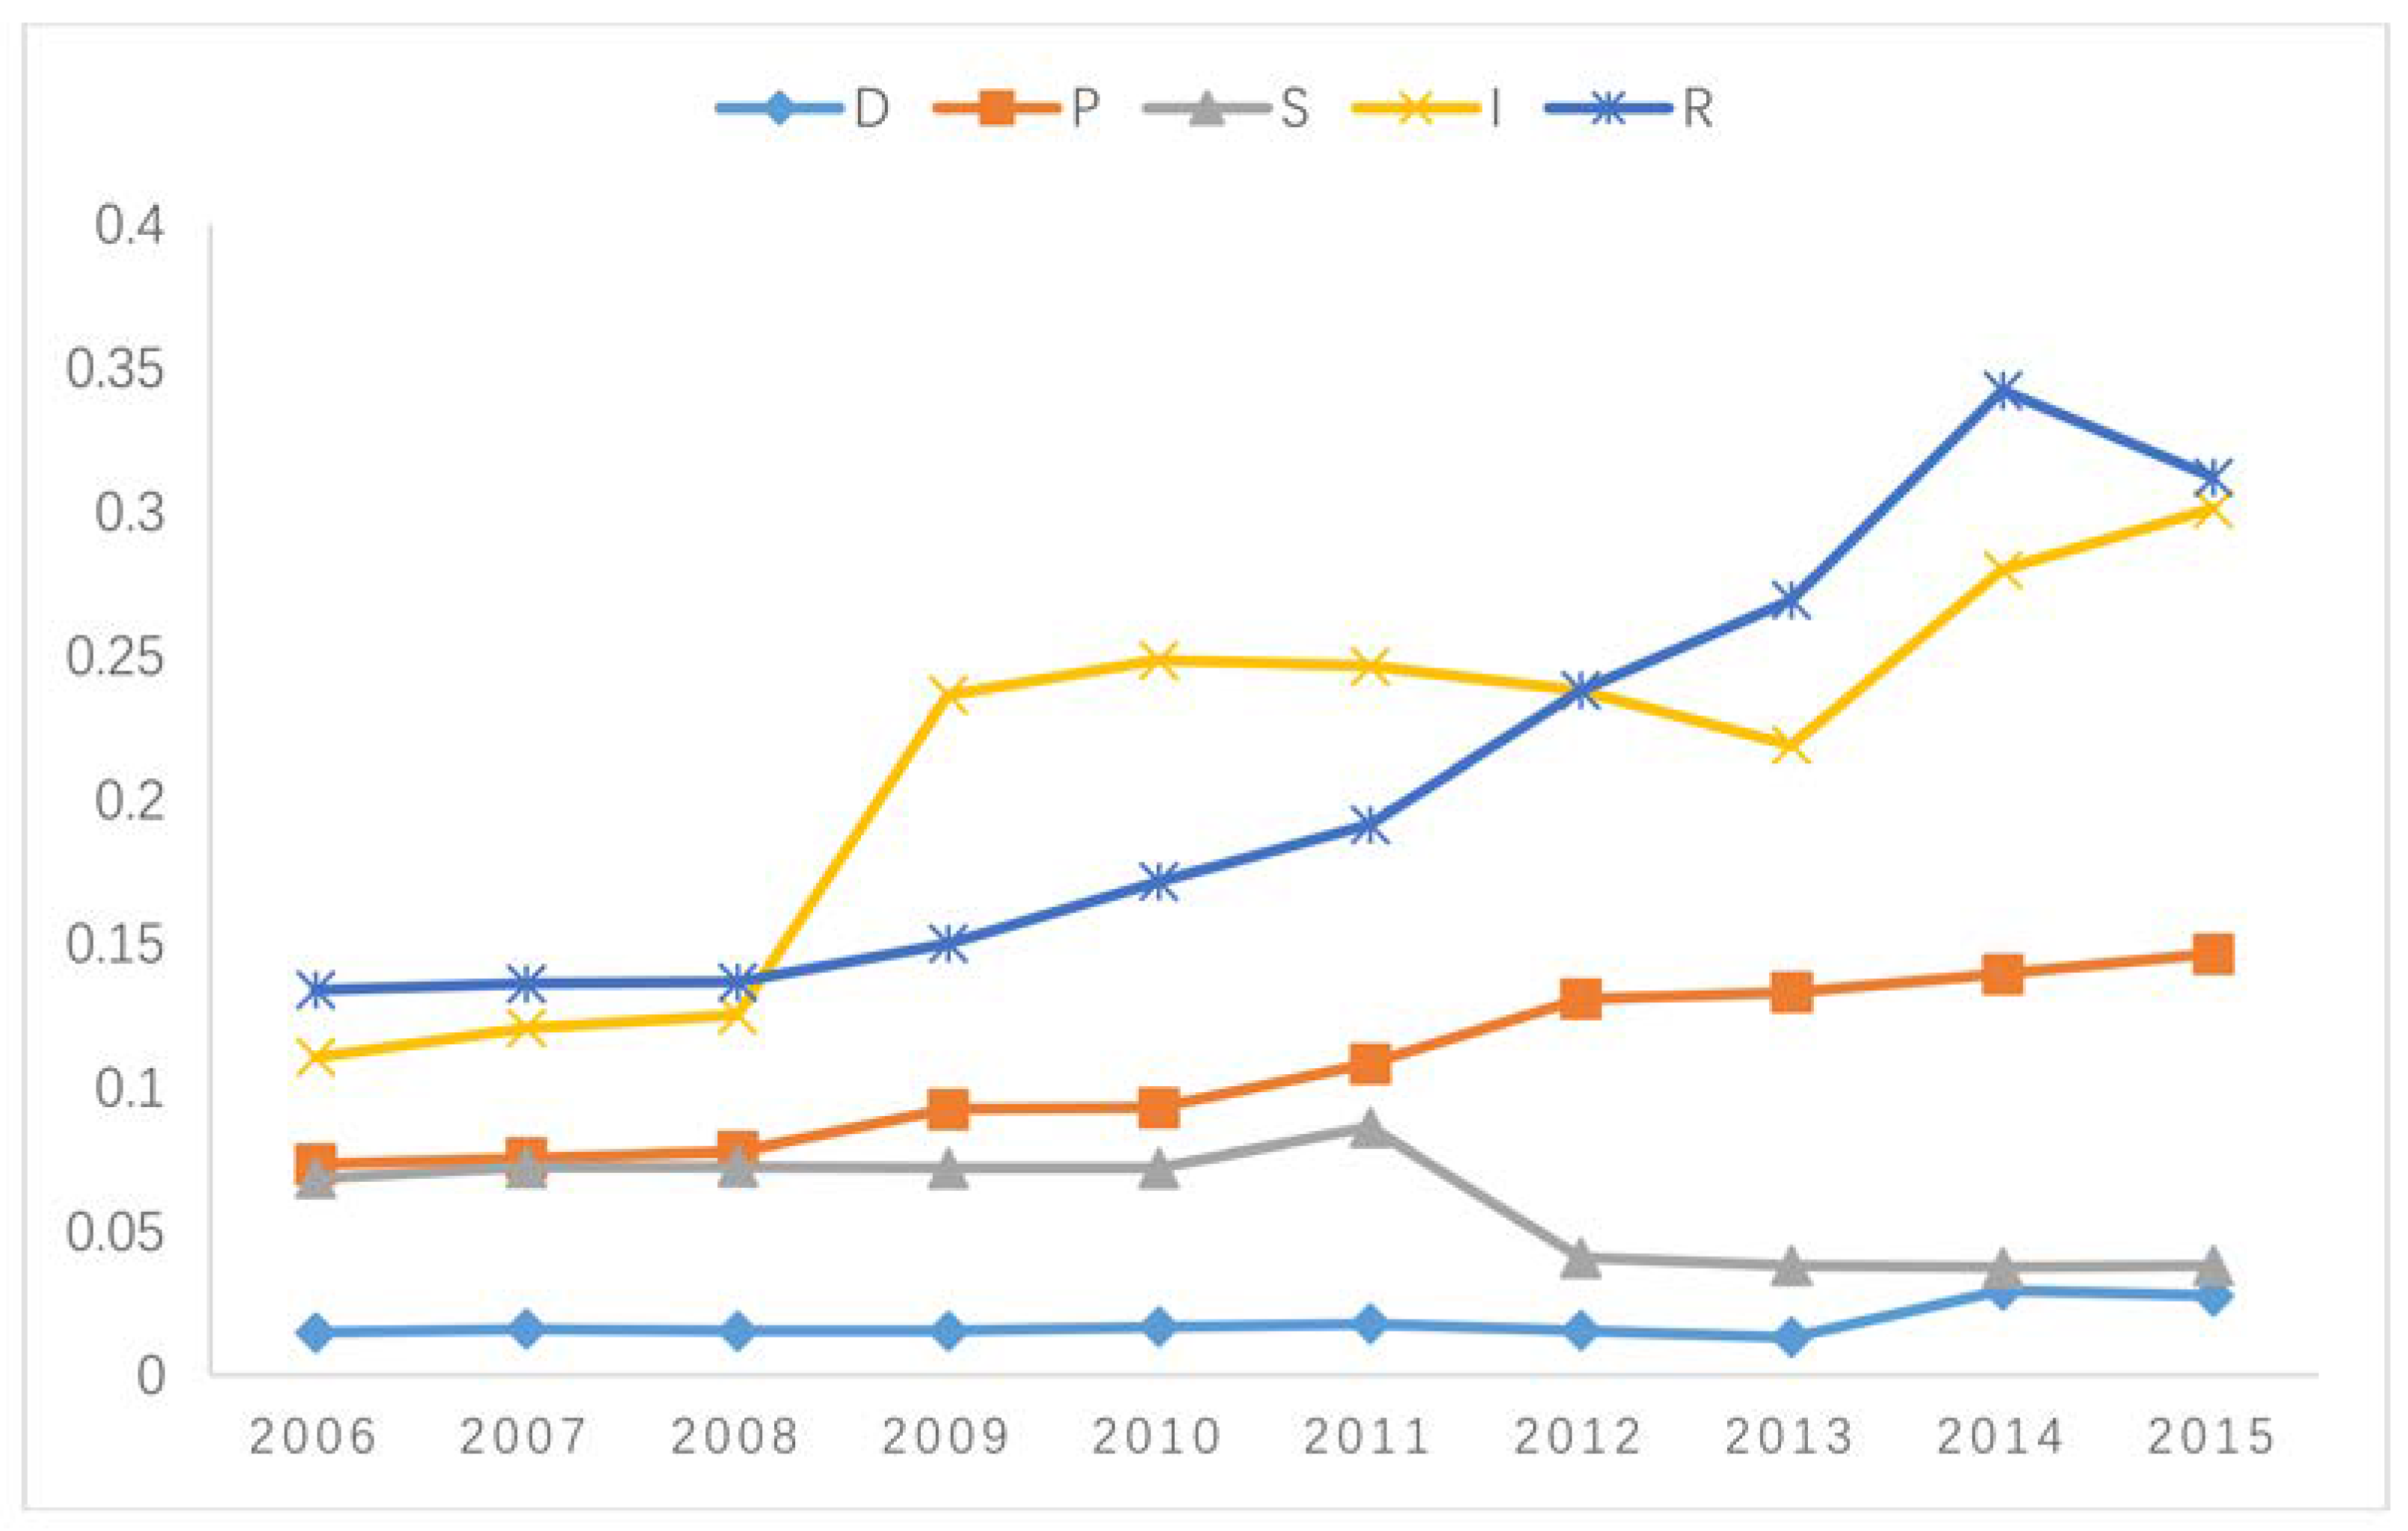
3.1. Results of the Level of Influenced Factors

Following the steps of the entropy method, the weight of each indictor was calculated by Excel. Based on the calculated results, the weight of the five first-grade indicators was obtained by summing secondary indexes, respectively. As shown in Table 4, the top four indicators that had a significant effect on UAC were volume of industrial waste water discharged of unit GDP ( x 6 ), year-end total floor Space of dangerous uses ( x 23 ), expenditure on environmental protection ( x 27 ), and public budget expenditure ( x 28 ). All told, these indicators accounted for 52% of the total impact. In general, the Response dimension was the most important factor influencing the overall level of adaptive capacity, accounting for 38% of the total impact, and was accordingly the most important factor influencing development of the UAC. It was followed by the Impact dimension, the Pressure dimension, the State dimension and the Driver dimension.
As illustrated in Figure 5, the comprehensive level of Driver factors increased slowly from 2006 to 2013, with an upward trend from 2013 to 2014, then fluctuated a little in 2015. It was found that the percentage of the rate of GDP growth in the Driver dimension is decreasing while the population growth shows an increasing trend, which reflects that the issue of population deserves more attention. The overall level of Pressure showed an increasing trend from 2006 to 2015. It reached the maximum value (0.147) in 2015. The volume of industrial waste water discharged per unit GDP has the most effect on the level of the Pressure factor, followed by the volume of industrial waste emission discharged per unit GDP. The proportion of built-up area and construction land-use area decreased slowly over the period 2006 to 2015. Unlike other factors, the State dimension remained relatively constant first, then increased, and decreased rapidly from 2006 to 2015. Two factors (per capita water volume and area of natural conservation) made a major contribution to enhance the state, followed by the percentage air quality days. The level of impact fluctuated largely from 2006 to 2015 in Changsha. The highest value was 0.312 in 2015 (Figure 5). Year-end total floor space of dangerous uses has significant influence on the impact dimension. It can be observed that the trend of Response was fairly consistent with the level of urban adaptive capacity during 2006 to 2015. Public budget expenditure and environmental protection expenditure take larger proportions of the Response dimension.

3.2. Results of Overall level of UAC

The results showed that Changsha city had made an improvement in enhancing its urban adaptive capacity. The overall level of UAC presented a growing trend from 2006 to 2015 in Changsha (Figure 6). The highest value was 0.829 in 2014 and the lowest was 0.402 in 2006. This increased smoothly from 2005 to 2008. The level jumped from 2008 to 2009, then it showed a levelling off. It peaked in 2014 and then experienced a slight fluctuation in 2015. In recent years, the Changsha government has constantly promoted the city’s economic transformation and environmental protection. The local government has been making great efforts to make the urban economy more climate-friendly and less energy-consuming. By vigorously developing modern service industry and high-tech industry as well as new strategic industry, the economic structure evolved from “dominance of one industry” to “multipolar development”. For instance, as the “green engine” for the economic development and urban construction in “Two-Oriented” cities, tourism is paid more attention in urban green development, which has inherent advantages in economic restructuring and upgrading. According to the IPCC, transformations in economic, social, technological and political decisions and actions can enhance adaptation and promote sustainable development [2]. In particular, after its establishment as a “Two-Oriented” society in 2007, the city has pledged to continue improving its urban and rural environment. Many green public spaces and municipal facilities have been created. At the same time, achievements have been made in terms of promoting clean energy, developing green transportation, and scientific waste treatment.
Based on the grades of grey relational analysis (Table 5), the development of UAC can be divided into three stages: in the first period (2006~2009), the value increased from 0.40 to 0.56. Despite its high maladaptation, it showed a distinct uptrend during 2008 to 2009, with the inflection point occurring in 2008 (Figure 5). Since its approval as a “Two-Oriented” pilot zone at the end of 2007, a number of projects focused on people’s wellbeing and environmental protection have been launched. In 2008, substantial investment was committed to urban infrastructure projects, up to 12.25 billion yuan. A number of projects integrated with municipal and tourism functions were launched, such as “one island plus two riverbanks “, Yuelu Mountain scenic protection–promotion project, and the riverside scenery belt. On the one hand, this contributed to the improvement of the destination’s image and environment, which could potentially attract more visitors and investors, resulting in the growth of the economy. On the other hand, it improved public wellbeing by making the city more livable, which could foster social cohesion and induce pro-environmental behavior. The integration and interrelation of economic–social–environmental sub-systems are considered to enhance sustainable development [77]. As a result, urban comprehensive carrying capacity was further upgraded. Nevertheless, as these measures were still in their early stages, the city experienced great difficulty coping with climate risks efficiently, such as the ice disaster in 2008. The second period (2010~2013): the UAC developed smoothly and steadily in these four years. In 2011, the integration of urban comprehensive services and landscape scenery was further emphasized in the process of revising the “Master Plan”. Along with the previous efforts, the city finally reached the stage of slight adaptation. A great endeavor was made to ensure and boost civil welfare. The initiative of the transit metropolis was launched to enhance both transportation and environmental conditions. The development of the demonstration plot with a public cultural service system was considered among the Top 2 in China. The third period (2014~2015): the level of urban adaptive capacity was above 0.8 between 2014 and 2015, with a slight fluctuation. It was at the situation of favorable adaptation. According to the China Sustainable Cities Report 2016, Changsha was ranked 13th by the Urban Ecological Input Index among 35 large and medium-sized cities in China. Changsha also was identified as one of the most sustainable cities in China [78].

3.3. Discussion

Compared with previous studies, this integrated approach has proposed an effective way to assess the degree of urban adaptive capacity in China. The construction of an index system is important for UAC evaluation. In previous studies [32,33,34,36], most indicators were simply constructed either in terms of social, economic or physical dimensions etc., or in terms of some abstract concept that is hard to contextualize or collect data about. The application of the DPSIR model to assess the sustainability of development initiatives reproduces problematic hierarchies and power relations at least partially responsible for project failures and other troubling outcomes of development efforts [54]. Based on the DPSIR model, this study developed critical indexes, which are closely associated with the special goals of urban sustainability in the context of climate change and urbanization, with effective references to future research. The level of the urban adaptive capacity was analyzed by grey relational analysis, which can overcome some practical and unavoidable barriers. The weight for each indicator was calculated by the entropy method, which offers a higher level of objectiveness and credibility.
This paper assessed the dynamic change in the level of UAC in the case study. The level of UAC increased from 0.402 in 2006 to 0.826 in 2015, growing by about 100%. The UAC evolved from high maladaptation to favorable adaptation. This reveals that the city has made great improvements in building its UAC. Many influencing factors have contributed to this. Among these, the Response factor has played a key role in this transformation, with an increase from 0.134 to 0.312 between 2006 and 2015. According to the analysis of the determinants, a total of four indicators have had great impact on the UAC in relation to water, households and wealth. Hence, these issues should be given priority in research. Water availability and quality are becoming an increasing focus in China. The river chief system and Sponge City concepts have been introduced to increase the water sector’s resilience. The household is the basic unit in urban areas. The housing situation not only represents the physical capacity to cope with climate change, but also reflects equality in the city, which is regarded as a positive factor. Due to historical reasons and socio-economic development, shantytown renovation remains a long and uphill journey. Wealth here mainly means the investment in public welfare. Economic development can surely lay a solid foundation for climate adaptation. By adopting “techno-organizational reorganization and policy support” the desirable changes could be achievable [79].

4. Conclusions

This paper used an integrated approach for evaluating the UAC in the context of climate change. It developed the evaluation index system of urban adaptive capacity based on the DPSIR model, and adopted the grey relational analysis (GRA) and entropy methods to analyze the adaptive capacity level of Changsha in Hunan Province from 2006 to 2015. By combining the DPSIR model, GRA and entropy methods, the application to the case study of Changsha has proven an effective approach for evaluating the level of UAC. The main findings of the adaptive capacity evaluation for Changsha may help us to understand the development of UAC in the city. The UAC showed a significant increase from 2006 to 2015, and the Response factor has had the greatest influence on the improvement of UAC. The study may provide suggestions for adaptive capacity building and sustainable development in other urban areas.
There are also limitations in this research. First, the evaluation index of the UAC may not reflect the real situation completely due to the limitations of accessing related data. It also needs to test its validity and practicability in other cities in China. Second, the evaluation index may need to be updated after a period of time since the development of UAC was subjected to a complicated evolution. Third, an urban agglomeration-level investigation may assist in a better understanding of the city’s adaptive capacity in relation to other inter-linked urban systems. Since Changsha is identified as a part of the Chang–Zhu–Tan urban group, it interacts with other urban systems constantly. It makes sense to explore this urban adaptive capacity coordination relationship at this important scale.

Acknowledgments

The authors wish to acknowledge the support of the Hunan Province Philosophy and Social Science Planning Fund Project (No. 16ZWC68), the Hunan Science and Technology Innovation Decision Consultation and Soft Science Key Project (No. 2017ZK3061), and the Hunan Social Science Achievements Evaluation Committee Key Subject (XSP18ZDI007). Dr. Min Jiang is acknowledged for constructive comments. The anonymous referees are acknowledged for their valuable comments.

Author Contributions

Xiaorong He made contributions to the study design. Qiangsheng Hu was in charge of writing the manuscript. Both authors reviewed and edited the manuscript, and read and approved the final manuscript.

Conflicts of Interest

The authors have declared that no conflict of interest exists.

References

  1. UN-DESA. World Urbanization Prospects the 2011 Revision; United Nations, Department of Economic and Social Affairs (DESA): New York, NY, USA, 2011; Available online: http://www.un.org/en/ development/desa/population/publications/pdf/urbanization/WUP2011_Report.pdf (accessed on 1 February 2018).
  2. IPCC (The Intergovernmental Panel on Climate Change). Climate Change 2014: Synthesis Report. Contribution of Working Groups I, II and III to the Fifth Assessment Report of the Intergovernmental Panel on Climate Change. Available online: https://www.ipcc.ch/report/ar5/wg2/ (accessed on 1 February 2018).
  3. Climate Change and Cities. First Assessment Report of the Urban Climate Change Research Network. Available online: http://www.iddri.org/Publications/Rapports-and-briefing-papers/ARC3%20report.pdf (accessed on 1 February 2018).
  4. Schauser, I.; Otto, S.; Schneiderbauer, S.; Harvey, A.; Hodgson, N.; Robrecht, H.; Morchain, D.; Schrander, J.; Khovanskaia, M.; Celikyilmaz-Aydemir, G.; et al. Urban Regions: Vulnerabilities, Vulnerability Assessments by Indicators and Adaptation Options for Climate Change Impacts: Scoping Study; ETC/ACC Technical Paper 2010/12, December 2010; The European Topic Centre on Air and Climate Change (ETC/ACC): Bilthoven, The Netherlands, 2010; Available online: http://acm.eionet.europa.eu/reports/docs /ETCACC_TP_2010 _12_Urban_CC_Vuln_Adapt.pdf (accessed on 1 February 2018).
  5. Adger, W.N. Vulnerability. Glob. Environ. Chang. 2006, 16, 268–281. [Google Scholar] [CrossRef]
  6. Cutter, S.L.; Boruff, B.J.; Shirley, W.L. Social vulnerability to environmental hazards. Soc. Sci. Q. 2003, 84, 242–261. [Google Scholar] [CrossRef]
  7. Modica, M.; Zoboli, R. Vulnerability, resilience, hazard, risk, damage, and loss: A socio-ecological framework for natural disaster analysis. Web Ecol. 2016, 16, 59–62. [Google Scholar] [CrossRef]
  8. Qin, D.; Zhang, J.; Shan, C. China National Assessment Report on Risk Management and Adaptation of Climate Extremes and Disasters; Science Press: Beijing, China, 2015; p. 182. (In Chinese) [Google Scholar]
  9. Thywissen, K. Core terminology of disaster reduction: A comparative glossary. In Measuring Vulnerability to Natural Hazards: Towards Disaster Resilient Societies; Birkmann, J., Birkmann, J., Eds.; United Nations University Press: Tokyo, Japan, 2006; pp. 448–496. [Google Scholar]
  10. Hinkel, J. Indicators of vulnerability and adaptive capacity: Towards a clarification of the science-policy interface. Glob. Environ. Chang. 2011, 21, 198–208. [Google Scholar] [CrossRef]
  11. IPCC. Impacts, Adaptation and Vulnerability (Contribution of Working Group II to the Five Assessment Report of the Intergovernmental Panel on Climate Change. Annex II: Glossary; Cambridge, UK). Available online: https://www.ipcc.ch/report/ar5/wg2/ (accessed on 1 February 2018).
  12. Cutter, S.L.; Barnes, L.; Berry, M.; Burton, C.; Evans, E.; Tate, E.; Webb, J. A place-based model for understanding community resilience to natural disasters. Glob. Environ. Chang.-Hum. Policy Dimens. 2008, 18, 598–606. [Google Scholar] [CrossRef]
  13. Engle, N.L. Adaptive capacity and its assessment. Glob. Environ. Chang-Hum. Policy Dimens. 2011, 21, 647–656. [Google Scholar] [CrossRef]
  14. Goklany, I.M. Strategies to enhance adaptability: Technological change, sustainable growth and free trade. Clim. Chang. 1995, 30, 427–449. [Google Scholar] [CrossRef]
  15. Cohen, S.; Demeritt, D.; Robinson, J.; Rothman, D. Climate change and sustainable development: Towards dialogue. Glob. Environ. Chang. 1998, 8, 341–371. [Google Scholar] [CrossRef]
  16. Folke, C.; Carpenter, S.; Elmqvist, T.; Gunderson, L.; Holling, C.S.; Walker, B. Resilience and Sustainable Development: Building Adaptive Capacity in a World of Transformations. Ambio 2002, 31, 437–440. [Google Scholar] [CrossRef] [PubMed]
  17. McCarthy, J.J.; Canziani, O.F.; Leary, N.A.; Dokken, D.J.; White, K.S. Climate Change 2001: Impacts, Adaptation, and Vulnerability; Cambridge University Press/Intergovernmental Panel on Climate Change: New York, NY, USA, 2001; p. 21. [Google Scholar]
  18. Easterling, W.E.; Hurd, B.; Smith, J. Coping with Global Climate Change: The Role of Adaptation in the United States. Paper Prepared for the Pew Center on Global Climate Change. Available online: http://www.pewtrusts.org/~/media/legacy/uploadedfiles/wwwpewtrustsorg/reports/global_warming/pewclimate0704pdf.pdf (accessed on 1 February 2018).
  19. Zhang, J.; Hu, J. Transformation of resource exhausted cities to low carbon economy: Tourism Resources Development-Taking Gejiu City as an example. J. Anhui Agric. Sci. 2011, 39, 5459–5462. [Google Scholar]
  20. Whitney, C.; Bennett, N.; Ban, N.; Allison, E.; Armitage, D.; Blythe, J.; Burt, J.; Cheung, W.; Finkbeiner, E.; Kaplan-Hallam, M.; et al. Adaptive capacity: From assessment to action in coastal social-ecological systems. Ecol. Soc. 2017, 22. [Google Scholar] [CrossRef]
  21. Lindner, M.; Maroschek, M.; Netherer, S.; Kremer, A.; Barbati, A.; Garcia-Gonzalo, J.; Seidl, R.; Delzon, S.; Corona, P.; Kolstrom, M.; et al. Climate change impacts, adaptive capacity, and vulnerability of European forest ecosystems. For. Ecol. Manag. 2010, 259, 698–709. [Google Scholar] [CrossRef]
  22. Allison, H.; Hobbs, R. Resilience, adaptive capacity, and the “Lock-in Trap” of the Western Australian agricultural region. Ecol. Soc. 2004, 9, 3. [Google Scholar] [CrossRef]
  23. Armitage, D. Adaptive capacity and community-based natural resource management. Environ. Manag. 2005, 35, 703–715. [Google Scholar] [CrossRef] [PubMed]
  24. Orley, C. Adaptive Capacity as a Proactive Approach. Ph.D. Thesis, Fielding Graduate University, Santa Barbara, CA, USA, 2012. Available online: https://www.researchgate.net/publication/308093747_Adaptive_Capacity_as_a_Proactive_Approach (accessed on 1 February 2018).
  25. Chen, M.; Sun, F.; Berry, P.; Tinch, R.; Ju, H.; Lin, E. Integrated assessment of China’s adaptive capacity to climate change with a capital approach. Clim. Chang. 2015, 128, 367–380. [Google Scholar] [CrossRef]
  26. Meenawat, H.; Sovacool, B.K. Improving adaptive capacity and resilience in Bhutan. Mitig. Adapt. Strateg. Glob. Chang. 2011, 16, 515–533. [Google Scholar] [CrossRef]
  27. Engle, N.L.; Lemos, M.C. Unpacking governance: Building adaptive capacity to climate change of river basins in Brazil. Glob. Environ. Chang. 2010, 20, 4–13. [Google Scholar] [CrossRef]
  28. Brooks, N.; Adger, W.N.; Kelly, P.M. The determinants of vulnerability and adaptive capacity at the national level and the implications for adaptation. Glob. Environ. Chang. 2005, 15, 151–163. [Google Scholar] [CrossRef]
  29. Warrick, O.; Aalbersberg, W.; Dumaru, P.; McNaught, R.; Teperman, K. The ‘Pacific adaptive capacity analysis framework’: Guiding the assessment of adaptive capacity in Pacific Island communities. Reg. Environ. Chang. 2017, 17, 1039–1051. [Google Scholar] [CrossRef]
  30. Wall, E.; Marzall, K. Adaptive capacity for climate change in Canadian rural communities. Local Environ. 2006, 11, 373–397. [Google Scholar] [CrossRef]
  31. Grothmann, T.; Patt, A. Adaptive capacity and human cognition: The process of individual adaptation to climate change. Glob. Environ. Chang. 2005, 15, 199–213. [Google Scholar] [CrossRef]
  32. Monterroso, A.; Conde, C. Adaptive capacity: Identifying the challenges faced by municipalities addressing climate change in Mexico. Clim. Dev. 2017, 1–13. [Google Scholar] [CrossRef]
  33. Adger, W.N.; Agrawala, S.; Mirza, M.; Conde, C.; O’Brien, K.L.; Pulhin, J.; Pulwarty, R.; Smit, B.; Takahashi, K. Assessment of adaptation practices, options, constraints and capacity. In Climate Change 2007: Contribution of Working Group II to the Fourth Assessment Report of the Intergovernmental Panel on Climate Change; Parry, M.L., Canziani, O., Palutikof, J.P., Hansen, C., van der Linden, P., Eds.; Cambridge University Press: Cambridge, UK, 2007; pp. 719–743. [Google Scholar]
  34. Dahyann, A.-M.; Metzger, M.J.; Stuart, N.; Meriwether, A.; Wilson, W.; Alvarez, L. Assessing urban adaptive capacity to climate change. J. Environ. Manag. 2016, 183, 314–324. [Google Scholar]
  35. Smit, B.; Pilifosova, O. Adaptation to Climate Change in the Context of Sustainable Development and Equity. Contribution of the Working Group to the Third Assessment Report of the Intergovernmental Panel on Climate Change; Cambridge University Press: Cambridge, UK, 2001. [Google Scholar]
  36. Acosta, L.; Klein, R.J.T.; Reidsma, P.; Metzger, M.J.; Rounsevell, M.D.A.; Leemans, R.; Schroter, D. A spatially explicit scenario-driven model of adaptive capacity to global change in Europe. Glob. Environ. Chang. 2013, 23, 1211–1224. [Google Scholar] [CrossRef]
  37. Greiving, S. ESPON Climate-Climate Change and Territorial Effects on Regions and Local Economies (Dortmund). 2011. Available online: https://www.espon.eu/sites/default/files/attachments/Final%20Report%20Glossary.pdf (accessed on 1 February 2018).
  38. Juhola, S.; Peltonen, L.; Niemi, P. The ability of Nordic countries to adapt to climate change: Assessing adaptive capacity at the regional level. Local Environ. 2012, 17, 717–734. [Google Scholar] [CrossRef]
  39. Pelling, M.; Manuel-Navarrete, D. From resilience to transformation: The adaptive cycle in two Mexican urban centres. Ecol. Soc. 2011, 16, 209–225. [Google Scholar] [CrossRef]
  40. Xie, X.; Zheng, Y. Assessment Indicators for Measuring Climate Resilient City: A Case Study of Beijing. Urban Environ. Stud. 2016, 4, 50–66. [Google Scholar]
  41. Jin Tao. An Assessment of Coping Capacity to Climate Change for Cities in China. Master’s Thesis, Shanghai Normal University, Shanghai, China, 2012. (In Chinese).
  42. Mortreux, C.; Barnett, J. Adaptive capacity: Exploring the research frontier. Wiley Interdiscipl. Rev. Clim. Chang. 2017, 8, 467. [Google Scholar] [CrossRef]
  43. Smit, B.; Wandel, J. Adaptation, adaptive capacity and vulnerability. Glob. Environ. Chang.-Hum. Policy Dimens. 2006, 16, 282–292. [Google Scholar] [CrossRef]
  44. Eisenack, K.; Moser, S.C.; Hoffmann, E.; Klein, R.J.T.; Oberlack, C.; Pechan, A.; Rotter, M.; Termeer, C.J.A.M. Explaining and overcoming barriers to climate change adaptation. Nat. Clim. Chang. 2014, 4, 867–872. [Google Scholar] [CrossRef]
  45. Cortekar, J.; Bender, S.; Brune, M.; Groth, M. Why climate change adaptation in cities needs customized and flexible climate services. Clim. Serv. 2016, 4, 42–51. [Google Scholar] [CrossRef]
  46. Kim, D.; Lim, U. Urban resilience in climate change adaptation: A conceptual framework. Sustainability 2016, 8, 405. [Google Scholar] [CrossRef]
  47. Alberti, M.; Marzluff, J.M.; Shulenberger, E.; Bradley, G.; Ryan, C.; Zumbrunnen, C. Integrating humans into ecology: Opportunities and challenges for studying urban ecosystems. BioScience 2003, 53, 1169–1179. [Google Scholar] [CrossRef]
  48. Pickett, S.T.A.; Cadenasso, M.; McGrath, B. Resilience in Ecology and Urban Design: Linking Theory and Practice for Sustainable Cities; Pickett, S.T., Cadenasso, M., McGrath, B., Eds.; Springer: Dordrecht, The Netherlands, 2013. [Google Scholar]
  49. Resilience, A. Urban Resilience Research Prospectus. Canberra, Australia; Phoenix, USA; Stockholm, Sweden. Available online: http://81.47.175.201/ET2050_library/docs/scenarios/urban_resilence.pdf (accessed on 1 February 2018).
  50. Bai, X.; Surveyer, A.; Elmqvist, T.; Gatzweiler, F.W.; Güneralp, B.; Parnell, S.; Prieur-Richard, A.; Shrivastava, P.; Siri, J.; Stafford-Smith, M.; et al. Defining and advancing a systems approach for sustainable cities. Curr. Opin. Environ. Sustain. 2016, 23, 69–78. [Google Scholar] [CrossRef]
  51. European Environment Agency. Available online: https://www.eea.europa.eu/publications/92-9167-059-6-sum/page002.html (accessed on 1 February 2018).
  52. Kristensen, P. The DPSIR Framework. National Environmental Research Institute. Available online: https://wwz.ifremer.fr/dce/content/download/69291/913220/.../DPSIR.pdf. (accessed on 1 February 2018).
  53. Chen, M. Application of grey system method in overall urban planning. J. Central China Polytech. Univ. 1990, 18, 1–7. [Google Scholar]
  54. Liang, W.; Zhang, H.; Zhu, K.L. Comprehensive evaluation of urban eco-environment competitiveness based on fuzzy mathematics and grey theory. Chin. Environ. Sci. 2013, 33, 945–951. (In Chinese) [Google Scholar]
  55. Zhang, Q.; Guo, X.; Deng, J. Grey relational entropy analysis method. Syst. Eng. Theory Pract. 1996, 8, 8–12. (In Chinese) [Google Scholar]
  56. Zhang, F.; Su, W.; Zhou, J. Urban ecological security evaluation based on Entropy Weight and Grey Correlation Analysis. Chin. J. Ecol. 2008, 7, 1249–1254. (In Chinese) [Google Scholar]
  57. Wang, C.; You, Y.; Zuo, T.; Sun, D. Land Quality Evaluation Rocky Desertification Areas Based on Entropy and Gray Correlation Method-A Case Study in Bijie. Res. Soil Water Conserv. 2011, 18, 218–222. (In Chinese) [Google Scholar]
  58. Gao, M.; Wu, X. Air Quality and Its Influencing Factors in Beijing Based on Entropy-Weighted Grey Correlation Model. Ecol. Econ. 2017, 33, 142–147. (In Chinese) [Google Scholar]
  59. Luo, Y.; Yu, W. Climate change and mutation analysis of Changsha in recent 56 years. J. Anhui Agric. Univ. 2017, 44, 302–307. (In Chinese) [Google Scholar]
  60. Dale, V.H.; Joyce, L.A.; McNulty, S.; Neilson, R.P.; Ayres, M.P.; Flannigan, M.D.; Simberloff, D. Climate change and forest disturbances: Climate change can affect forests by altering the frequency, intensity, duration, and timing of fire, drought, introduced species, insect and pathogen outbreaks, hurricanes, windstorms, ice storms, or landslides. BioScience 2001, 51, 723–734. [Google Scholar] [CrossRef]
  61. Panteli, M.; Mancarella, P. Influence of extreme weather and climate change on the resilience of power systems: Impacts and possible mitigation strategies. Electr. Power Syst. Res. 2015, 127, 259–270. [Google Scholar] [CrossRef]
  62. Song, W.; Li, C. Climate Characteristics Analysis and Case Study on Torrential Rain in Changsha Area. Mod. Agric. Technol. 2017, 19, 188–194. (In Chinese) [Google Scholar]
  63. Fu, S.; Jiang, Y.; Zhang, X.; Zhu, X.; Peng, J.; Chen, S. Statistics and analysis of high temperature and heat wave events in Changsha city in the last 64 years. Meteorol. Sci. Technol. 2016, 44, 991–997. (In Chinese) [Google Scholar]
  64. European Environment Agency. Environmental Indicators: Typology and Overview. Copenhagen, 1999. Available online: https://www.eea.europa.eu/publications/TEC25 (accessed on 1 February 2018).
  65. Carr, E.R.; Wingard, P.M.; Yorty, S.C.; Thompson, M.C.; Jensen, N.K.; Roberson, J. Applying DPSIR to sustainable development. Int. J. Sustain. Dev. World Ecol. 2007, 14, 543–555. [Google Scholar] [CrossRef]
  66. Silva, J.D.; Kernaghan, S.; Luque, A. A systems approach to meeting the challenges of urban climate change. Int. J. Urban Sustain. Dev. 2012, 4, 125–145. [Google Scholar] [CrossRef]
  67. Grimm, N.B.; Faeth, S.H.; Golubiewski, N.E.; Redman, C.L.; Wu, J.; Bai, X.; Briggs, J.M. Global Change and the Ecology of Cities. Science 2008, 319, 756–760. [Google Scholar] [CrossRef] [PubMed]
  68. Bell, S. DPSIR = a problem structuring method? An exploration from the ‘‘Imagine’’ approach. Eur. J. Oper. Res. 2012, 222, 350–360. [Google Scholar] [CrossRef]
  69. Ness, B.; Anderberg, S.; Olsson, L. Structuring problems in sustainability science: The multi-level DPSIR framework. Geoforum 2009, 41, 479–488. [Google Scholar] [CrossRef]
  70. Gregory, A.J.; Atkins, J.P.; Burdon, D.; Elliott, M. A problem structuring method for ecosystem-based management: The DPSIR modelling process. Eur. J. Oper. Res. 2013, 227, 558–569. [Google Scholar] [CrossRef]
  71. Smith, B.; Burton, I.; Klein, R.J.; Wandel, J. An Anatomy of Adaptation to Climate Change and Variability. Clim. Chang. 2000, 45, 223–251. [Google Scholar] [CrossRef]
  72. Addiscott, T.M. Entropy and sustainability. Eur. J. Soil Sci. 1995, 46, 161–168. [Google Scholar] [CrossRef]
  73. Steinborn, W.; Svirezhev, Y. Entropy as an indicator of sustainability in agro-ecosystems: North Germany case study. Ecol. Model. 2000, 133, 247–257. [Google Scholar] [CrossRef]
  74. Zhou, M. Entropy Method and Its Empirical Research in the Measurement of Sustainable Consumption. Syst. Eng. Theory Pract. 2003, 23, 25–31. (In Chinese) [Google Scholar]
  75. Deng, J. Grey System Theory Base, 3rd ed.; HuaZhong University of Science and Technology Press: Wuhan, China, 2002; pp. 122–171. (In Chinese) [Google Scholar]
  76. Deng, J. The Primary Methods of Grey System Theory, 2nd ed.; HuaZhong University of Science and Technology Press: Wuhan, China, 2005; p. 8. (In Chinese) [Google Scholar]
  77. Devitofrancesco, A.; Ghellere, M.; Meroni, I.; Modica, M.; Paleari, S.; Zoboli, R. Sustainability assessment of urban areas through a multicriteria decision support system. In Central Europe towards Sustainable Building; Grada Publishing: Prague, Czech Republic, 2016; pp. 499–506. [Google Scholar]
  78. UNDP. China Sustainable Cities Report 2016: Measuring Ecological Input and Human Development. United Nations Development Programme in China, Beijing, China. Available online: http://www.cn.undp.org/content/china/en/home/library/democratic_governance/china-sustainable-cities-report-2016--measuring-ecological-input.html (accessed on 1 February 2018).
  79. Mazzanti, M.; Rizzo, U. Diversely moving towards a green economy: Techno-organisational decarbonisation trajectories and environmental policy in EU sectors. Technol. Forecast. Soc. Chang. 2017, 115, 111–116. [Google Scholar] [CrossRef]
Figure 1. Vulnerability and resilience frameworks as linked through the concept of adaptive capacity.
Sustainability 10 01272 g001
Figure 2. The driver–pressure–state–impact–response (DPSIR) framework.
Sustainability 10 01272 g002
Figure 3. Location of the case study in southern China.
Sustainability 10 01272 g003
Figure 4. Expenditure on natural disaster relief in Hunan. Source: Hunan Statistics Yearbook (1991–2017), charted by the authors.
Sustainability 10 01272 g004
Figure 5. The overall level of DPSIR from 2006 to 2015 in Changsha.
Sustainability 10 01272 g005
Figure 6. The UAC in Changsha from 2006 to 2015.
Sustainability 10 01272 g006
Table 1. Inter-decadal climate trend variation in Changsha.
YearAverage Minimum Temperature/°C *10a−1Average Maximum Temperature/°C *10a−1Average Temperature/°C *10a−1Average Minimum Temperature/°C *10a−1Extreme Maximum Temperature/°C *10a−1Precipitation/min *10a−1Relative Humidity/% *10a−1
1959–1958−0.23−0.37−0.30−1.20−0.276.962.89 **
1979–19980.090.170.190.64−0.01199.30 **0.07
1999–20140.92 **0.600.76 **0.790.67−119.75−8.21 **
1959–20140.25 **0.19 *0.23 **0.42 *0.139.30−1.24 **
NOTE: “*”and “**” refers to the different significance at 0.05 and 0.01 levels, respectively. Source: Adapted from Luo and Yu (2017).
Table 2. Index system used for evaluation of urban adaptive capacity (UAC).
TargetDimensionIndexEffect
Urban adaptive capacity to climate changeDriverRate of population growth (%) x 1 +
Rate of urbanization (%) x 2 +
Rate of GDP growth (%) x 3 +
PressureEnergy consumption per unit of GDP (ton of SCE/10,000 yuan) x 4
Electricity consumption per unit of GDP (Kwh/10,000 yuan) x 5
Volume of industrial waste water discharged per unit of GDP (ton/10,000 yuan) x 6
Volume of industrial waste emission of unit GDP (m3/10,000 yuan) x 7
Built-up area (sq.km) x 8
Urban construction land-use area (sq.km) x 9
Population density (person/sq.km) x 10
StatePercent of air quality days (%) x 11 +
Per capita water resource (m3/person) x 12 +
Green area coverage rate in developed area (%) x 13 +
Proportion of the added value of tertiary industry in GDP (%) x 14 +
Per capita green park land (m2/person) x 15 +
Customer price index x 16
Area of natural reserves (10,000 hectare) x 17 +
Per capita cultivated area (mu/person) x 18 +
ImpactIncome of urban households (yuan) x 19 +
Per capita total retail sales of consumer goods (yuan/person) x 20 +
Rate of unemployment (%) x 21
Household saving deposits (100 million yuan) x 22 +
Total floor space of dilapidated buildings at year-end (10,000 sq.m) x 23
Per capita floor space of residential buildings (sq.m/person) x 24
Output of grain (ton) x 25 +
ResponseNumber of students in higher education (person) x 26 +
Environmental protection expenditure (10,000 yuan) x 27 +
Public budget expenditure ( 10 , 000   yuan ) x 28 +
Ratio of waste water treatment by sewage disposal (%) x 29 +
Percentage of solid wastes utilized (%) x 30 +
Number of beds per 104 persons (bed) x 31 +
Number of mobile telephone users at the year-end (10,000 subscribers) x 32 +
Number of internet users (10,000 subscribers) x 33 +
Table 3. Classification criteria of UAC.
NoScoring StandardTypes
10–0.60High maladaptation
20.60–0.70Slight adaptation
30.70–0.85Favorable adaptation
40.85–1High adaptation
Table 4. Weights of indexes of the urban system based on DPSIR model.
DimensionWeightIndicatorWeightDimensionWeightIndicatorWeight
Diver0.036 x 1 0.027Impact0.332 x 19 0.032
x 2 0.002 x 20 0.05
x 3 0.007 x 21 0.003
Pressure0.17 x 4 0.015 x 22 0.052
x 5 0.013 x 23 0.183
x 6 0.08 x 24 0.012
x 7 0.033 x 25 7.81 × 10^5
x 8 0.011Response0.381 x 26 0.002
x 9 0.014 x 27 0.177
x 10 0.0001 x 28 0.08
State0.087 x 11 0.008 x 29 0.024
x 12 0.011 x 30 0.0006
x 13 0.0003 x 31 0.019
x 14 0.002 x 32 0.031
x 15 0.004 x 33 0.032
x 16 0.0001
x 17 0.061
x 18 0.0002
Table 5. The type of UAC in Changsha.
YearUACTypesYearUACTypes
20060.402High maladaptation20110.651Slight adaptation
20070.421High maladaptation20120.663Slight adaptation
20080.428High maladaptation20130.673Slight adaptation
20090.567High maladaptation20140.829Favorable adaptation
20100.602Slight adaptation20150.826Favorable adaptation

