Potential Impacts of China 2030 High-Speed Rail Network on Ground Transportation Accessibility


Abstract
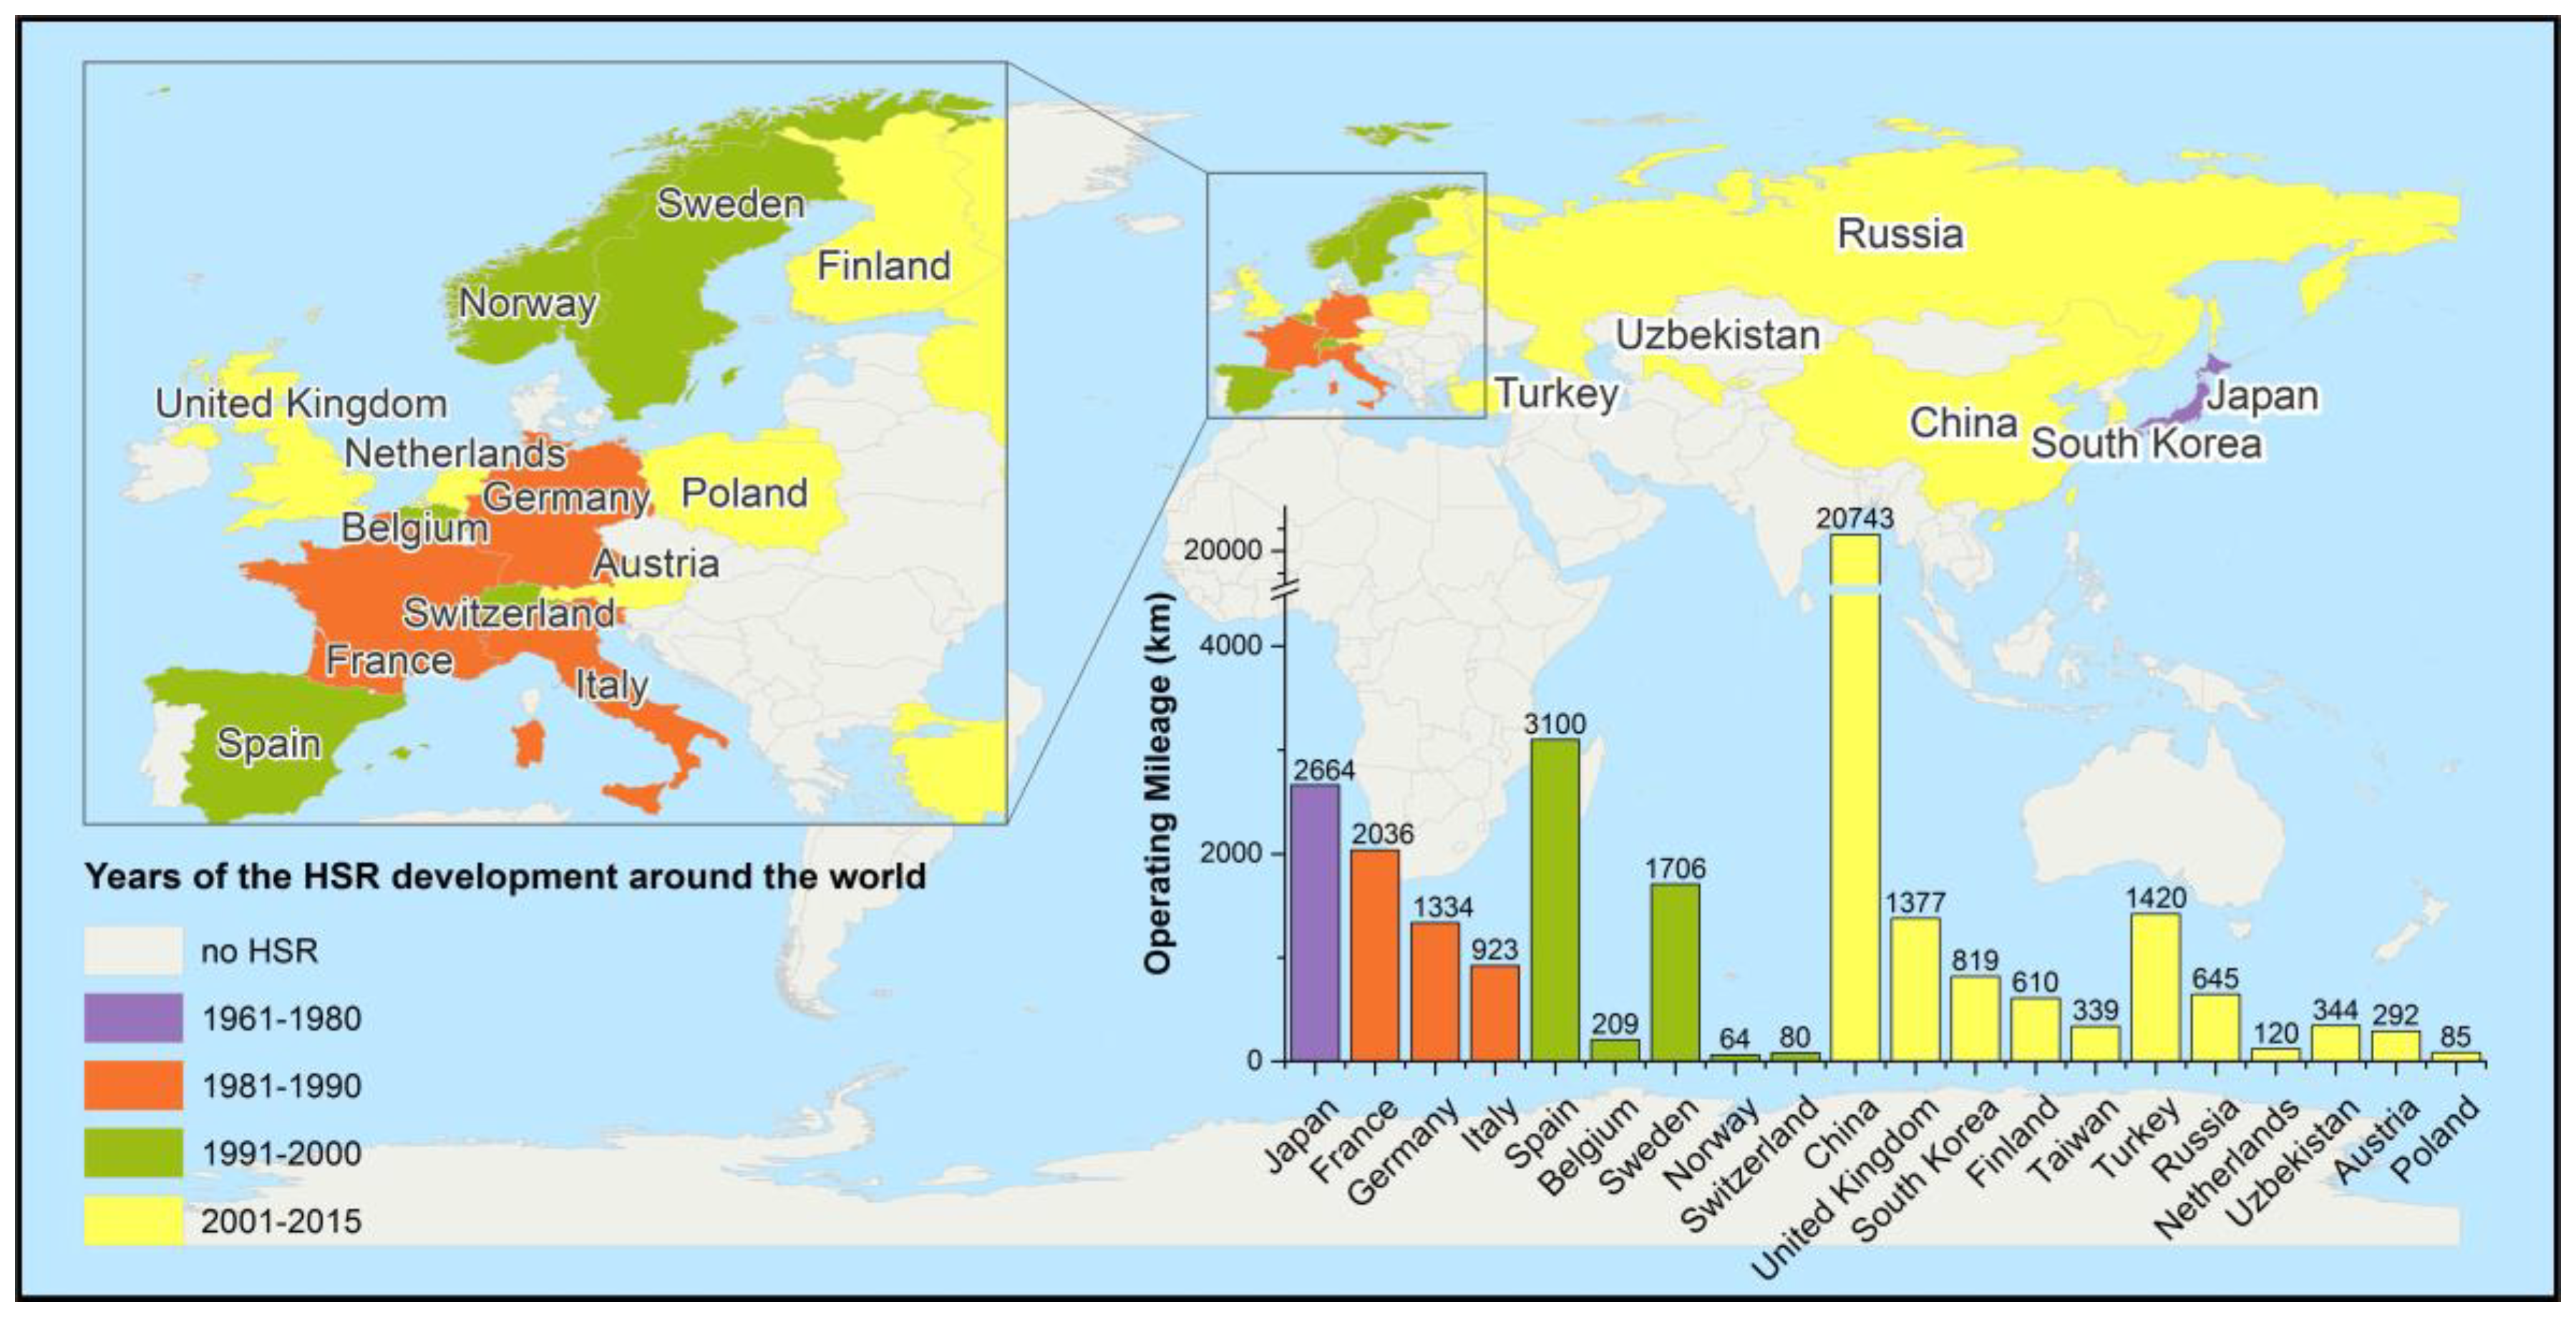
:1. Introduction
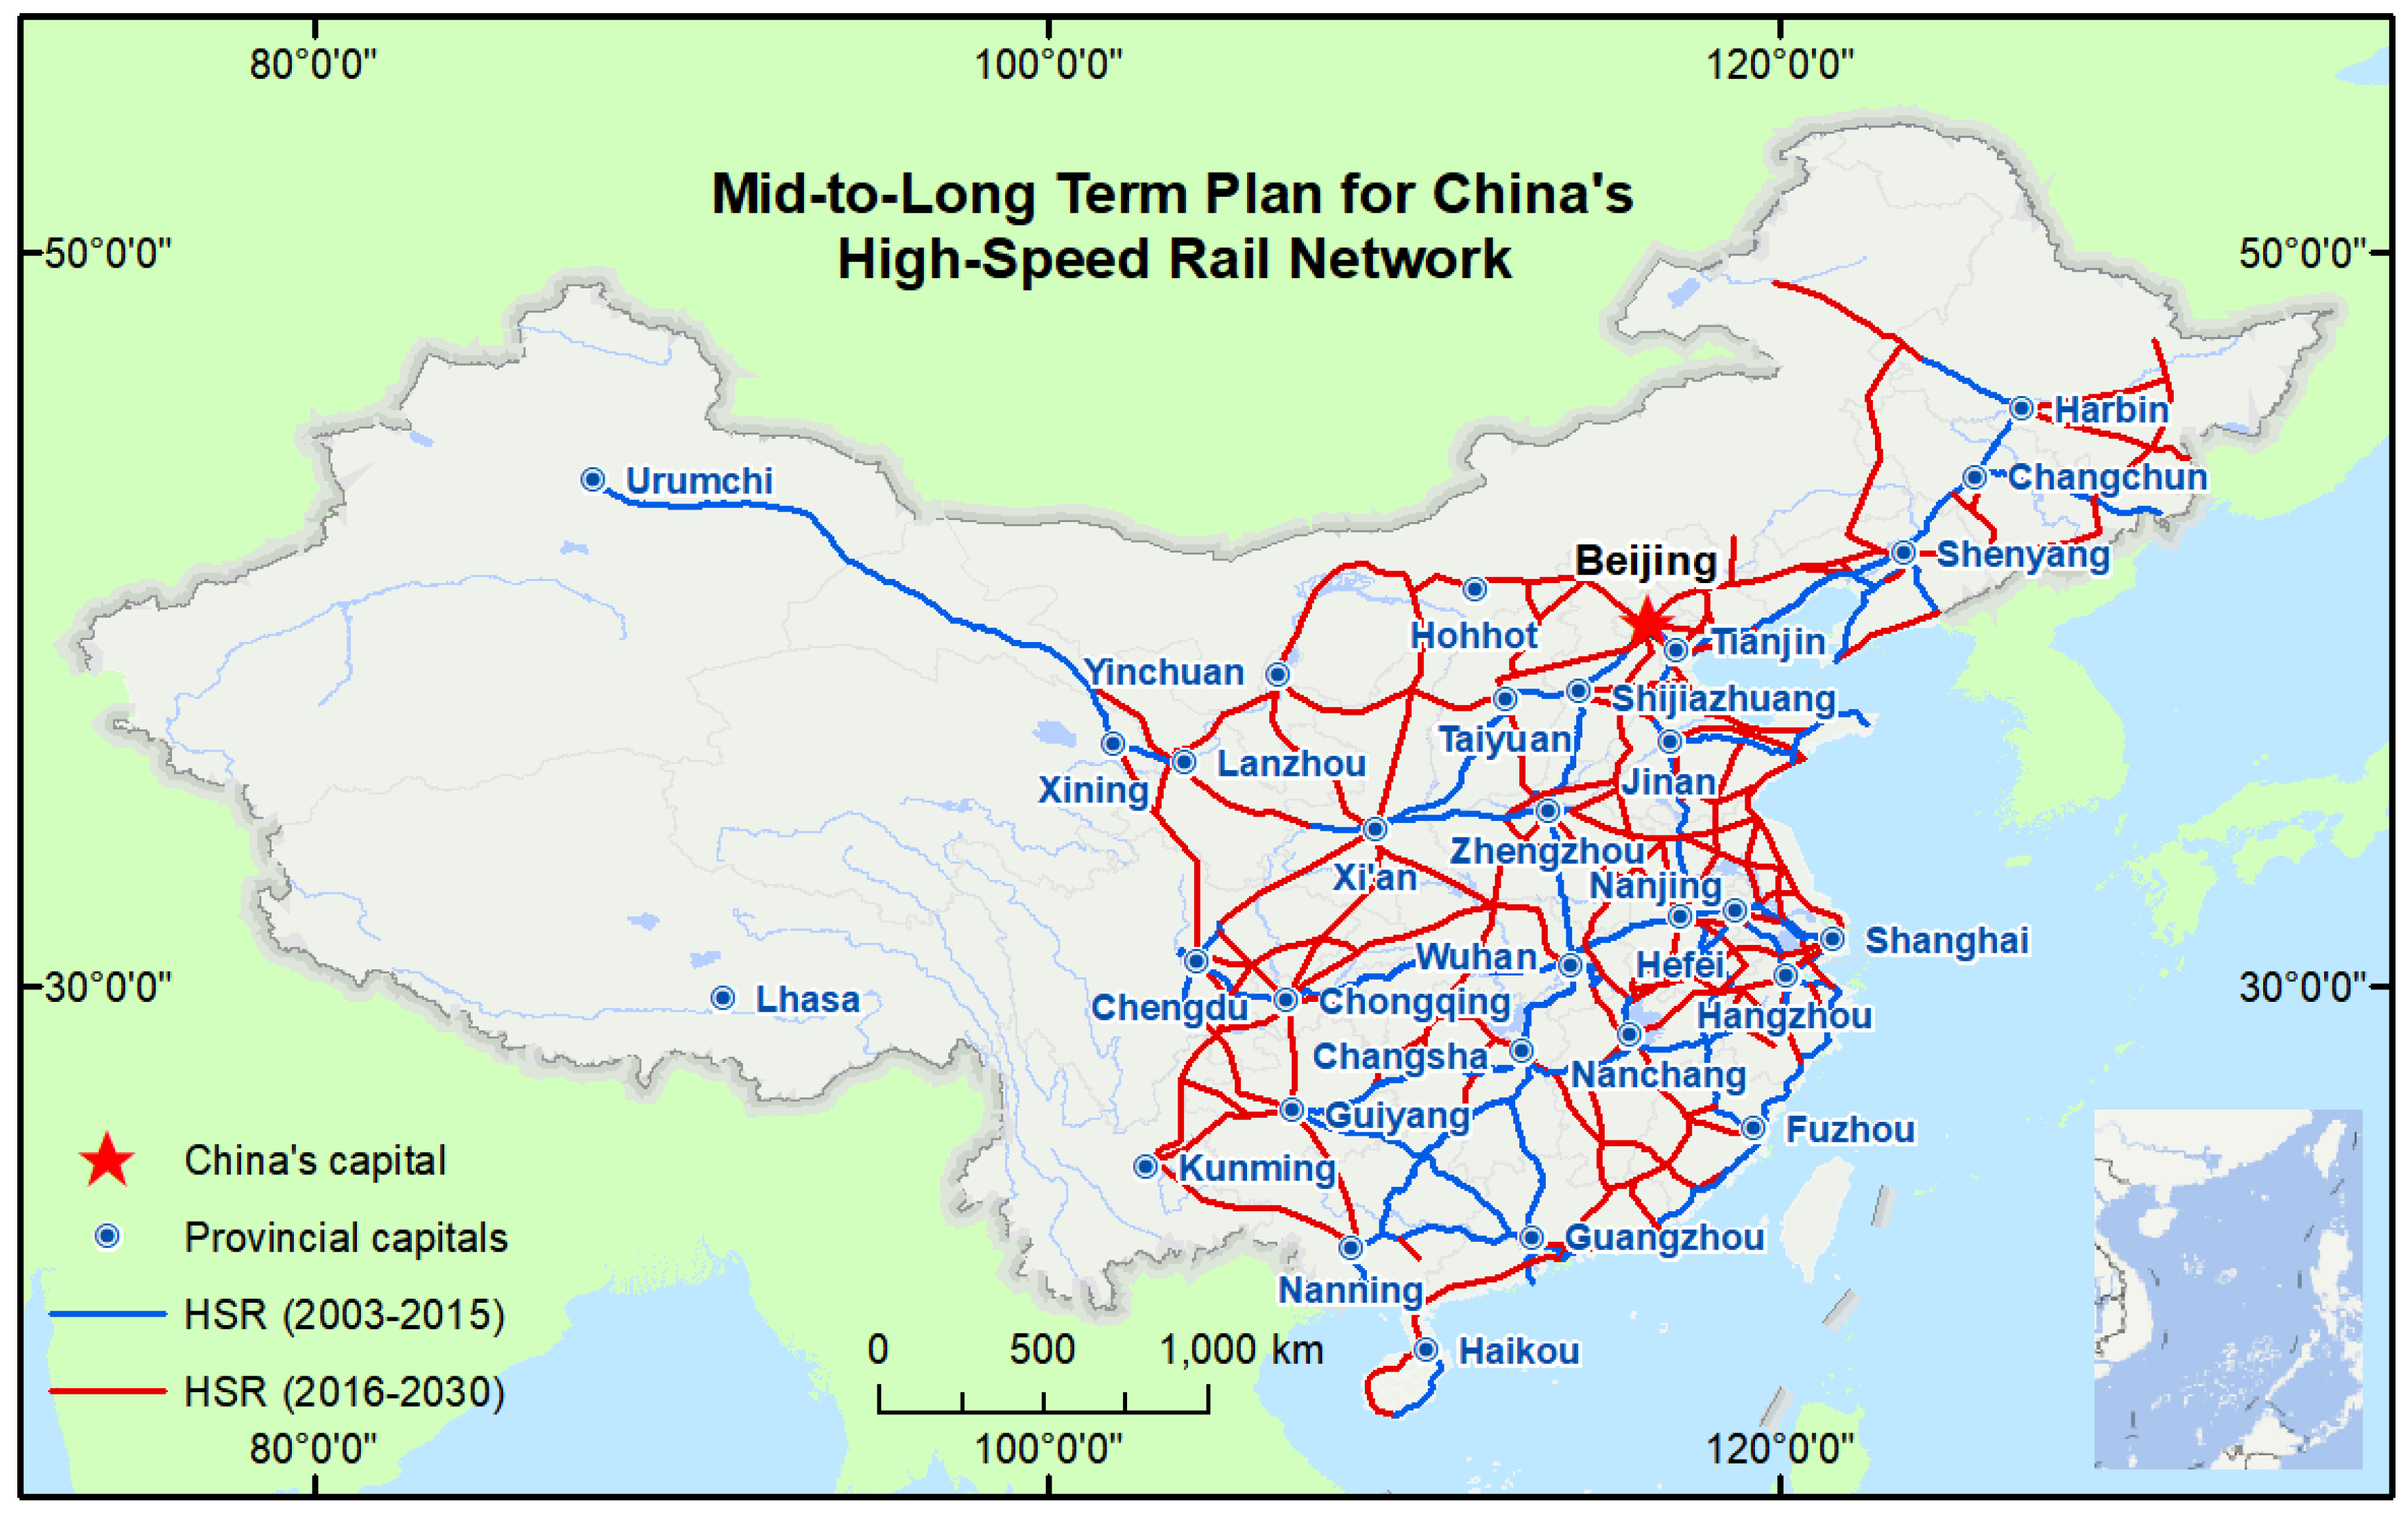
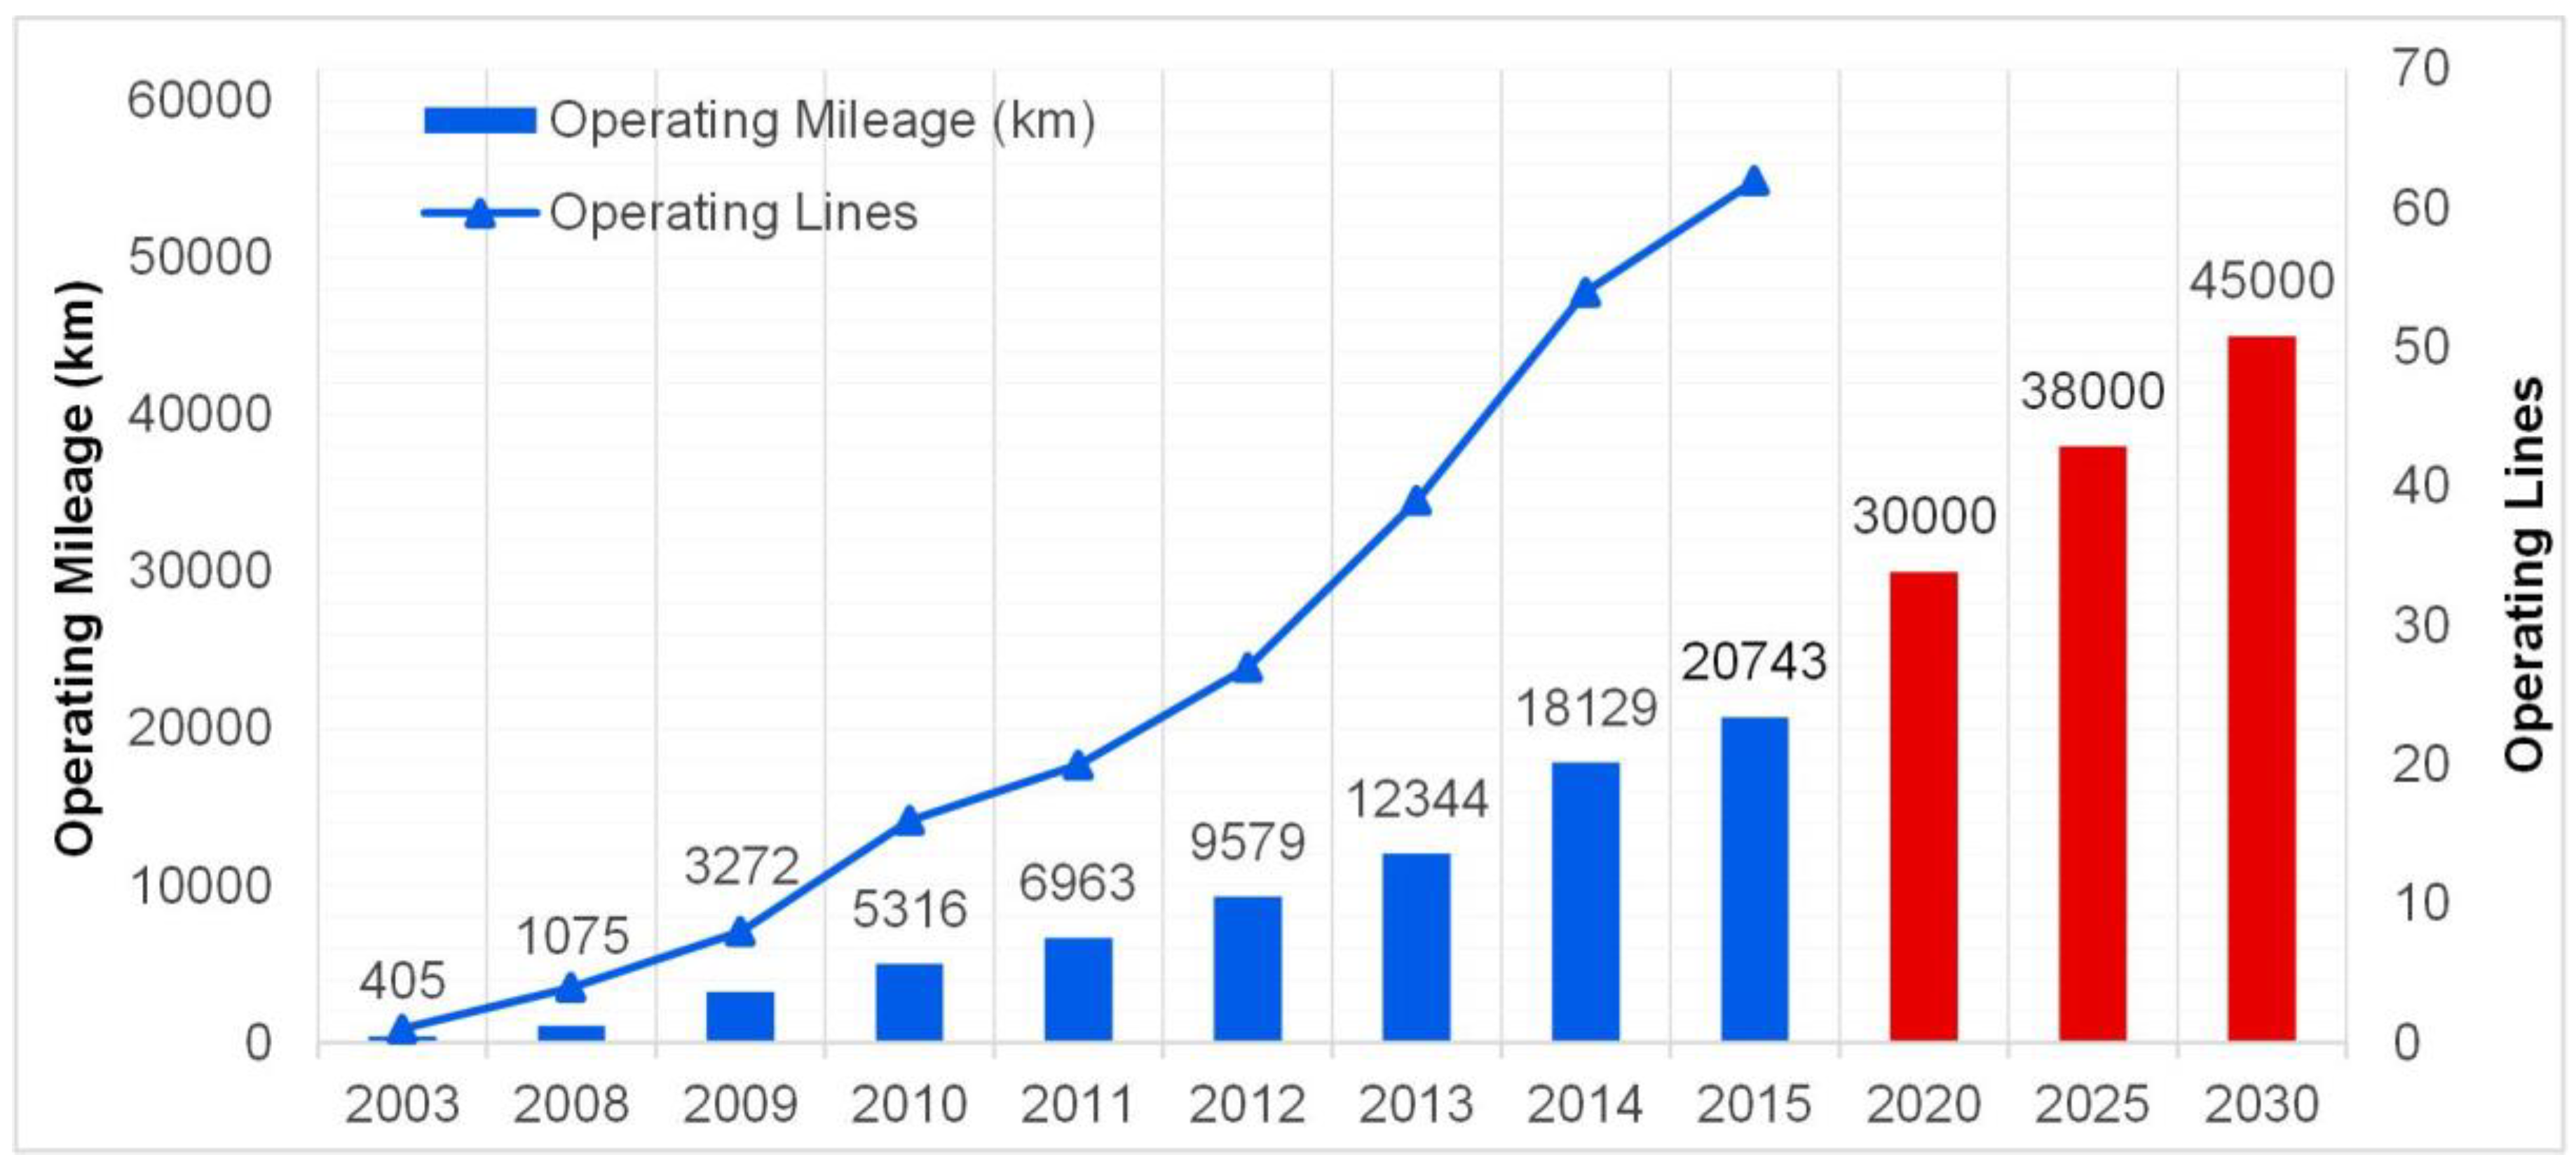
2. China’s Present and Future HSR Network
3. Data and Methodology
3.1. Data Sources
3.2. Methodology
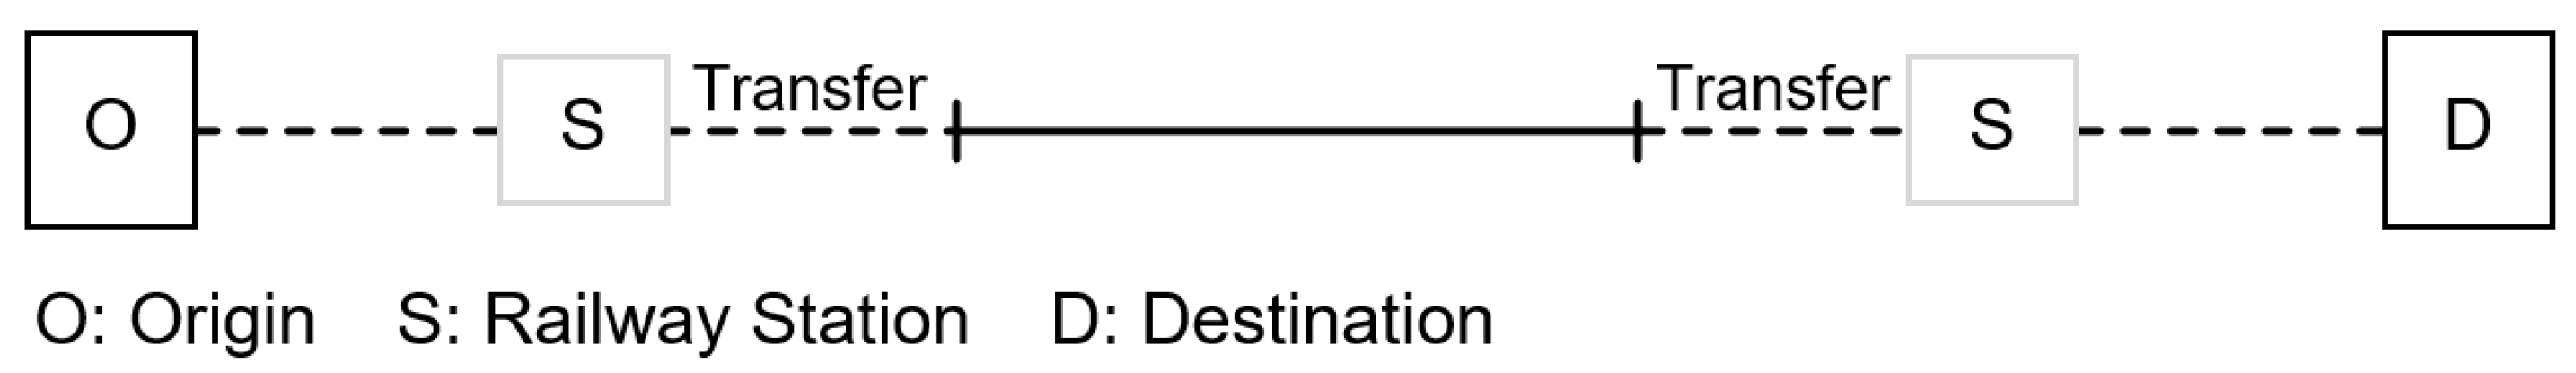
3.2.1. Measurement of Travel Time
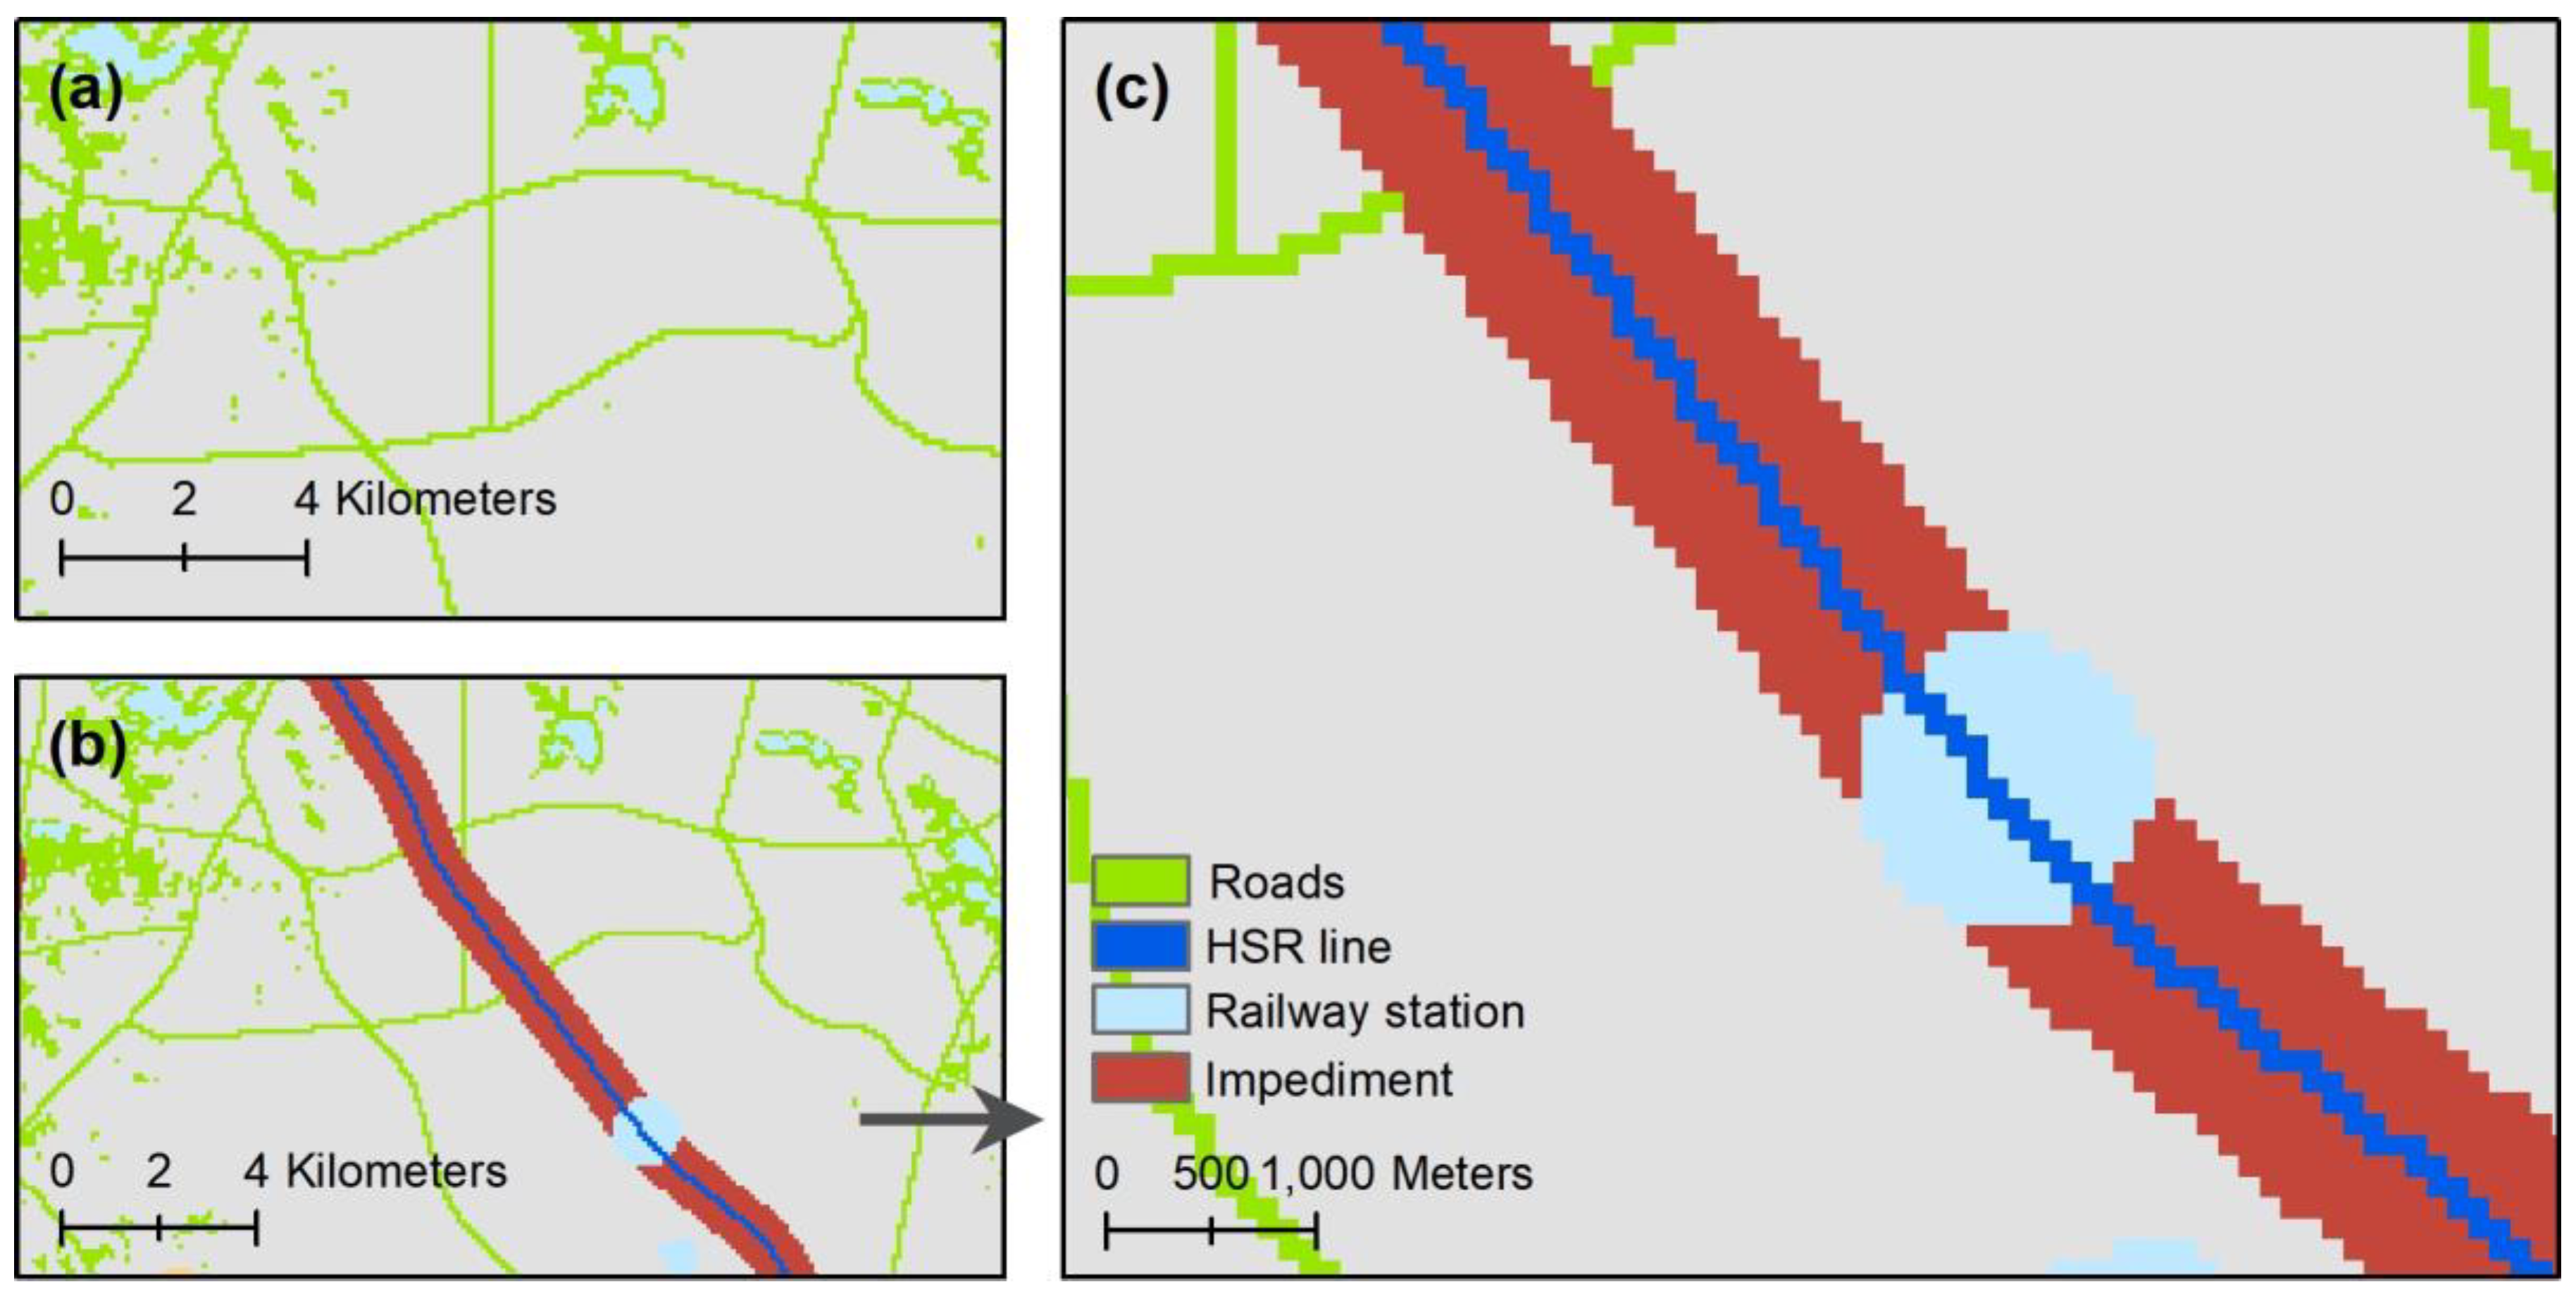
3.2.2. Construction of Frictional Surface
3.2.3. Selection of Accessibility Indicators
4. Results
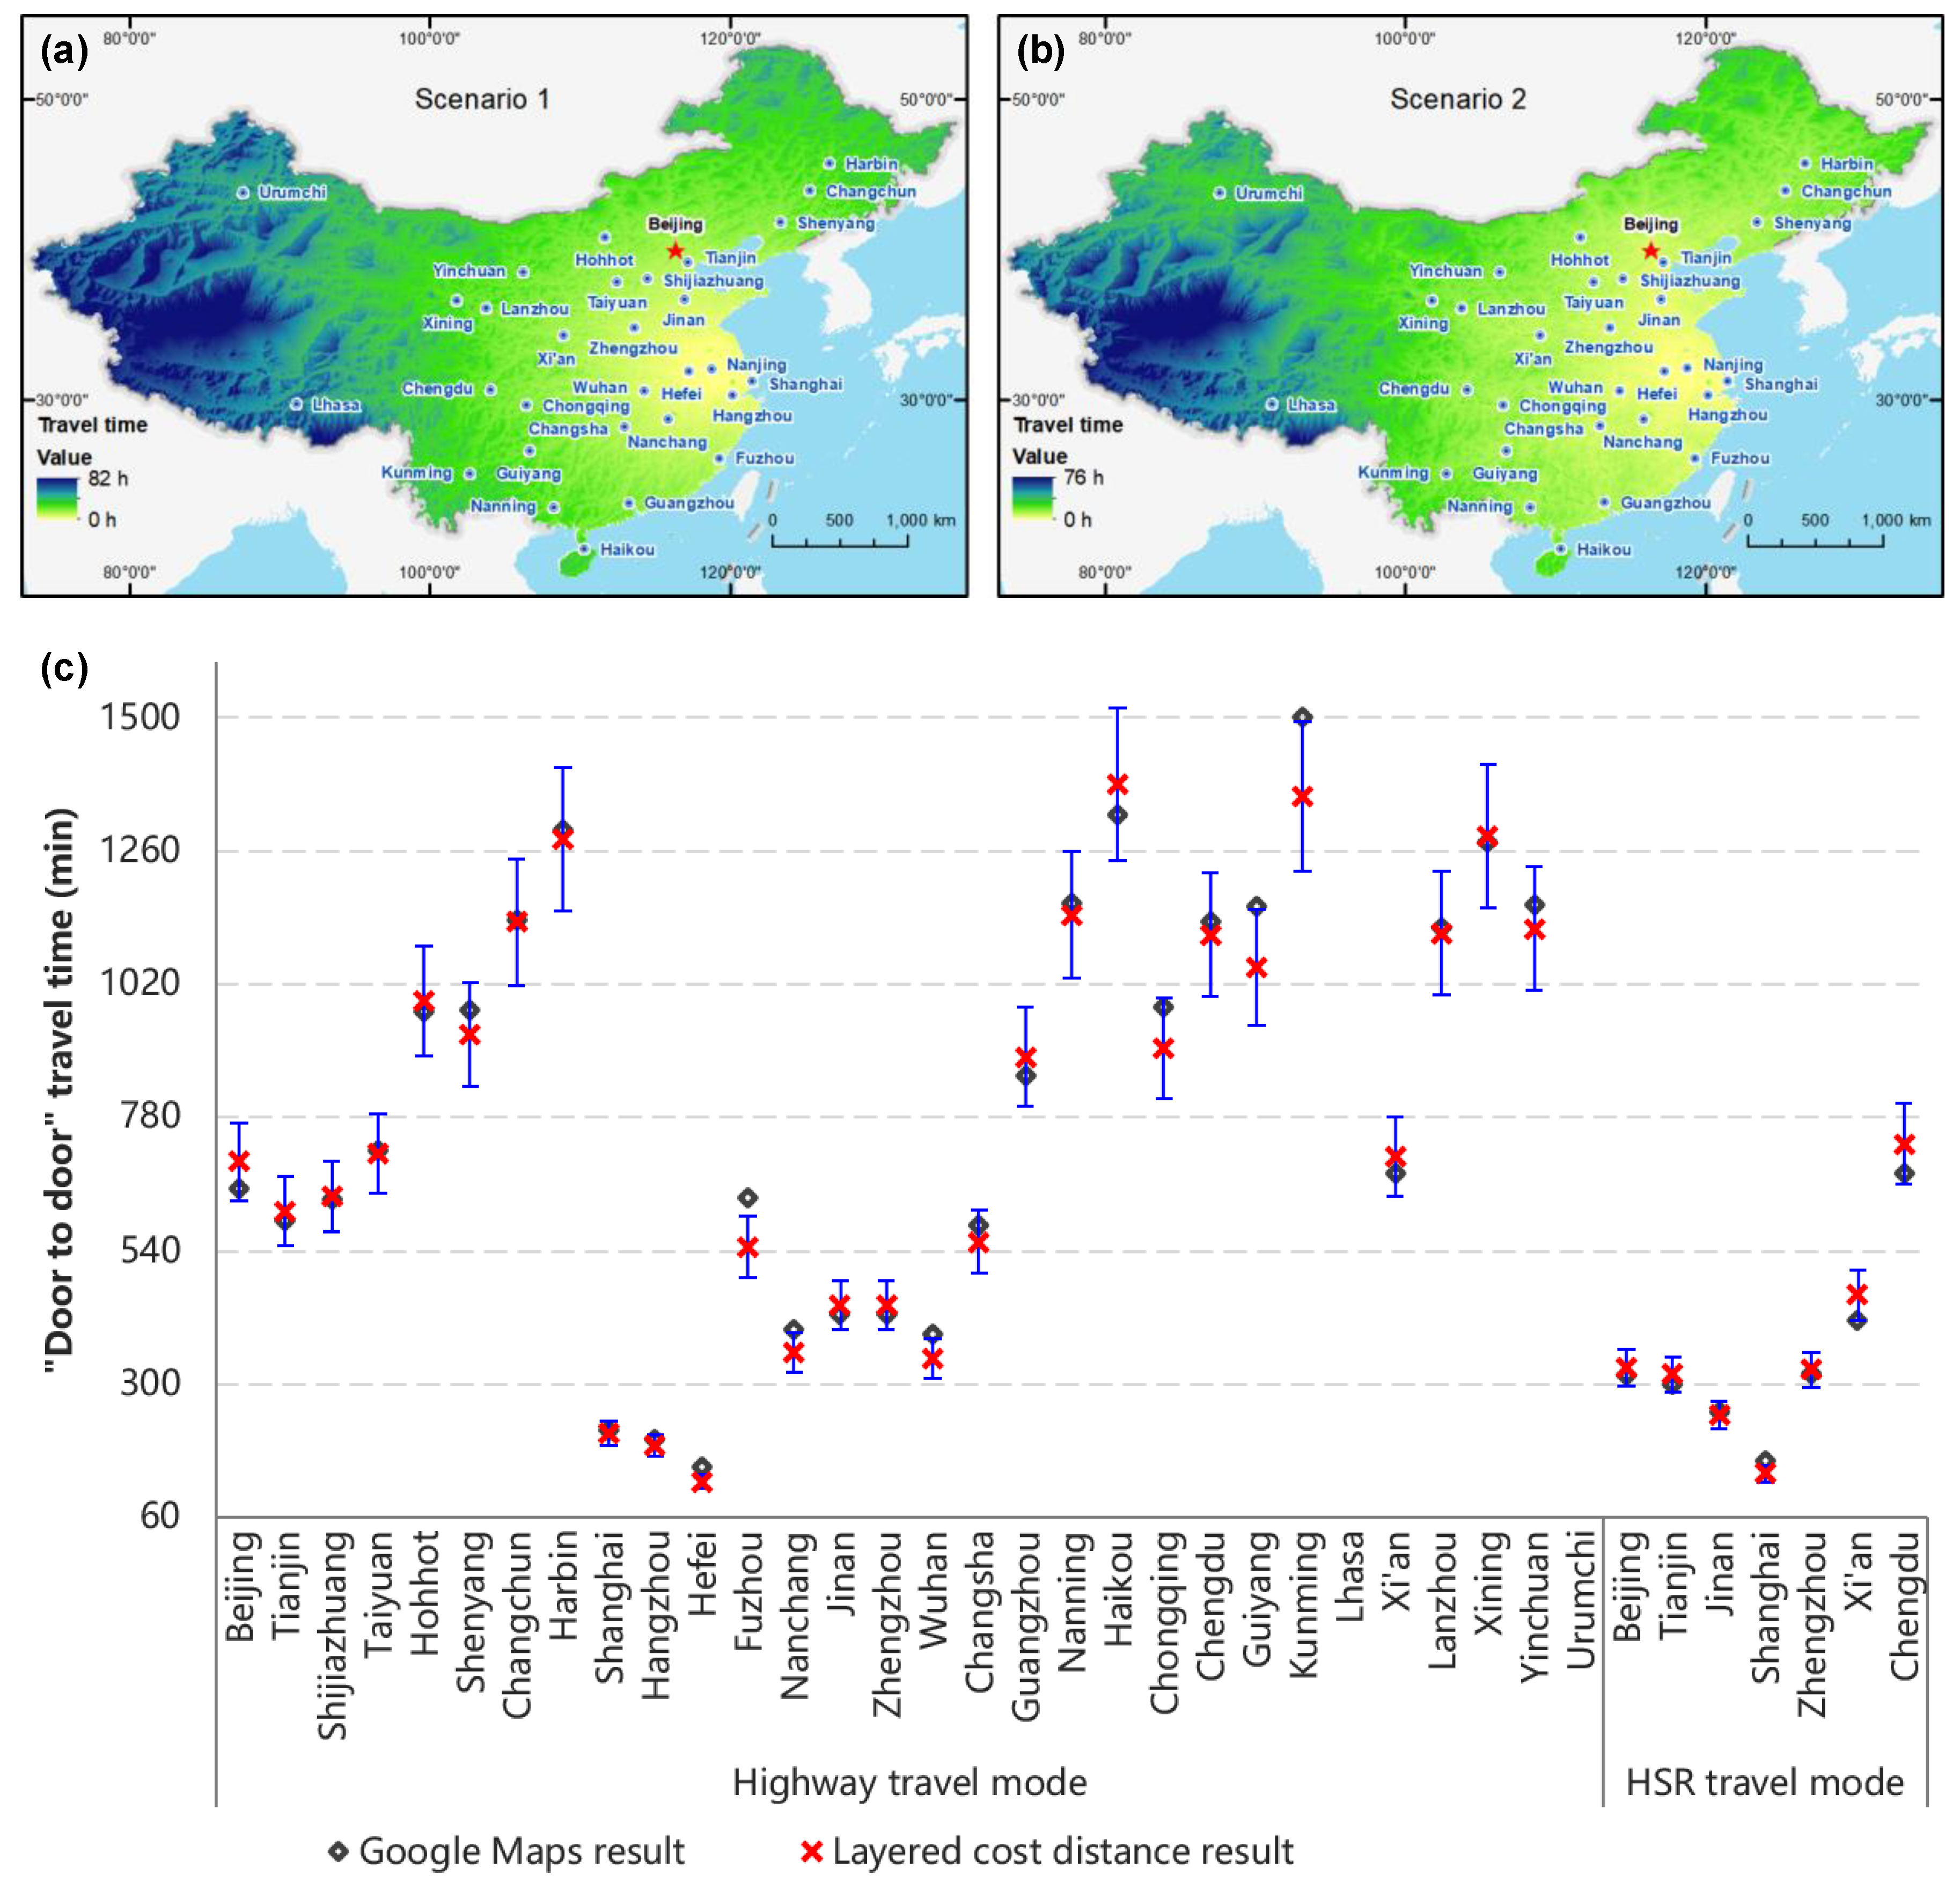
4.1. Validation of Travel Time and Accessibility
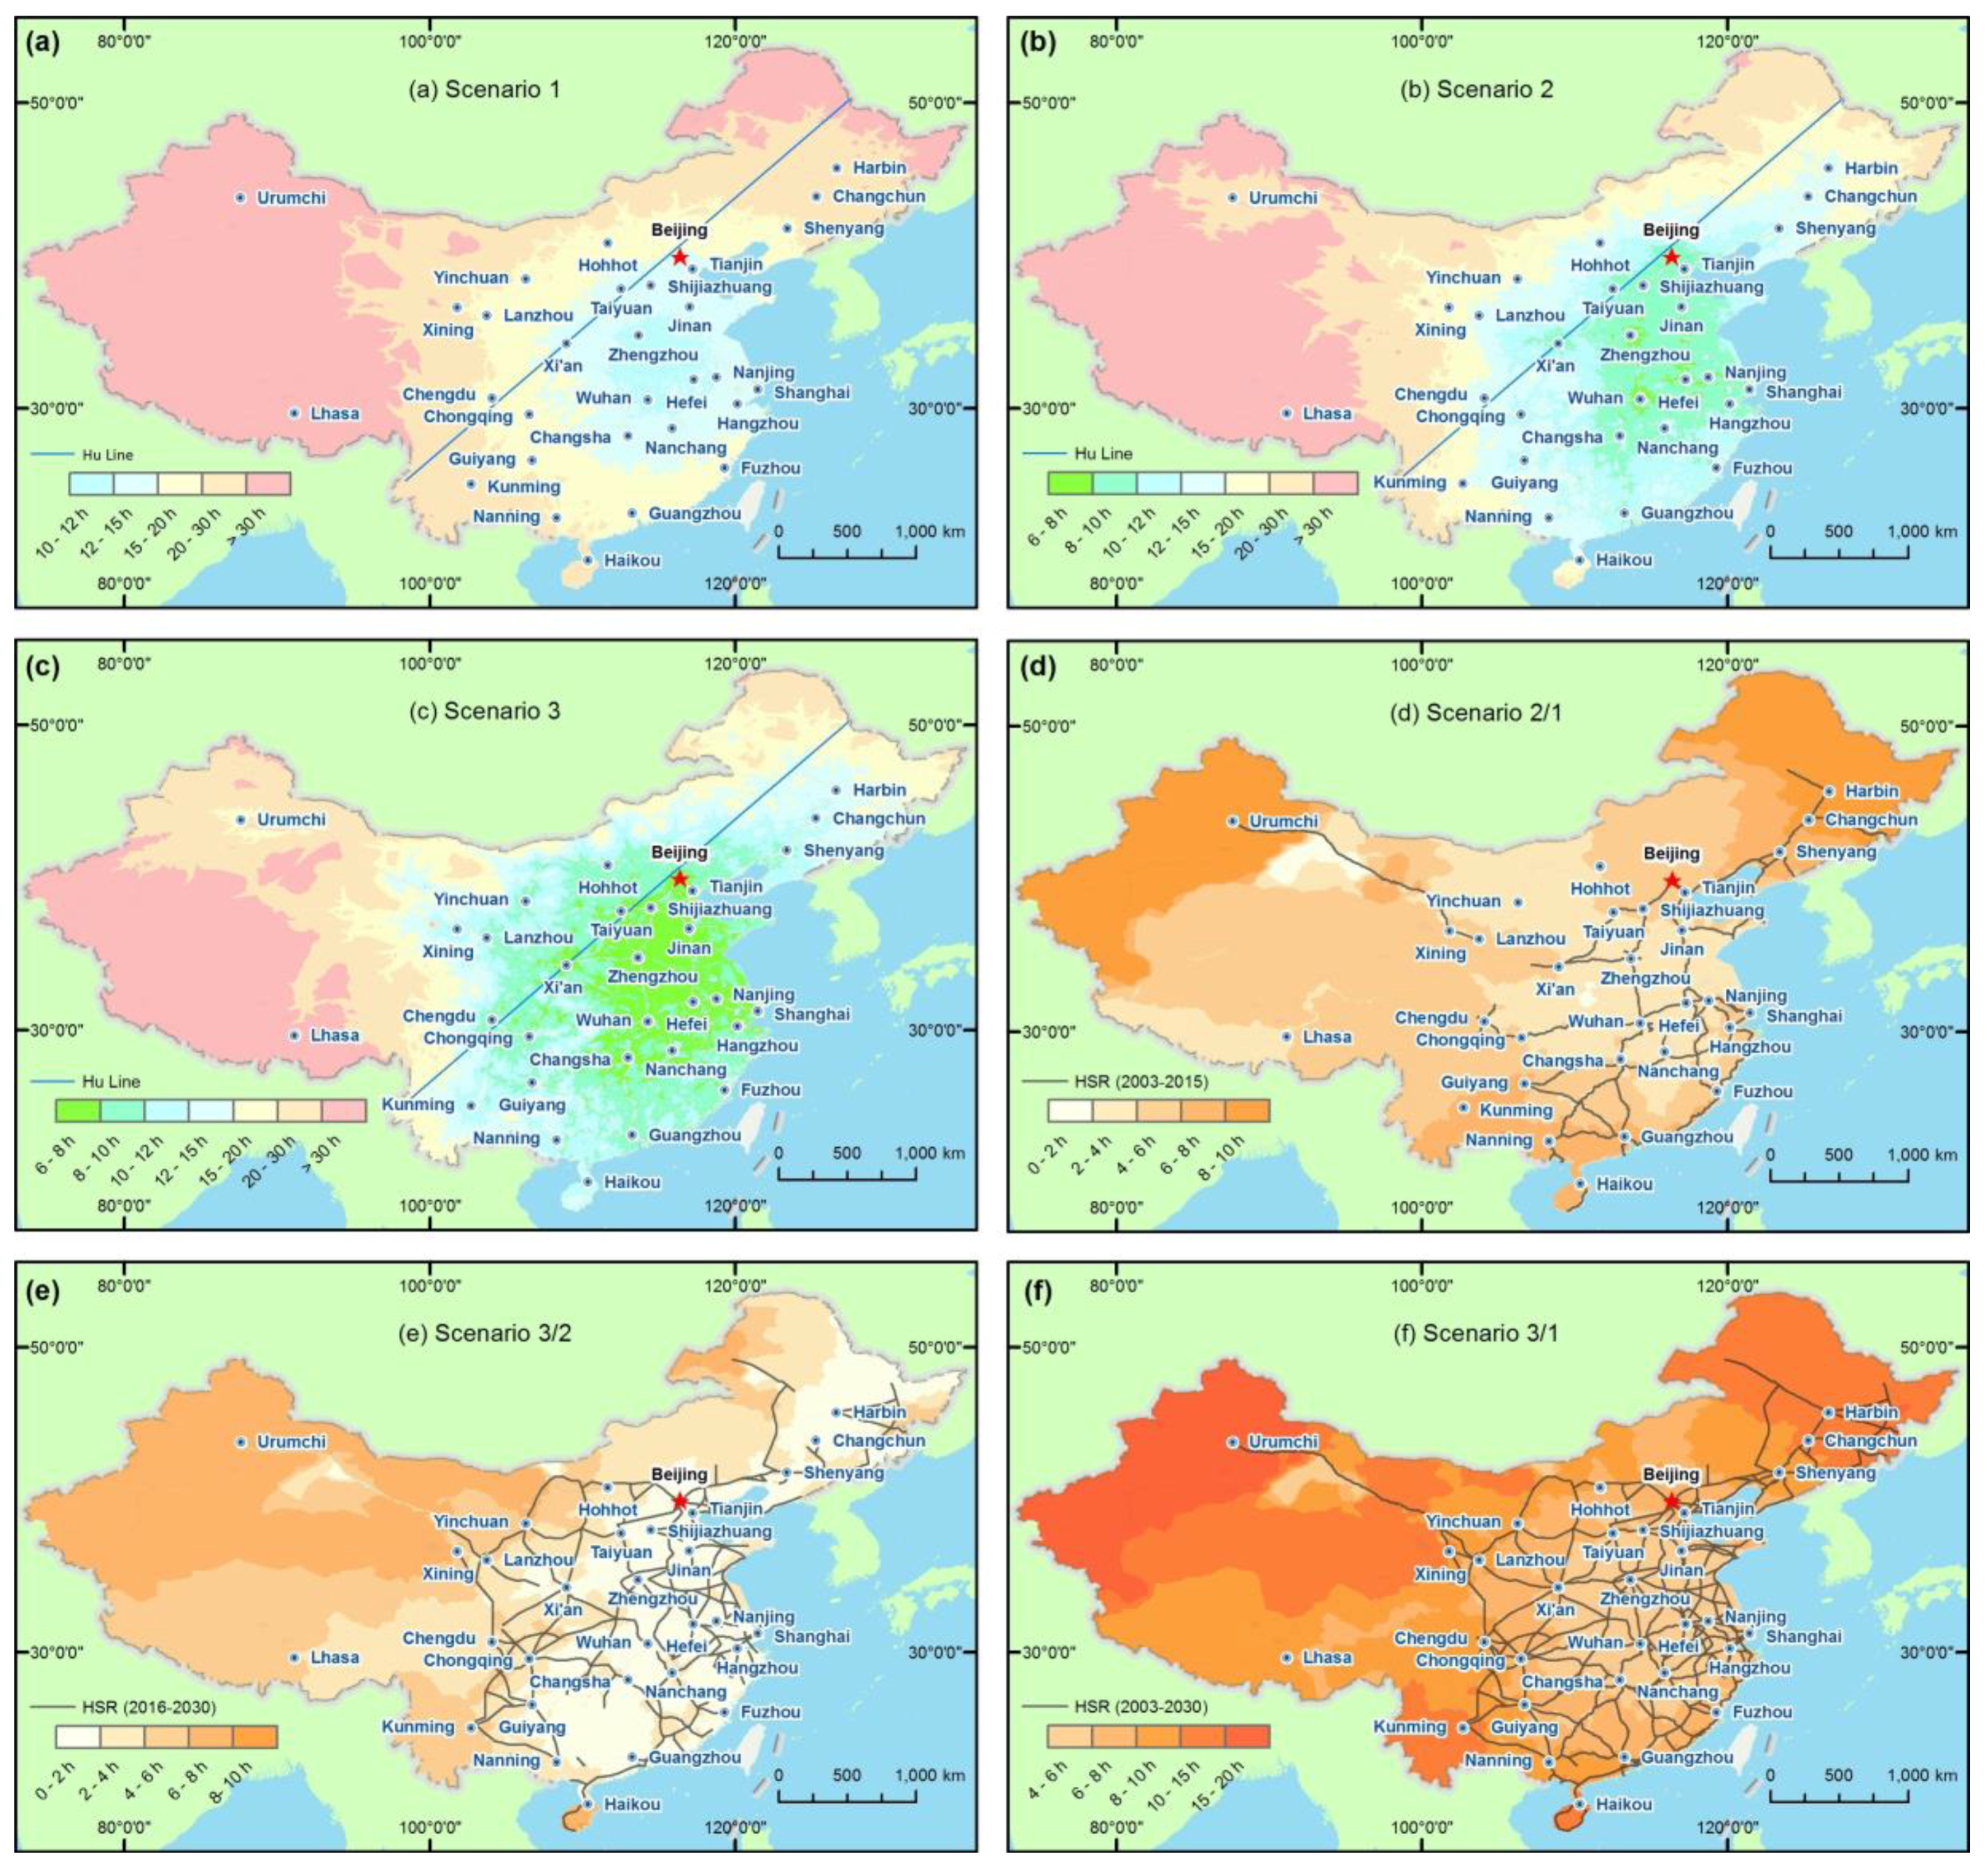
4.2. WATT Accessibility
4.3. DA Accessibility
5. Discussion
5.1. Comparison between the Two Indicators
5.2. Policy Suggestions
6. Conclusions
Acknowledgments
Author Contributions
Conflicts of Interest
References
- Gutiérrez, J. Location, economic potential and daily accessibility: An analysis of the accessibility impact of the high-speed line Madrid–Barcelona–French border. J. Transp. Geogr. 2001, 9, 229–242. [Google Scholar] [CrossRef]
- MartÍn, J.C.; Gutiérrez, J.; Román, C. Data envelopment analysis (DEA) index to measure the accessibility impacts of new infrastructure investments: The case of the high-speed train corridor Madrid–Barcelona–French border. Reg. Stud. 2004, 38, 697–712. [Google Scholar] [CrossRef]
- Yin, M.; Bertolini, L.; Duan, J. The effects of the high-speed railway on urban development: International experience and potential implications for China. Prog. Plan. 2015, 98, 1–52. [Google Scholar] [CrossRef]
- Wikipedia. List of High-Speed Railway Lines. Available online: https://en.wikipedia.org/wiki/List_of_high-speed_railway_lines (accessed on 7 August 2016).
- NRA. China’s High-Speed Rail Information. Available online: http://www.nra.gov.cn/ztzl/hyjc/gstl_/zggstL/gtxl/201602/t20160216_21088.html (accessed on 21 December 2016).
- UIC. High Speed. Available online: http://www.uic.org/highspeed (accessed on 19 March 2017).
- NDRC. Mid-to-Long Term Railway Network Plan. Available online: http://www.nra.gov.cn/jgzf/flfg/gfxwj/zt/other/201607/t20160721_26055.shtml (accessed on 16 December 2017).
- Hou, Q.; Li, S.-M. Transport infrastructure development and changing spatial accessibility in the Greater Pearl River Delta, China, 1990–2020. J. Transp. Geogr. 2011, 19, 1350–1360. [Google Scholar] [CrossRef]
- Chandra, S.; Vadali, S. Evaluating accessibility impacts of the proposed America 2050 high-speed rail corridor for the Appalachian Region. J. Transp. Geogr. 2014, 37, 28–46. [Google Scholar] [CrossRef]
- Handy, S.L.; Niemeier, D.A. Measuring accessibility: An exploration of issues and alternatives. Environ. Plan. A 1997, 29, 1175–1194. [Google Scholar] [CrossRef]
- Geurs, K.T.; Wee, B.V. Accessibility evaluation of land-use and transport strategies: Review and research directions. J. Transp. Geogr. 2004, 12, 127–140. [Google Scholar] [CrossRef]
- Gutierrez, J.; Condeco-Melhorado, A.; Martin, J.C. Using accessibility indicators and GIS to assess spatial spillovers of transport infrastructure investment. J. Transp. Geogr. 2010, 18, 141–152. [Google Scholar] [CrossRef]
- Li, S.; Shum, Y. Impacts of the National Trunk Highway System on accessibility in China. J. Transp. Geogr. 2001, 9, 39–48. [Google Scholar] [CrossRef]
- Holl, A. Twenty years of accessibility improvements. The case of the Spanish motorway building programme. J. Transp. Geogr. 2007, 15, 286–297. [Google Scholar] [CrossRef]
- Kotavaara, O.; Antikainen, H.; Rusanen, J. Population change and accessibility by road and rail networks: GIS and statistical approach to Finland 1970–2007. J. Transp. Geogr. 2011, 19, 926–935. [Google Scholar] [CrossRef]
- Pérez, E.O.; Quintana, S.M.; Pastor, I.O. Road and railway accessibility atlas of Spain. J. Maps 2011, 7, 31–41. [Google Scholar] [CrossRef]
- Koopmans, C.; Rietveld, P.; Huijg, A. An accessibility approach to railways and municipal population growth. J. Transp. Geogr. 2012, 25, 94–104. [Google Scholar] [CrossRef]
- Pels, E.; Nijkamp, P.; Rietveld, P. Airport and Airline Competition for Passengers Departing from a Large Metropolitan Area. J. Urban Econ. 2000, 48, 29–45. [Google Scholar] [CrossRef]
- Nigel, H.; Svein, B. Impact of airports on regional accessibility and social development. J. Transp. Geogr. 2011, 19, 1145–1154. [Google Scholar]
- Shi, W.; Su, F.; Zhou, C.; Wu, W. Research on accessibility model of Nansha Islands and surrounding seaports. Acta Geogr. Sin. 2014, 69, 1510–1520. [Google Scholar]
- Cao, J.; Liu, X.C.; Wang, Y.; Li, Q. Accessibility impacts of China’s high-speed rail network. J. Transp. Geogr. 2013, 28, 12–21. [Google Scholar] [CrossRef]
- Jin, F.; Jiao, J.; Qi, Y.; Yang, Y. Evolution and geographic effects of high-speed rail in East Asia: An accessibility approach. J. Geogr. Sci. 2017, 27, 515–532. [Google Scholar] [CrossRef]
- Jiao, J.; Wang, J.E.; Jin, F.; Dunford, M. Impacts on accessibility of China’s present and future HSR network. J. Transp. Geogr. 2014, 40, 123–132. [Google Scholar] [CrossRef]
- NGCC. 1:1,000,000 National Geographic Database. Available online: http://www.webmap.cn/commres.do?method=result100W (accessed on 9 March 2018).
- Geofabik. Download OpenStreetMap Data for this Region: Asia. Available online: http://download.geofabrik.de/asia.html (accessed on 27 July 2017).
- NDRC. 13th Five-Year Plan for Railway Network. Available online: http://www.ndrc.gov.cn/gzdt/201711/t20171124_867822.html (accessed on 6 December 2017).
- BFIT. Economy Prediction System (EPS) Data Platform. Available online: http://www.epsnet.com.cn (accessed on 21 December 2016).
- CEI. CEInet Statistics Database. Available online: http://db.cei.gov.cn/ (accessed on 21 December 2016).
- NBSC. The Statistics of Major Cities. Available online: http://data.stats.gov.cn/easyquery.htm?cn=E0105 (accessed on 21 December 2016).
- Weiss, D.J.; Nelson, A.; Gibson, H.S.; Temperley, W.; Peedell, S.; Lieber, A.; Hancher, M.; Poyart, E.; Belchior, S.; Fullman, N.; et al. A global map of travel time to cities to assess inequalities in accessibility in 2015. Nature 2018, 553, 333–336. [Google Scholar] [CrossRef] [PubMed]
- Wang, L.; Liu, Y.; Sun, C.; Liu, Y. Accessibility Impact of the Present and Future High-Speed Rail Network: A Case Study of Jiangsu Province, China. J. Transp. Geogr. 2016, 54, 161–172. [Google Scholar] [CrossRef]
- Shaw, S.-L.; Fang, Z.; Lu, S.; Tao, R. Impacts of high speed rail on railroad network accessibility in China. J. Transp. Geogr. 2014, 40, 112–122. [Google Scholar] [CrossRef]
- Ortega, E.; López, E.; Monzón, A. Territorial cohesion impacts of high-speed rail at different planning levels. J. Transp. Geogr. 2012, 24, 130–141. [Google Scholar] [CrossRef]
- Wu, W.; Liang, Y.; Wu, D. Evaluating the Impact of China’s Rail Network Expansions on Local Accessibility: A Market Potential Approach. Sustainability 2006, 8, 512–613. [Google Scholar] [CrossRef]
- NRA. The Speed on the Beijing-Shanghai High-Speed Railway Was Increased to 350 km/h. Available online: http://www.nra.gov.cn/xwzx/xwdt/yjhxw/201708/t20170821_43377.shtml (accessed on 10 April 2018).


| Provinces | WATT Accessibility | Scenario 2/1 | Scenario 3/2 | ||||
|---|---|---|---|---|---|---|---|
| Scenario 1 | Scenario 2 | Scenario 3 | 2–1 | % | 3–2 | % | |
| Average of China | 18.7 | 13.1 | 10.3 | 5.6 | 29.8 | 2.8 | 21.4 |
| North China | 15.2 | 10.1 | 8.0 | 5.1 | 33.4 | 2.1 | 20.8 |
| Beijing | 14.4 | 8.4 | 7.1 | 6.0 | 41.8 | 1.2 | 14.8 |
| Tianjin | 13.9 | 8.6 | 7.4 | 5.3 | 38.2 | 1.2 | 14.2 |
| Hebei | 14.0 | 9.0 | 7.6 | 5.0 | 35.4 | 1.5 | 16.3 |
| Shanxi | 13.4 | 9.5 | 7.3 | 3.9 | 28.8 | 2.2 | 23.2 |
| Inner Mongolia | 20.5 | 15.2 | 10.8 | 5.3 | 25.9 | 4.4 | 29.1 |
| Northeast | 23.0 | 14.2 | 12.0 | 8.9 | 38.5 | 2.1 | 15.0 |
| Liaoning | 18.6 | 11.5 | 9.8 | 7.0 | 37.9 | 1.7 | 14.8 |
| Jilin | 22.7 | 14.1 | 11.7 | 8.7 | 38.1 | 2.4 | 17.3 |
| Heilongjiang | 27.8 | 16.9 | 14.6 | 10.9 | 39.3 | 2.2 | 13.2 |
| East China | 13.4 | 9.1 | 7.5 | 4.3 | 32.2 | 1.6 | 17.6 |
| Shanghai | 13.7 | 8.6 | 7.2 | 5.1 | 37.5 | 1.4 | 15.9 |
| Jiangsu | 12.5 | 8.6 | 7.1 | 3.9 | 31.0 | 1.5 | 17.0 |
| Zhejiang | 14.0 | 9.2 | 7.7 | 4.8 | 34.1 | 1.5 | 16.6 |
| Anhui | 11.7 | 8.4 | 7.1 | 3.3 | 28.4 | 1.3 | 15.6 |
| Fujian | 16.1 | 10.4 | 8.6 | 5.7 | 35.5 | 1.8 | 17.3 |
| Jiangxi | 13.0 | 9.4 | 7.4 | 3.6 | 27.4 | 2.0 | 21.6 |
| Shandong | 12.9 | 9.0 | 7.3 | 3.9 | 30.0 | 1.7 | 18.7 |
| Central China | 12.3 | 8.7 | 7.1 | 3.6 | 29.6 | 1.5 | 17.6 |
| Henan | 11.5 | 8.1 | 6.6 | 3.4 | 29.9 | 1.5 | 18.5 |
| Hubei | 11.8 | 8.7 | 7.1 | 3.2 | 26.9 | 1.6 | 18.2 |
| Hunan | 13.5 | 9.3 | 7.7 | 4.3 | 31.6 | 1.5 | 16.3 |
| South China | 20.3 | 13.7 | 10.0 | 6.6 | 32.6 | 3.8 | 27.4 |
| Guangdong | 17.5 | 10.7 | 9.1 | 6.7 | 38.5 | 1.6 | 15.2 |
| Guangxi | 18.5 | 11.9 | 9.8 | 6.7 | 35.9 | 2.1 | 17.5 |
| Hainan | 25.0 | 18.5 | 10.9 | 6.5 | 26.0 | 7.6 | 40.9 |
| Southwest | 23.1 | 18.2 | 14.4 | 4.9 | 21.1 | 3.8 | 20.9 |
| Chongqing | 15.3 | 11.1 | 7.6 | 4.3 | 27.8 | 3.5 | 31.6 |
| Sichuan | 17.7 | 13.5 | 9.6 | 4.2 | 23.5 | 3.9 | 29.1 |
| Guizhou | 17.0 | 11.3 | 9.0 | 5.7 | 33.7 | 2.3 | 20.3 |
| Yunnan | 24.0 | 18.1 | 13.2 | 5.9 | 24.6 | 4.9 | 27.3 |
| Tibet | 41.3 | 37.1 | 32.7 | 4.3 | 10.4 | 4.4 | 11.8 |
| Northwest | 23.5 | 17.9 | 13.2 | 5.6 | 23.6 | 4.8 | 26.5 |
| Shaanxi | 13.9 | 10.1 | 7.5 | 3.8 | 27.2 | 2.6 | 25.4 |
| Gansu | 19.3 | 14.6 | 10.3 | 4.6 | 24.1 | 4.3 | 29.6 |
| Qinghai | 23.3 | 18.9 | 13.1 | 4.4 | 18.9 | 5.7 | 30.3 |
| Ningxia | 17.9 | 14.4 | 9.3 | 3.5 | 19.7 | 5.1 | 35.4 |
| Xinjiang | 43.1 | 31.7 | 25.7 | 11.4 | 26.4 | 6.1 | 19.1 |
| Regions | Disparities of WATT | Scenario 2/1 | Scenario 3/1 | ||||
|---|---|---|---|---|---|---|---|
| Scenario 1 | Scenario 2 | Scenario 3 | 2–1 | % | 3–1 | % | |
| North China | 19.4% | 28.1% | 19.1% | 0.087 | 44.7% | −0.003 | −1.5% |
| Northeast | 20.0% | 18.8% | 20.2% | −0.012 | −6.1% | 0.002 | 0.8% |
| East China | 10.6% | 7.6% | 7.0% | −0.030 | −28.4% | −0.036 | −33.6% |
| Central China | 8.8% | 6.9% | 8.2% | −0.019 | −21.9% | −0.006 | −6.5% |
| South China | 20.1% | 30.6% | 9.3% | 0.105 | 52.3% | −0.108 | −53.8% |
| Southwest | 46.4% | 59.9% | 72.3% | 0.134 | 28.9% | 0.259 | 55.7% |
| Northwest | 48.9% | 46.3% | 55.1% | −0.026 | −5.2% | 0.062 | 12.7% |
| Provinces | DA Accessibility | Scenario 2/1 | Scenario 3/2 | ||||
|---|---|---|---|---|---|---|---|
| Scenario 1 | Scenario 2 | Scenario 3 | 2–1 | % | 3–2 | % | |
| Average of China | 61.1 | 78.5 | 109.1 | 17.4 | 28.5 | 30.6 | 39.0 |
| North China | 79.3 | 114.1 | 163.6 | 34.8 | 43.9 | 49.6 | 43.5 |
| Beijing | 87.6 | 156.6 | 227.7 | 69.0 | 78.8 | 71.1 | 45.4 |
| Tianjin | 103.5 | 160.9 | 213.6 | 57.4 | 55.5 | 52.7 | 32.7 |
| Hebei | 108.5 | 136.1 | 179.8 | 27.6 | 25.4 | 43.6 | 32.1 |
| Shanxi | 82.2 | 102.0 | 167.8 | 19.9 | 24.2 | 65.7 | 64.4 |
| Inner Mongolia | 14.6 | 14.6 | 29.4 | 0.0 | 0.0 | 14.8 | 101.4 |
| Northeast | 32.8 | 40.0 | 49.3 | 7.1 | 21.8 | 9.3 | 23.4 |
| Liaoning | 44.6 | 58.9 | 74.3 | 14.3 | 32.2 | 15.4 | 26.1 |
| Jilin | 35.5 | 40.9 | 50.4 | 5.4 | 15.3 | 9.5 | 23.2 |
| Heilongjiang | 18.4 | 20.1 | 23.2 | 1.7 | 9.1 | 3.1 | 15.6 |
| East China | 100.7 | 132.8 | 173.9 | 32.2 | 31.9 | 41.1 | 30.9 |
| Shanghai | 108.5 | 160.9 | 179.0 | 52.5 | 48.4 | 18.1 | 11.2 |
| Jiangsu | 130.9 | 163.4 | 218.7 | 32.5 | 24.8 | 55.3 | 33.8 |
| Zhejiang | 88.2 | 123.7 | 144.3 | 35.4 | 40.1 | 20.6 | 16.7 |
| Anhui | 135.7 | 174.6 | 244.8 | 39.0 | 28.7 | 70.2 | 40.2 |
| Fujian | 47.6 | 63.8 | 79.4 | 16.2 | 34.0 | 15.7 | 24.6 |
| Jiangxi | 67.7 | 88.7 | 139.1 | 20.9 | 30.9 | 50.4 | 56.9 |
| Shandong | 126.2 | 154.9 | 212.3 | 28.7 | 22.7 | 57.4 | 37.1 |
| Central China | 106.9 | 134.7 | 182.6 | 27.8 | 26.0 | 47.9 | 35.6 |
| Henan | 158.7 | 192.9 | 260.8 | 34.2 | 21.5 | 67.9 | 35.2 |
| Hubei | 86.6 | 109.5 | 157.4 | 22.9 | 26.5 | 47.9 | 43.7 |
| Hunan | 75.3 | 101.8 | 129.7 | 26.4 | 35.1 | 28.0 | 27.5 |
| South China | 41.0 | 52.2 | 74.1 | 11.2 | 27.2 | 21.9 | 42.0 |
| Guangdong | 67.5 | 87.5 | 102.3 | 20.0 | 29.7 | 14.8 | 16.9 |
| Guangxi | 52.4 | 65.9 | 80.6 | 13.5 | 25.7 | 14.6 | 22.2 |
| Hainan | 3.2 | 3.2 | 39.5 | 0.0 | 0.0 | 36.3 | 1131.2 |
| Southwest | 49.4 | 55.3 | 84.7 | 6.0 | 12.1 | 29.3 | 53.0 |
| Chongqing | 100.0 | 120.5 | 176.4 | 20.6 | 20.6 | 55.9 | 46.3 |
| Sichuan | 72.8 | 79.2 | 110.8 | 6.4 | 8.8 | 31.5 | 39.8 |
| Guizhou | 52.2 | 55.1 | 101.1 | 2.9 | 5.5 | 46.0 | 83.4 |
| Yunnan | 21.1 | 21.1 | 34.3 | 0.0 | 0.0 | 13.2 | 62.6 |
| Tibet | 0.7 | 0.7 | 0.7 | 0.0 | 0.0 | 0.0 | 0.0 |
| Northwest | 17.5 | 20.2 | 35.2 | 2.7 | 15.5 | 15.0 | 74.0 |
| Shaanxi | 47.2 | 58.9 | 111.2 | 11.7 | 24.9 | 52.2 | 88.6 |
| Gansu | 17.5 | 18.3 | 27.9 | 0.8 | 4.5 | 9.5 | 52.0 |
| Qinghai | 6.2 | 7.2 | 8.2 | 1.1 | 17.3 | 1.0 | 14.1 |
| Ningxia | 13.8 | 13.8 | 25.9 | 0.0 | 0.0 | 12.1 | 87.3 |
| Xinjiang | 2.9 | 2.9 | 2.9 | 0.0 | 0.0 | 0.0 | 0.0 |
| Rank | Scenario 1 | Scenario 2 | Scenario 3 | Scenario 3/1 (Absolute) | Scenario 3/1 (Relative) | |||||
|---|---|---|---|---|---|---|---|---|---|---|
| WATT | DA | WATT | DA | WATT | DA | WATT | DA | WATT | DA | |
| 1 | Henan | Henan | Henan | Henan | Henan | Henan | Xinjiang | Beijing | Hainan | Hainan |
| 2 | Anhui | Anhui | Anhui | Anhui | Anhui | Anhui | Hainan | Tianjin | Chongqing | Beijing |
| 3 | Hubei | Jiangsu | Beijing | Jiangsu | Hubei | Beijing | Heilongjiang | Anhui | Beijing | Shaanxi |
| 4 | Jiangsu | Shandong | Shanghai | Shanghai | Beijing | Jiangsu | Jilin | Henan | Jilin | Tianjin |
| 5 | Shandong | Hebei | Tianjin | Tianjin | Jiangsu | Tianjin | Yunnan | Jiangsu | Ningxia | Jiangxi |
| 6 | Jiangxi | Shanghai | Jiangsu | Beijing | Shanghai | Shandong | Qinghai | Shandong | Guangdong | Shanxi |
| 7 | Shanxi | Tianjin | Hubei | Shandong | Shanxi | Hebei | Inner Mongolia | Shanxi | Inner Mongolia | Inner Mongolia |
| 8 | Hunan | Chongqing | Shandong | Hebei | Shandong | Shanghai | Gansu | Chongqing | Shanghai | Guizhou |
| 9 | Shanghai | Zhejiang | Hebei | Zhejiang | Tianjin | Chongqing | Liaoning | Jiangxi | Heilongjiang | Ningxia |
| 10 | Shaanxi | Beijing | Zhejiang | Chongqing | Jiangxi | Shanxi | Guangxi | Hebei | Guizhou | Hubei |
| Study | Phase | Key Results |
|---|---|---|
| Cao et al. (2013) | 2008–2020 | Central-eastern cities gain more benefits based on the results of WATT and contour measures. |
| Shaw et al. (2014) | 2008–2012 | Travel time accessibility of all cities improved about 6.3%. |
| Jiao et al. (2014) | 2003–2020 | WATT increases 42.3% and DA increases 76.4% The HSR increases inequality in accessibility. |
| Wu et al. (2016) | 2006–2014 | The average accessibility improvements experienced a rise of 19.3% at the national level. |
| Jin et al. (2017) | 2008–2020 | WATT increases 42.0% and DA increases 98.7% The inequality of accessibility is aggravated. |
| This study | 2003–2030 | WATT increases 44.9% and DA increases 78.6% The inequality of accessibility is slightly increased. |
© 2018 by the authors. Licensee MDPI, Basel, Switzerland. This article is an open access article distributed under the terms and conditions of the Creative Commons Attribution (CC BY) license (http://creativecommons.org/licenses/by/4.0/).
Share and Cite
Wang, L.; Liu, Y.; Mao, L.; Sun, C. Potential Impacts of China 2030 High-Speed Rail Network on Ground Transportation Accessibility. Sustainability 2018, 10, 1270. https://doi.org/10.3390/su10041270
Wang L, Liu Y, Mao L, Sun C. Potential Impacts of China 2030 High-Speed Rail Network on Ground Transportation Accessibility. Sustainability. 2018; 10(4):1270. https://doi.org/10.3390/su10041270
Chicago/Turabian StyleWang, Lvhua, Yongxue Liu, Liang Mao, and Chao Sun. 2018. "Potential Impacts of China 2030 High-Speed Rail Network on Ground Transportation Accessibility" Sustainability 10, no. 4: 1270. https://doi.org/10.3390/su10041270
APA StyleWang, L., Liu, Y., Mao, L., & Sun, C. (2018). Potential Impacts of China 2030 High-Speed Rail Network on Ground Transportation Accessibility. Sustainability, 10(4), 1270. https://doi.org/10.3390/su10041270