Article

Optimal Locating of Electric Vehicle Charging Stations by Application of Genetic Algorithm

Politecnico di Milano, Department of Energy, Via La Masa, 34, 20156 Milano (MI), Italy
*
Author to whom correspondence should be addressed.
Sustainability 2018, 10(4), 1076; https://doi.org/10.3390/su10041076
Submission received: 2 January 2018 / Revised: 20 March 2018 / Accepted: 28 March 2018 / Published: 4 April 2018
(This article belongs to the Collection Power System and Sustainability)

Abstract

:
The advent of alternative vehicle technologies such as Electrical Vehicles (EVs) is an efficient effort to reduce the emission of carbon oxides and nitrogen oxides. Ironically, EVs poses concerns related to vehicle recharging and management. Due to the significance of charging station infrastructure, electric vehicles’ charging stations deployment is investigated in this work. Its aim is to consider several limitations such as the power of charging station, the average time needed for each recharge, and traveling distance per day. Initially, a mathematical formulation of the problem is framed. Then, this problem is optimized by application of Genetic Algorithm (GA), with the objective to calculate the necessary number of charging stations then finding the best positions to locate them to satisfy the clients demand.

1. Introduction

From general aspects of energy, with reduction of greenhouse gas emission target and to have a non-polluting, reliable and sustainable energy system [1], almost all automotive companies are committed to switching to Electric Vehicles (EVs) rather than keeping conventional cars, which work with Internal Combustion Engine (ICE). Although electric vehicles are quite expensive in comparison to conventional cars, the most motivating news is that users can get benefit with a lower spending on maintenance and operation costs. However, governments encourage people by giving users subsidies and invest in EV Charging Stations Infrastructure to help companies make this transition smoother from ICE Vehicles (ICEV) to the new generation of cars. The efficiency of EV relies on many parameters such as its battery, the power of charging stations, etc. [2]. Thus, regarding this methodology, by optimizing the distance between charging stations, the cost will be minimized.
Charging Station (CS) infrastructure deployment is the most significant issue for the EV industry. In general, optimization algorithms, which are used to solve the EV Charging Station locating problem, are usually focused on maximization of the clients need or minimization of the travel costs. Some optimal locating charging station problems of electric vehicles have been considered in recent years [3,4,5,6]. In [2], by considering a multi-objective function, optimization in speed and efficiency increase was achieved in addition to the minimization of two other significant factors in distribution system: voltage deviation and power loss. In this study, the traffic assignment is overlooked in contrast to [3,7]. In this work, the start and final destinations are highlighted. Analogous works have been done in diverse countries such as Iran [5], Sweden [8], and Germany [9]. Another analysis was fulfilled in [3] Ontario’s transmission network in terms of a zonal model to preserve the optimized charging stations which are considered as loads into an acceptable margin. In [3], graph theory was utilized to solve the problem. A method was presented in [4] to place the optimal charging stations using service radius of EV charging stations. A simultaneous optimization placement of charging stations in presence of capacitors was presented in [10], which caused a remarkable reduction in power loss and improved voltage profile in the distribution system. A Markov modelling approach in [11] was utilized to set EV charging stations. There are several research papers on optimal placement of EV Charging Stations by application of Genetic Algorithm (GA). In [12], an optimal placement employing GA was proposed to minimize the range anxiety using GPS data. The objective of this paper is to develop a method that would be applicable in comparison to the above-mentioned approaches. As a comprehensive research on the use of genetic algorithm to solve the location problems, proved that GA could be more accurate and superior than other optimization algorithms [13]. Since data acquisition for electric vehicle usage is limited, a record of EVs in Milan is required as a real data reference [14]. To demonstrate the presented work, three different cases are introduced. A Genetic Algorithm is employed to solve the problem in each mode. This research contributes to give the EVs clients assurance in decreasing the costs for using EVs and make them confident about issues such as social acceptance and insufficient charging stations by locating the adequate number of CSs in the adequate coordinate.
By introducing some constraints such as power of charging station, average time needed for each recharge, power consumption of electric vehicle, average travel distance per day, average electricity demand per day for an electric vehicle, number of charge cycles per day and estimating the number of EVs in the given year using bass model, the number of Charging Stations are calculated for each Mode. Then, GA optimizes the problem in each mode after approximately 1000 iterations.
The objective of this work is to minimize the recharge cost by proposing a function based on the distance constructed with Haversine Formula [14], which is connected to a cost function, and then implementing GA optimization, reaching the goal of best positions for charging stations. A genetic algorithm code in a planning area, whose task is to optimize the fittest function within a generation, is implemented. A flowchart of genetic algorithm task is presented in the following section to clarify the problem. The algorithm repeats the optimization loop up to the point that its convergence curve reaches a saturation and then the optimization process stops. As a study case, this method is performed in Milan city, Italy. The summation of optimal distance between settlements to the closest charging station in three different modes are found and their relevant 3D-plots in each mode are drawn. Then, with some constants that present the target function, i.e., recharging cost for an electric vehicle in each settlement, is calculated and depicted as a result. Moreover, with accumulated data of recharging cost in each mode, the total recharge cost is presented separately so that a better deduction is drawn in conclusion.

2. Charging Modes for EVs Charging Stations

European electricity companies, particularly distribution system operators (DSOs), are investing in the necessary infrastructure to build a single European market for EVs. European standards are indispensable to safeguard that drivers enjoy convenient EU-wide charging solutions that avoid a multiplicity of cables and adaptors and thus retrofit costs [15,16]. Today, the only standards available at European level, dealing with the charging system, plugs, and sockets, are contained in the IEC 61851 [17,18]. It provides a first classification of the type of charger in function of its rated power and thus time of recharge, defining different charging modes:
  • Mode 1: Charging refers to the connection of an EV to the AC supply network through a single phase AC line not exceeding 250 V AC or a three phase AC line not exceeding 480 V AC at 50–60 Hz, using national plug and socket system not exceeding 16 A with protective earth conductors, depending on the country and standardization. This low power vehicle charging mode is the slowest mode and can refill a battery overnight reaching full capacity before morning. This type of overnight recharge ensures a low electric load for the grid and the car is recharged economically using a low cost night rate power. This recharging mode is mainly used at home and office, since no additional infrastructures are required.
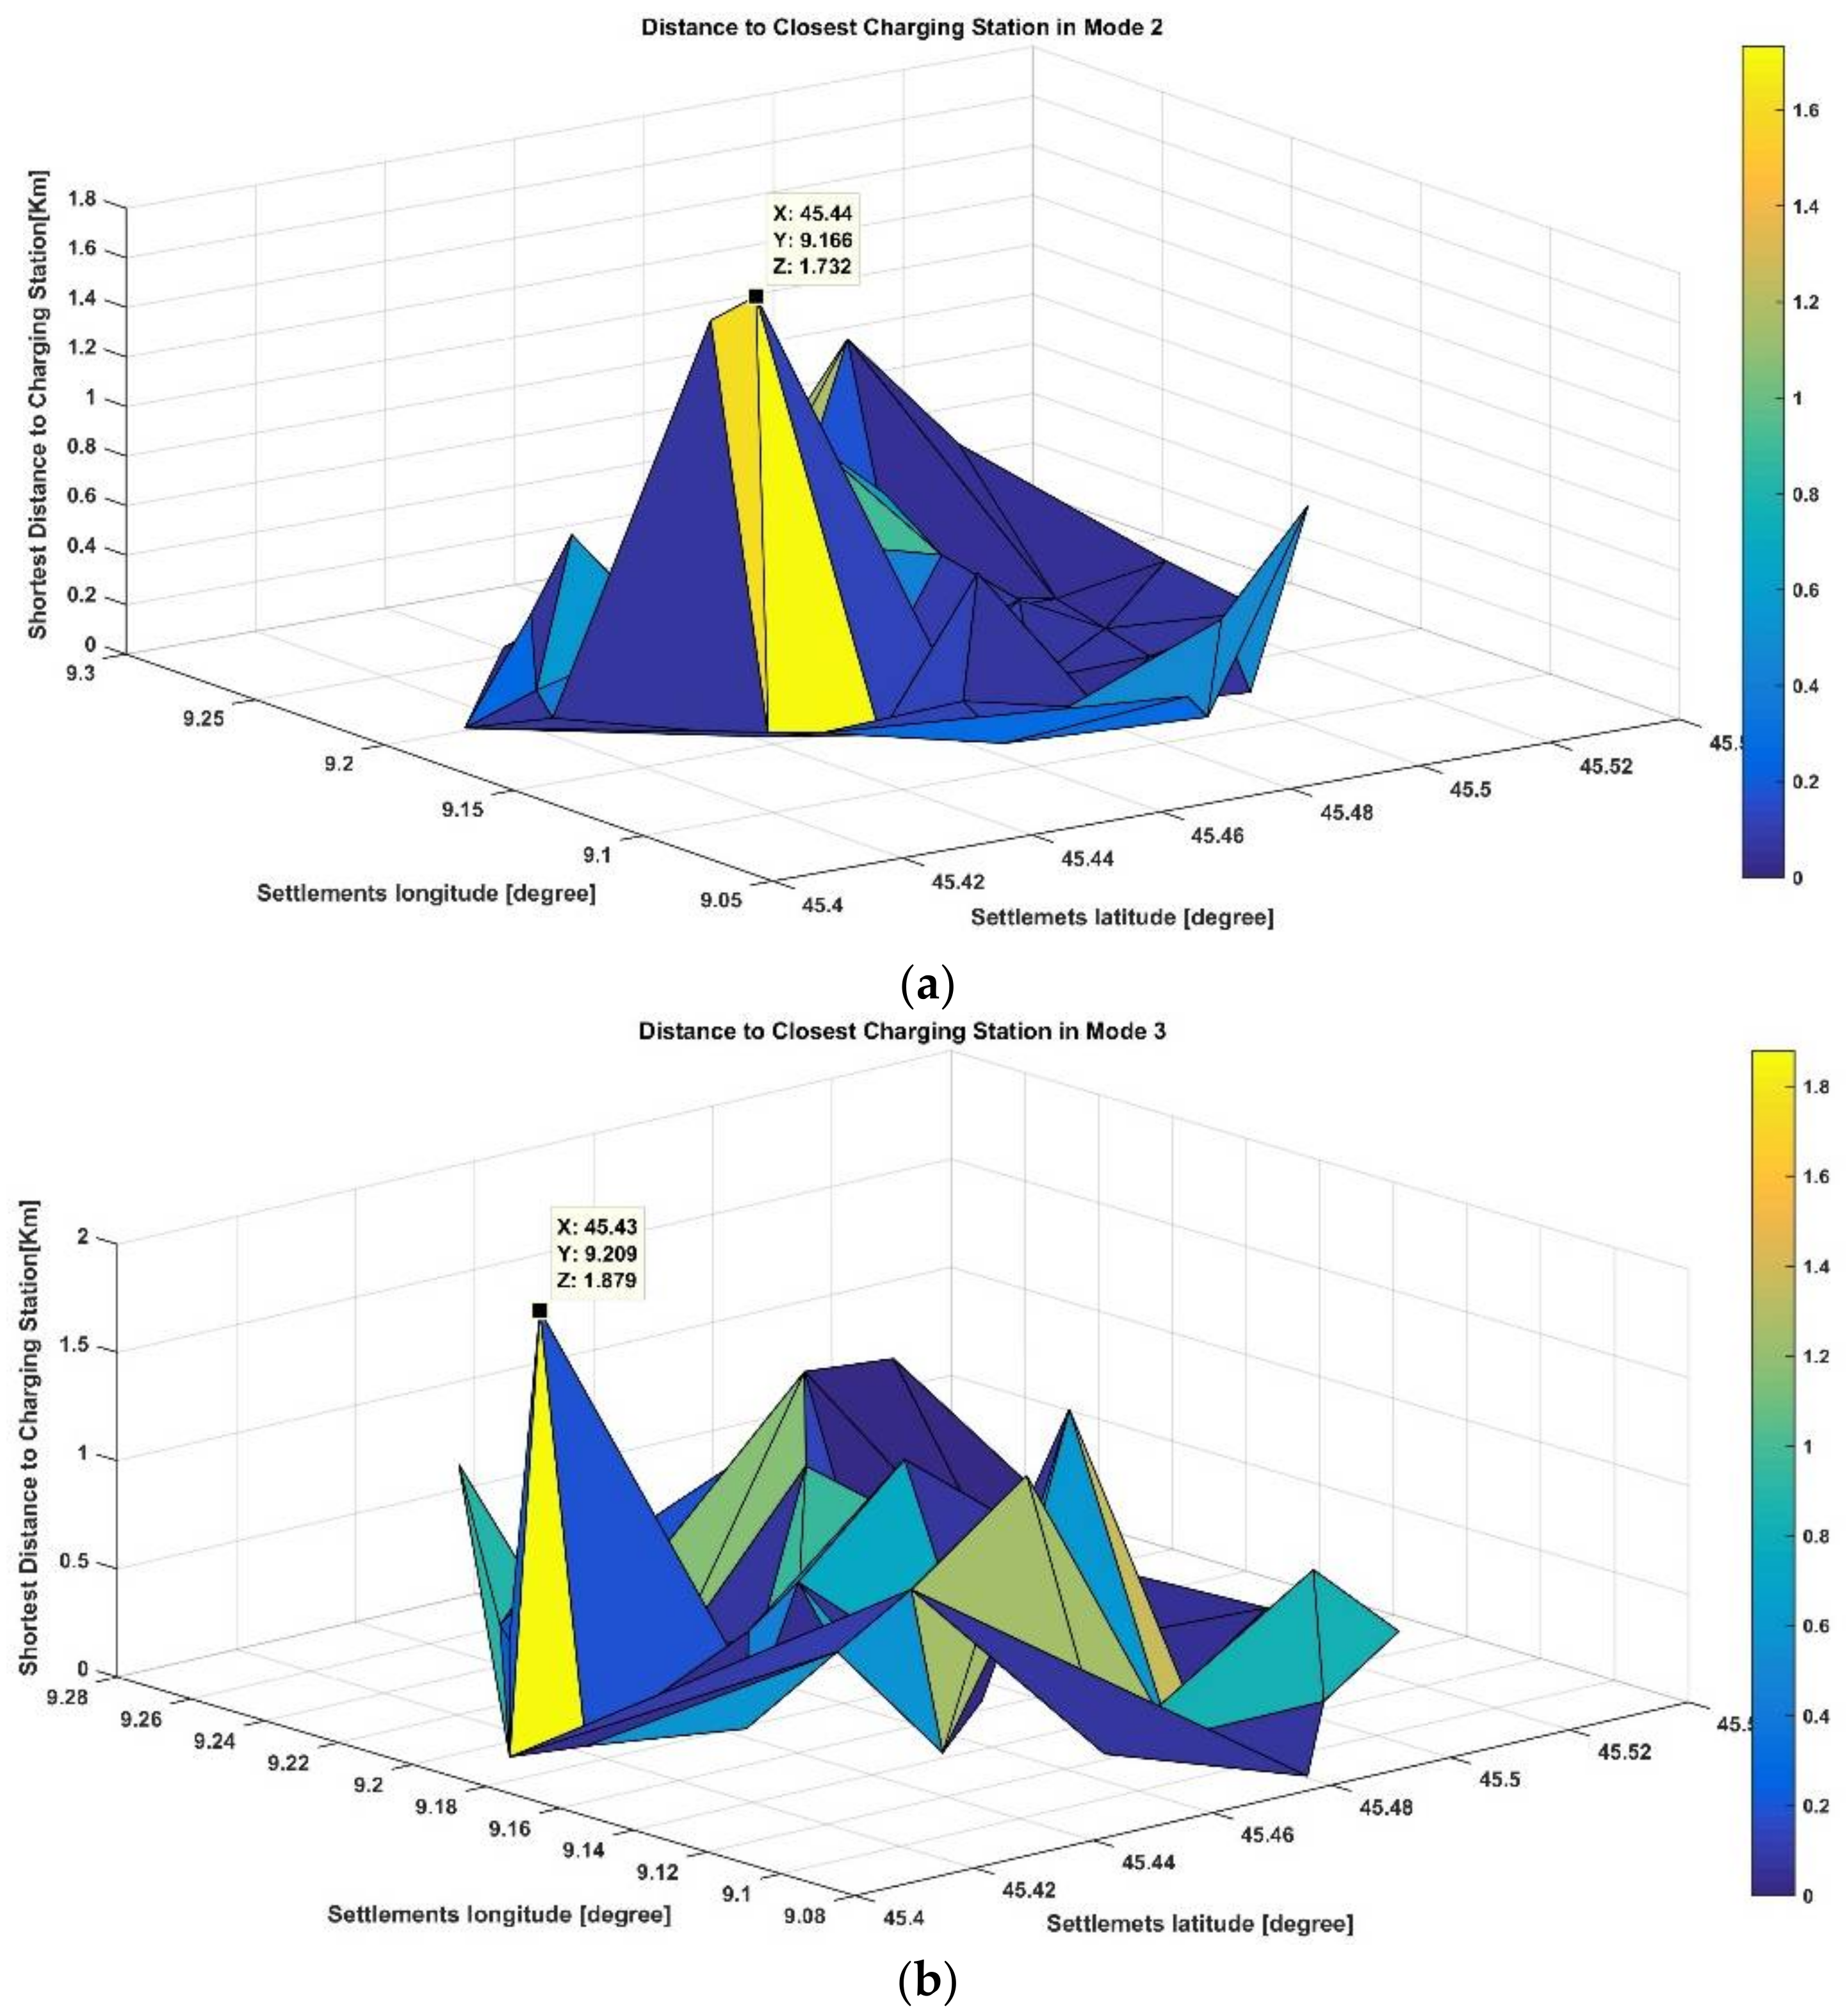
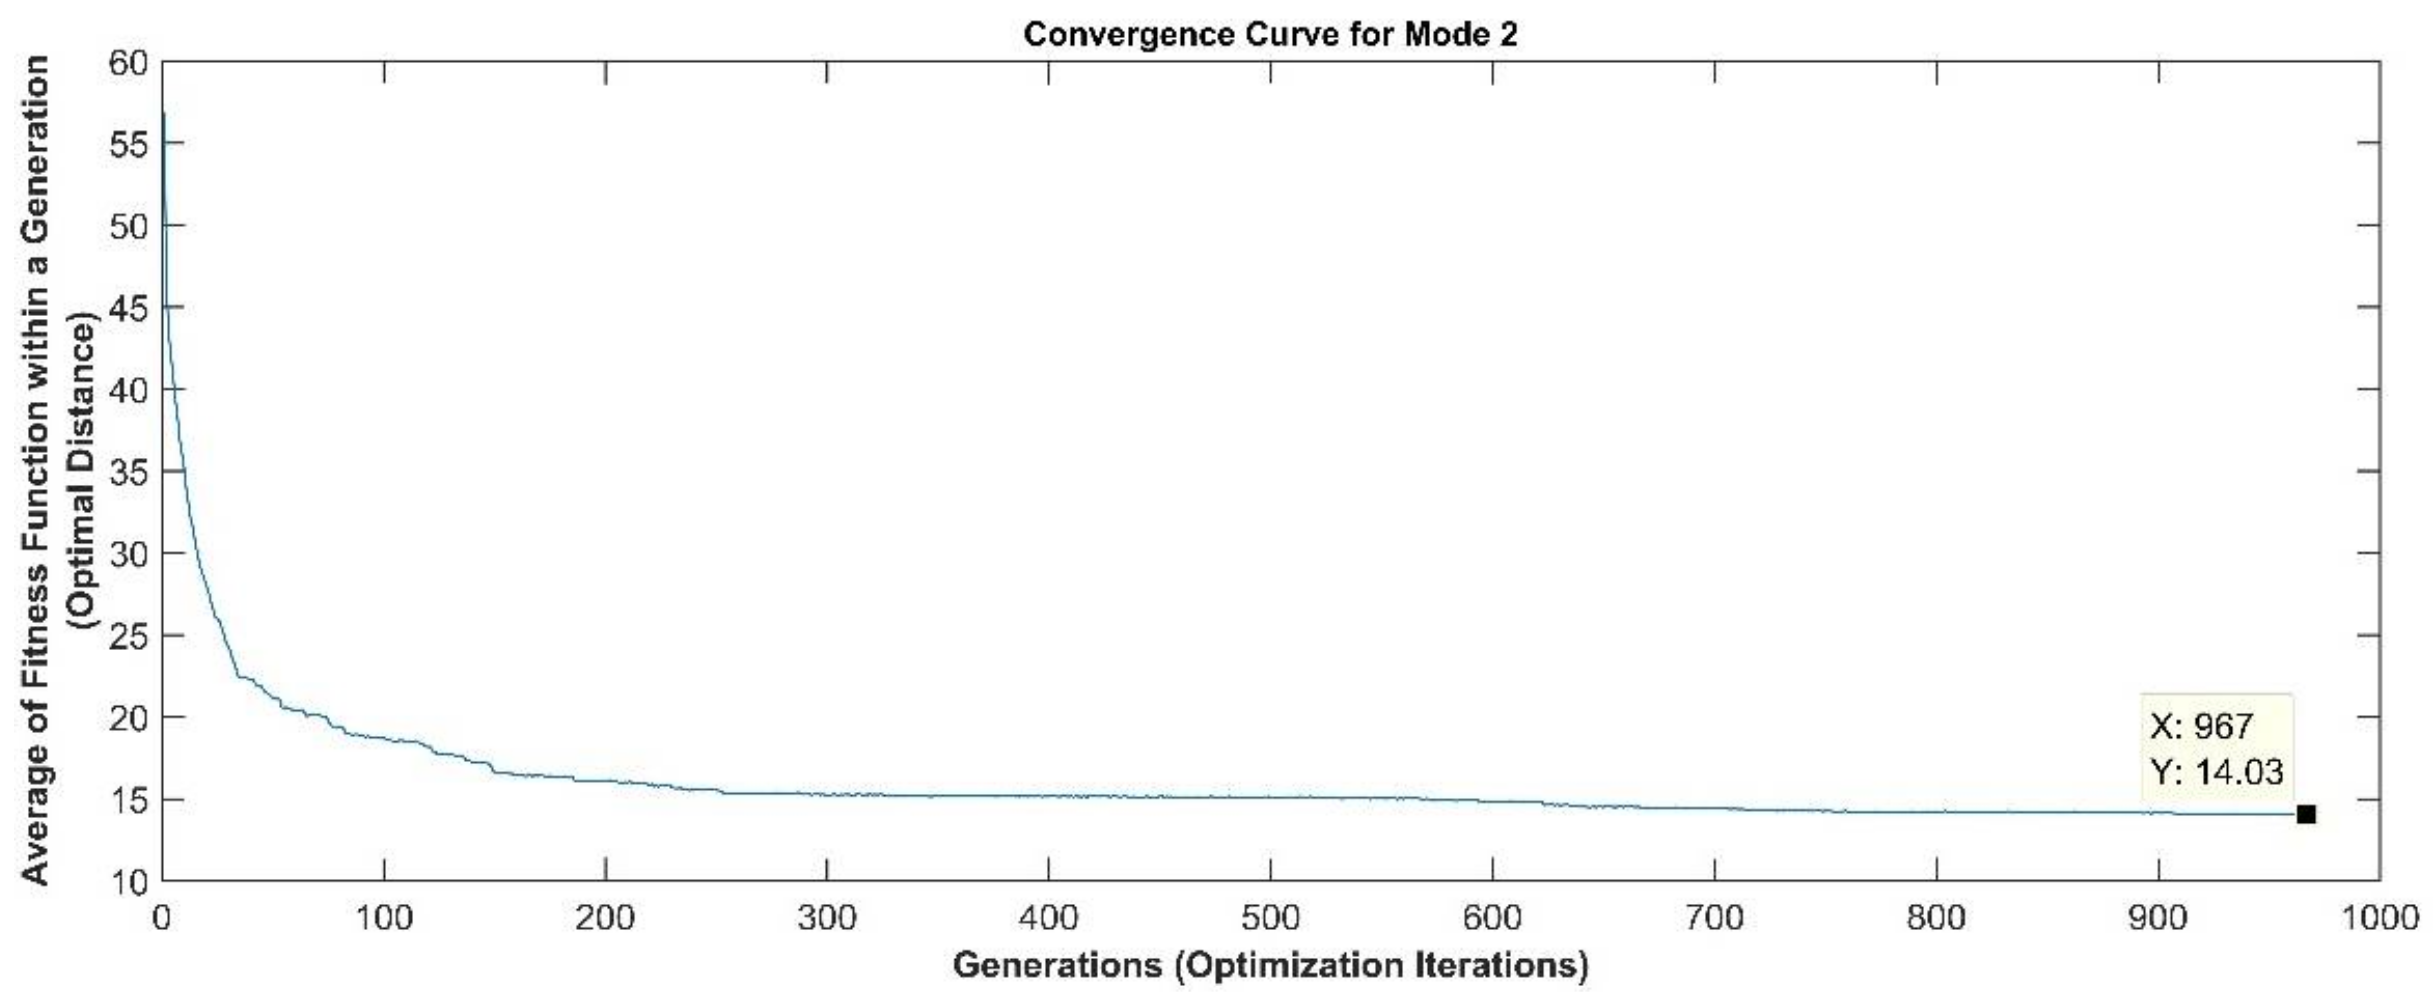
  • Mode 2: Charging refers to the connection of an EV to the AC supply network with the same voltage limits as for Mode 1, using standard wall sockets and plugs not exceeding 32 A with protective earth conductors. The difference with Mode 1 consists in the fact that the vehicle inlet and connector present a control pin. The supply network side of the cable does not require a control pin as the control function is provided by an integrated control box with the further function of in cable protection device. This recharging mode is primarily used for dedicated private facilities.
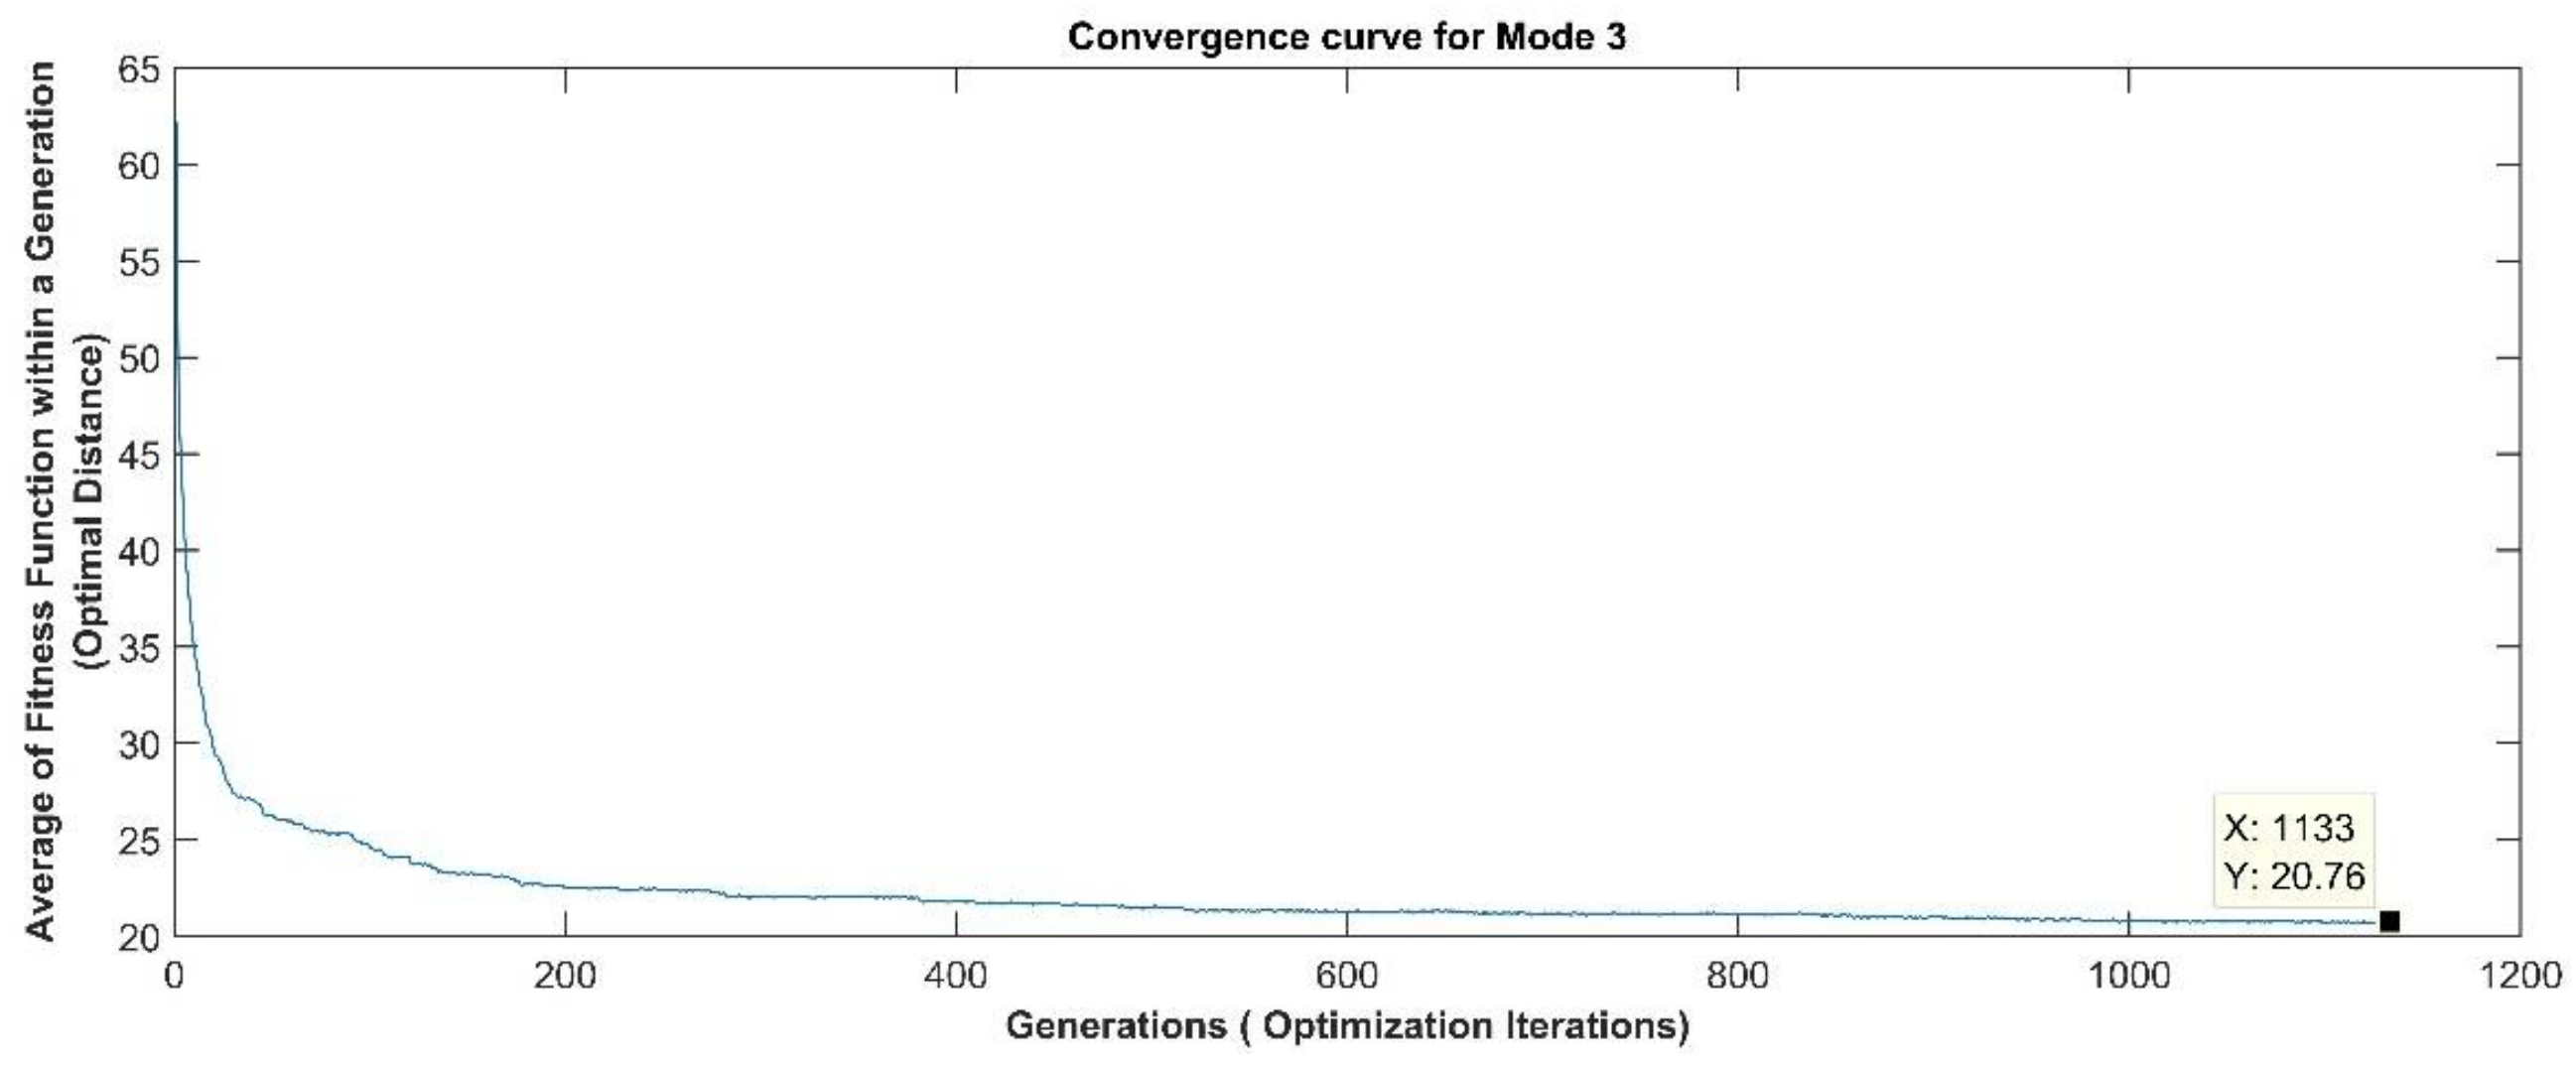
  • Mode 3: Charging refers to the connection of the EV to the AC supply network using an Electric Vehicle Supply Equipment (EVSE), not exceeding 63 A, where the control pilot function is extended from Mode 2 to control equipment permanently connected to the AC supply. In this case, connectors with a group of control and signal pins are required for both sides of the cable. This recharging mode is typical of public charging stations and is generally supplied from three-phase AC mains at 50/60 Hz. It is also called “semi-fast” charging solution since it is possible to charge a battery in few hours when the driver is at work or during every day activity.
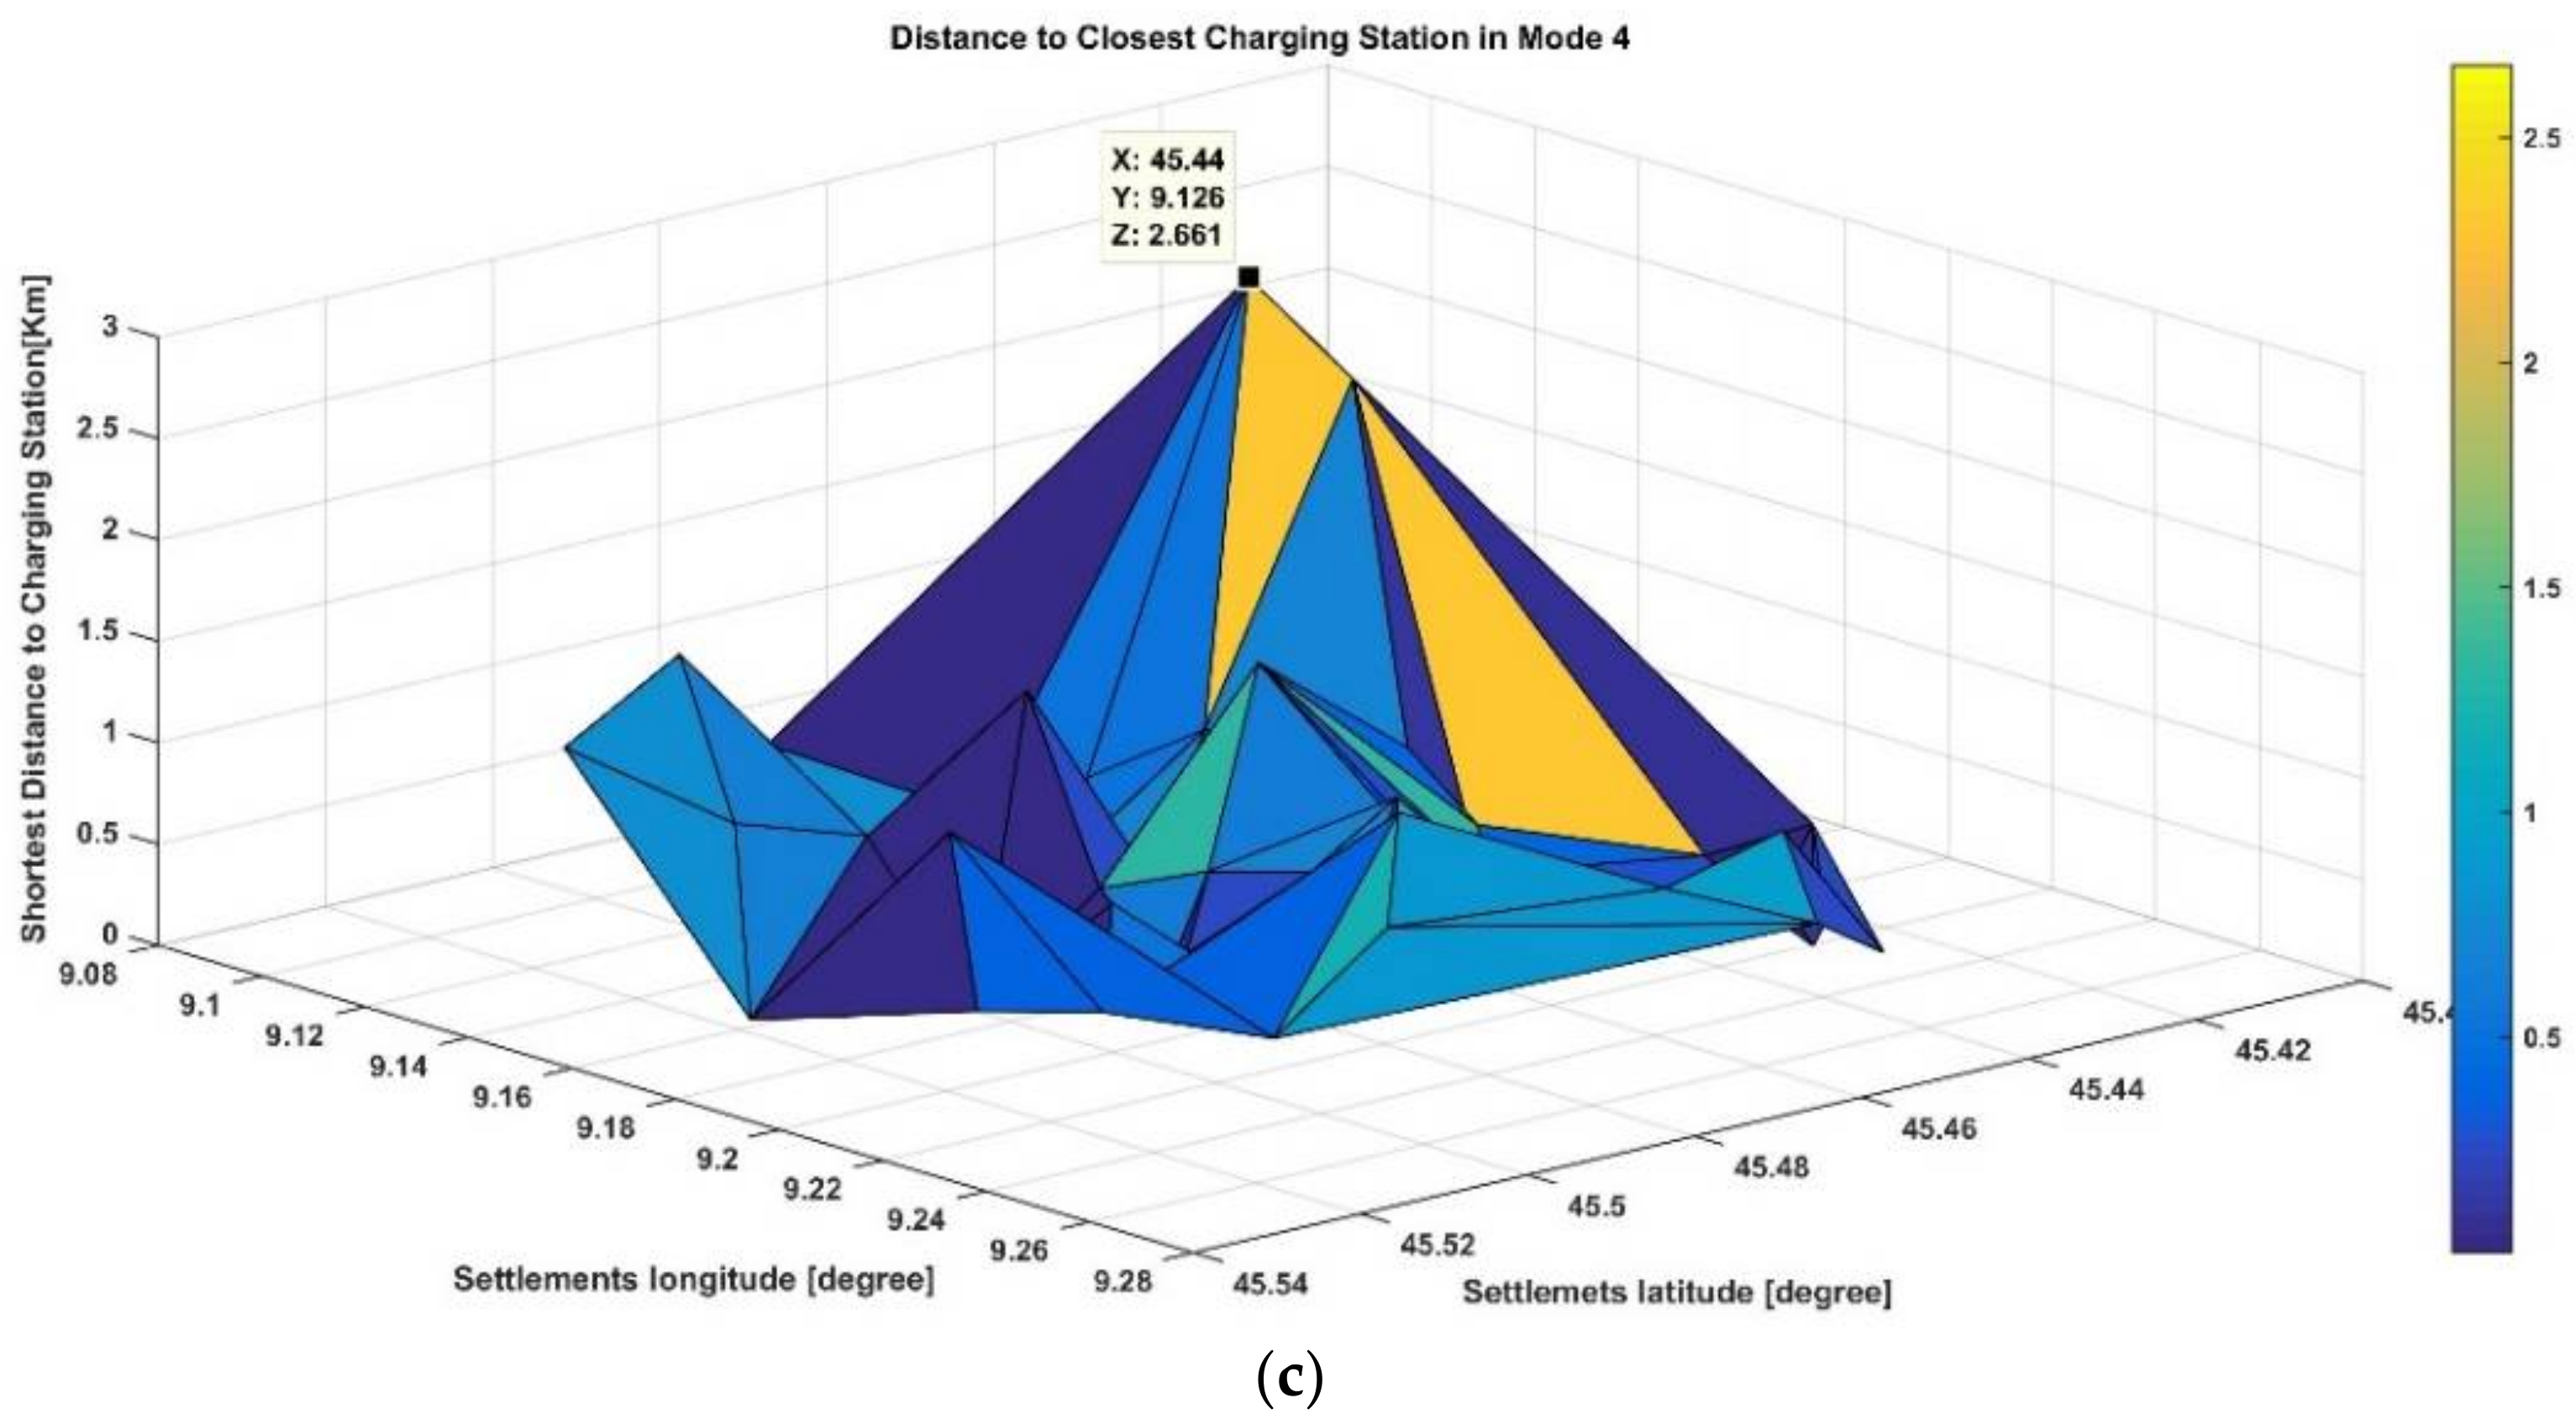
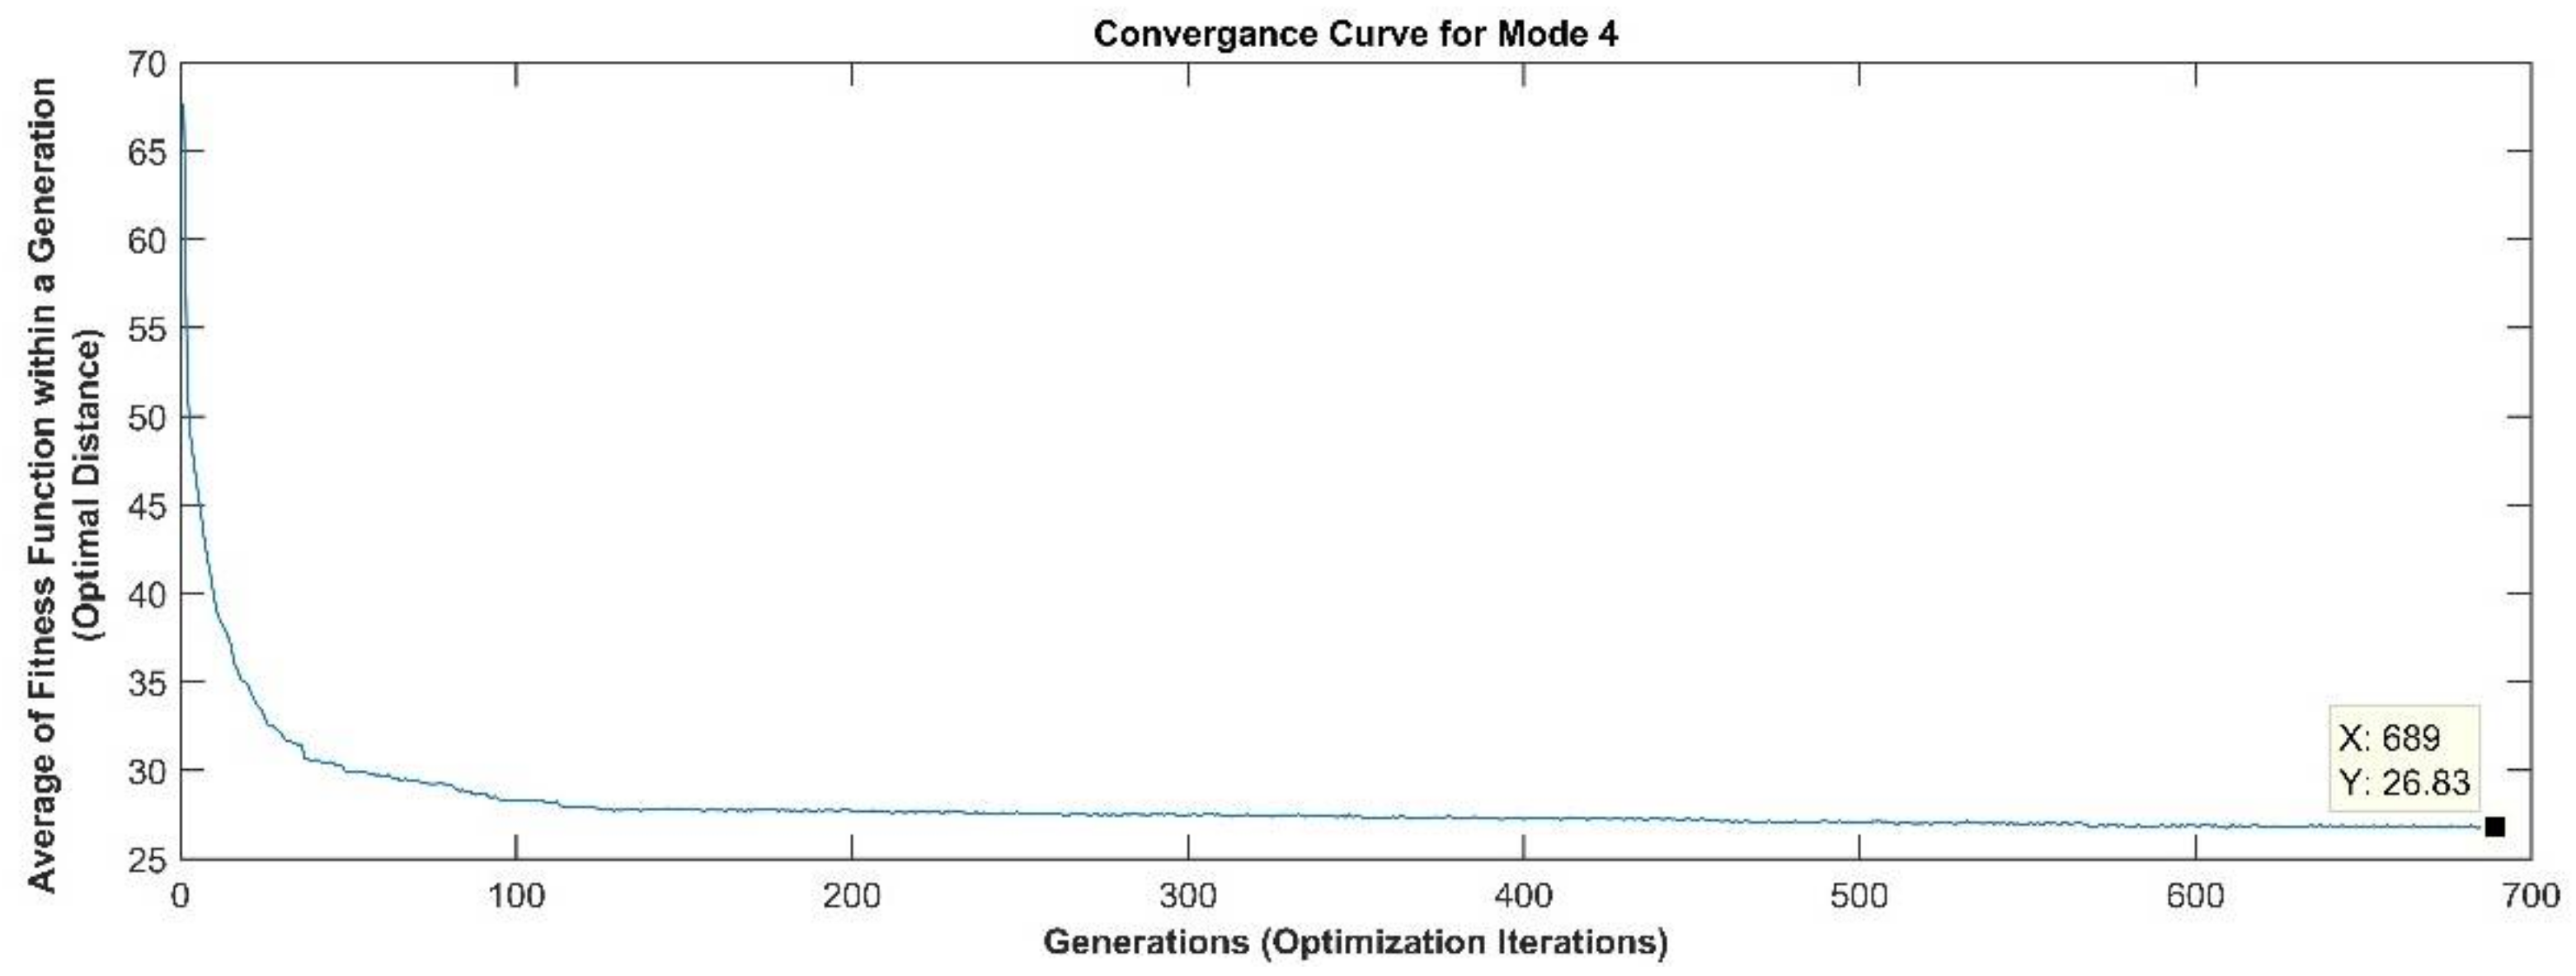
  • Mode 4: It has been implemented by the CHAdeMO consortium and is characterized by the use of off-board chargers where the control pilot function is extended also to the equipment permanently connected to the AC supply. The supply AC power is converted in the charging station to DC and the plug ensures that only a matching electric vehicle can be connected. Typical charging times of Mode 4 are in a range from 20 to 30 min. In this case, the charging time is limited by the allowable current of 125 A and voltage of 500 V of the CHAdeMO standard connector.
These modes are also briefly described in Table 1.

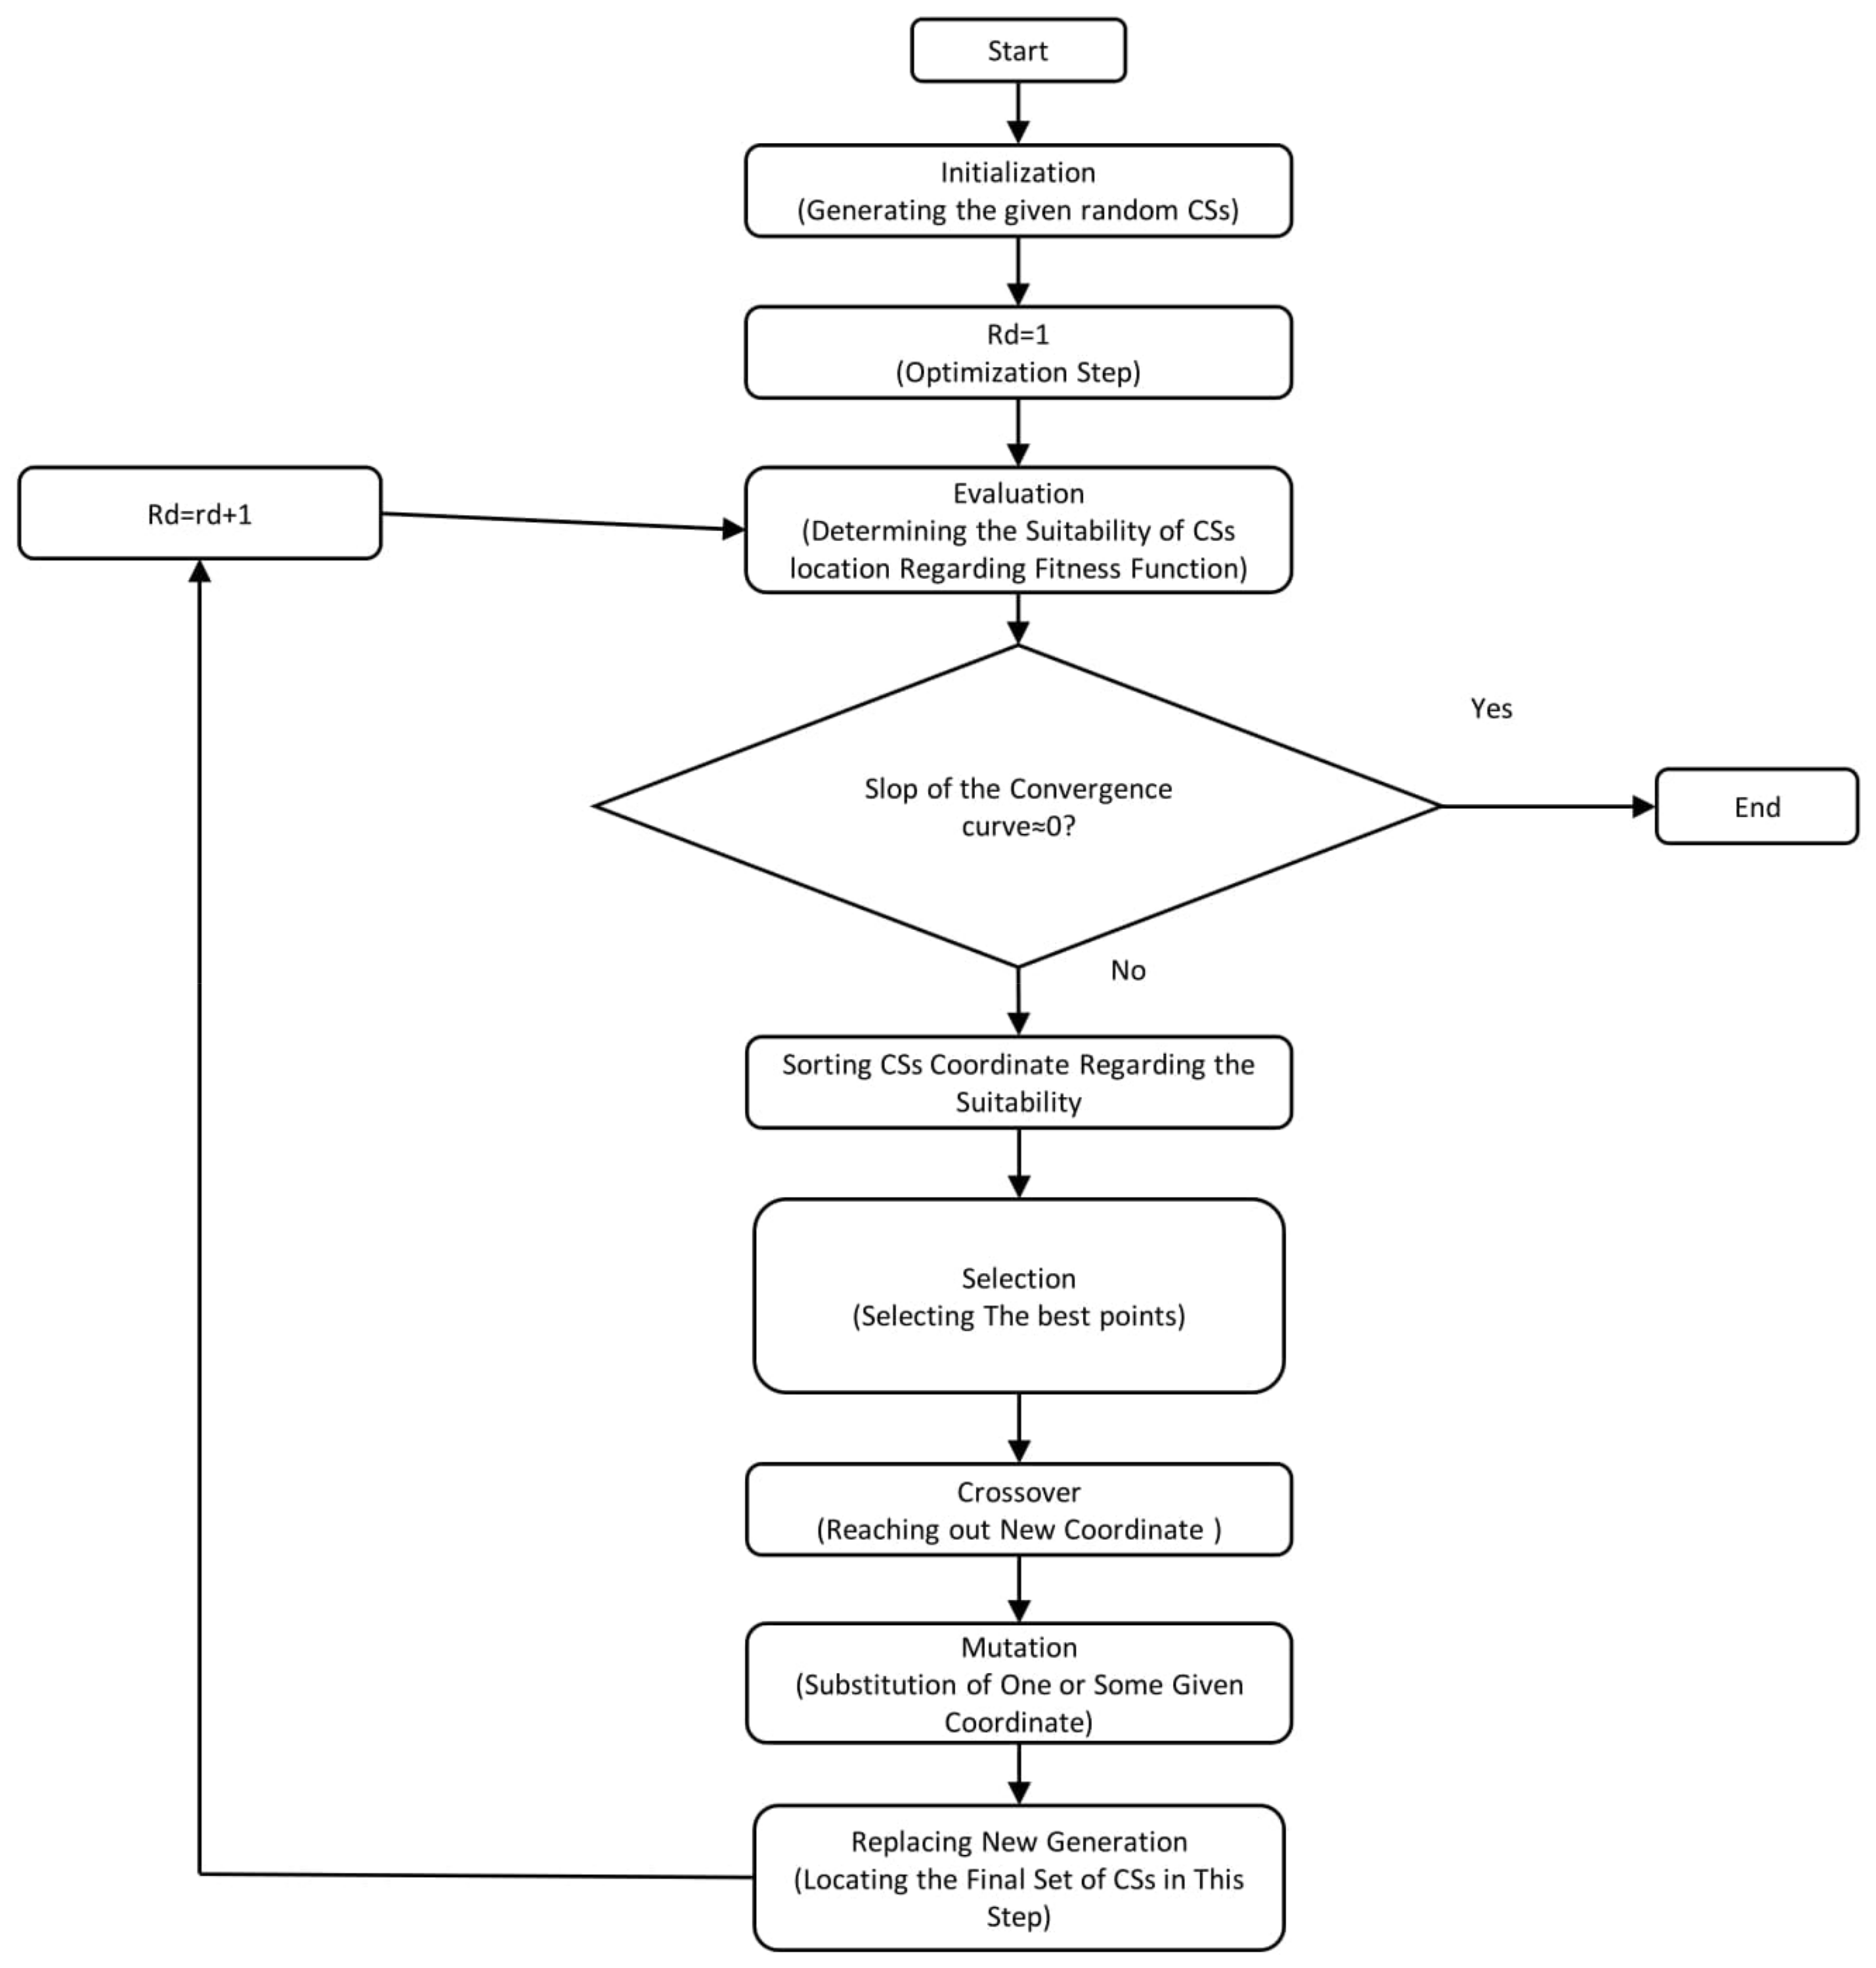
3. Description of Genetic Algorithm

The optimization method proposed is based on a Genetic Algorithm (GA) [19,20]. The genetic algorithm is a stochastic algorithm based on the principles of genetics, natural selection and Darwinian evolution that allows the survival of the individual with the genetic baggage that is more suited to survive in the environment in which he lives, allowing the reproduction and transmission of the best genes to the new generation [21,22,23,24]. Determination of optimal locations for EV charging stations is performed by minimization of cost functions applying a GA. In this case, where the focus is not on living beings, the chromosomes of the genetic baggage involved in the process will be bit strings, and the environmental conditions to which these will have to adapt will be a fitness function that will allow a close evaluation of several factors to optimize the different objectives chosen [25,26,27]. This method can also be used in other areas by appropriately adapting objectives and participants in the selection. To adapt a GA considering the specifications of the problem, the objective function that is to be optimized, the concept of chromosome and equivalent of gene need to be defined [28]. Moreover, dynamics of crossover and mutation must be determined. A concise description of GA helps to understand how it is adapted to the specific problem of optimal placement of charging stations in a city like Milan. Describing the problem in the form of a mathematical equation, which is called “Objective Function” or “Fitness” function, occurs before any discussion about the algorithm. The goal of application of the GA is optimization of the objective function. GA starts by generating a population of random answers, which is called initial population (Initialization). Any member of this population is a random answer. Structure of a possible answer is considered as a chromosome consisting of a sequence of properties. Each of these properties is considered a gene. Therefore, a possible answer is considered as a string of digits or characters. A chromosome, which represents an answer for the fitness function, is considered as a vertical string of pairs of latitudes and longitudes and every pair is considered as a gen. The second step is to determine the goodness of these random answers by means of the objective function (Evaluation). Thirdly, these answers are sorted by their goodness. The fourth step is to select pairs among these answers. This is a fitness proportionate selection which is influenced by two factors: chance and goodness of answers (Parent Selection).
A casino roulette wheel with its area divided by the number of answers where each answer shares an area proportionate to its goodness is a good example of such a selection. The fifth step is to create a new generation of answers out of these pairs of answers through the crossover process (Crossover). Crossover process stands for combining two answers and creating two new answers similar to the fusion of two chromosomes, which results in the creation of two new chromosomes. In the sixth step, this new generation of answers gets mutated (Mutation). Mutation stands for altering one or part of the genes of a chromosome. This mutated population of the answer will go through the Evaluation, Parent Selection, Crossover and Mutation repeatedly until the goodness of answers stop improving compared to previous generations. A plot of the average goodness of answers of generations over the number of generations shows a saturation at this point (Figure 1).

4. Optimization Performance by Genetic Algorithm

Considering the dimensions of the problem, the adaptation of GA is performed as follows. The work target is set up by limiting the total expenses produced when client requirements for the charging station. The total expenses considered in this work incorporate the cost for clients caused when they travel the path to the charging station (C1), the expense of the power consumed while in transit to the goal charging station (C2) and the cost of controlling the populace caused by producing the power sought after (C3). It is possible to describe these with Equation (1):
C 1 = A × i = 1 n [ ( x a i ) 2 + ( y b i ) 2 ] 1 / 2 C 2 = G × P × i = 1 n [ ( x a i ) 2 + ( y b i ) 2 ] 1 / 2 C 3 = R × P × i = 1 n [ ( x a i ) 2 + ( y b i ) 2 ] 1 / 2
The total expenses C consists of the sum of costs (Equation (2)):
C = [ A + ( G + R ) P ] i = 1 n [ ( x a i ) 2 + ( y b i ) 2 ] 1 / 2 = C 1 + C 2 + C 3
where A is the average cost per kilometre for the user (Euro/km), G is cost of electricity generated per kWh (Euro/kWh), R is the cost of contamination controlling for production of kWh (Euro/kWh) and P is the power utilization of an EV for every kilometre (kWh/km). x and y are the charging stations coordinate and ai and bi are the settlements coordinate [29].

Objective Function Optimizer

The goal of the algorithm is to minimize the total charging cost. Since A, G, R and P are constants, minimization of the total cost equals the minimization of summation of distances between settlements and charging stations. In this work, settlements and charging stations are indicated by their longitudes and latitudes and the distances between them are calculated by Haversine formula [30] rather than [ ( x a i ) 2 + ( y b i ) 2 ] 1 / 2 , as shown in Equation (3):
a = s i n 2 ( ( ϕ 2 ϕ 1 ) / 2 ) + cos ϕ 1 cos ϕ 2 s i n 2 ( ( λ 2 λ 1 ) / 2 ) c = 2 A t a n 2 ( a , 1 a ) D = R · c
where D is the summation of distances between settlements and the closest charging station, φ is latitude, λ is longitude, and R is earth’s radius (mean radius = 6371 km). Angles must be in radian scale to verify trig functions. Therefore, the objective function in this work is formulated in Equation (4):
D = i R × 2 A t a n 2 ( a , 1 a )
Settlements are places where EVs settle down most of the time. Parking lots, and important and popular destinations are some examples of these places. Determination of number and distribution of settlements is beyond the scope of this work and a subject of transportation and urban planning studies. Three different modes have been examined:
  • Mode 2: It is a slow charging mode applied by a household type socket-outlet with an inner cable protection component in AC.
  • Mode 3: It is a medium to fast speed charging mode utilizing a specific EV socket-outlet with control and protection function installed in AC.
  • Mode 4: It is an ultra-fast charging mode with an external charger in DC.
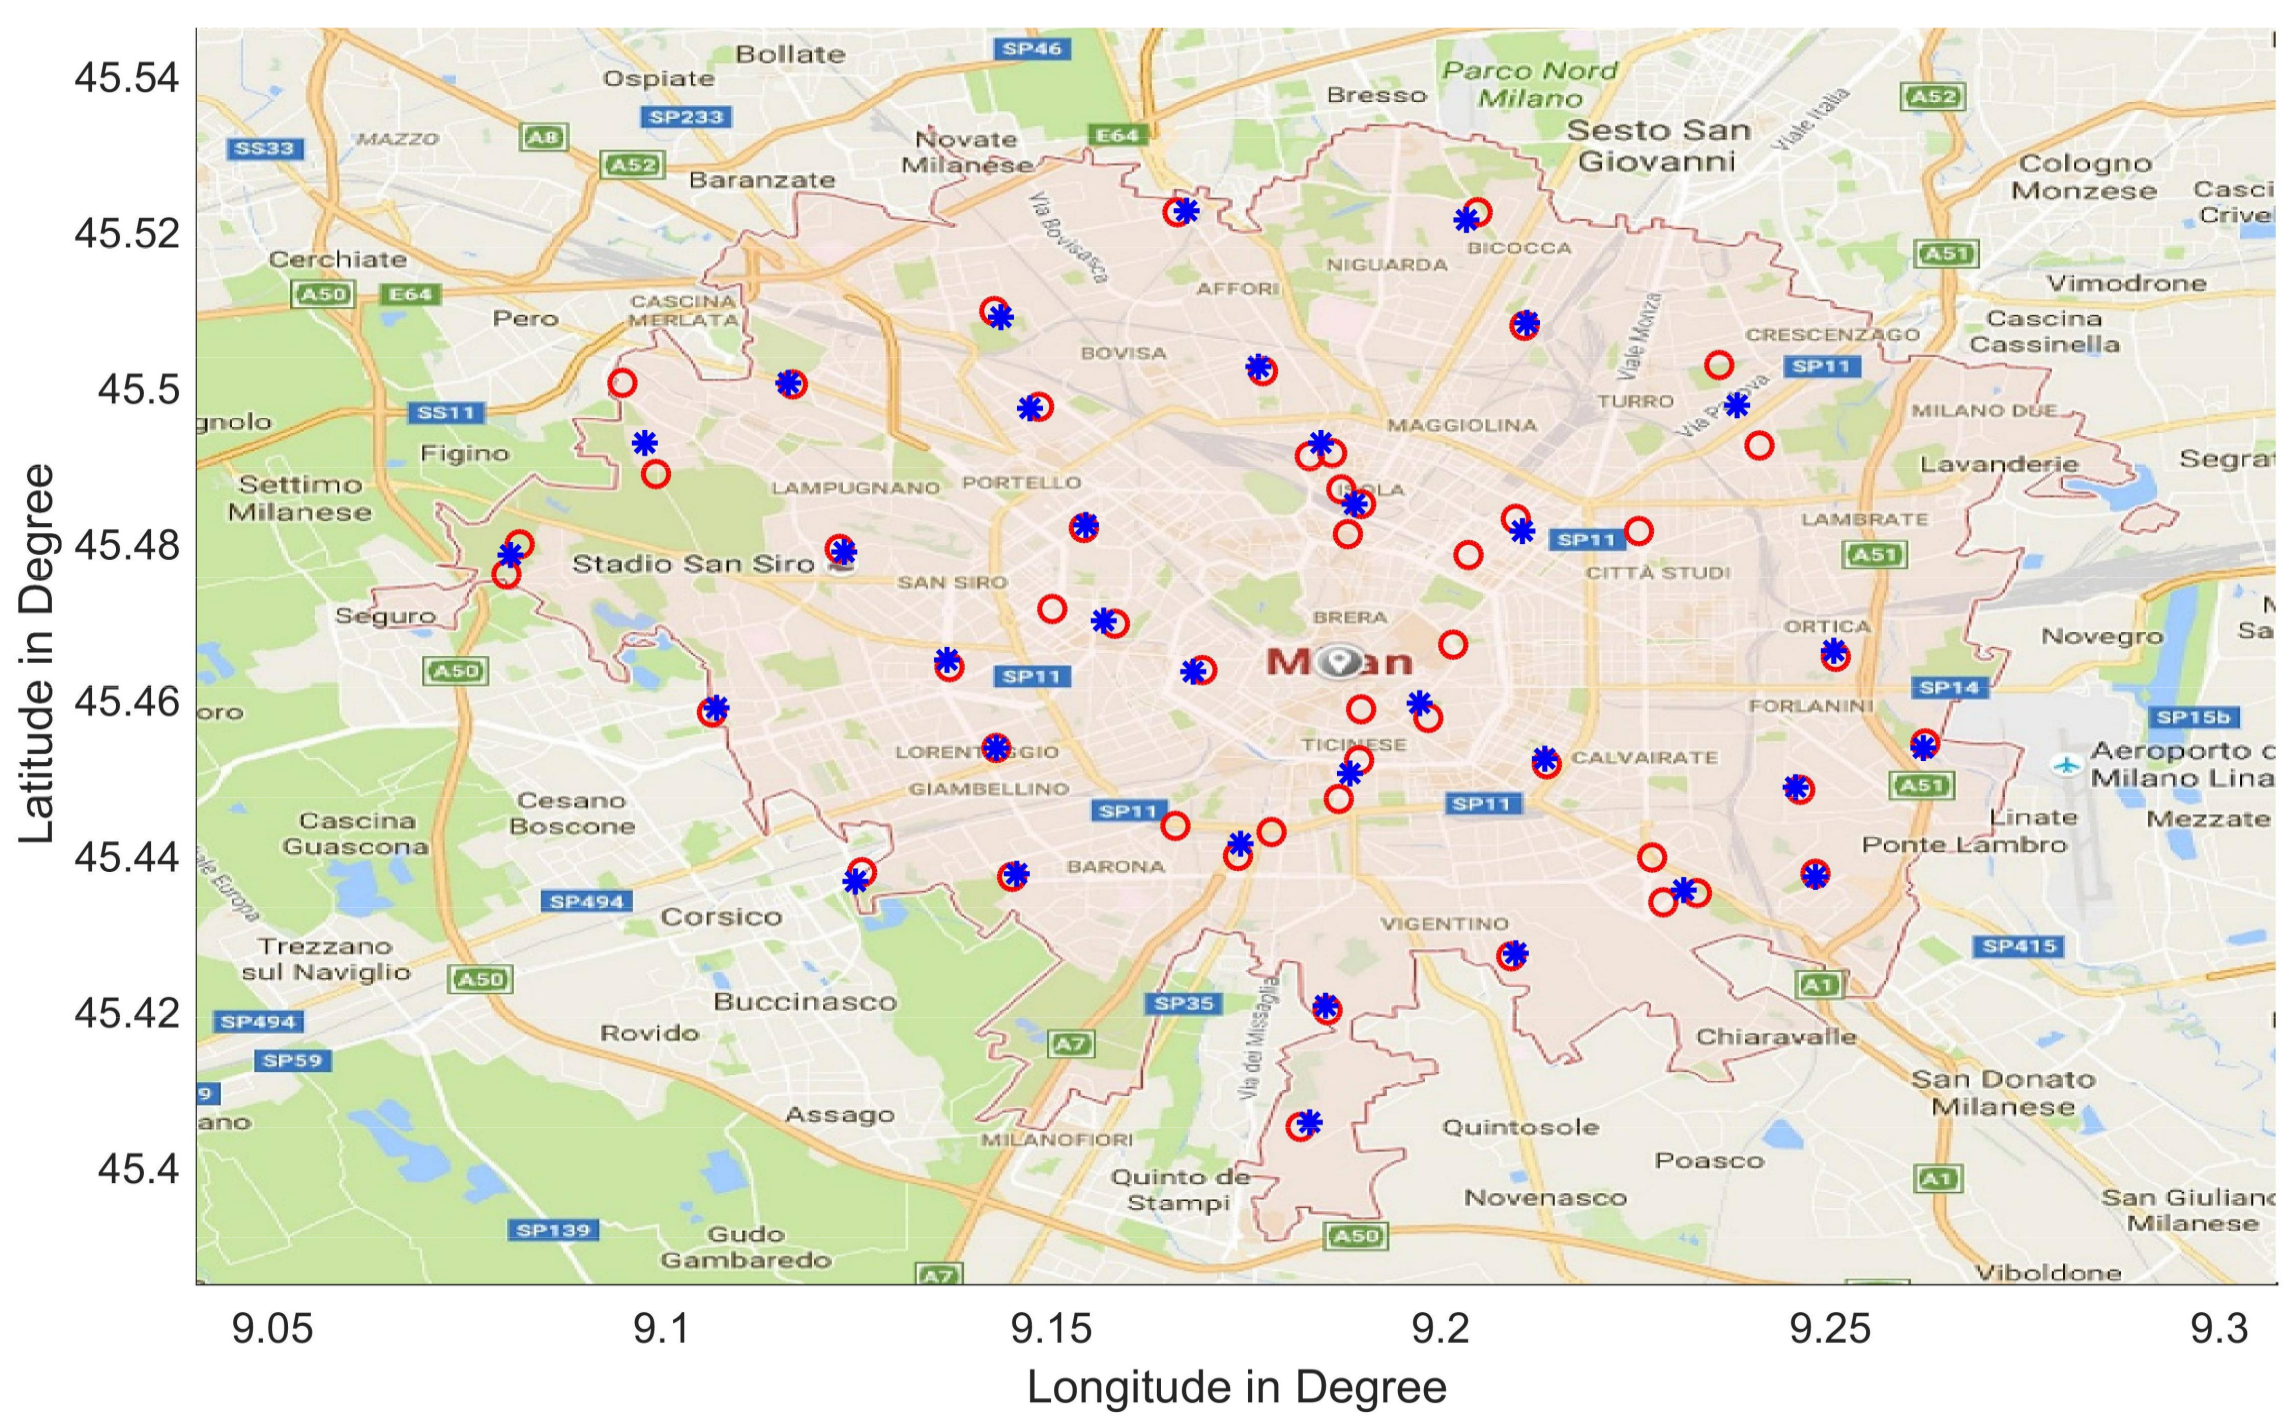
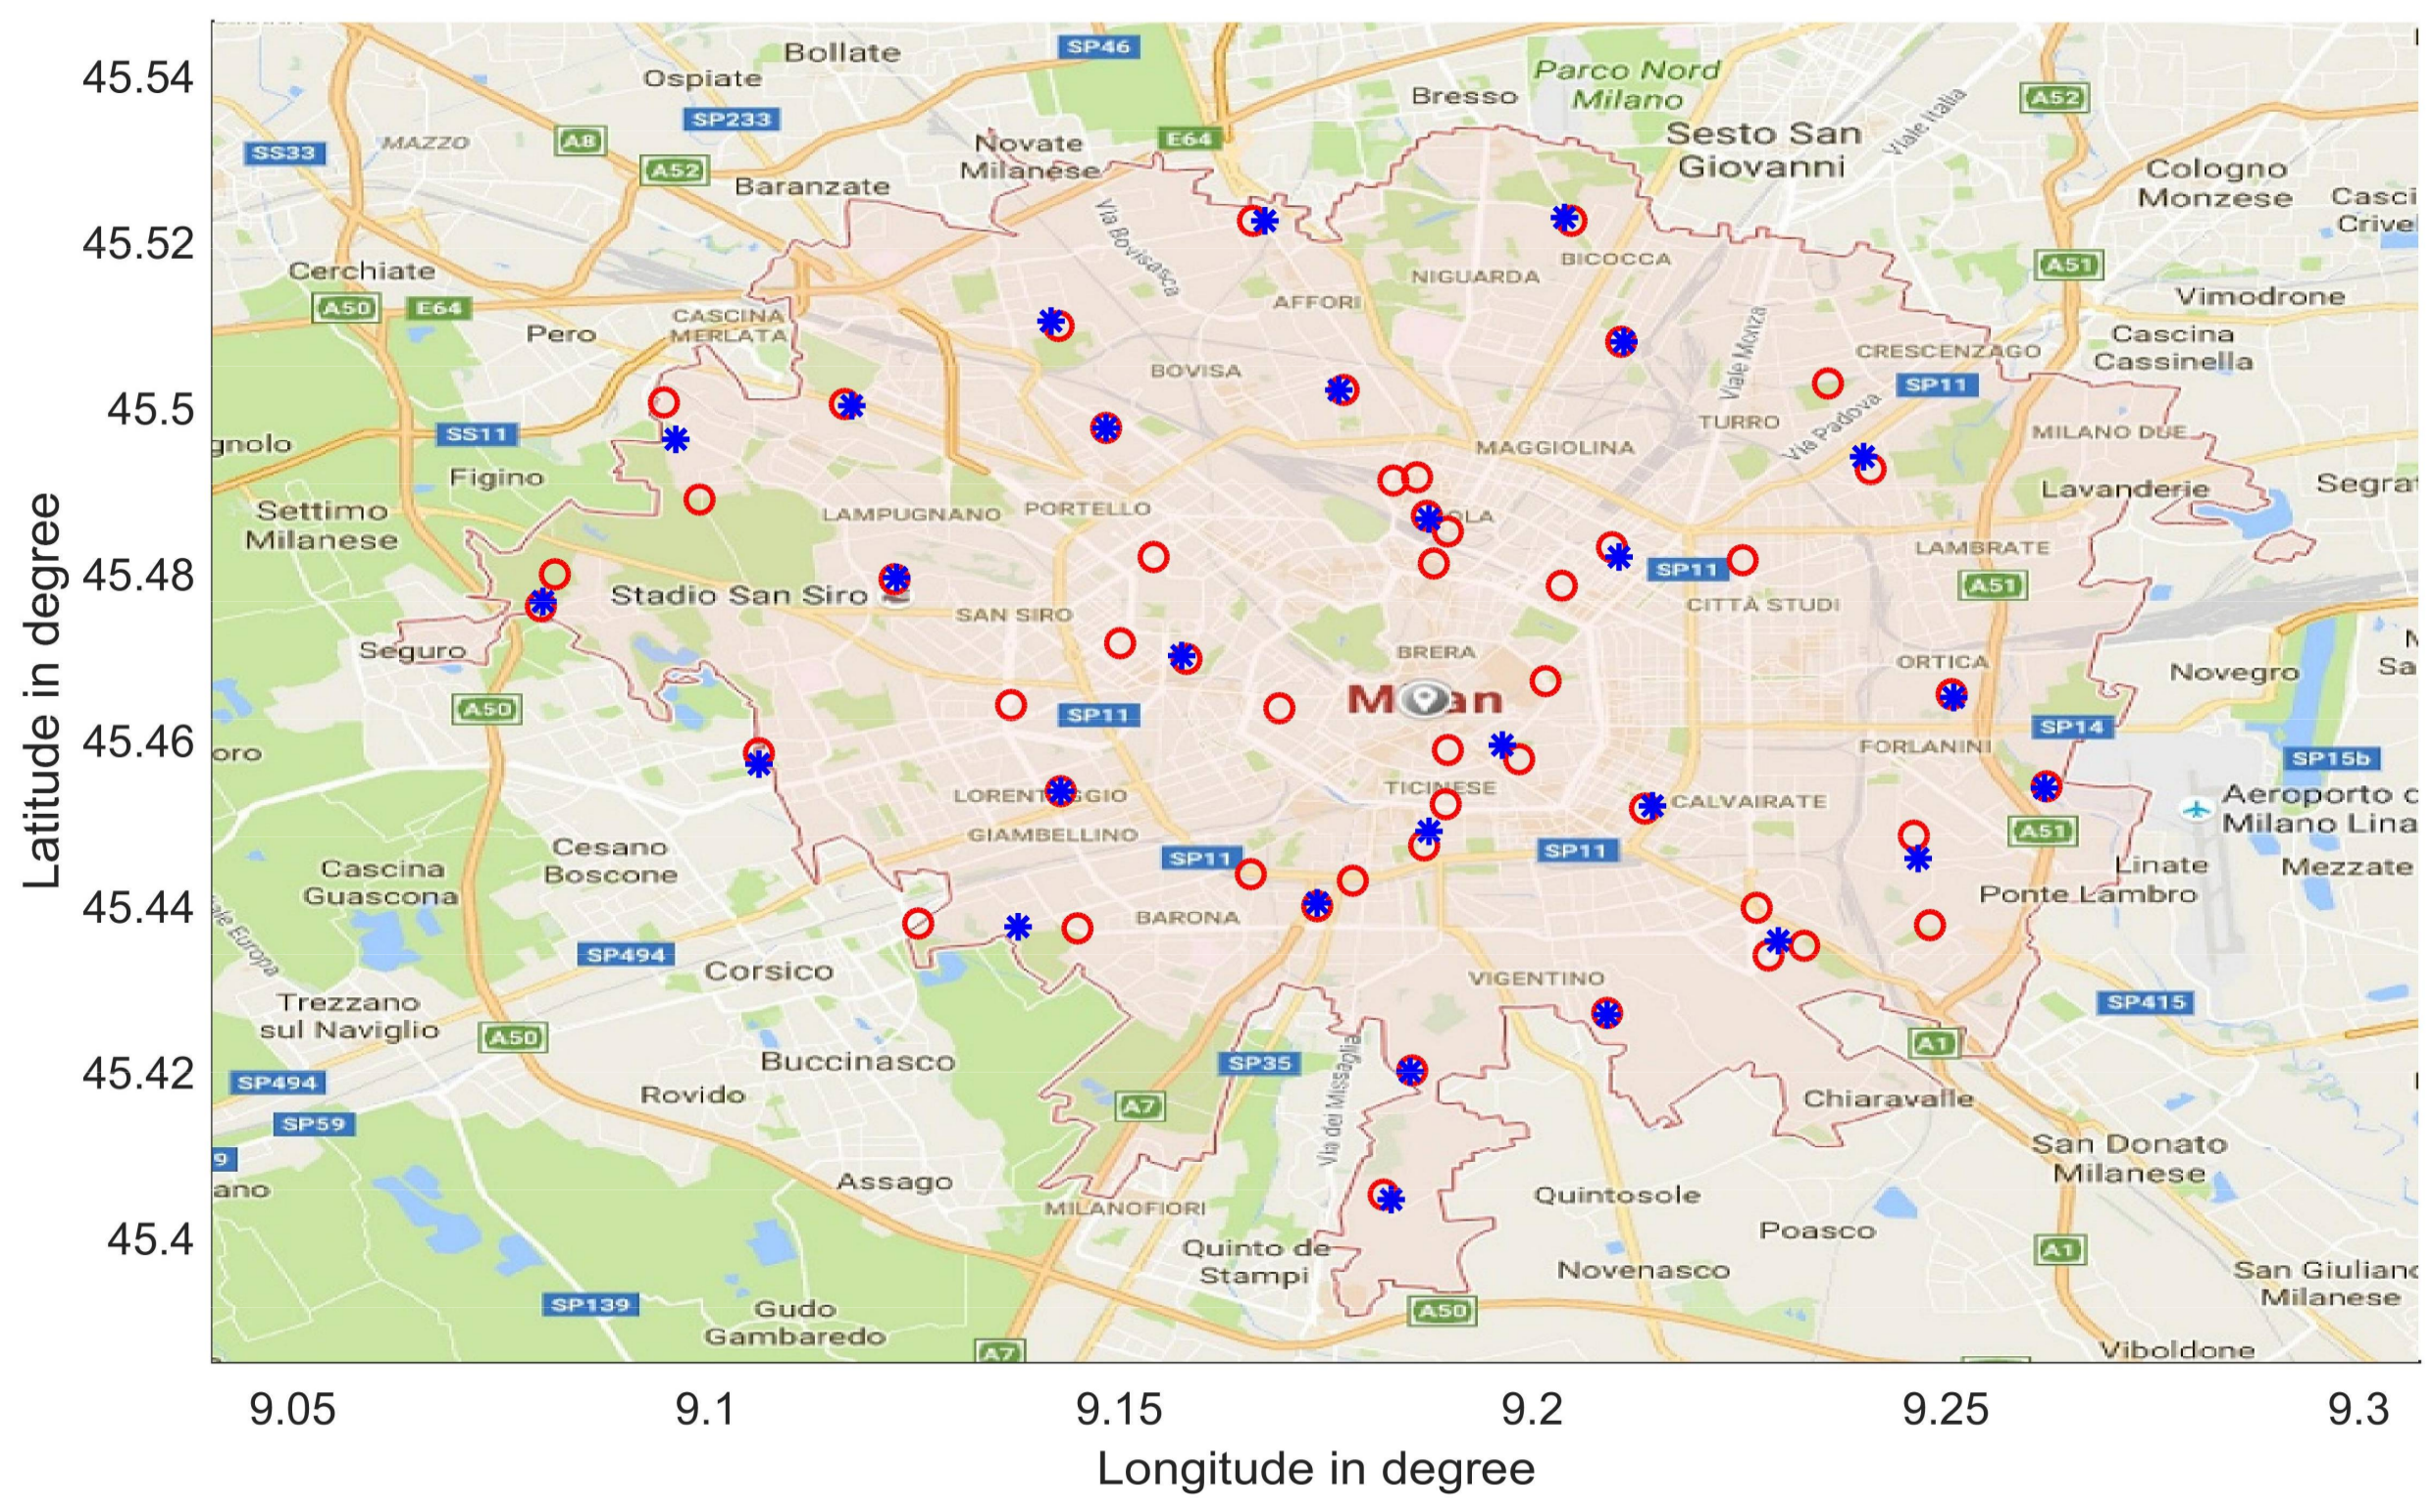
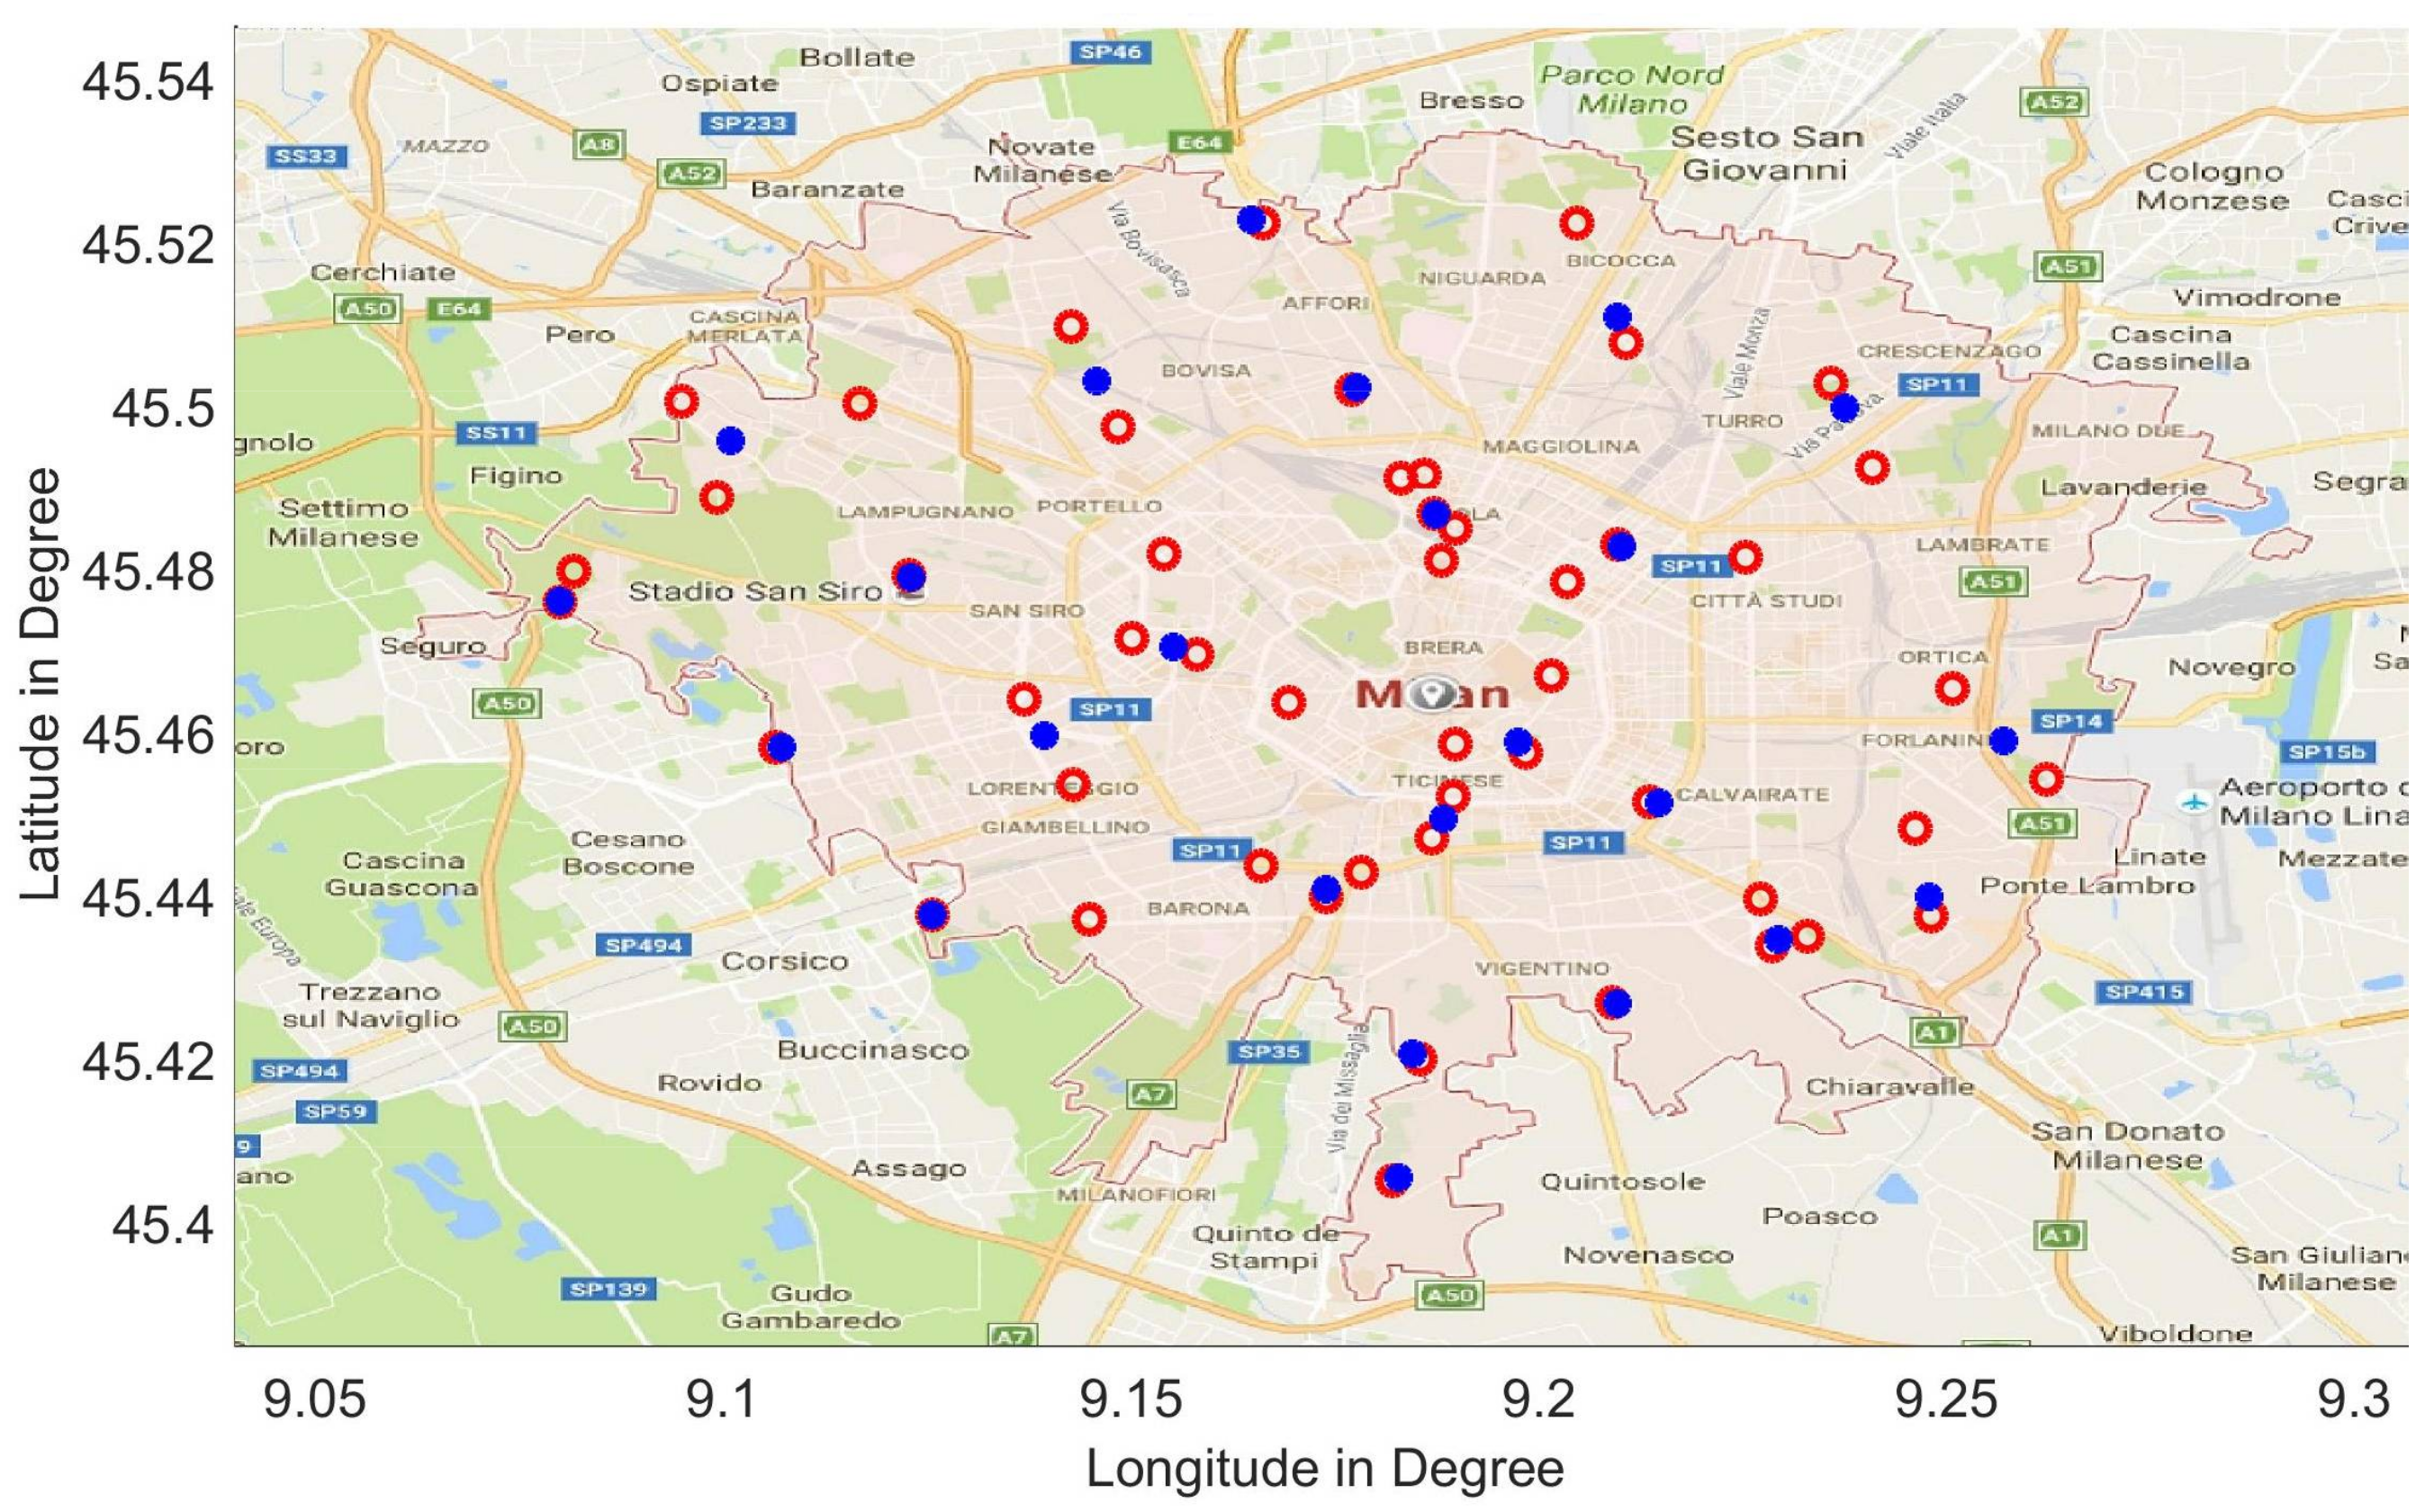
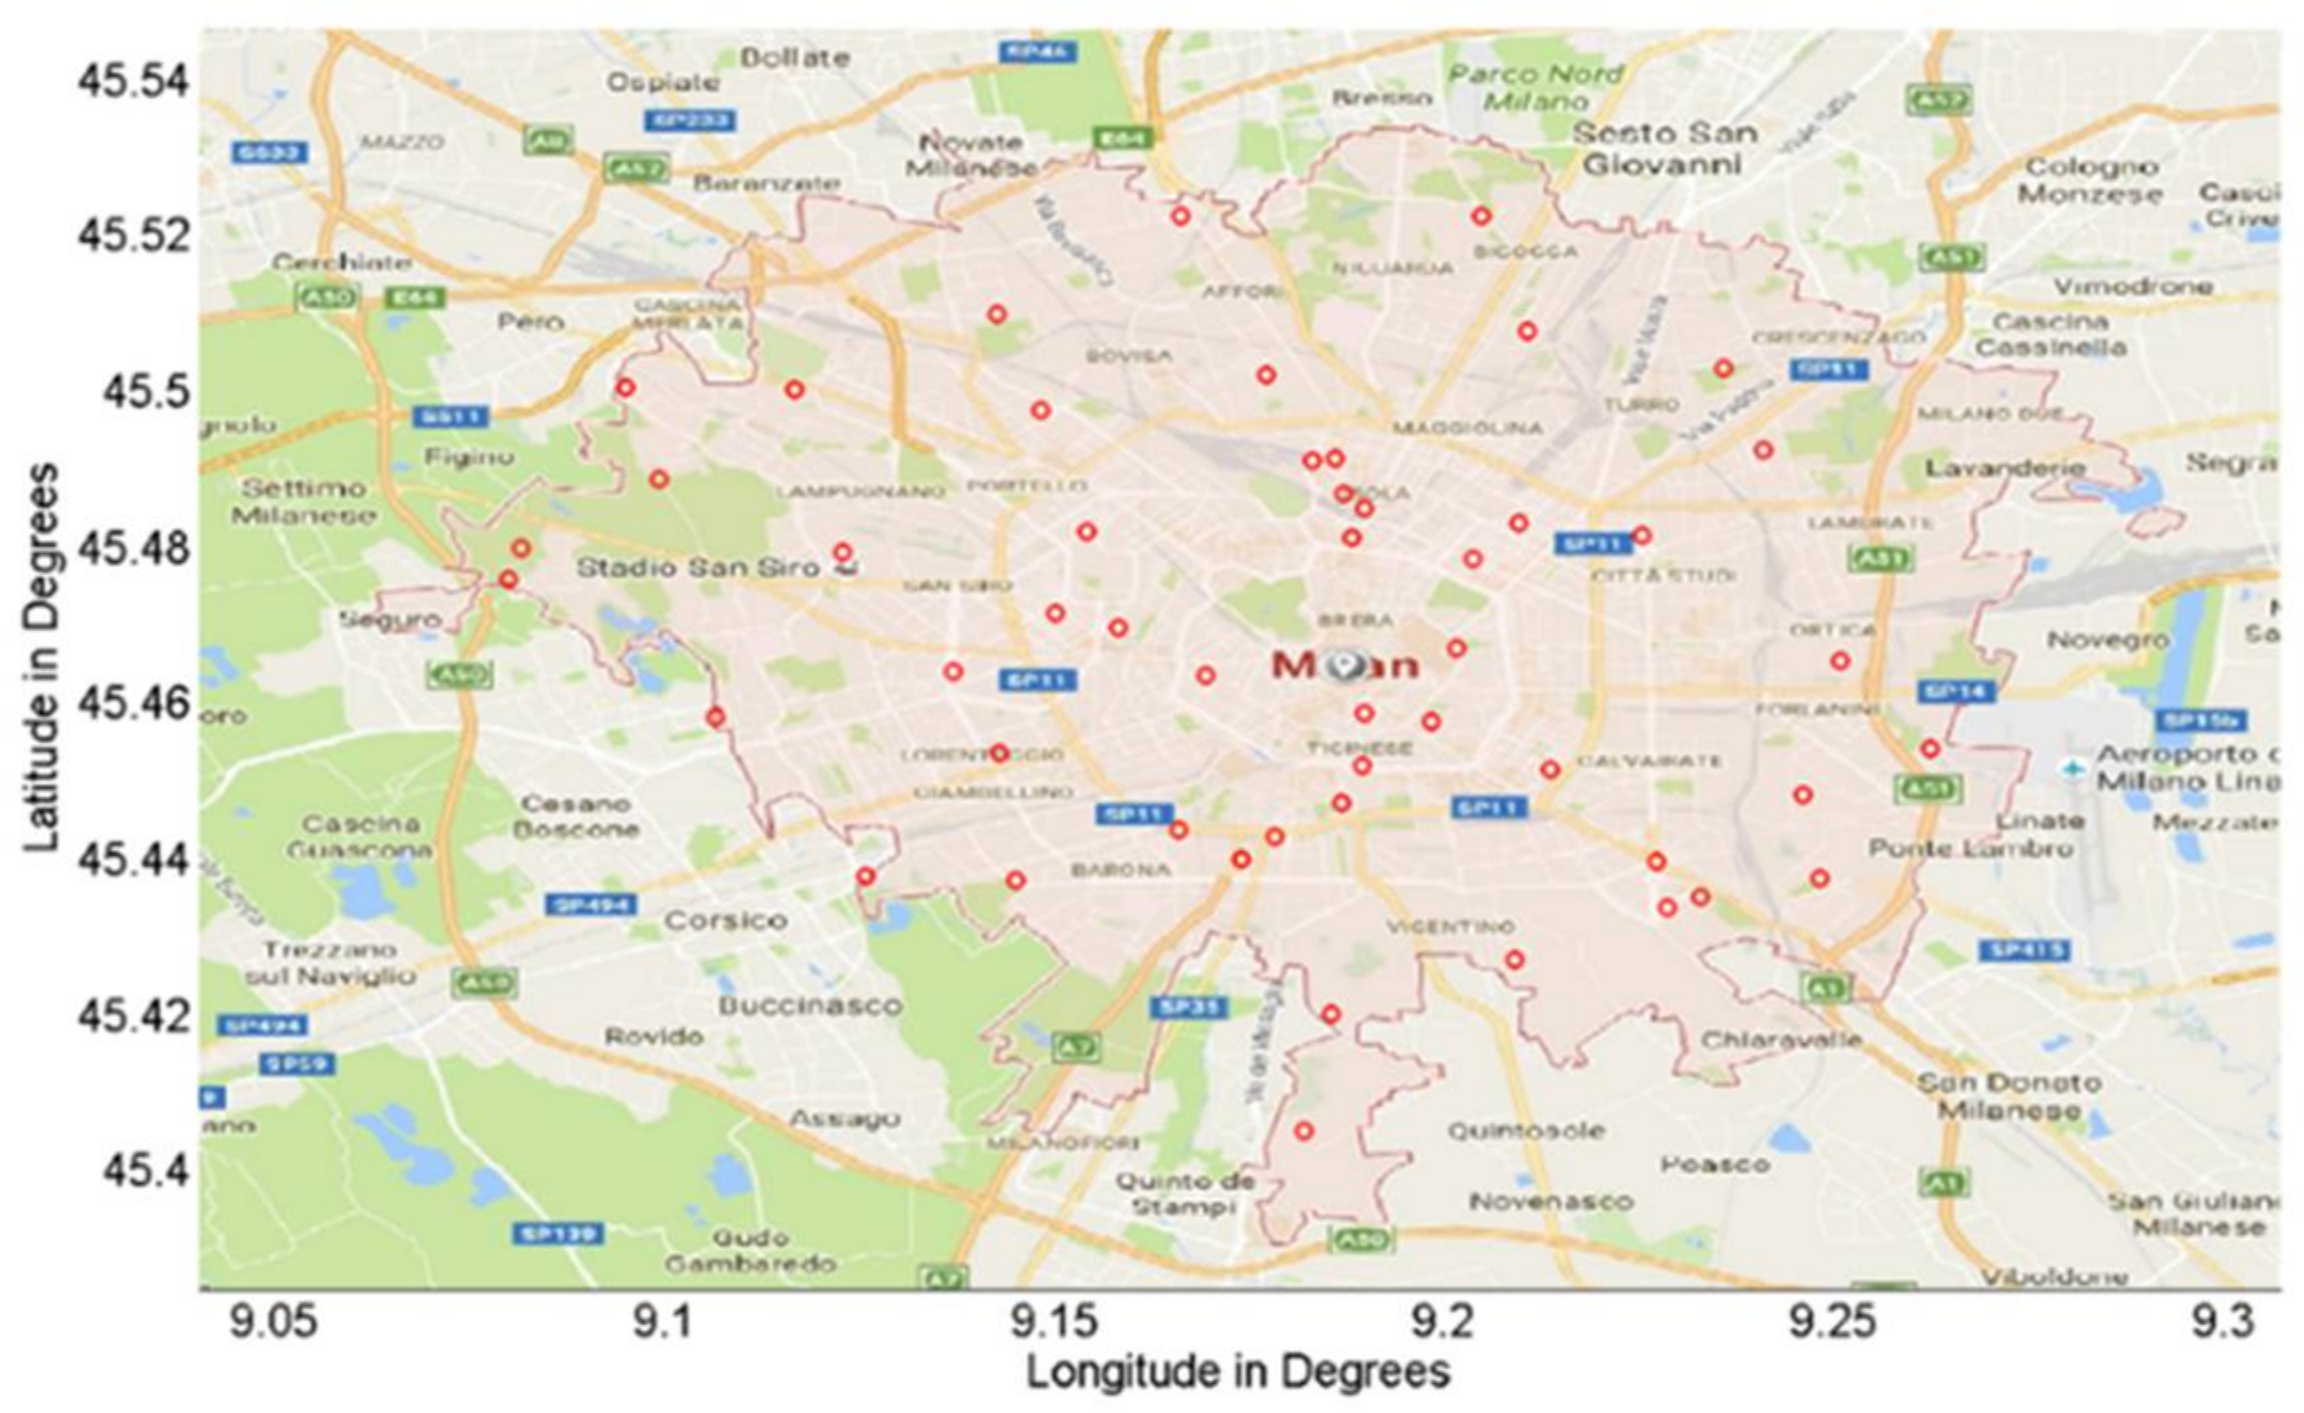
5. Case Study

In this study, the number of settlements is considered to be 50. Selection of a different number of settlements is simply possible without imposing any limitation or contradiction to any other step of this methodology. The resolution of point selection on the map is 5.6 m. In other words, the maximum distance between two adjacent pixels on the image file of the Milan map used in this work is less than or equal to 5.6 m. A black and white map of Milan is created with the same resolution and is used to check if a randomly selected point is inside the city of Milan. Selecting random points inside the Milan city is necessary during the algorithm performance.
Bass model [29] is used to estimate the number of Electric Vehicles. Bass model is identified in Equation (5):
N ( t ) = M 1 e ( p + q ) t 1 + q p e ( p + q ) t
where N(t) is the number of EVs and t is the time counted by the year. p, q and M are the parameters of the model to be found by curve fitting. To apply a curve fitting, a record of EVs in Milan is required as a real data reference. Previous records of the number of EVs for 2008–2012 reported in [31] are used for this aim. The prediction model parameters M (872), p (0.431) and q (0.253) are calculated by fitting the Bass model to the real data (Figure 2). The model is finally used to estimate the number of EVs in 2024.
Calculation of the number of charging stations is mainly dependent on the number of EVs in the city that is estimated as explained. Other determinant factors are charge cycles per day for an EV, power of charging stations, average charging time and average travel distance for a typical EV. Number of required charging stations is calculated based on Equation (6):
Q s = μ s W P s T s
where Q s is the charging stations’ quantity, W is acquired electric vehicles’ power consumption per day, µs is a balancing factor for the charging stations, Ps is the charging station’s power, and T s is the required average time for recharging. W is calculated as shown in Equation (7):
W = P a v   N ( t )   N a v
where P a v is the electric vehicles’ average power consumption, N ( t ) is the number of electric vehicles which are estimated for the given time and area and N a v is the average number of charge cycles in a day. P a v is calculated as indicated in Equation (8):
P a v = p × r
where p is an electric vehicles’ power consumption, and r is the average distance that client travels per day. According to the number of settlements, which we considered 50, as mentioned before, these numbers can be placed randomly, as shown in Figure 3. These 50 settlements are utilized hereafter for all the three modes. However, the selection of any number of settlements is feasibly flexible.
In Mode 2 with the favour of charging station power, which equals to 22 kW, the number of charging stations is calculated to be 34. After 967 optimization iterations, the algorithm reaches an optimal distance around 14 km, as depicted in Figure 4, which means the summation of distances between settlements and the closest charging station optimized from more than 55 km to 14 km. The map of optimal charging stations placement and settlements is depicted in Figure 5.
According to charging station power in Mode 3, which is considered 43 kW in this examination, the number of charging stations is calculated to be 28. In this mode, optimization of placement of the charging stations lasts for 1133 iterations and gives an optimal summation distance result of 20.76 km. Figure 6 and Figure 7 illustrate optimization algorithm convergence and the optimal placements of CSs in this mode, respectively.
Since Mode 4 charging station has a high level of power equal to 120 kW, the number of charging stations decreased to 24. In this part, optimization has been finalized after 689 iterations, as demonstrated in Figure 8. As desired, Mode 4 gave a better distance compared to the other two modes, that is 26.83 km. The optimal location map of CSs for this mode is described in Figure 9.

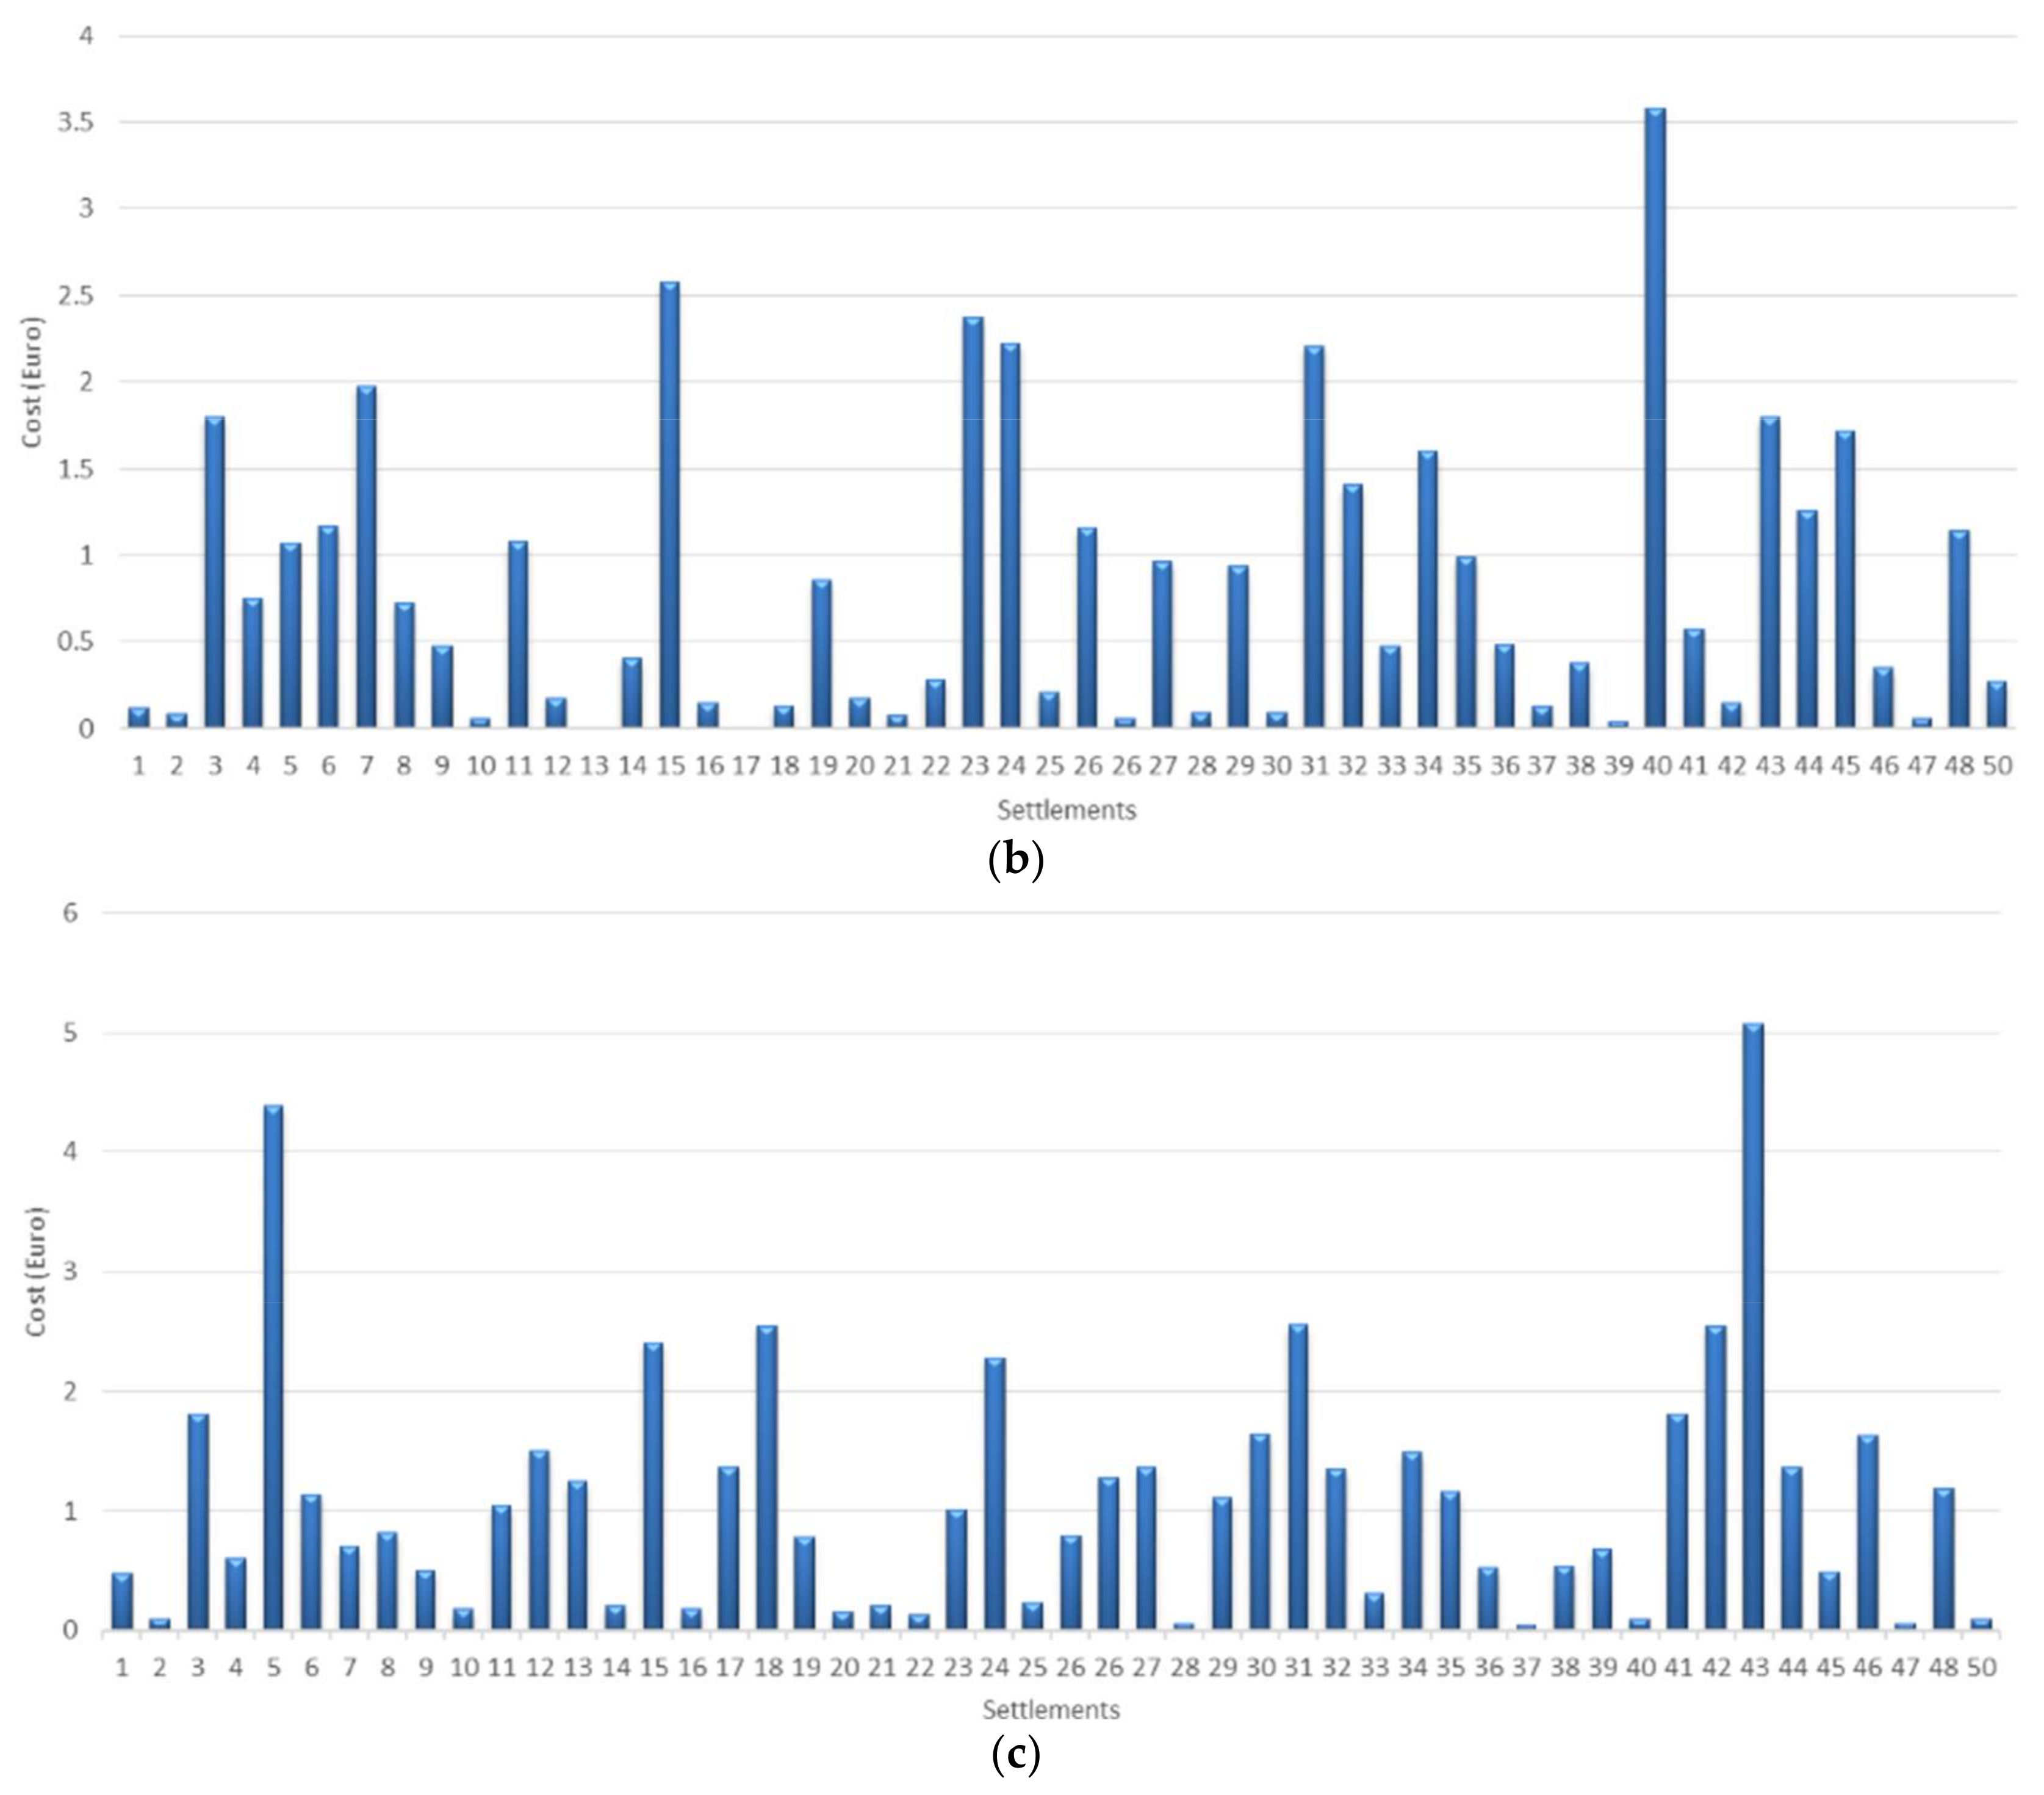
6. Distance and Costs Obtained in Different Modes

For these three modes, Figure 10 represents the results of optimization in each mode where the latitude and longitude are represented in terms of degree and the closest optimized distance to charging station in terms of kilometre for 50 settlements.
The longest distance as marked in the figures as 1.732, 1.879 and 2.661 km for Modes 2, 3 and 4, respectively. It can be realized that the algorithm has properly optimized, and thus decreased, the density of charging stations in the planning region. A better, well-balanced and organized plot is seen in Mode 3, since it compromises appropriately with the planning area according to the number of charging stations compared to the other plots. However, in Mode 4, except for two points, the trend has good condition and the optimal distances are roughly under 1.5 km.
The recharge cost for an Electric Vehicle in each settlement in terms of Euro is shown in Figure 11. The aggregate amounts of recharging cost obtained in Mode 2, Mode 3 and Mode 4 are 31.30, 40.88 and 55.13, respectively. Due to lack of precise information on constants A , G , R and P , this calculation could have some variance. Thus, constant cost equals [ A + ( G + R ) P ] , which equals [1.85 + (0.25 + 0.1)0.16] giving 1.906 (Euro/Km). Therefore, recharge cost for an EV in the settlement equals distance multiplied by [ A + ( G + R ) P ] .
Considering these recharge cost figures in addition to its aggregate amounts, it is worth mentioning that, although the electric power had a remarkable growth of around six-fold from Mode 2 to Mode 4, the total recharge cost experienced less than doubled. Therefore, in terms of efficiency, Mode 4 could be the effective choice in comparison to Mode 2 for EV industries.

7. Conclusions

This study is proposed due to the great importance of charging stations (CS) infrastructure. The optimal method used performs as a flexible tool for planning the CSs besides the simplicity of implementing the method in each dimension. In comparison to other methods in this planning field, it is more flexible whenever there is need to add or subtract any number of CS. This method is implemented in three different modes. It should be noted however that the model is idealized. Many factors should be considered in the actual process of the location of charging station, such as physical geographical condition and topography of the planning area. Finally, a summary of the three above-mentioned modes of operation is given. It is worth noting that, when CS power increases, the number of CSs decrease. It must be a trade-off between the power and the number of CSs. As the power grows higher, electric vehicles can be powered for more traveling distance. However, the structure and production cost increases proportionally. This research contributes to give the EVs clients assurance in decreasing the costs for using EVs and make them confident about social problems such as social acceptance and insufficient charging stations by locating the adequate number of CSs in the fittest coordinate. However, there is still a significant limitation for EV industries to deal with: a limited-range of travel distance within a charge. This problem comes from the battery technology; although there is striking development in this technology, it is still not enough to satisfy the clients in this context. As a prospective research, a good and effective therapy for this problem could be Inductive Charging for EVs. Although it is now under investigation, still more attention is going to this field due to its importance in the next future, causing an improvement of EV charging stations. A future work will be to reduce the time of the simulation. This aspect is fundamental, especially when considering the high number of charging stations optimization (for example, more than 200). Currently, the algorithm gives an answer, but it takes a long time. For this reason, this aspect will be considered as a possible improvement of this work.

Author Contributions

Authors contributed equally to this work.

Conflicts of Interest

The authors declare no conflict of interest.

Nomenclature

CSCharging Stations
EVElectric Vehicle
GAGenetic Algorithm
ICEInternal Combustion Engine
C1the cost for clients caused within traveling the path
C2the cost of the power consumed within the path
C3the cost of controlling the populace
Ctotal costs
A the average constant cost per kilometre for the clients
G the constant cost of electricity generating per kWh
Rthe constant cost of contamination controlling for production of kWh
Pthe power utilization of an EV for every kilometre
x , y the charging stations coordinate
a i , b i the settlements coordinate
φlatitude
λlongitude
Rearth’s radius
Dthe summation of distances between settlements and the closest charging station
N(t)estimated number of electric vehicles
Q s calculated number of charging stations
Wthe acquired electric vehicles’ power consumption per day
µsthe balancing factor
Psthe charging station’s power
T s the required average time for recharging
P a v the electric vehicle’s average power consumption
N a v the average number of charge cycles in a day
p an electric vehicle’s power consumption
r the average distance that client travels per day

References

  1. Jayakumar, A.; Chalmers, A.; Lie, T.T. Review of prospects for adoption of fuel cell electric vehicles in New Zealand. IET Electr. Syst. Transp. 2017, 7, 259–266. [Google Scholar] [CrossRef]
  2. Un-Noor, F.; Padmanaban, S.; Mihet-Popa, L.; Nurunnabi Mollah, M.; Hossain, E. A comprehensive study of key electric vehicle (EV) components, technologies, challenges, impacts, and future direction of development. Energies 2017, 10, 1217. [Google Scholar] [CrossRef]
  3. Wang, G.; Xu, Z.; Wen, F.; Wong, K.P. Traffic-constrained multiobjective planning of electric-vehicle charging stations. IEEE Trans. Power Deliv. 2013, 28, 2363–2372. [Google Scholar] [CrossRef]
  4. Hajimiragha, A.; Caizares, C.A.; Fowler, M.W.; Elkamel, A. Optimal transition to plug-in hybrid electric vehicles in Ontario, Canada, considering the electricity-grid limitations. IEEE Trans. Ind. Electron. 2010, 57, 690–701. [Google Scholar] [CrossRef]
  5. Lam, A.Y.; Leung, Y.-W.; Chu, X. Electric vehicle charging station placement: Formulation, complexity, and solutions. IEEE Trans. Smart Grid 2014, 5, 2846–2856. [Google Scholar] [CrossRef]
  6. Liu, Z.; Wen, F.; Ledwich, G. Optimal planning of electric-vehicle charging stations in distribution systems. IEEE Trans. Power Deliv. 2013, 28, 102–110. [Google Scholar] [CrossRef]
  7. Sadeghi-Barzani, P.; Rajabi-Ghahnavieh, A.; Kazemi-Karegar, H. Optimal fast charging station placing and sizing. Appl. Energy 2014, 125, 289–299. [Google Scholar] [CrossRef]
  8. Hanabusa, H.; Horiguchi, R. A study of the analytical method for the location planning of charging stations for electric vehicles. In Proceedings of the International Conference on Knowledge-Based and Intelligent Information and Engineering Systems, Kaiserslautern, Germany, 12–14 September 2011. [Google Scholar]
  9. Jia, L.; Hu, Z.; Song, Y.; Luo, Z. Optimal siting and sizing of electric vehicle charging stations. In Proceedings of the 2012 IEEE International Electric Vehicle Conference (IEVC), Greenville, SC, USA, 4–8 March 2012. [Google Scholar]
  10. Mehar, S.; Senouci, S.M. An optimization location scheme for electric charging stations. In Proceedings of the 2013 International Conference on Smart Communications in Network Technologies (SaCoNeT), Paris, France, 17–19 June 2013. [Google Scholar]
  11. Pazouki, S.; Mohsenzadeh, A.; Haghifam, M.-R.; Ardalan, S. Simultaneous allocation of charging stations and capacitors in distribution networks improving voltage and power loss. Can. J. Electr. Comput. Eng. 2015, 38, 100–105. [Google Scholar] [CrossRef]
  12. Iversen, E.B.; Morales, J.M.; Madsen, H. Optimal charging of an electric vehicle using a Markov decision process. Appl. Energy 2014, 123, 1–12. [Google Scholar] [CrossRef]
  13. Dong, J.; Liu, C.; Lin, Z. Charging infrastructure planning for promoting battery electric vehicles: An activity-based approach using multiday travel data. Transp. Res. Part C 2014, 38, 44–55. [Google Scholar] [CrossRef]
  14. Jaramillo, J.H.; Bhadury, J.; Batta, R. On the use of genetic algorithms to solve location problems. Comput. Oper. Res. 2002, 29, 761–779. [Google Scholar] [CrossRef]
  15. Barrero, R.; van Mierlo, J.; Tackoen, X. Energy saving in public transport. IEEE Veh. Technol. Mag. 2008, 3, 26–36. [Google Scholar] [CrossRef]
  16. Guo, F.; Liu, Q.; Liu, D.; Guo, Z. On Production and Green Transportation Coordination in a Sustainable Global Supply Chain. Sustainability 2017, 9, 2071. [Google Scholar] [CrossRef]
  17. International Electrotechnical Commission (IEC). 61851-1: Electric Vehicle Conductive Charging System-Part 1: General Requirements; IEC: Geneva, Switzerland, 2010. [Google Scholar]
  18. Veneri, O.; Ferraro, L.; Capasso, C.; Iannuzzi, D. Charging infrastructures for EV: Overview of technologies and issues. In Proceedings of the Electrical Systems for Aircraft, Railway and Ship Propulsion (ESARS), Bologna, Italy, 16–18 October 2012. [Google Scholar]
  19. Hõimoja, H.; Rufer, A. Infrastructure Issues Regarding the Ultrafast Charging of Electric Vehicles. In Proceedings of the International Advanced Mobility Forum. 2012. Available online: https://infoscience.epfl.ch/record/175699/files/Hoimoja%20Hardi%20_Infrastructure%20Issues_EPFL_IAMF2012.pdf (accessed on 19 March 2018).
  20. Goldberg, D.E. Genetic Algorithms in Search, Optimization and Machine Learning; Addison-Wesley Longman Publishing Co., Inc.: Boston, MA, USA, 1989; Volume xiii, pp. 2104–2116. [Google Scholar]
  21. Shao, Z.; Ma, Z.; Liu, S.; Lv, T. Optimization of a Traffic Control Scheme for a Post-Disaster Urban Road Network. Sustainability 2018, 10, 68. [Google Scholar] [CrossRef]
  22. Mayet, C.; Horrein, L.; Bouscayrol, A.; Delarue, P.; Verhille, J.-N.; Chattot, E.; Lemaire-Semail, B. Comparison of Different Models and Simulation Approaches for the Energetic Study of a Subway. IEEE Trans. Veh. Technol. 2014, 63, 556–565. [Google Scholar] [CrossRef]
  23. Oremland, M.; Laubenbacher, R. Optimization of Agent-Based Models: Scaling Methods and Heuristic Algorithms. J. Artif. Soc. Soc. Simul. 2014, 17, 1–6. [Google Scholar] [CrossRef]
  24. Hu, Y.; Song, X.; Cao, W.; Ji, B.; New, S.R. Drive With Integrated Charging Capacity for Plug-In Hybrid Electric Vehicles (PHEVs). IEEE Trans. Ind. Electron. 2014, 61, 5722–5731. [Google Scholar] [CrossRef]
  25. Bocharnikov, Y.V.; Tobias, A.M.; Roberts, C.S.; Hillmansen, S.; Goodman, C.J. Optimal driving strategy for traction energy saving on DC sub-urban railways. IET Electr. Power Appl. 2007, 1, 675–682. [Google Scholar] [CrossRef]
  26. Song, L.; Wang, J.; Yang, D. Optimal placement of electric vehicle charging stations based on Voronoi diagram. In Proceedings of the 2015 IEEE International Conference on Information and Automation, Lijiang, China, 8–10 August 2015. [Google Scholar]
  27. Riva Sanseverino, E.; Domenico Genco, V.; Scaccianoce, G.; Vaccaro, V.; Riva Sanseverino, R.; Zizzo, G.; Di Silvestre, M.L.; Arnone, D.; Paternò, G. Urban Energy Hubs and Microgrids: Smart Energy Planning for Cities. In From Smart Grids to Smart Cities: New Challenges in Optimizing Energy Grids; Wiley: Hoboken, NJ, USA, 2017; pp. 129–175. [Google Scholar]
  28. Di Silvestre, M.L.; Riva Sanseverino, E.; Zizzo, G.; Graditi, G. An optimization approach for efficient management of EV parking lots with batteries recharging facilities. J. Ambient Intell. Hum. Comput. 2013, 4, 641–649. [Google Scholar] [CrossRef]
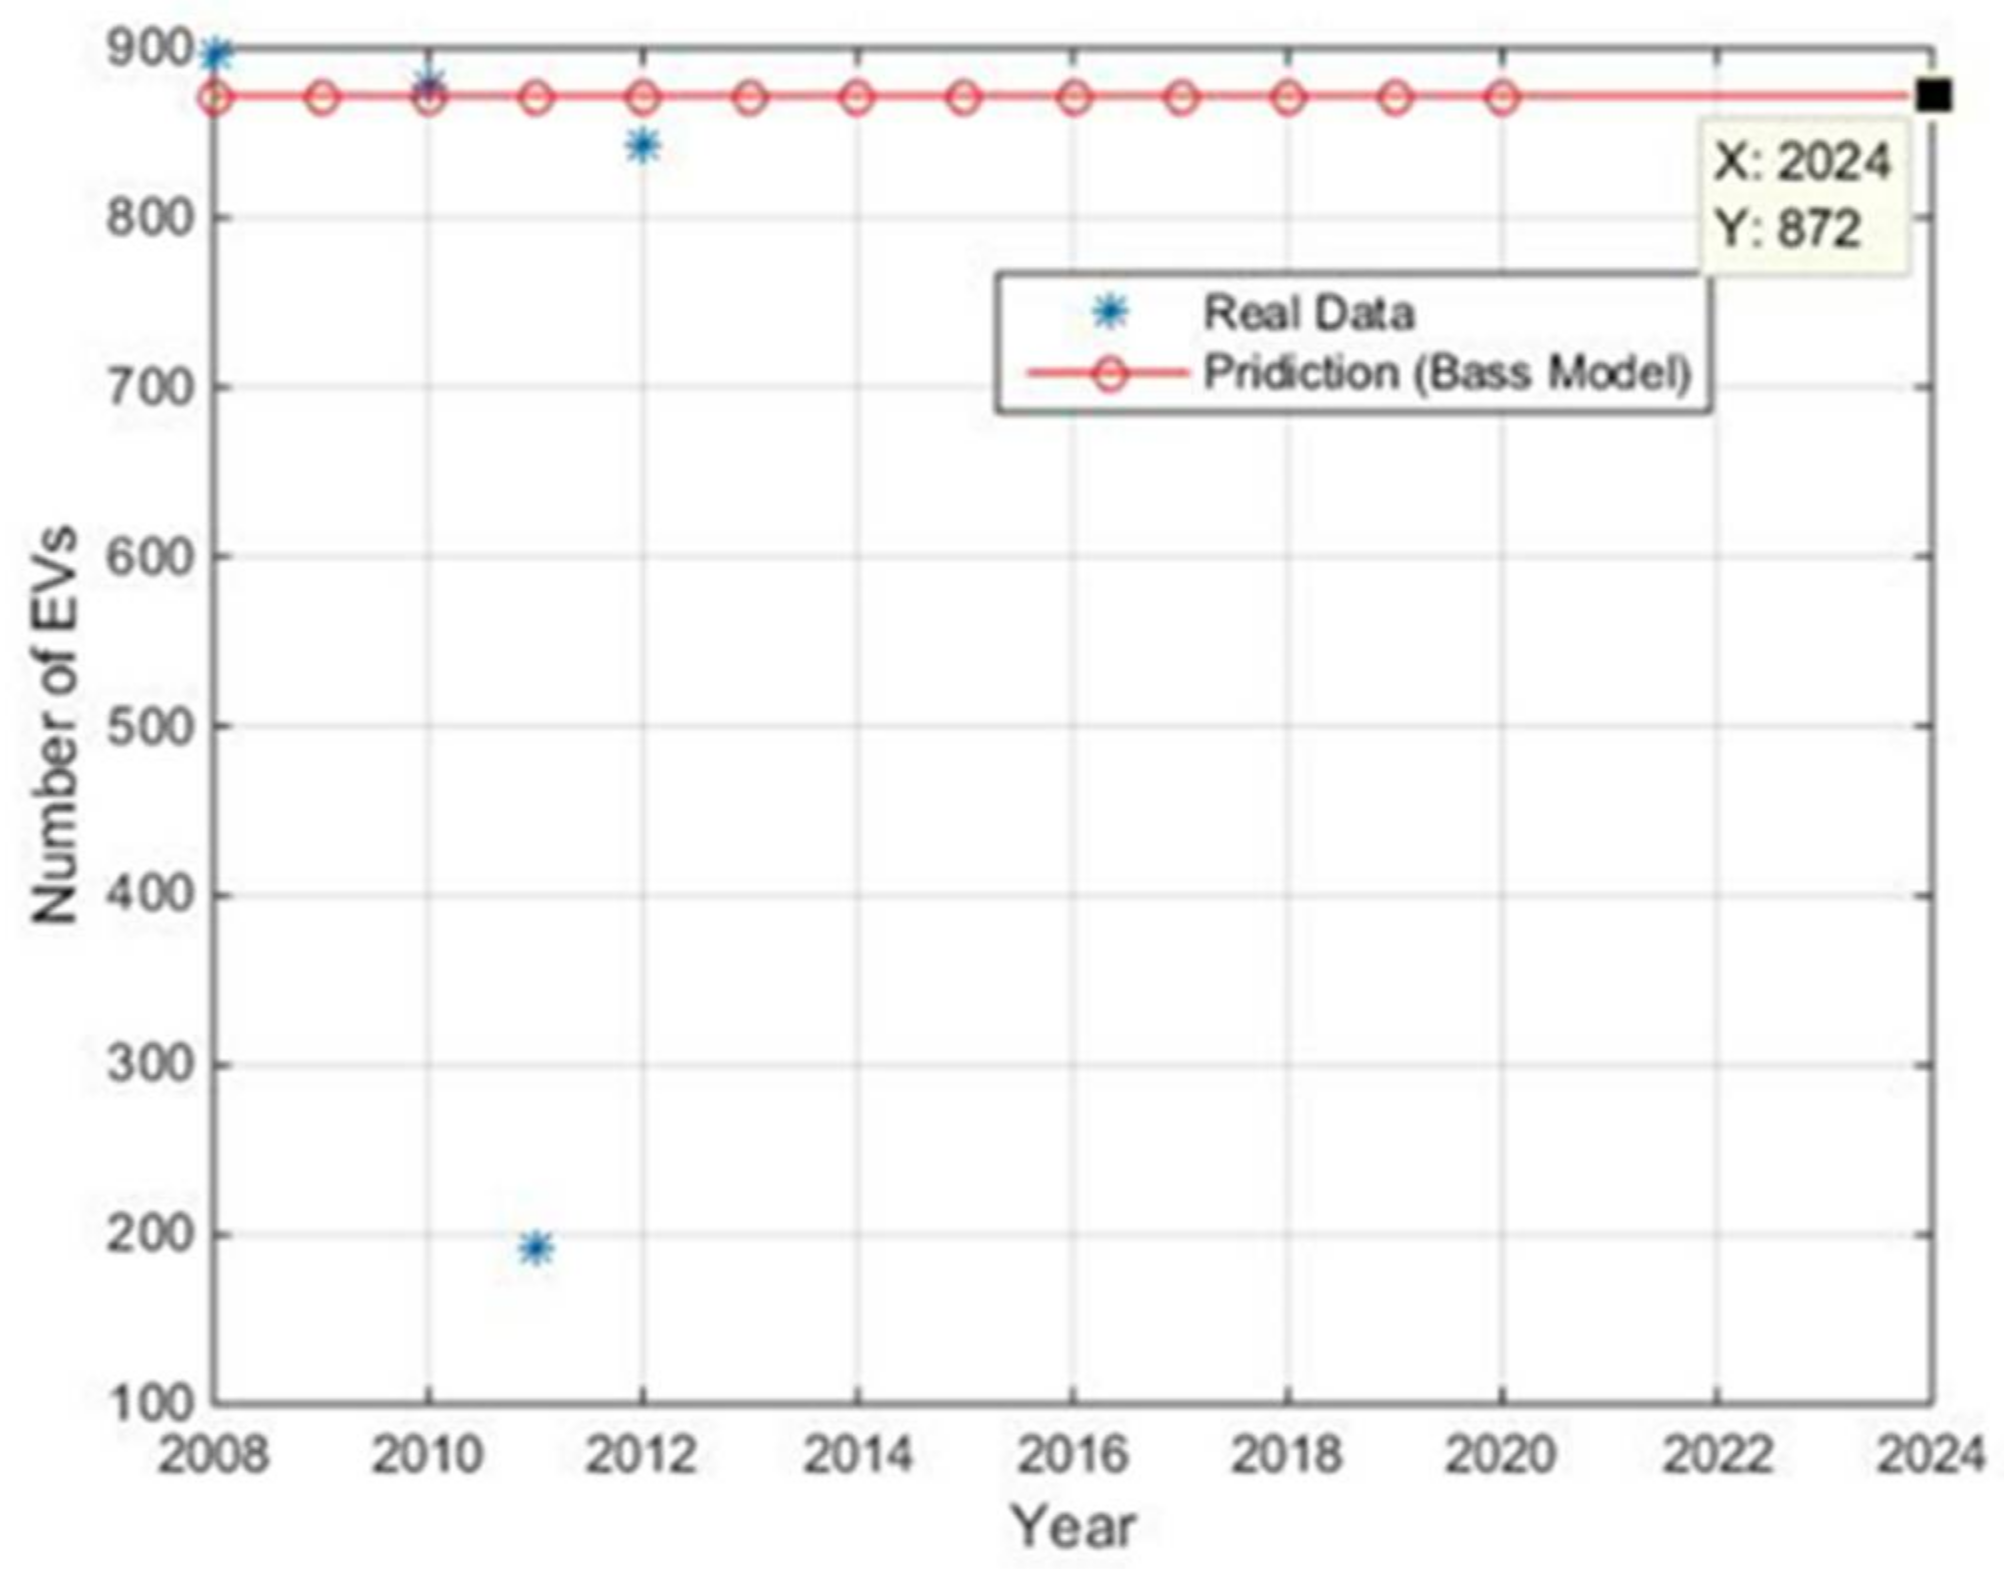
  29. Lilien, G.L.; Rangaswamy, A.; Bruyn, A. The Bass model: Marketing engineering technical note. In Principles of Marketing Engineering; DecisionPro, Inc.: State College, PA, USA, 2007. [Google Scholar]
  30. Marmaras, C.; Xydas, E.; Cipcigan, L.M. D4. 4 Report Scenario Modeling eBRIDGE: Empowering e-Fleets for Business and Private Purposes in Cities. September 2015. Available online: http://ebridge-project.eu/images/ebridge/docs/ebridge-d4-4-scenarios-modelling.pdf (accessed on 19 March 2018).
  31. Scripts, M.T. Calculate Distance, Bearing and More between Latitude/Longitude Points. 2013. Available online: http://www. movable-type.co.uk/scripts/latlong.html (accessed on 19 March 2018).
Figure 1. Flowchart of applied GA.
Sustainability 10 01076 g001
Figure 2. Number of EVs are estimated in 2024.
Sustainability 10 01076 g002
Figure 3. The 50 settlements placed randomly.
Sustainability 10 01076 g003
Figure 4. Convergence curve of the GA for Mode 2.
Sustainability 10 01076 g004
Figure 5. Final location of charging stations (*) and settlements (O) in Milan city in Mode 2.
Sustainability 10 01076 g005
Figure 6. Convergence curve of the GA for Mode 3.
Sustainability 10 01076 g006
Figure 7. Final location of charging stations (*) and settlements (O) in Milan city in Mode 3.
Sustainability 10 01076 g007
Figure 8. Convergence curve of the GA for Mode 4.
Sustainability 10 01076 g008
Figure 9. Final location of charging stations (*) and settlements (O) in Milan city in Mode 4.
Sustainability 10 01076 g009
Figure 10. Optimized distance from each settlement to closest charging station: (a) Mode 2; (b) Mode 3; and (c) Mode 4.
Sustainability 10 01076 g010aSustainability 10 01076 g010b
Figure 11. Recharge Cost of an EV in each Settlement in: (a) Mode 2; (b) Mode 3; and (c) Mode 4.
Sustainability 10 01076 g011aSustainability 10 01076 g011b
Table 1. IEC 61851-1 charging mode.
Charging ModeMax Current per PhaseCharging TimeVehicle Battery Charger
Mode 116 A4–8 hOn Board
Mode 232 A2–4 hOn Board
Mode 363 A1–2 hOn Board
Mode 4400 A DC5–30 minOff Board

